

Sample Category Title
Natural Gas Wave Analysis
- Natural gas under the bearish pressure
- Likely to fall to support level 3.630
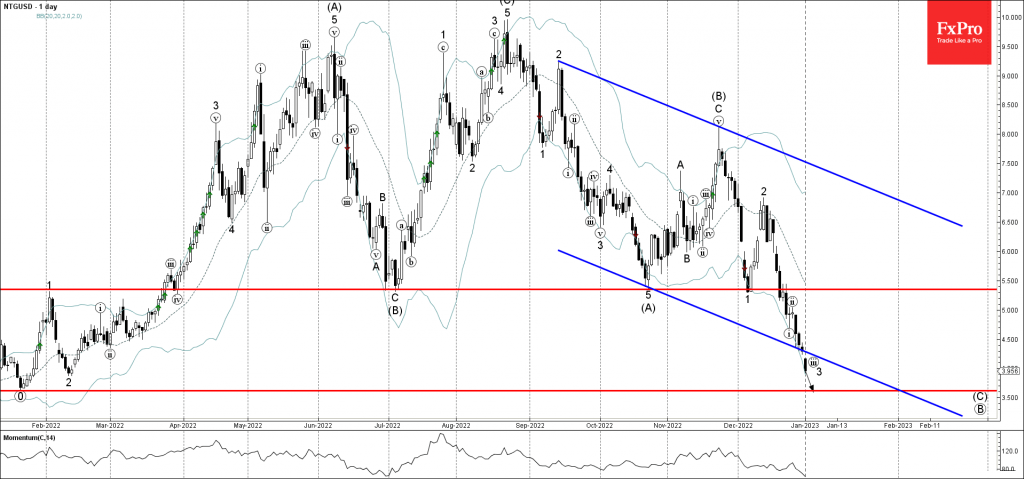
Natural gas under the bearish pressure after the earlier breakout of the support trendline of the wide down channel from the middle of September.
The breakout of this down channel accelerated the impulse wave 3 of the higher order intermediate impulse wave (C) from the end of November.
Given the clear daily downtrend, Natural gas can be expected to fall further toward the next support level 3.630 (previous strong support from December of 2021 and January of 2022).
CHFJPY Wave Analysis
- CHFJPY broke support level 141.00
- Likely to fall to support level 138.00
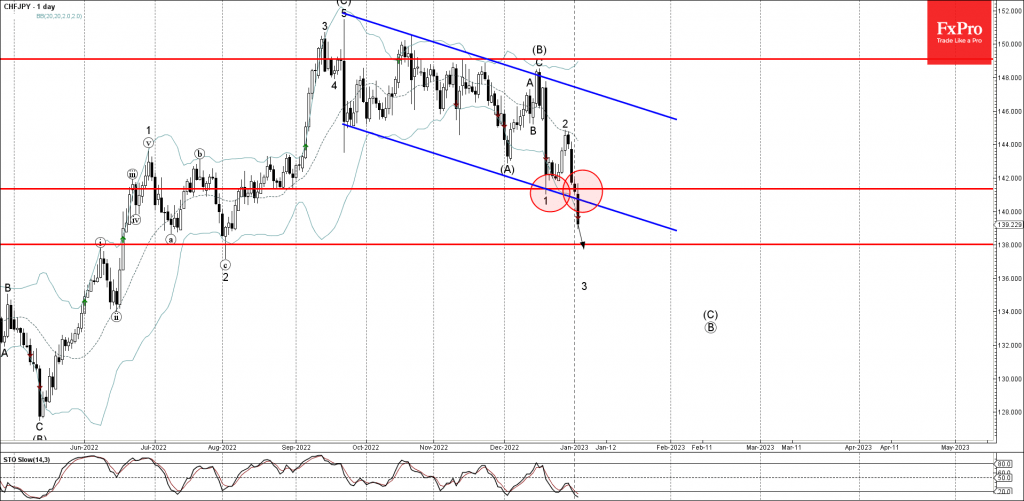
CHFJPY continues to fall after the earlier breakout of the key support level 141.00 (which stopped the previous sharp impulse wave 1 in December).
The breakout of the support level 141.00 coincided with the breakout of the daily down channel from the middle of September.
CHFJPY can be expected to fall further toward the next support level 138.00 (former support from the start of August).
EUR/USD Slides to Three-Week Low
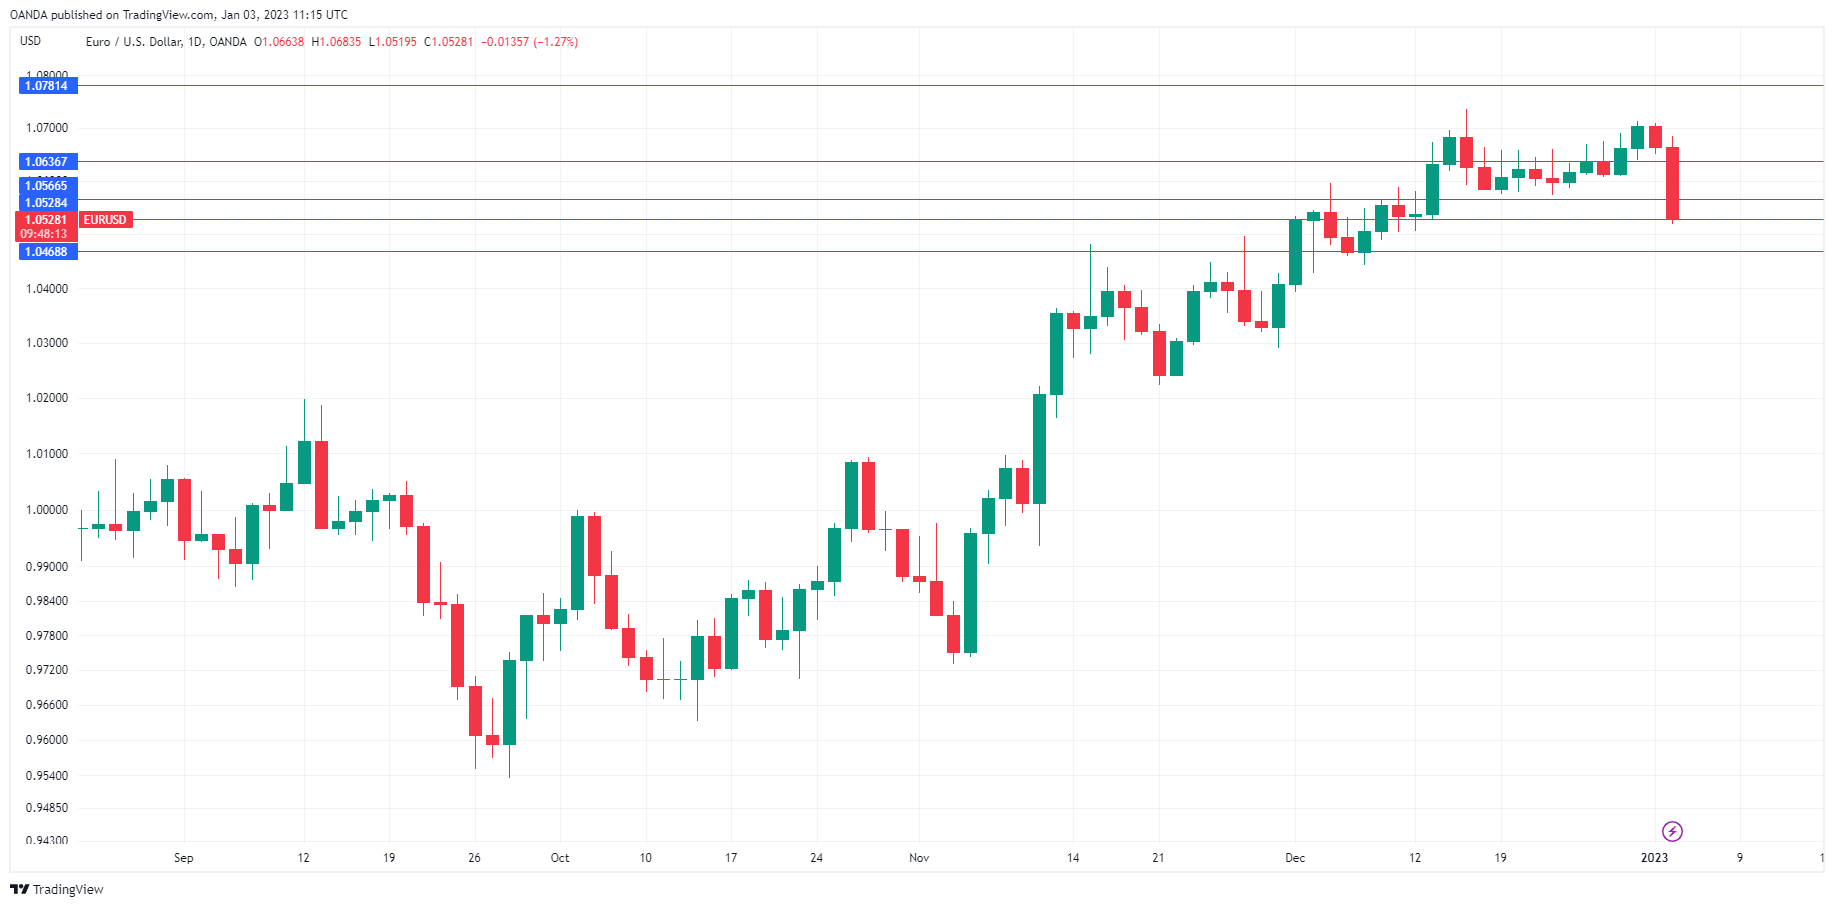
The US dollar is showing strong gains against the majors on Tuesday, with the exception of the Japanese yen. EUR/USD has tumbled by 1.27% and is trading at 1.0528 in Europe.
Investors eye German CPI
EUR/USD is sharply lower today, despite a very light economic calendar. The only release of note is German CPI, which will be released later today. Despite the lack of fundamentals, the US dollar is taking advantage of risk aversion in the markets. There are headwinds everywhere you look. The war in Ukraine, the threat of recession in the US and the eurozone and China’s slowdown all make for a gloomy outlook as we start the new year.
Germany’s inflation has been falling, and the downtrend is expected to continue. The consensus for December CPI is 9.0%, compared to 10.0% in November. If the consensus proves accurate, it could put further pressure on the euro, as the ECB may have to reconsider its hawkish stance on rate policy.
The International Monetary Fund didn’t bring any festive cheer with its pessimistic message on Monday. The IMF warned that 2023 would be tougher than 2022, as the US, EU and China would all see a decline in growth. Adding to the gloom, the IMF said that it expected one-third of the global economy to be in recession this year. In October, the IMF cut its growth outlook from 2.9% to 2.7%, due to the war in Ukraine as well as central banks around the world raising interest rates.
After the Christmas and New Year’s holidays, the markets are easing back in, as the data calendar gets busier as of Wednesday. We’ll get a look at the Fed minutes from the December meeting, which was a hawkish affair that surprised investors and gave the US dollar a boost. On Friday, the US releases the employment report, which always plays an important factor in the Federal Reserve’s rate policy.
EUR/USD Technical
- EUR/USD is testing support at 1.0528. Below, there is support at 1.0469
- There is resistance at 1.0566 and 1.0636
China Outlook: Earlier Reopening to Drive Faster Rebound
The Chinese reopening happened faster than we expected, leading us to revise the growth profile for China. We now expect GDP to take a bigger hit in Q4 and Q1 but that the recovery starts already in February/March, 3-4 months earlier than we previously expected. The weak start of the year pulls down the average of 2023 taking our annual growth forecast down to 4.6% (previously 4.9%) whereas a stronger starting point in 2024 pushes up the growth forecast to 6.0% (previously 5.3%).
As seen in other countries, reopening of the economy is set to unleash pent-up demand (see charts on p2). In China, both services and goods consumption has been depressed over the past year due to the cloud of uncertainty from the zero-covid policy and we look for a rebound in both types of spending. Travel bookings have already picked up. High savings over the past two years leaves plenty of cash in households for consumption when sentiment improves. At the Economic Work Conference in December the Chinese government also signalled that growth is a top priority in 2023 with lifting domestic demand a key focus, see Research China - Renewed focus on growth and the private sector, 20 December 2022. ,
The zero-covid policy also worsened the property crisis as it has pushed down home sales through all of 2022. We expect the reopening to improve home buyer sentiment, which in combination with more forceful easing measures towards the property sector is likely to lead to a turnaround here as well.
We also look for improving business confidence to drive a turn higher in private investments. The government has vowed to support the private sector in 2023, which could entail more positive measures and signals to underpin private investments, not least in the tech sector and manufacturing.
A Chinese recovery will have a positive spill-over to the global economy but also be an inflationary force through its' effect on commodity prices. This could challenge central banks' fight against inflation and points to a risk of more hikes and/or fewer cuts in 2023/24 than the markets are pricing.
US 500 Index Remains in Tight Range Below Short-term SMAs
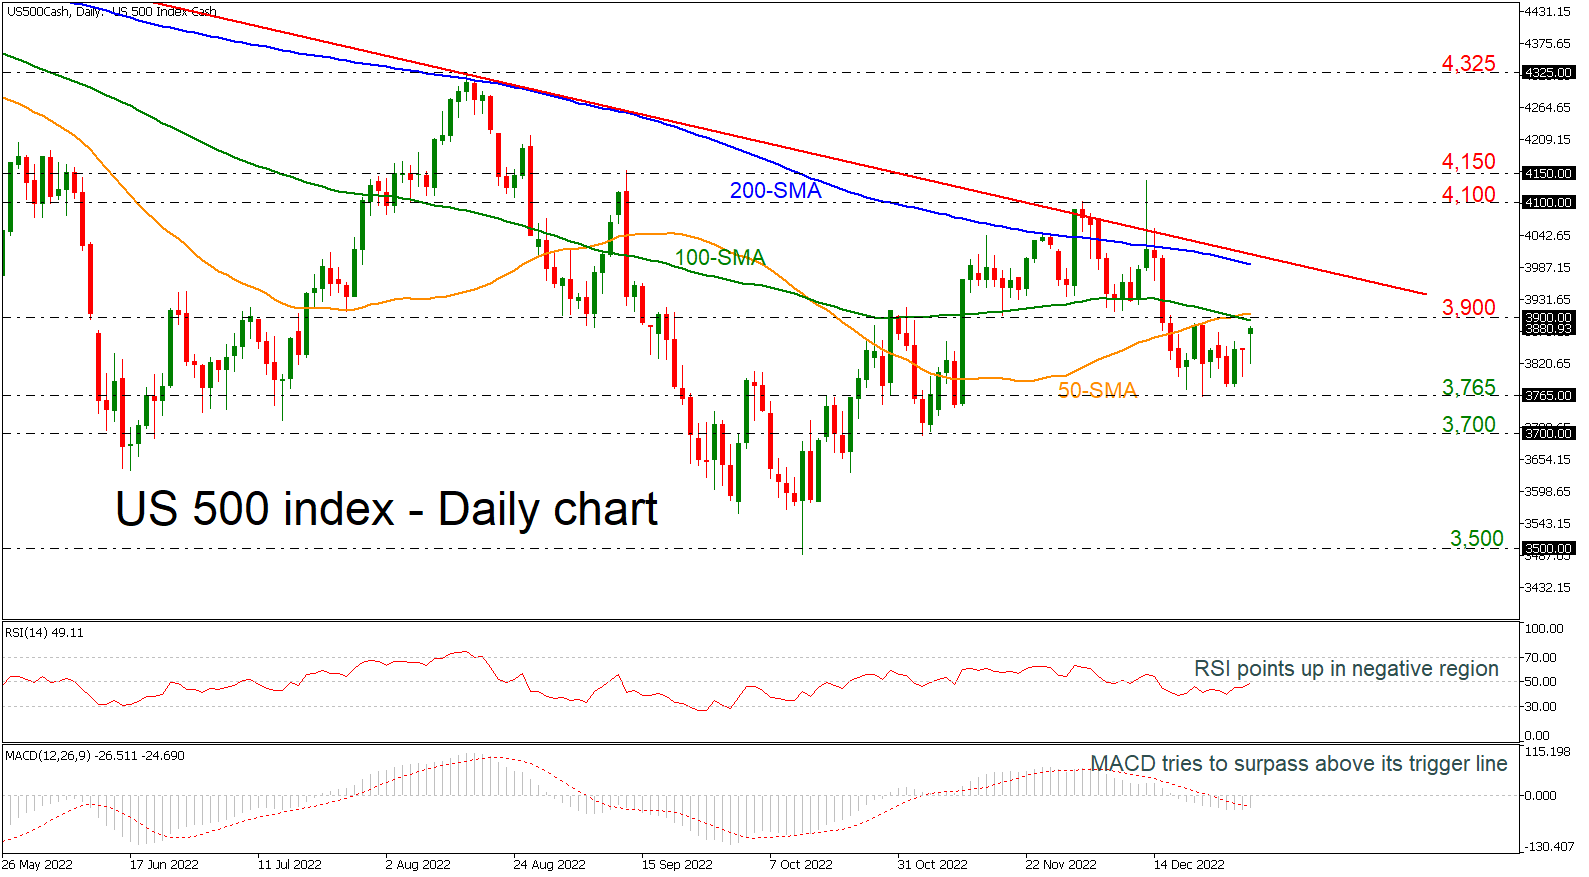
The US 500 cash index is looking more neutral as prices are consolidating within the 3,765 support and the 3,900 resistance. However, the upside momentum appears to be stronger as prices are attempting to climb above the 50- and the 100-day simple moving averages (SMAs) near the 3,900 barrier.
The upside bias is also supported by the RSI, which has been hovering near the 50-neutral level, while the MACD is surpassing its trigger line.
Should the pair manage to strengthen its positive momentum, the next resistance could come around the 200-day SMA at 3,990 ahead of the long-term descending trend line at 4,000. Above this level, the next target could be the 4,100-4,150 region.
On the flip side, if prices are unable to break higher, the risk would shift back to the downside, with the lower boundary of the neutral area at 3,765 coming into focus as well as the 3,700 support. The next key level to watch lower down is 3,500.
Summarizing, the US 500 index is bearish in the long-term timeframe but in the very short-term the index needs some boost to break the SMAs to the upside.
US 100 Index Shows Encouraging Signs
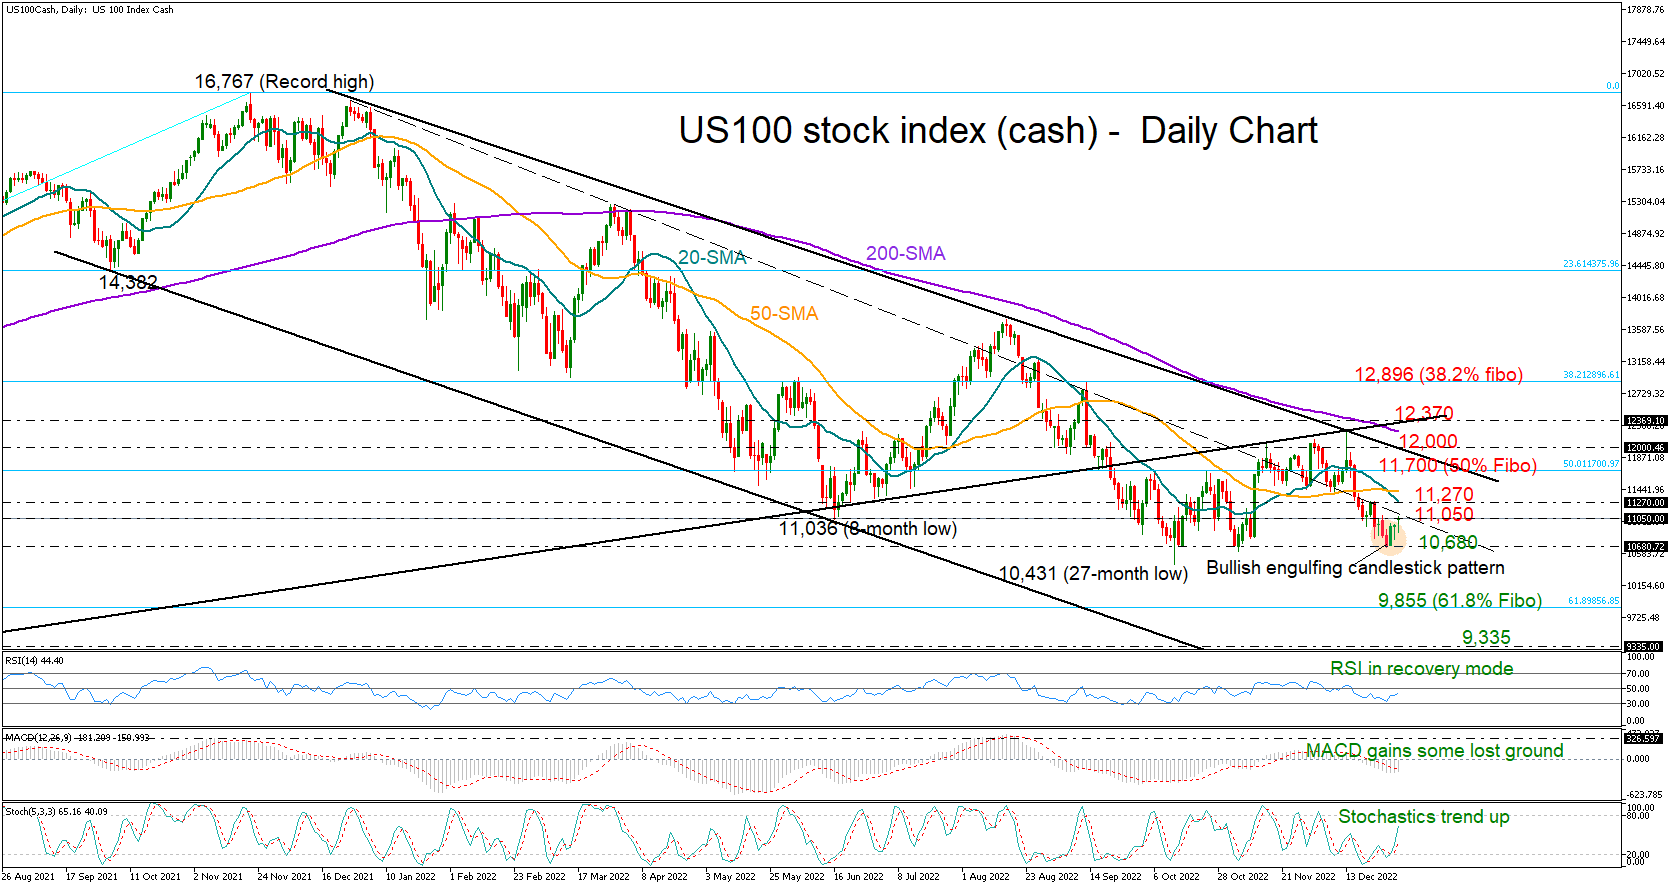
The US 100 stock index (cash) opened the new year with a gap higher at 11,050, with the bulls aiming to cross the 2022 crucial dashed trendline that resumed its resistance role last week.
The technical picture is showing signs of improvement. First of all, a triple bottom pattern seems to be in progress around 10,680, flagging a potential bullish trend reversal. In short-term signals, the positive slope in the RSI and the stochastic oscillator is an encouraging sign that upside pressures may persist during the next days, while the bullish engulfing candlestick pattern that was created last week is adding to this optimism.
There are a couple of obstacles however, which could still halt a recovery in the market. Above the dashed trendline, the 20- and 50-day simple moving averages (SMAs) could block the way towards the 50% Fibonacci retracement of the 6,634–16,767 upleg at 11,700. Slightly higher, the tough resistance trendline seen at 12,000 and the 200-day SMA will be closely watched ahead of the constraining line that ruined bullish attempts in December and November. If buyers successfully drive the market through those boundaries, the next stop could be around the 38.2% Fibonacci level of 12,896.
On the downside, a close below 10,680 could cause a brutal slide towards the 61.8% Fibonacci barrier of 9,855. If the selling interest grows further from here, some consolidation may emerge around the 9,335 barrier before the door opens for the 78.6% Fibo zone of 8,800.
In brief, the US 100 index seems to be preparing the ground for its next bullish phase, though only a decisive rally above 12,370 would confirm a positive trend reversal.
Bitcoin Gets Ready to Move
Market picture
Bitcoin has declined slightly over the past 24 hours – the bulls have still not decided to go on the offensive. Perhaps it is because of an overhang of selling orders from struggling miners.
The first cryptocurrency is trading near $16.7K to start the day on Tuesday, having retreated from its 50-day moving average but maintaining a positive bias towards the upside within the trend of several trading days. US exchanges return to action today to increase liquidity, including in cryptocurrencies.
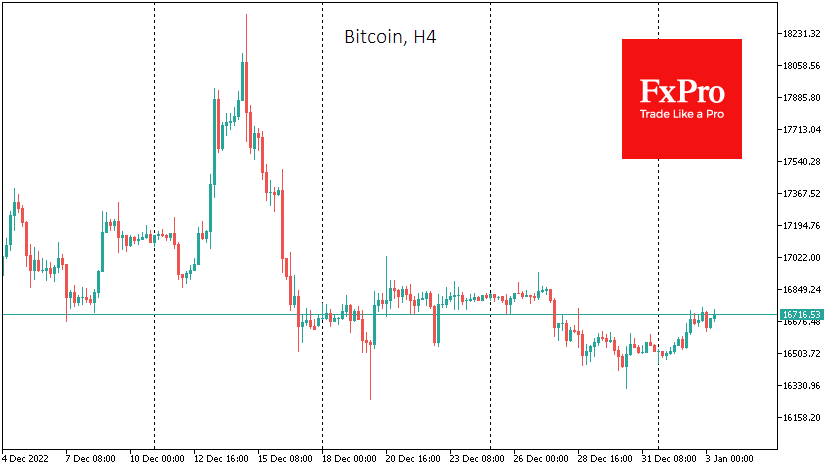
Traders should be prepared that there may be attempts to form new market trends from the new year. And it could be a decisive move upward or another sell-off after a lull.
Regarding seasonality, January is considered a neutral month for BTC. Over the past 12 years, Bitcoin has ended with growth on six occasions. The average growth over the last 12 years has been 22%, while the average decline has been 17%.
In the first case, BTC could end January at around $20,100. Second, it could finish at about $13,700, updating November’s lows. Meanwhile, in the last eight years, bitcoin has declined in January on six occasions, giving buyers of the first cryptocurrency little chance.
News background
The popular YouTube blogger Coin Bureau believes that bitcoin still needs to bottom out. In his opinion, we should expect BTC to drop to $10,000 during the first three months of 2023.
Negative sentiment in the crypto market will dominate until spring 2023, said the crypto fund QCP Capital. The Italian parliament passed a bill to tax cryptocurrency traders. Traders will now pay 26% on profits made from digital trading assets. On the other side of the coin, Britain is introducing tax breaks for foreigners trading through local brokers to make London a crypto trading hub, as it is now with currencies and metals.
Japanese Yen Breaks Below 130
The Japanese yen has posted winning sessions for three straight days and is in positive territory on Tuesday. Japanese markets are closed today for a holiday, so any strong movement from the yen is unlikely today. It’s a very light day on the economic calendar. There are no Japanese events, while the US releases Final Manufacturing PMI.
Yen keeps rolling
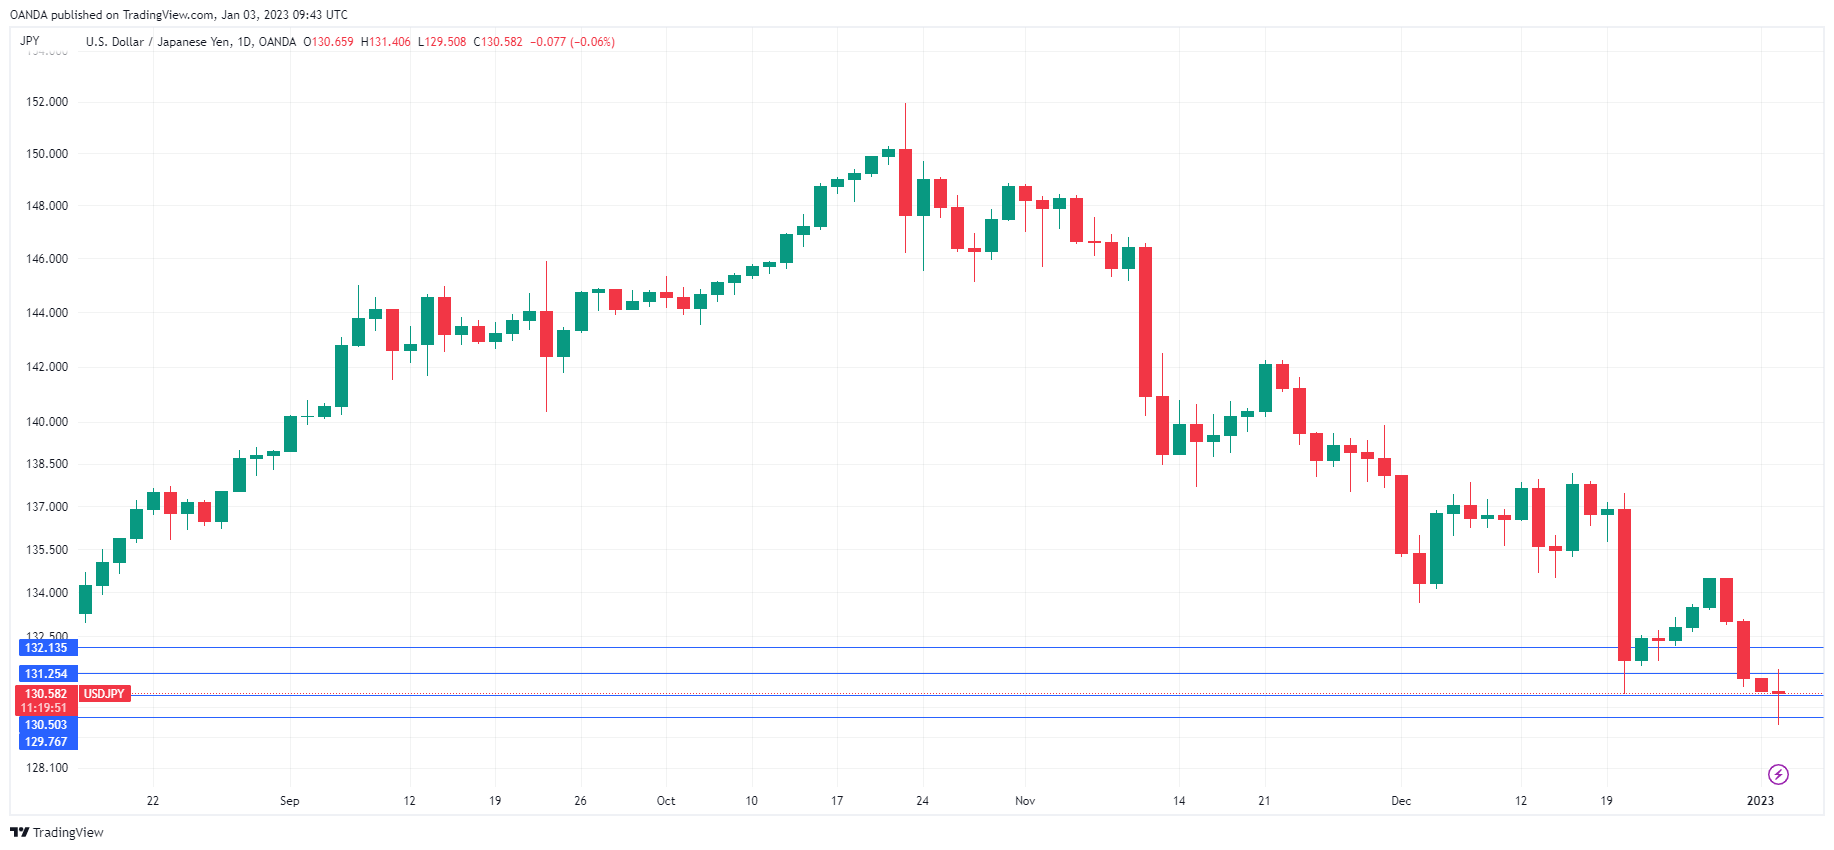
Japanese markets remain closed for an extended holiday but the good times continue for the yen. Since falling to 151 in October, the currency has rebounded and earlier today broke below the symbolic 130 level, for the first time since May. If USD/JPY closes the day below 130, that will give support for the downtrend to continue. The next target for a downside push is the 125 line, which has held since April.
Investors would love to know what the Bank of Japan has planned in the coming months. The BoJ tweaked its yield curve band in December, a move that blindsided the markets and sent the yen flying higher. With Governor Kuroda winding up his 10-year term in April, there were no expectations that Kuroda would make any significant policy changes, and the focus was on his potential successor. Kuroda has insisted that the tweak was not a prelude to the Bank exiting its massive stimulus program, but the markets aren’t so sure. What is clear is that inflation continues to rise in Japan, which is putting pressure on the BoJ to tighten policy. This could take the form of further widening the yield curve band or eliminating the 0% target for 10-year yields.
The BoJ next meets on January 18th and investors will be all ears. BoJ policy meetings used to be sleepy affairs, where board members dutifully announced they were maintaining current policy. This is clearly no longer the case, with the BoJ widening the yield curve band at the December meeting and board members discussing the impact that an exit from stimulus would have on the markets.
USD/JPY Technical
- USD/JPY is testing support at 130.50. The next support level is 129.76, which has held since June
- There is resistance at 131.25 and 132.13
UK PMI manufacturing finalized at 45.3 in Dec, took a further turn for the worse
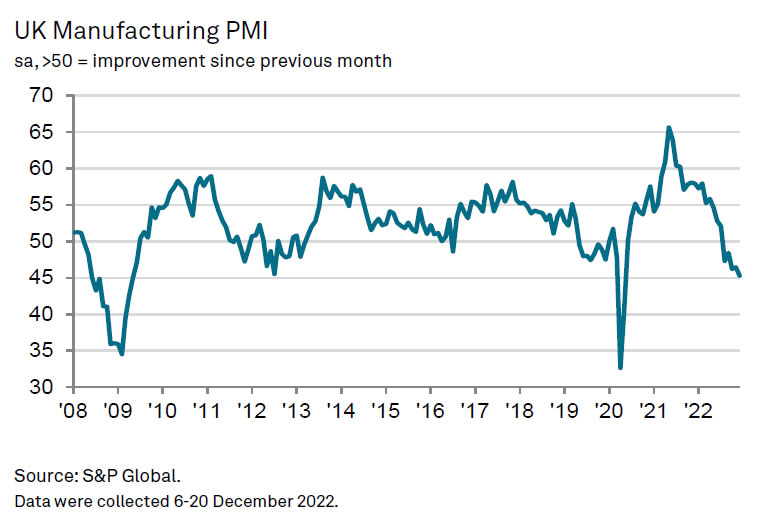
UK PMI Manufacturing was finalized at 45.3 in December, down from 46.5 in November, a 31-month low. S&P Global noted that production and new orders fell at faster rates, leading to accelerated job losses. Selling price and input cost inflation eased.
Rob Dobson, Director at S&P Global Market Intelligence, said: "The UK manufacturing downturn took a further turn for the worse at the end of the year. Output contracted at one of the quickest rates during the past 14 years, as new order inflows weakened and supply chain issues continued to bite. The decline in new business was worryingly steep, as weak domestic demand was accompanied by a further marked drop in new orders from overseas.
Could FOMC Minutes Shift Fed Tone?
The Fed has raised rates 7 times in a row, and the consensus among analysts is that it will do so again at the end of the month. At the moment, the majority of economics expect a 25bps hike, which would continue the "leveling off" trend from the Fed.
But, after the last meeting, Fed Chair Powell was adamant that rates would keep going up, and that the market was misreading the Fed's attention. This hawkish tone didn't have as much impact on the markets after the Fed raised at a slower pace. And it's a scenario we've seen play out before, with Powell and the minutes of the meeting not exactly being in line. Which is why there could be some riling up in the markets tomorrow with the release of the minutes. Some analysts are wondering if there will be a repeat.
What could happen again…
Back in November, there was quite a bit of discussion about when the Fed would pivot. There was expectation that following that month's FOMC meeting, Powell would drop some hints that the next meeting would have a smaller rate hike. Instead, he came out quite adamant that rates would keep going up.
But, two weeks later, the FOMC minutes came out, and were decidedly more dovish. And the Fed did ultimately make a smaller raise at the next meeting in December. Given the hawkish tone out of Powell following the last meeting, and the general market expecting the Fed to level off rates now, there is speculation that the minutes this time around could be more dovish.
Market reaction and surprises
The minutes could have an even bigger impact this time around, because FOMC members have been largely silent since the meeting. Of course, the last couple of weeks have been the year-end holidays, so it's expected that there wouldn't be much Fed commentary. Now, traders are looking to set up for the coming year, and the minutes are the first explanation of what the Fed is thinking about the current inflation trends.
The thing is, Powell wasn't the only hawkish sign from the last meeting. We also got the quarterly update with the dot-plot matrix, which shows where members see policy rates in the coming months. And there, the median rate expectation was boosted from 4.5% to 5.0%, meaning that the consensus among Fed members is more hawkish than it was at the end of the third quarter.
Figuring out where things are going
The market is currently pricing in a terminal rate of under 5.0%, while the Fed is insisting that the terminal rate will be over 5.0%. Who turns out to be right will likely depend on the data, but it doesn't take much for the Fed to prove the market wrong. With rates at 4.5% at the moment, all the Fed would have to do is raise rates by 50bps at the next meeting, repeating what they did in December, and the market would have to adjust. Almost a third of economists are forecasting that, as a matter of fact.
The takeaway from the minutes, therefore, is likely to be around how confident the members sound in their projection that rate hikes will keep coming. If they emphasize being more data dependent than anchoring expectations, then the market might believe them to be more dovish than Powell communicated most recently.