

Sample Category Title
EUR/AUD Daily Outlook
Daily Pivots: (S1) 1.5623; (P) 1.5678; (R1) 1.5730; More...
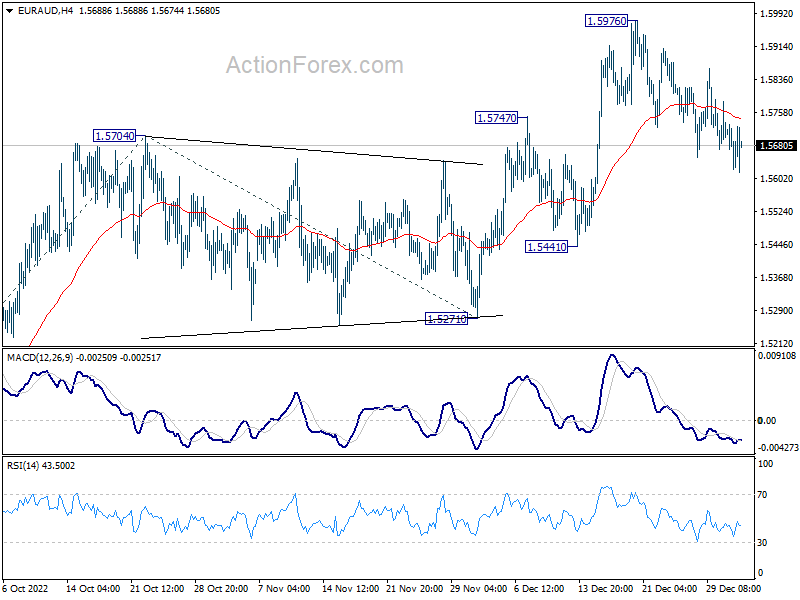
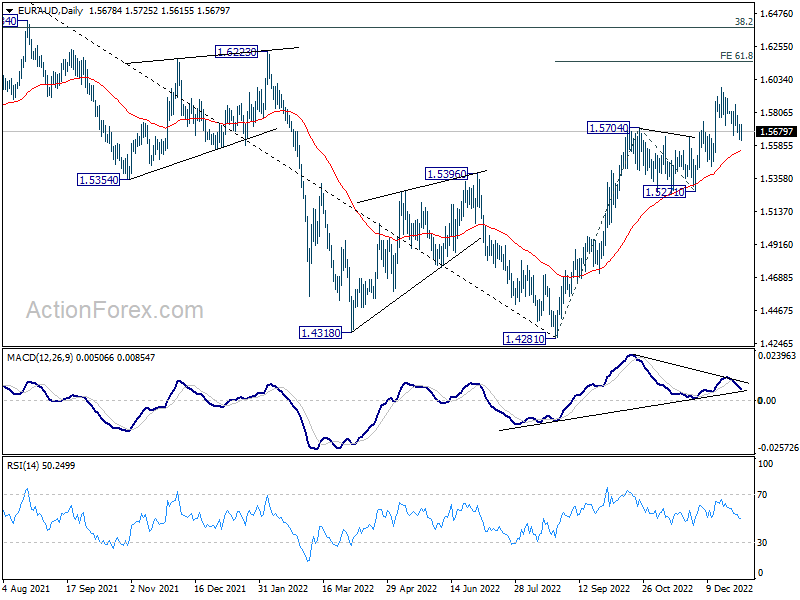
EUR/AUD is still extending the corrective pull back from 1.5976 and intraday bias stays neutral. Further rally will remain in favor as long as 1.5441 support holds. Break of 1.5976 will resume larger rise from 1.4281 to 61.8% projection of 1.4281 to 1.5704 from 1.5271 at 1.6150.
In the bigger picture, strong support from 55 day and 55 week EMA affirms underlying bullishness. As long as 1.5271 support holds, rise from 1.4281 medium term bottom is expected to continue to 1.6434 key resistance next. Decisive break there should confirm medium term bullish trend reversal.
EUR/CHF Daily Outlook
Daily Pivots: (S1) 0.9835; (P) 0.9871; (R1) 0.9893; More....
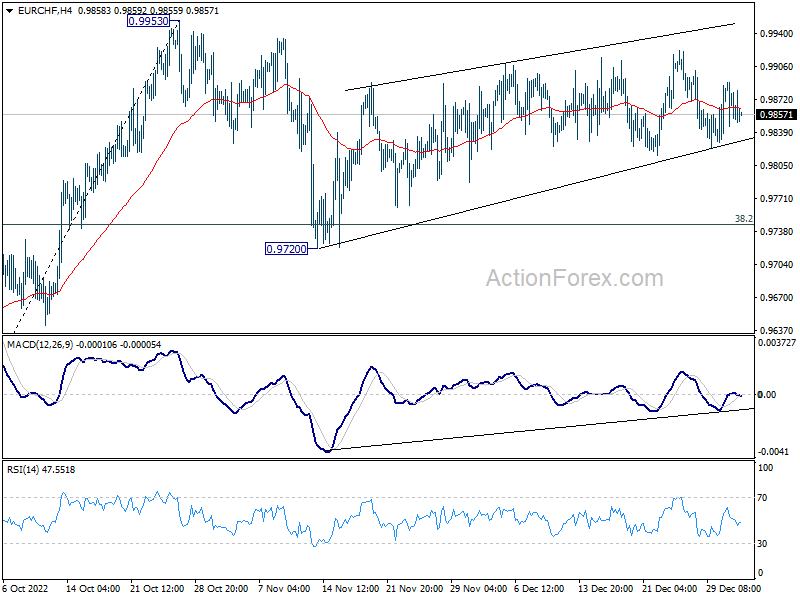
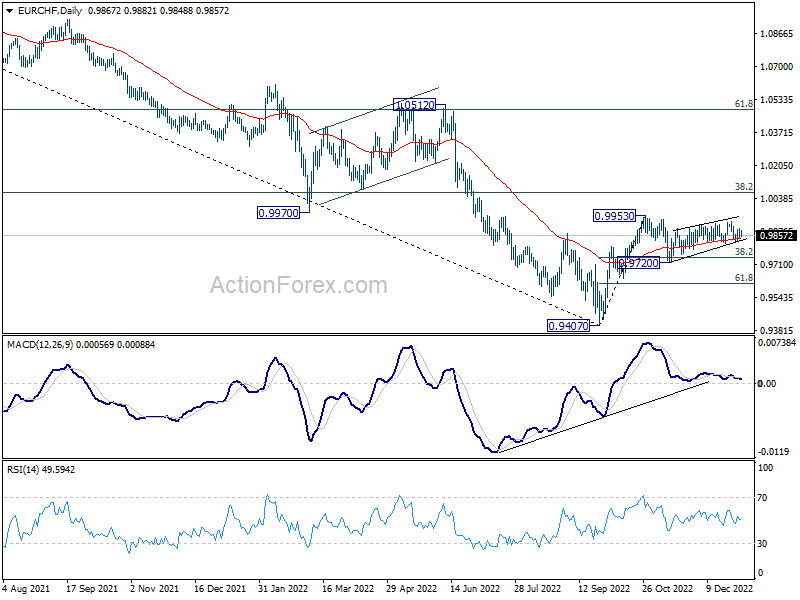
EUR/CHF is still bounded in consolidation from 0.9953 and intraday bias stays neutral. Outlook is also unchanged. On the upside, firm break of 0.9953 resistance will resume larger rally from 0.9407 to 1.0072 fibonacci level. However, break of 0.9720 will extend the decline from 0.9953 to 61.8% retracement of 0.8407 to 0.9953 at 0.9616.
In the bigger picture, as long as 38.2% retracement of 1.1149 to 0.9407 at 1.0072 holds, price actions from 0.9407 medium term bottom will be treated as a corrective pattern. That is, long term down trend would resume through this low at a later stage. Nevertheless, firm break of 1.0072 will also have 55 week EMA (now at 1.0053) taken out. That would be an initial sign of long term bullish reversal.
EUR/JPY Daily Outlook
Daily Pivots: (S1) 138.98; (P) 139.72; (R1) 140.16; More....
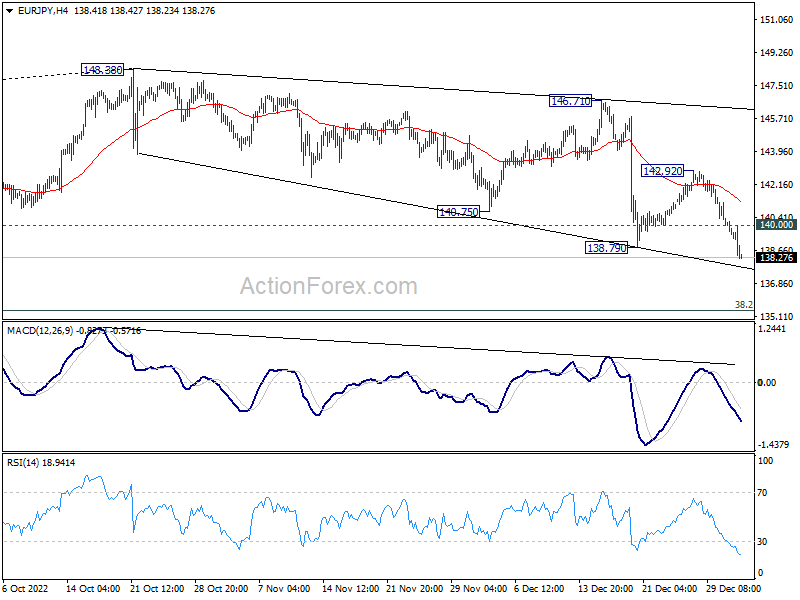
EUR/JPY's decline from 148.38 resumed by breaking through 138.79 support and intraday bias is back on the downside. Next target is 135.40 fibonacci level. On the upside, above 140.00 minor resistance will turn intraday bias neutral first. But further decline will be expected as long as 142.92 resistance holds, in case of recovery.
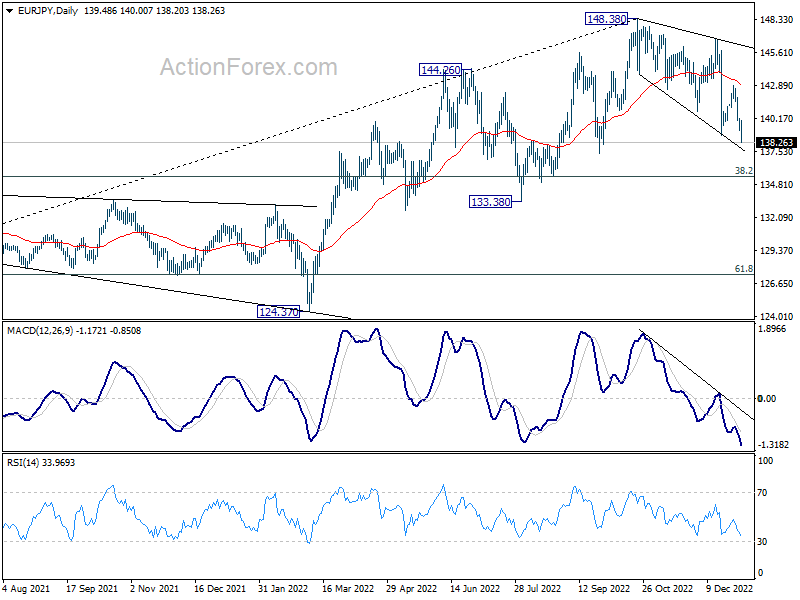
In the bigger picture, as long as 55 week EMA (now at 138.54) holds, larger up trend from 114.42 (2020 low) is still in progress for 149.76 long term resistance. However, firm break of 55 week EMA will bring deeper fall to 38.2% retracement of 114.42 to 148.38 at 135.40. Sustained break there will raise the chance of trend reversal, and target 61.8% retracement at 127.39.
GBP/JPY Daily Outlook
Daily Pivots: (S1) 156.95; (P) 157.87; (R1) 158.37; More...
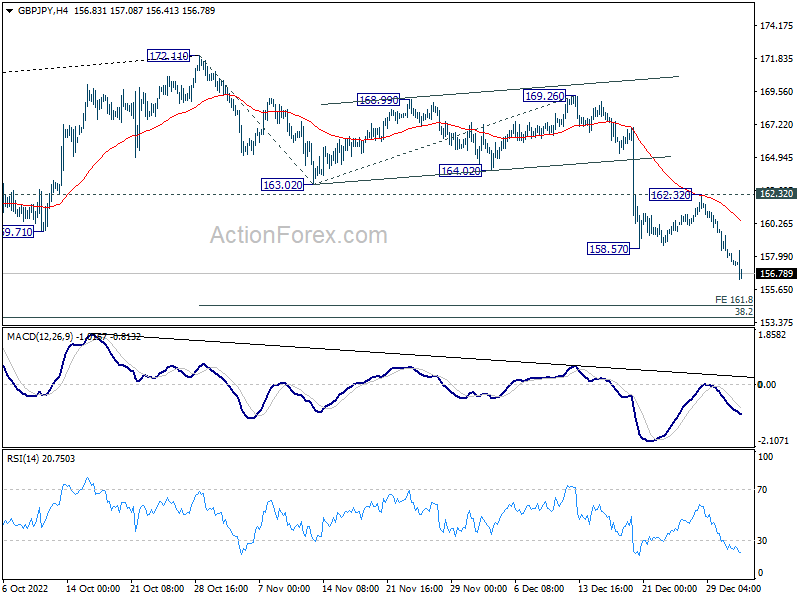
GBP/JPY's decline from 172.11 resumed by breaking through 158.57 support. Intraday bias is back on the downside for 161.8% projection of 172.11 to 163.02 from 169.26 at 154.55, and then 153.70 fibonacci level. On the upside, above 158.57 will turn intraday bias neutral first. But near term outlook will stay bearish as long as 162.32 resistance holds, in case of recovery.
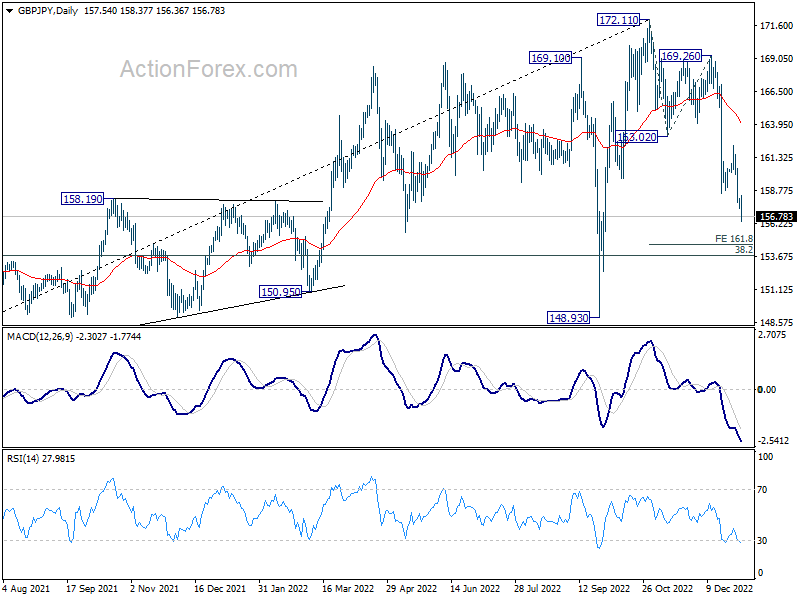
In the bigger picture, a medium term top was in place at 172.11 on on bearish divergence condition in weekly MACD. Decline from there should target 38.2% retracement of 123.94 to 172.11 at 153.70. Sustained break there will raise the change of trend reversal and target 61.8% retracement at 142.34. Nevertheless, break of 153.02 support turned resistance will argue that the decline has completed, and retain medium term bullishness.
Yen Skyrockets Broadly as New Year Starts, Gold Breakout
Yen rises broadly and strongly in Asian session today even though Japan remains on holiday. The strength is rather overwhelming, and with some near term resistance levels taken out, more upside is in favor for the near term. Dollar and European majors are worse performing ones, with Sterling having a slight edge only. Commodity currencies are mixed for now. A lots of important events are scheduled for the week, including FOMC minutes, US NFP and ISM, as well as Eurozone CPI flash. So, more volatility is envisaged ahead.
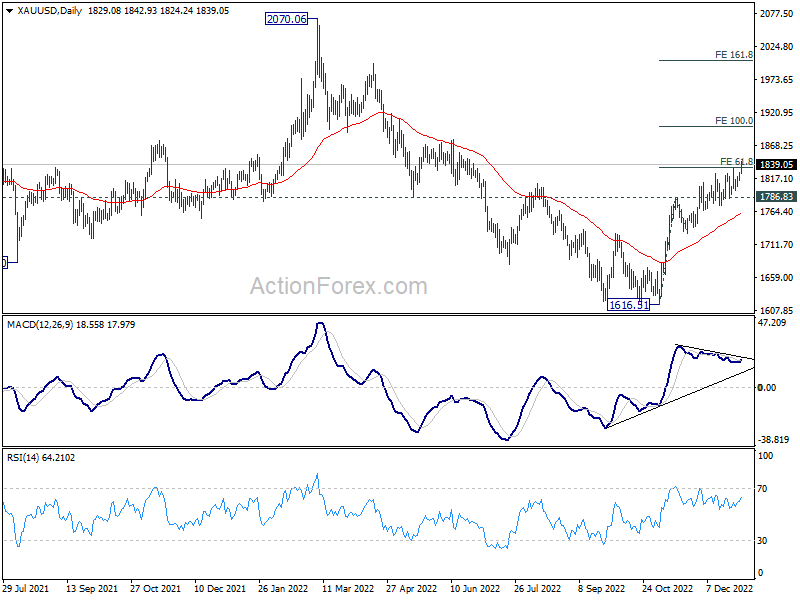
Technically, Gold's rally from 1616.52 also resumes today by taking out last week's high at 1833.42. Near term outlook will stay bullish as long as 1786.83 resistance turned support holds. Next target is 100% projection of 1616.51 to 1786.63 from 1728.48 at 1898.80. Upside momentum as seen in daily MACD would be monitored on sign of acceleration. Also, a question is on whether EUR/USD would follow by breaking through 1.0733 resistance.
In Asia, Hong Kong HSI is up 1.38%. China Shanghai SSE is up 0.70%. Singapore Strait Times is down -0.53%. Japan is on holiday.
USD/JPY, CAD/JPY, CHF/JPY downside breakout as Yen surges
Yen opens the year with a strong note and rises to a six-month high against Dollar. The strength is also broad based. The move extends the rally since BoJ's decision to raise the cap on 10-year JGB yield last month. There is some expectation of further tweak of the yield curve control in the early part of this year, or even an exit of the decade long ultra-loose monetary policy.
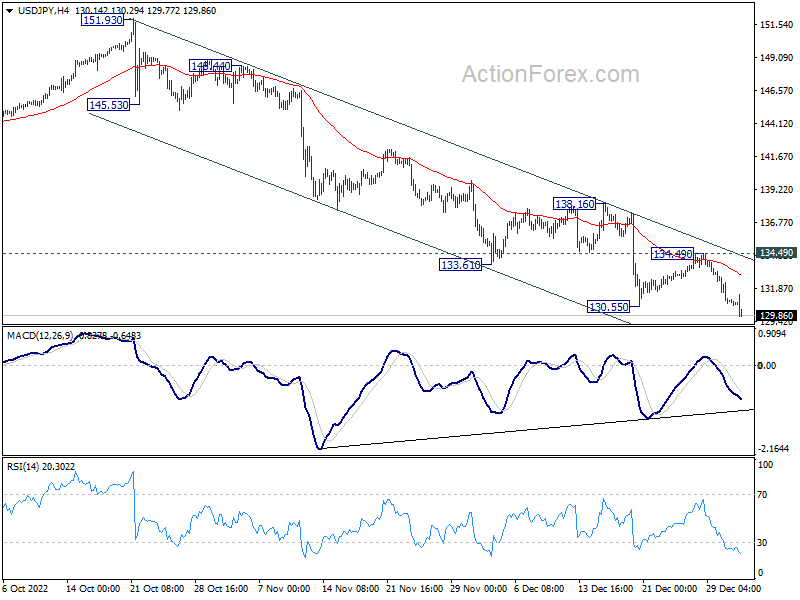
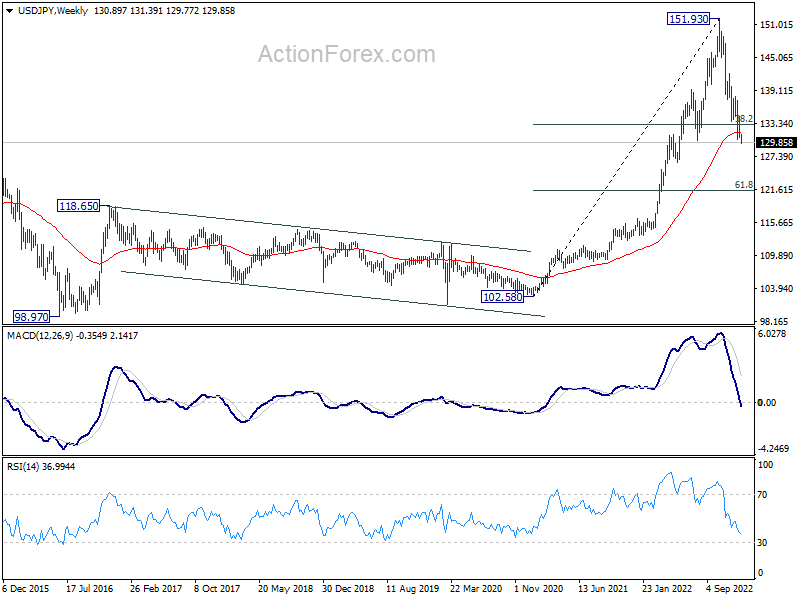
USD/JPY's break of 130.55 support confirms resumption of whole down trend from 151.93. Near term outlook will stay bearish as long as 134.49 resistance holds in case of recovery. Sustained trading below 55 week EMA (now at 131.65) would pave the way to 61.8% retracement of 102.58 to 151.93 at 121.43 in the medium term.
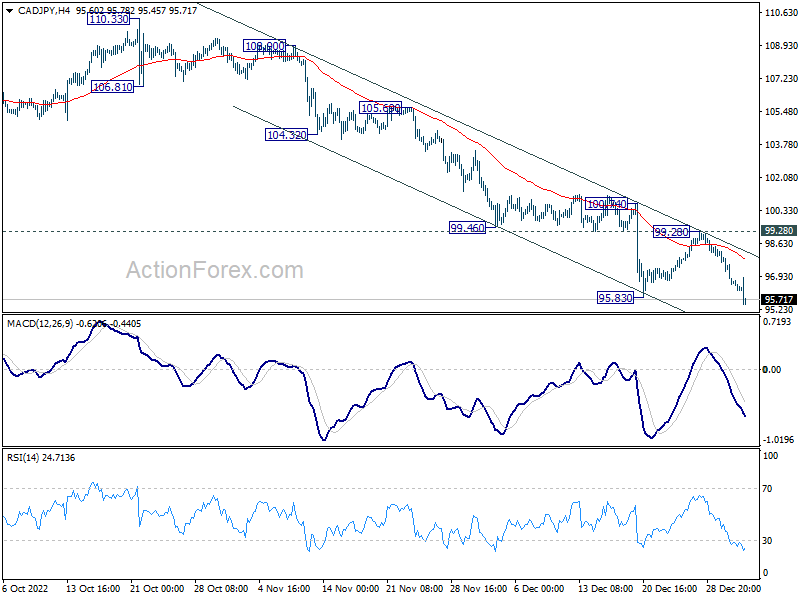
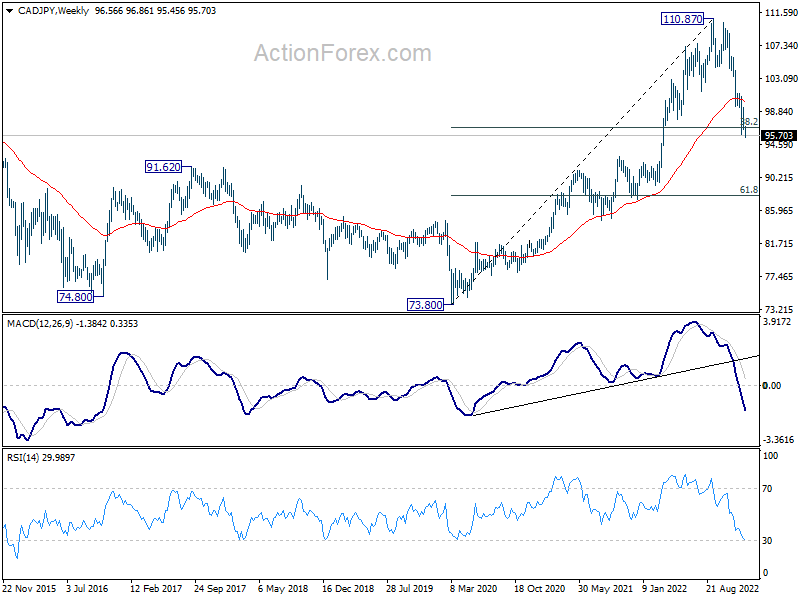
CAD/JPY's break of 95.83 also indicate resumption of whole down trend from 110.87. Near term outlook will remain bearish as long as 99.28 resistance holds, in case of recovery. Next medium term target is 61.8% retracement of 73.80 to 110.87 at 87.96.
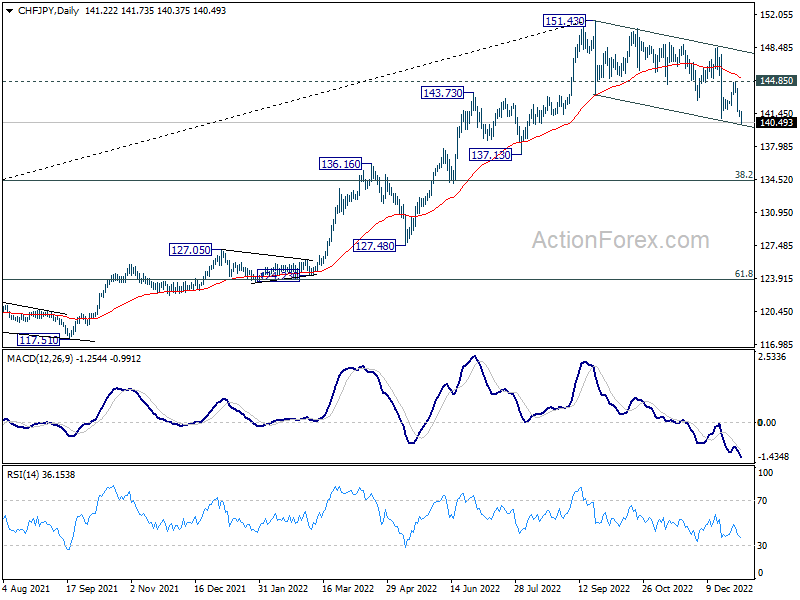
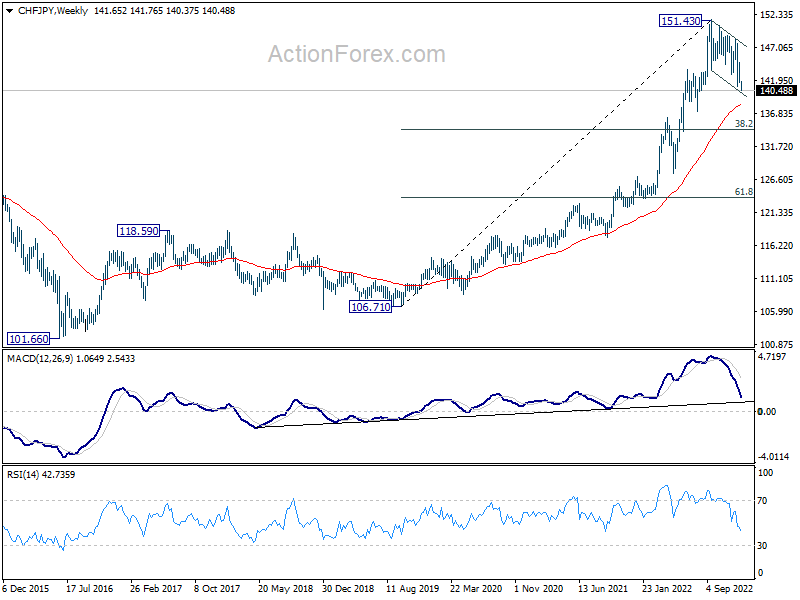
Even the relatively resilient CHF/JPY is resuming the fall from 151.43. Rejection below 55 day EMA is a bearish sign. Fall from 151.43 would target 55 week EMA (now at 138.19), or even further to 38.2% retracement to 38.2% retracement of 106.71 to 151.43 at 134.34.
Bundesbank Nagel: Further policy action needed to halt and reverse rising inflation expectations
Bundesbank President Joachim Nagel warned in an interview, "our monthly surveys of firms and households are showing a significant increase in long-term inflation expectations."
"I firmly believe that we need to take further monetary policy action to halt and reverse this trend," he added.
Nagel also said that allowing inflation to become entrenched would be even worse. "Then we would be forced to tighten policy all the more sharply further down the line, thus placing even more of a strain on the economy."
"I am optimistic that Germany will be able to avoid a severe economic slump and we will get off lightly with a mild downturn. And I am confident that we will be able to tame the high rate of inflation over the medium term", he noted.
"There is a distinct risk of stronger second-round effects because the higher wage deals that are being reached could prolong the prevailing period of high inflation rates"
China Caixin PMI manufacturing fell to 49.0, infections expected to explode in short term
China Caixin PMI Manufacturing fell from 49.4 to 49.0 in December, below expectation of 49.3. Caixin added that production declined further albeit at a slower rate. Steeper fall was seen in new orders. But business confidence improved to 10-month high.
Wang Zhe, Senior Economist at Caixin Insight Group said: "Covid outbreaks rapidly spread across China in November, causing a number of macroeconomic indicators to fall sharply and adding to pressure on the economy. On Dec. 7, China announced 10 new measures to further optimize Covid containment. In the short term, infections are expected to explode, which will severely interfere with production and everyday life. How to effectively coordinate Covid controls with economic and social development has once again become a crucial question."
Fed minutes, NFP & ISM, Eurozone CPI flash to highlight the week
Fed will publish the minutes of the December meeting, where interest rates was raised by 50bps to 4.25-4.50%. More important, the economic projections released then showed interest rates would peak at 5.1% this year, above 5% handle. Hence, much focuses will be on the discussion about the terminal rate. Additionally, the US will release ISM indexes as well as non-farm payroll employment, and the latter could be even more market moving. Also to be watched include Canada employment.
Over to Eurozone, main focus will be on December CPI flash. Now that ECB has entered the second half of the inflation fight match, incoming inflation data is more crucial than ever for "meeting-by-meeting" rate decision. The 50bps per meeting hike will continue for a while, at least through March. So, the inflation data will be closely watched to affirm this view.
Here are some highlights for the week:
- Tuesday: China Caixin PMI manufacturing; Germany CPI flash, unemployment; Swiss PMI manufacturing, UK PMI manufacturing final; Canada PMI manufacturing; US construction spending.
- Wednesday: Japan PMI manufacturing final; Swiss CPI; Germany import prices; Eurozone PMI services final; UK M4 money supply, mortgage approvals; US ISM manufacturing, FOMC minutes.
- Thursday: Japan monetary base; China Caixin PMI services; Japan consumer confidence; Germany trade balance; UK PMI services final; Eurozone PPI; US ADP employment, jobless claims, trade balance; Canada trade balance.
- Friday: China trade balance; Japan average cash earnings; Germany factory orders, retail sales; Swiss retail sales, foreign currency reserves; France consumer spending; UK PMI construction; Eurozone CPI flash, retail sales; Canada employment, Ivey PMI; US non-farm payrolls, ISM services, factory orders.
GBP/JPY Daily Outlook
Daily Pivots: (S1) 156.95; (P) 157.87; (R1) 158.37; More...
GBP/JPY's decline from 172.11 resumed by breaking through 158.57 support. Intraday bias is back on the downside for 161.8% projection of 172.11 to 163.02 from 169.26 at 154.55, and then 153.70 fibonacci level. On the upside, above 158.57 will turn intraday bias neutral first. But near term outlook will stay bearish as long as 162.32 resistance holds, in case of recovery.
In the bigger picture, a medium term top was in place at 172.11 on on bearish divergence condition in weekly MACD. Decline from there should target 38.2% retracement of 123.94 to 172.11 at 153.70. Sustained break there will raise the change of trend reversal and target 61.8% retracement at 142.34. Nevertheless, break of 153.02 support turned resistance will argue that the decline has completed, and retain medium term bullishness.
Economic Indicators Update
| GMT | Ccy | Events | Actual | Forecast | Previous | Revised |
|---|---|---|---|---|---|---|
| 01:45 | CNY | Caixin Manufacturing PMI Dec | 49 | 49.3 | 49.4 | |
| 08:30 | CHF | SVME PMI Dec | 53 | 53.9 | ||
| 08:55 | EUR | Germany Unemployment Change Dec | 15K | 17K | ||
| 08:55 | EUR | Germany Unemployment Rate Dec | 5.50% | 5.60% | ||
| 09:30 | GBP | Manufacturing PMI Dec F | 44.7 | 44.7 | ||
| 13:00 | EUR | Germany CPI M/M Dec P | -0.70% | -0.50% | ||
| 13:00 | EUR | Germany CPI Y/Y Dec P | 10.00% | |||
| 14:30 | CAD | Manufacturing PMI Dec | 49.9 | 49.6 | ||
| 14:45 | USD | Manufacturing PMI Dec F | 46.2 | 46.2 | ||
| 15:00 | USD | Construction Spending M/M Nov | -0.40% | -0.30% |
Technical Outlook and Review
USD/JPY:
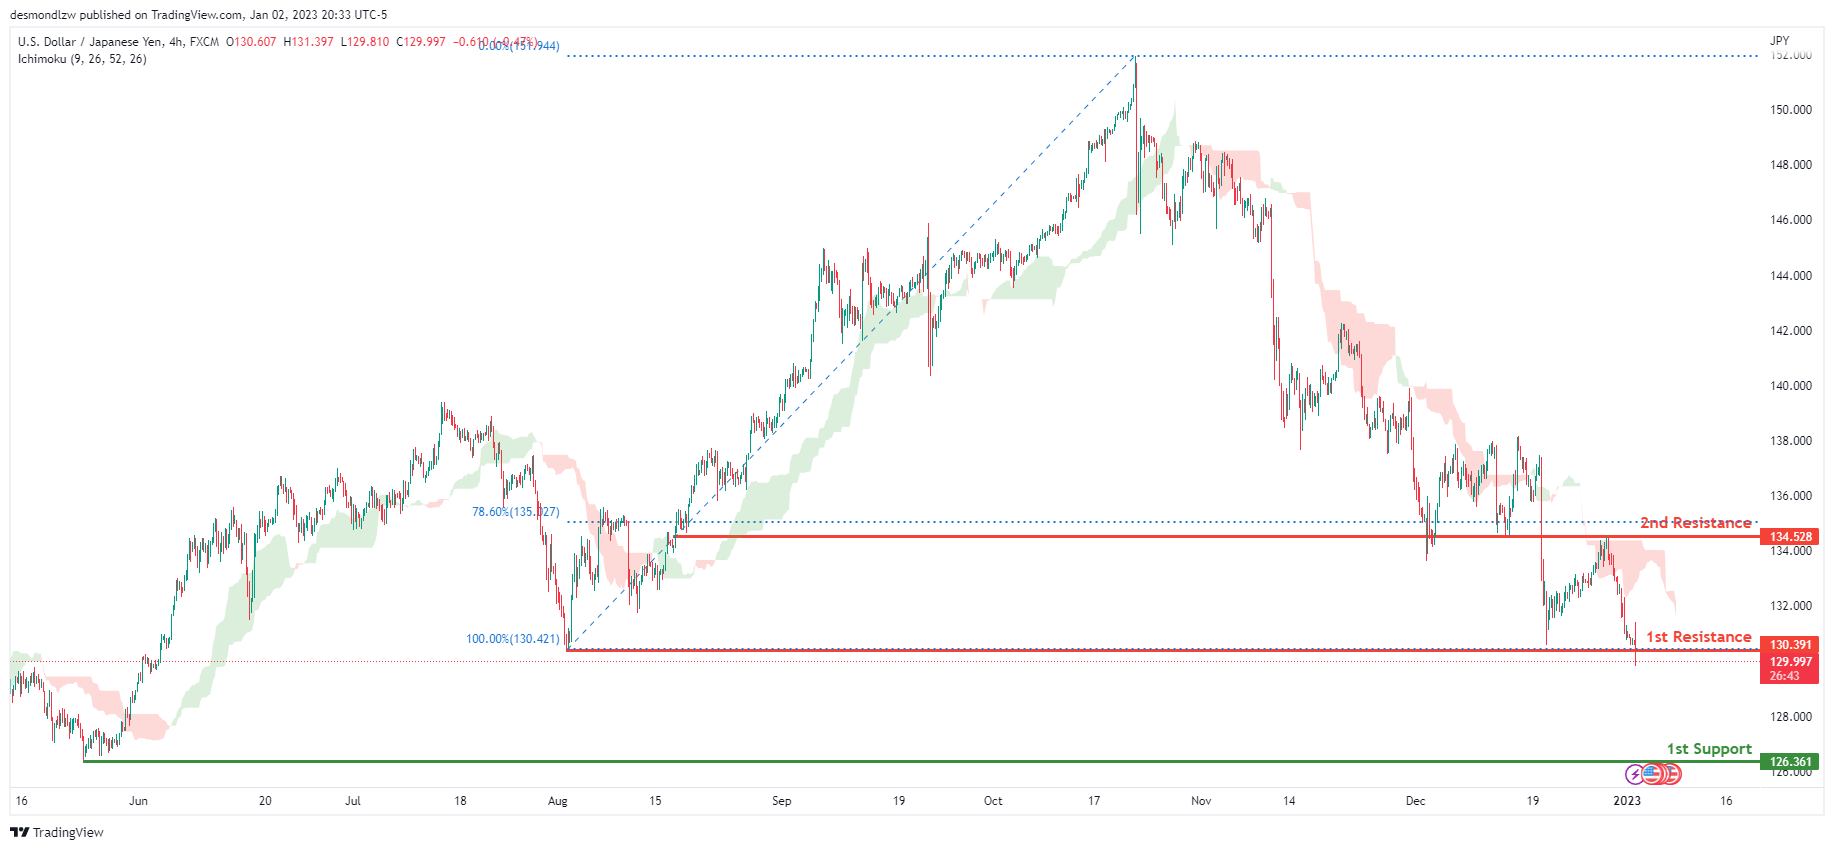
Looking at the H4 chart, my overall bias for USDJPY is bearish due to the current price being below the Ichimoku cloud, indicating a bearish market. If this bearish momentum continues, expect price to possibly continue heading towards the 1st support at 126.361, where the previous swing low is.In an alternate scenario, price could possibly head back up breaking the 1st resistance level at 130.391, where the previous swing low is before heading towards the 2nd resistance at 134.528, where the 78.6% Fibonacci line is.
Areas of consideration:
- H4 time frame, 1st resistance at 130.391
- H4 time frame, 2nd resistance at 134.528
- H4 time frame, 1st support at 126.361
DXY:
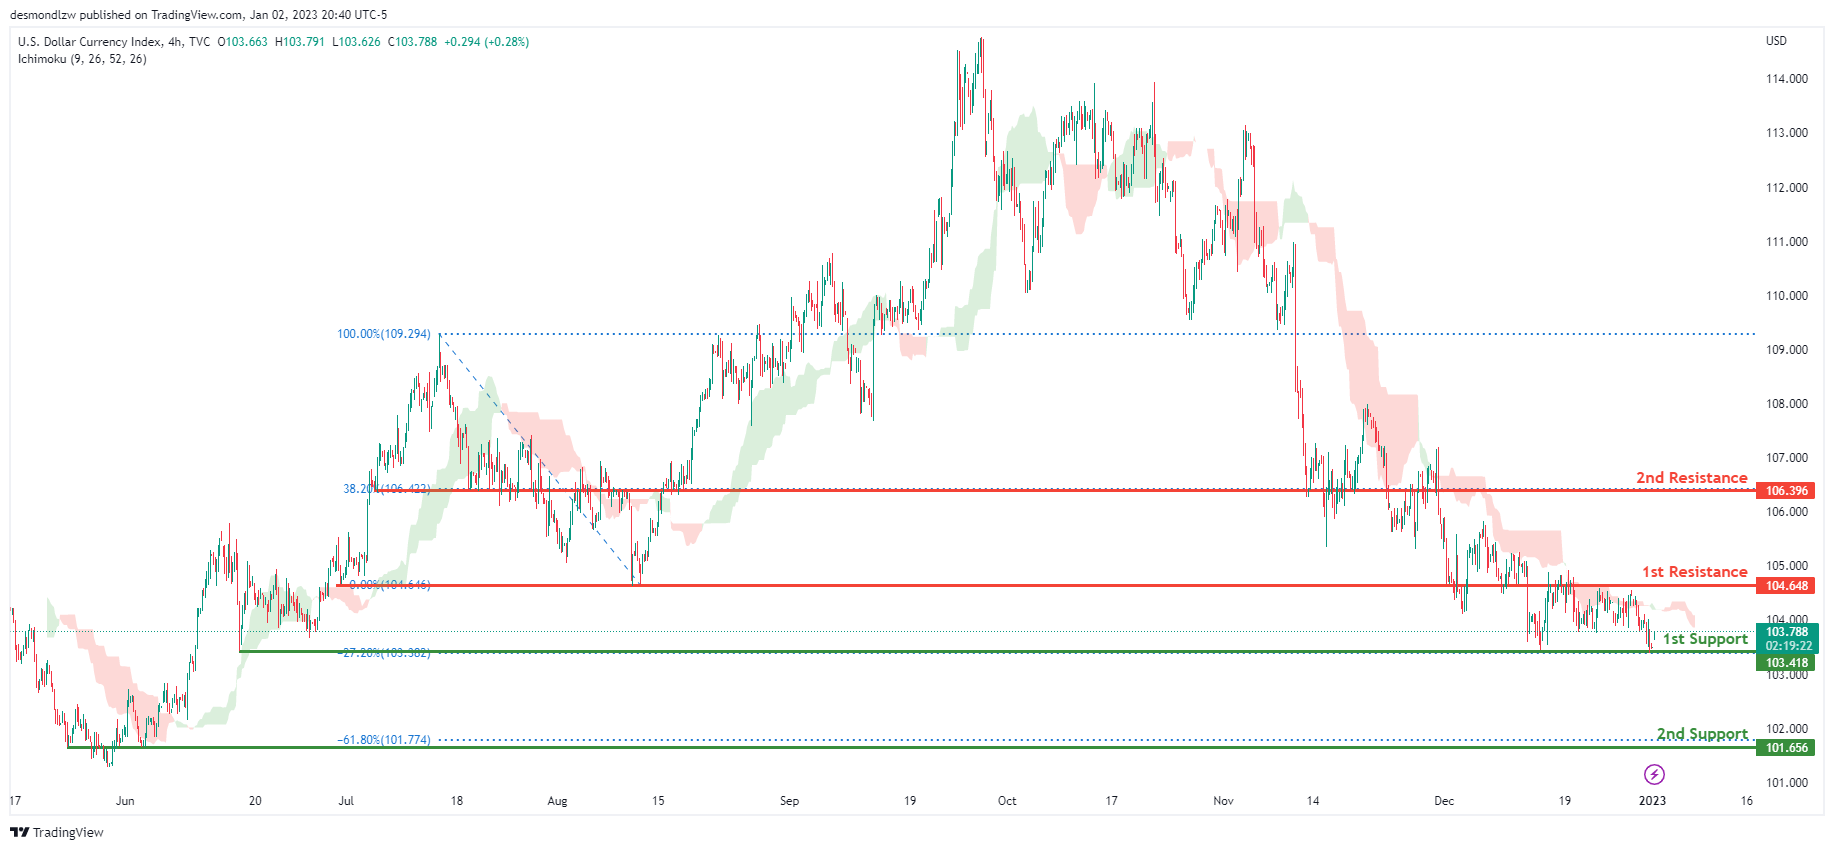
On the H4 chart, the overall bias for DXY is bearish. To add confluence to this, the price is below the Ichimoku cloud which indicates a bearish market. If this bearish momentum continues, expect the price to possibly break the 1st support line at 103.418, where the -27.2% Fibonacci expansion line is before heading towards the 2nd support at 101.656, where the -61.8% Fibonacci expansion line is. In an alternative scenario, price could head back up and break the 1st resistance line resistance at 104.648, where the previous swing low is before heading towards the 2nd resistance at 106.396, where the 38.2% Fibonacci line is.
Areas of consideration:
- H4 time frame, 1st resistance at 104.648
- H4 time frame, 1st support at 103.418
- H4 time frame, 2nd support at 101.656
EUR/USD:
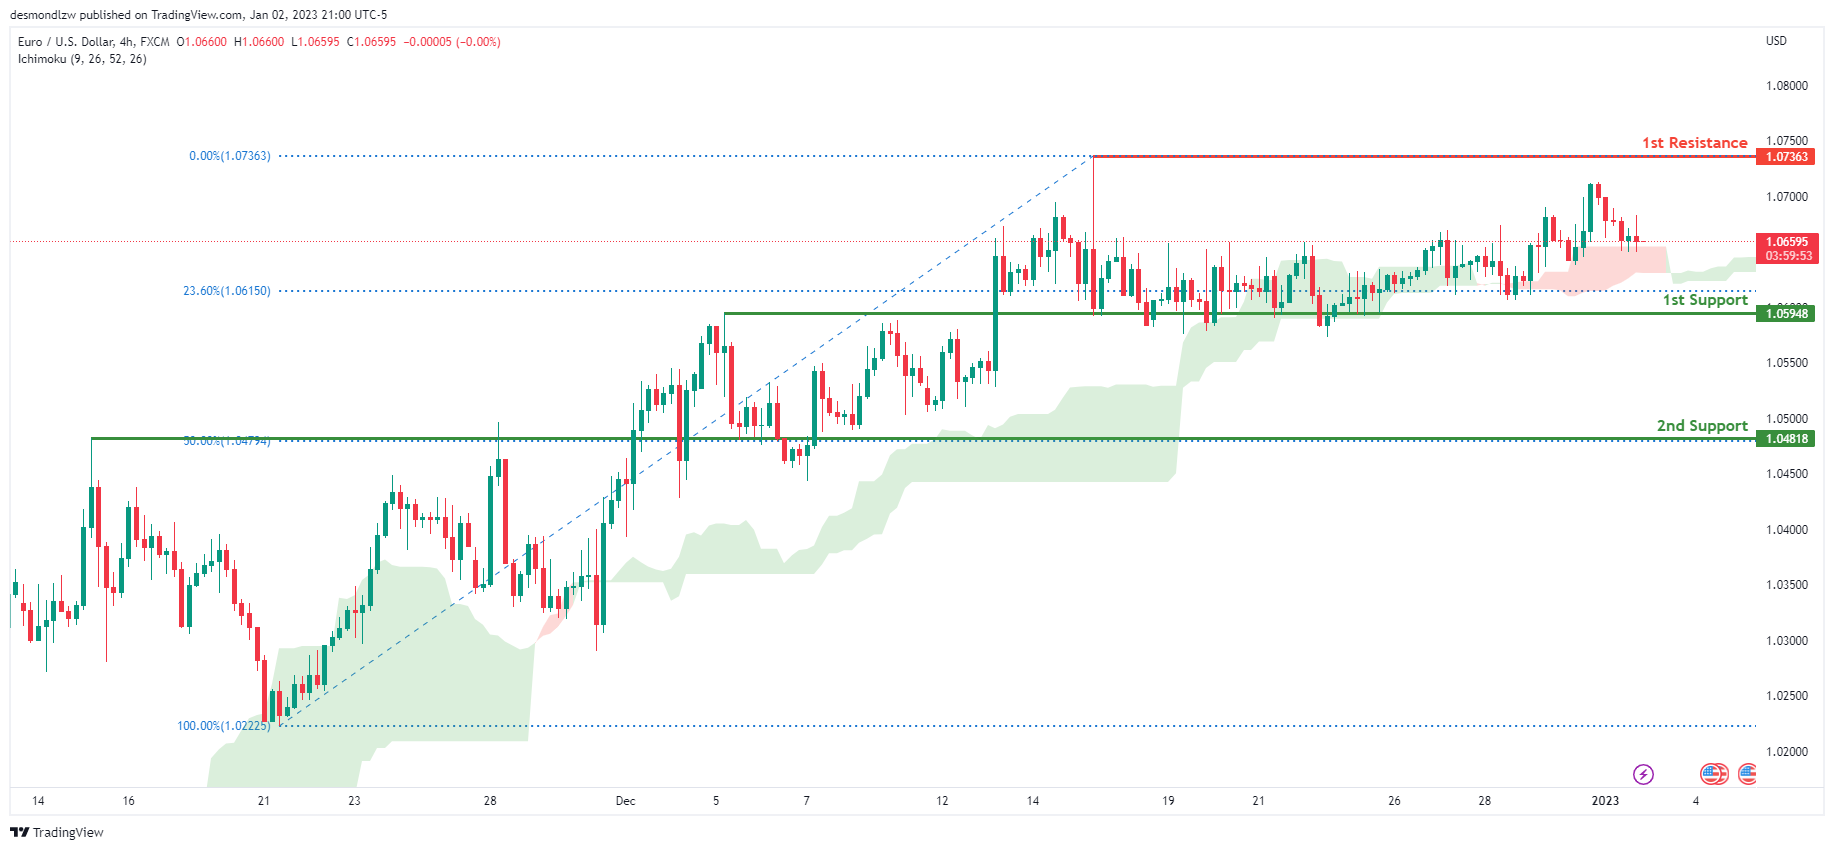
Looking at the H4 chart, my overall bias for EURUSD is bullish due to the current price being above the Ichimoku cloud, indicating a bullish market. If this bullish momentum continues, expect the price to possibly head towards the 1st resistance at 1.07363, where the previous swing high is. In an alternate scenario, price could possibly head back down to retest the 1st support level at 1.05948, where the 23.6% Fibonacci line is.
Areas of consideration :
- H4 1st resistance at 1.07363
- H4 1st support at 1.05948
GBP/USD:
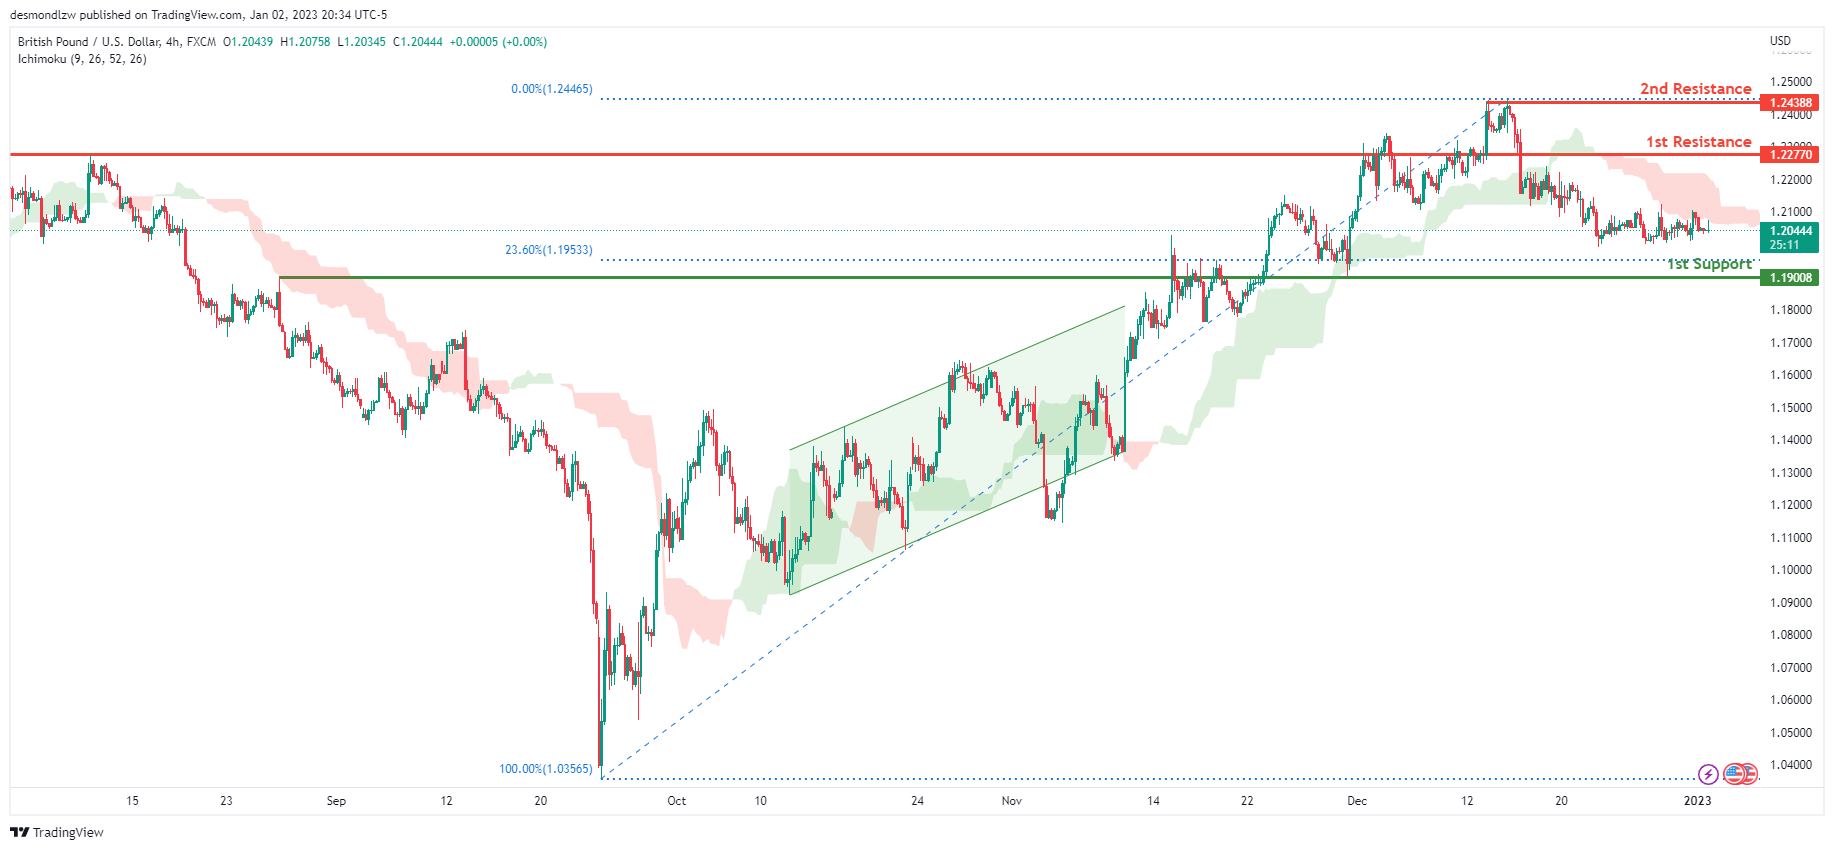
Looking at the H4 chart, my overall bias for GBPUSD is bearish due to the current price being below the Ichimoku cloud, indicating a bearish market. If this bearish momentum continues, expect price to possibly continue heading towards the 1st support at 1.19008, where the 23.6% Fibonacci line is. In an alternate scenario, price could possibly head back up to retest the 1st resistance level at 1.22770, where the previous swing high is.
Areas of consideration:
- H4 1st resistance at 1.22770
- H4 1st support at 1.19008
USD/CHF:
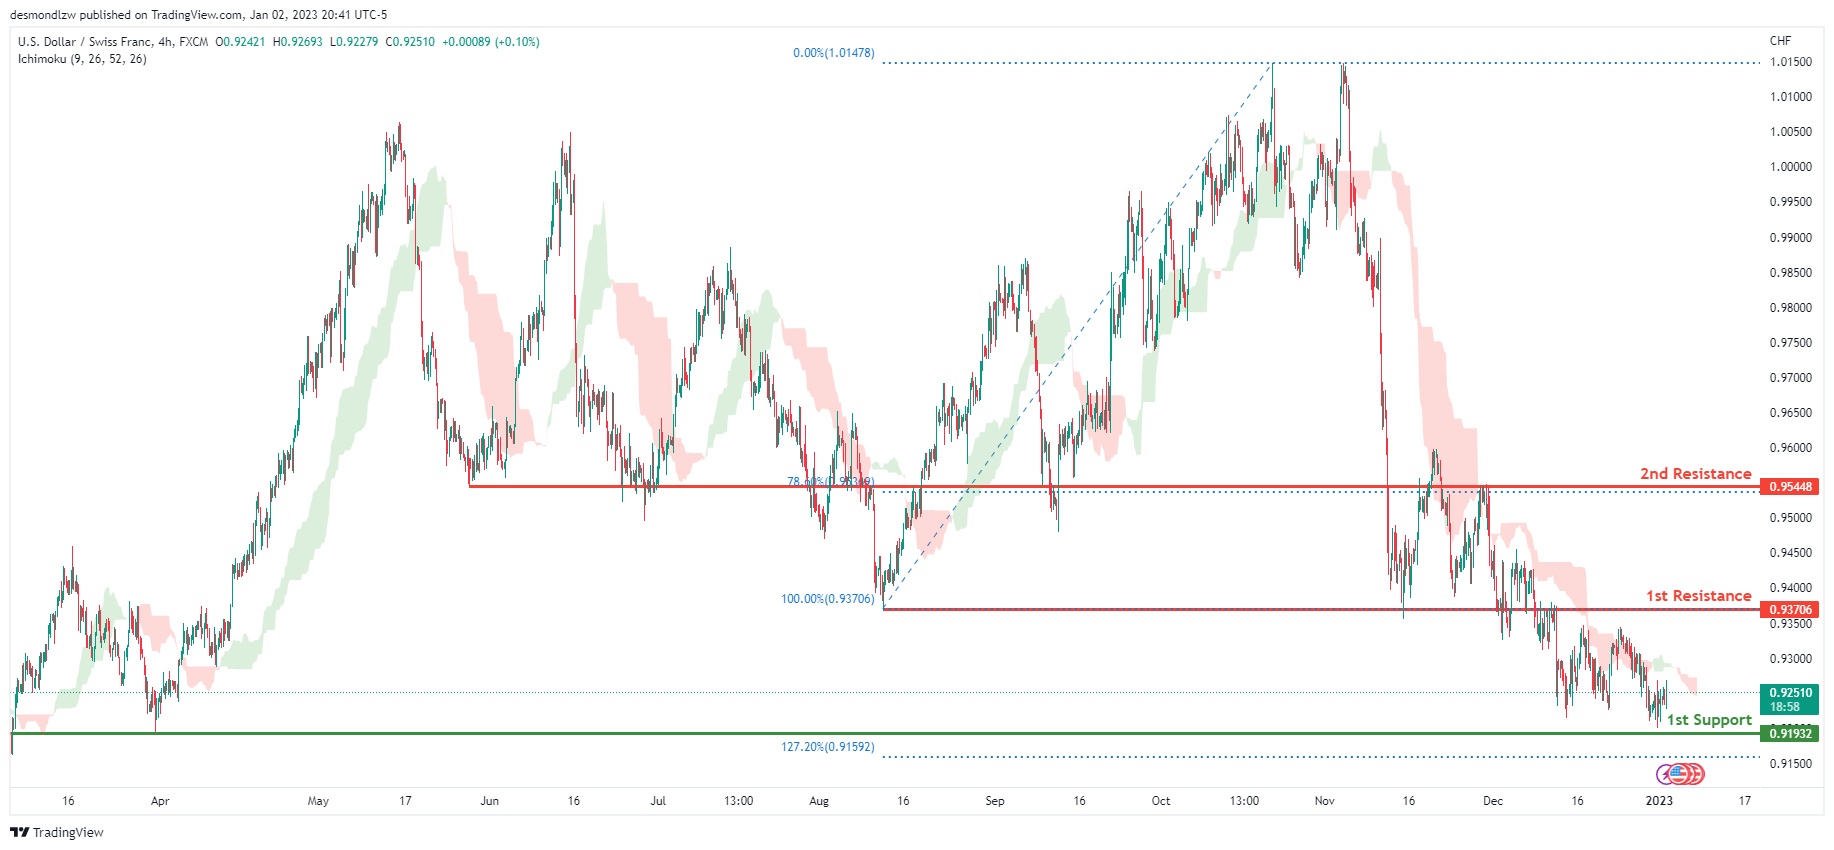
The overall bias for USDCHF on the H4 chart is bearish. In addition, the price is crossing below the Ichimoku cloud, indicating a bearish market. If the current bearish trend continues, expect the price to head back down towards the 1st support line at 0.91932, where the previous swing low and 12.72% Fibonacci extension line is . In an alternative scenario, price could possibly head up towards the 1st resistance at 0.93706, where the previous swing low is .
Areas of consideration
- H4 1st support at 0.91932
- H4 1st resistance at 0.93706
XAU/USD (GOLD):
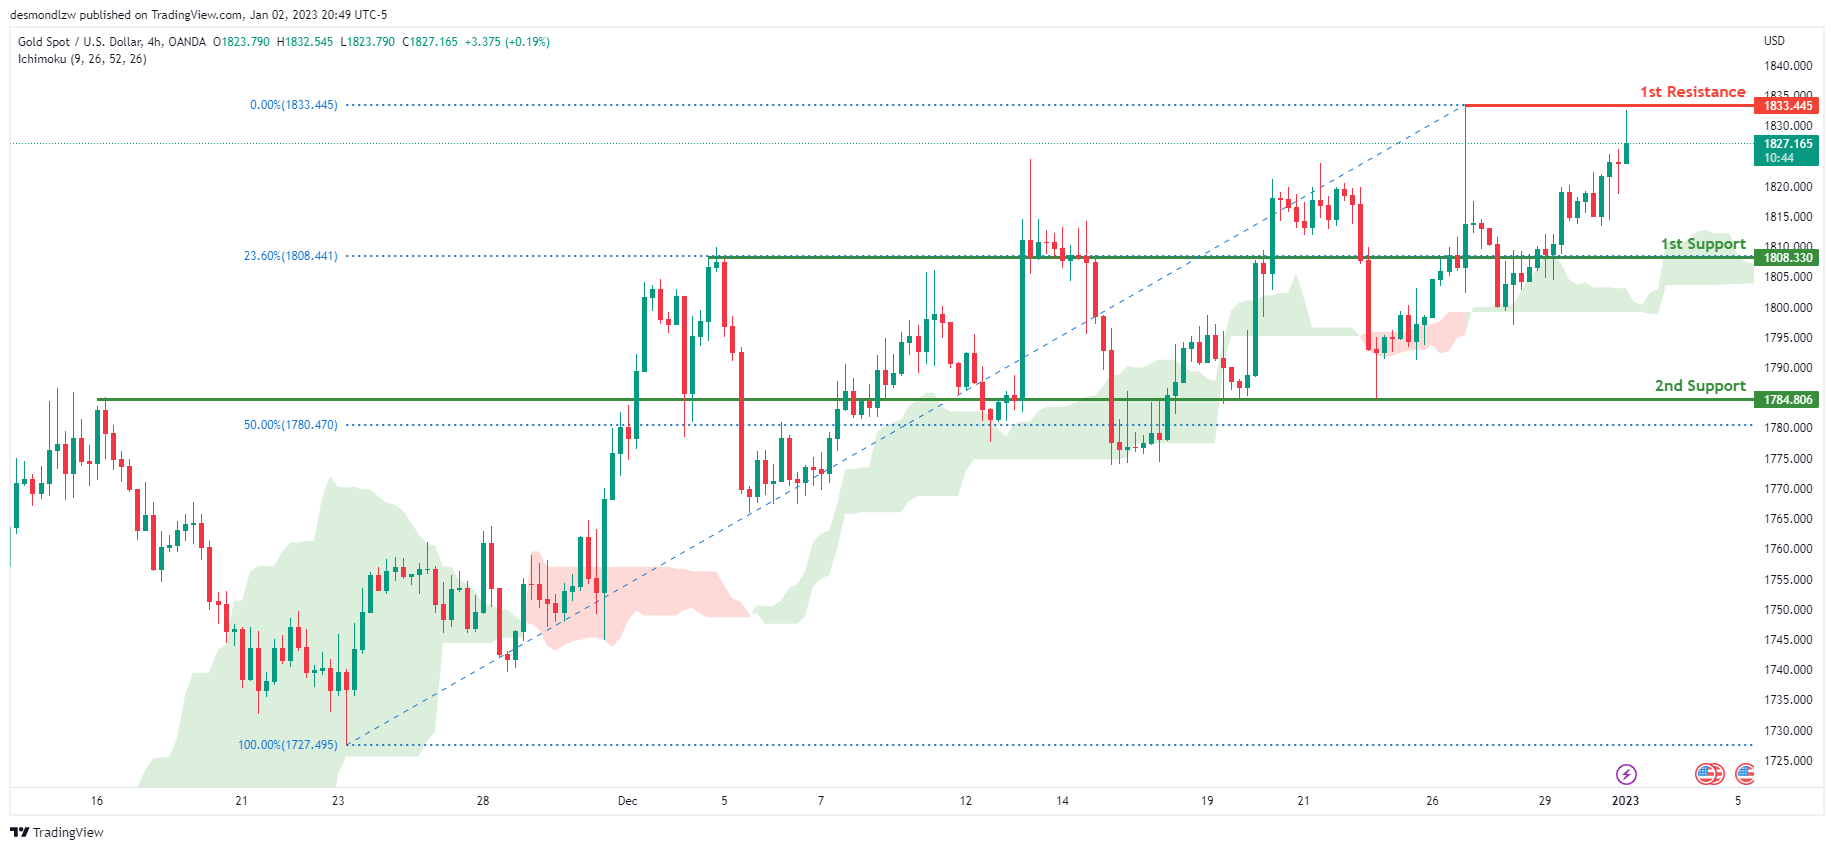
Looking at the H4 chart, my overall bias for XAUUSD is bullish due to the current price crossing above the Ichimoku cloud, indicating a bullish market. If this bullish momentum continues, expect the price to continue heading towards the 1st resistance at 1833.445 where the previous high is. In an alternative scenario, price could possibly head back down towards the 1st support at 1808.330, where the 23.62% Fibonacci line is.
Areas of consideration:
- H4 time frame, 1st resistance at 1833.445
- H4 time frame, 1st support at 1808.330
AUD/USD:
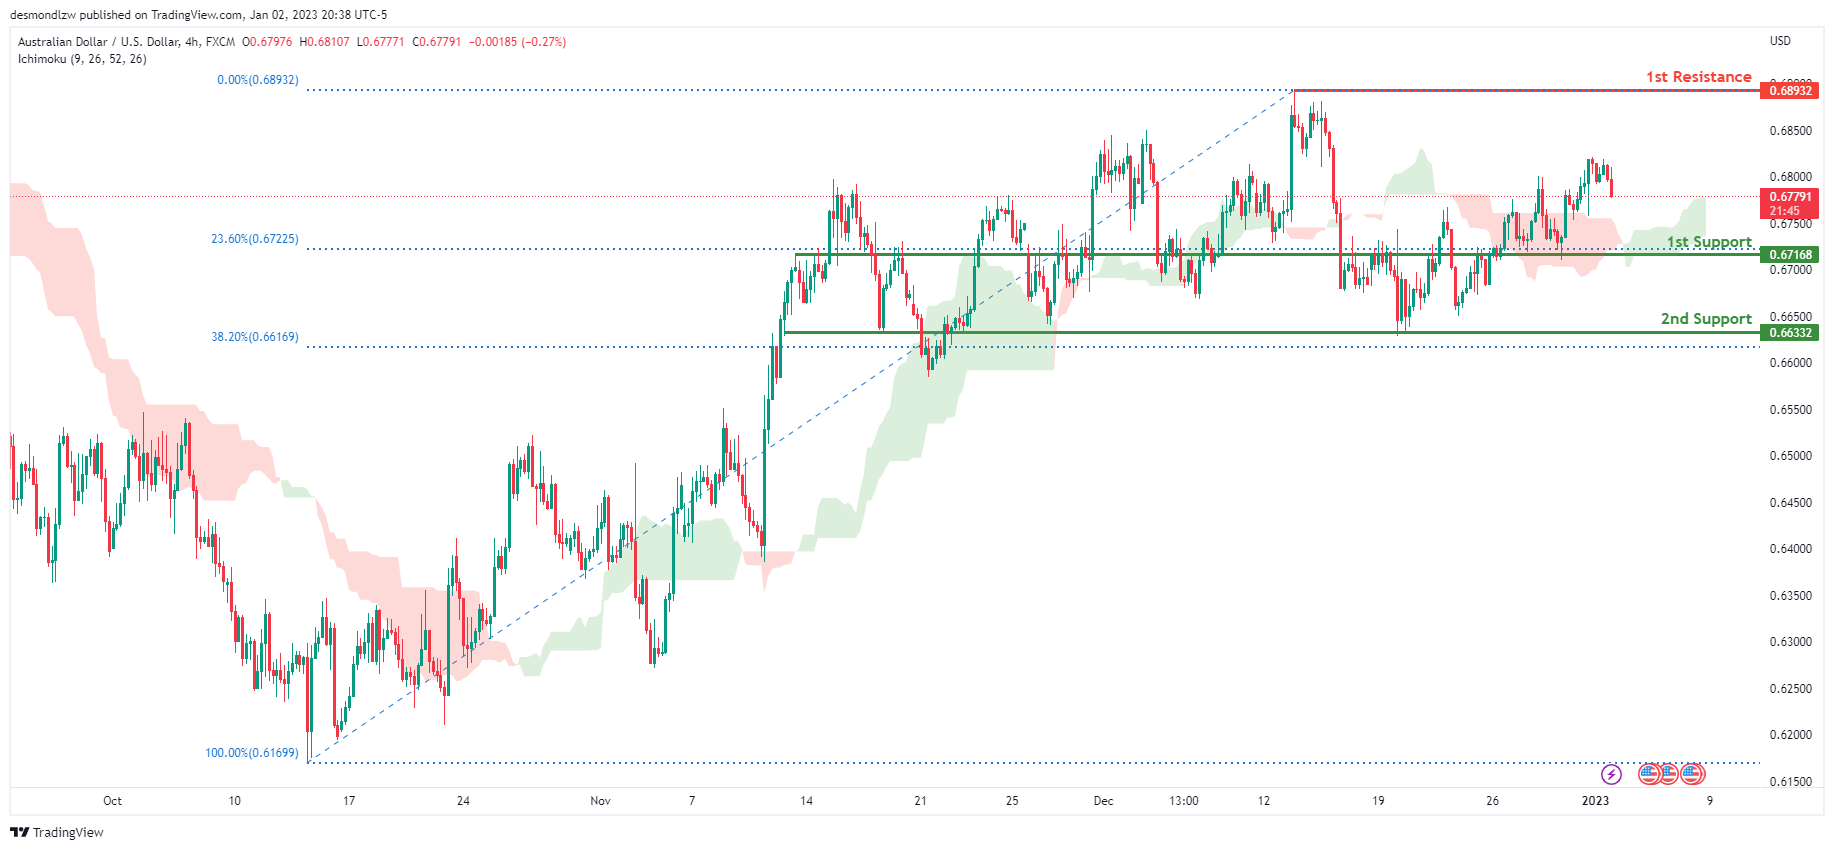
Looking at the H4 chart, my overall bias for AUDUSD is bullish due to the current price being above the Ichimoku cloud, indicating a bullish market. If this bullish momentum continues, expect the price to continue heading towards the 1st resistance at 0.68932, where the recent swing high is. In an alternative scenario, price could possibly head back down towards the 1st support at 0.67168, where the 23.6% Fibonacci line is.
Areas of consideration
- H4, 1st resistance at 0.68932
- H4, 1st support at 0.67168
NZD/USD:
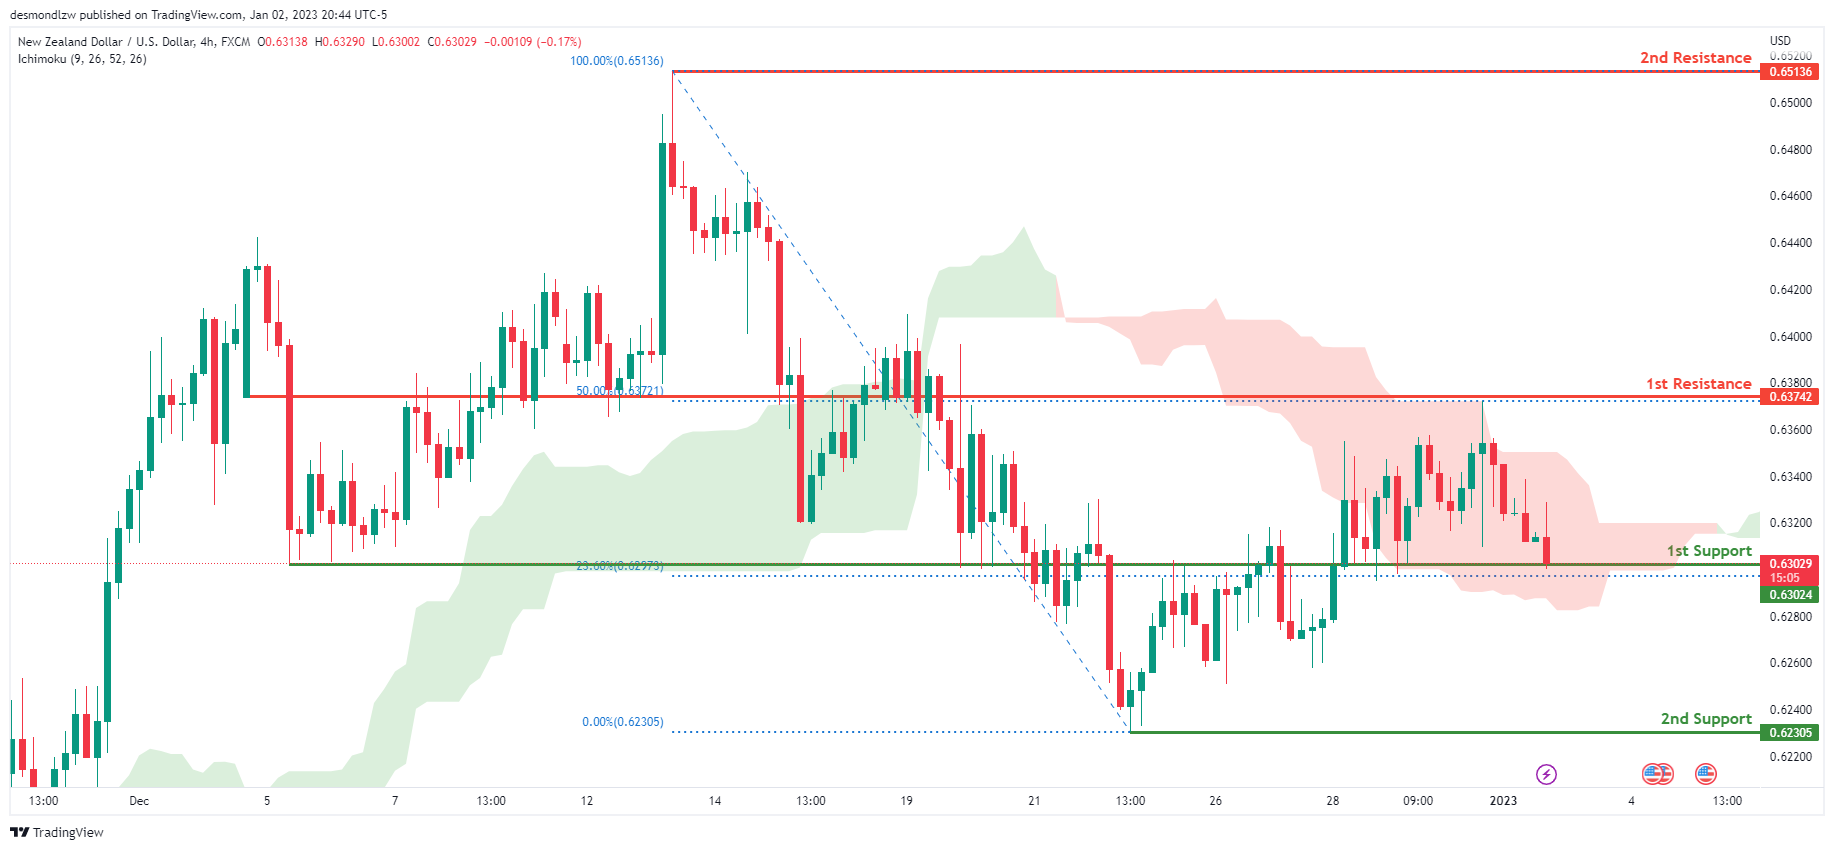
Looking at the H4 chart, my overall bias for NZDUSD is bearish due to the current price crossing below the Ichimoku cloud, indicating a bearish market. If this bearish momentum continues, expect price to possibly break the 1st support at 0.63024, where the 23.6% Fibonacci line is before heading towards the 2nd support at 0.62305, where the previous swing low is. In an alternate scenario, price could possibly head back up towards the 1st resistance level at 0.63742, where the 50% Fibonacci line is.
Areas of consideration:
- H4 time frame, 1st resistance at 0.63742
- H4 time frame, 1st support at 0.63024
USD/CAD:
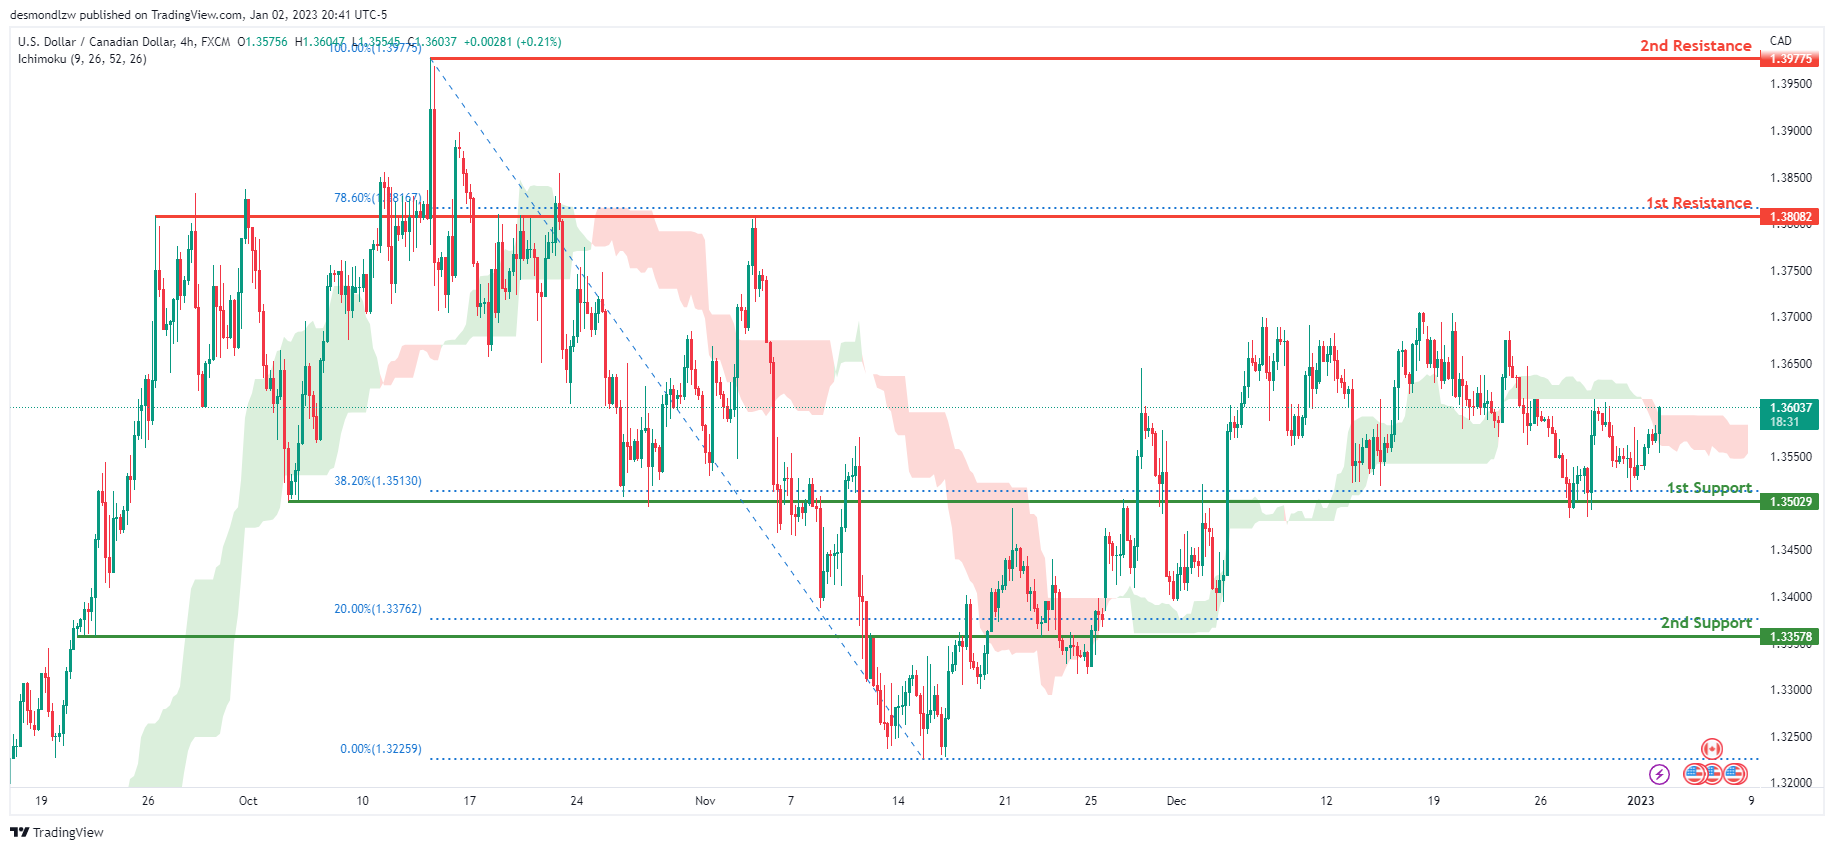
On the H4 chart, the overall bias for USDCAD is bullish . To add confluence to this, the price is above the Ichimoku cloud which indicates a bullish market. If this bullish momentum continues, expect the price to possibly head towards 1st resistance line at 1.38082, where the 78.6% Fibonacci line is. In an alternative scenario, price could break the 1st support at 1.35029, where the 38.2% Fibonacci line is, before heading towards the 2nd support at 1.33578, where the 20% Fibonacci line is.
Areas of consideration:
- H4 time frame, 1st resistance at 1.38082
- H4 time frame, 2nd resistance at 1.39775
- H4 time frame, 1st support at 1.35029
- H4 time frame, 2nd support at 1.33578
OIL:
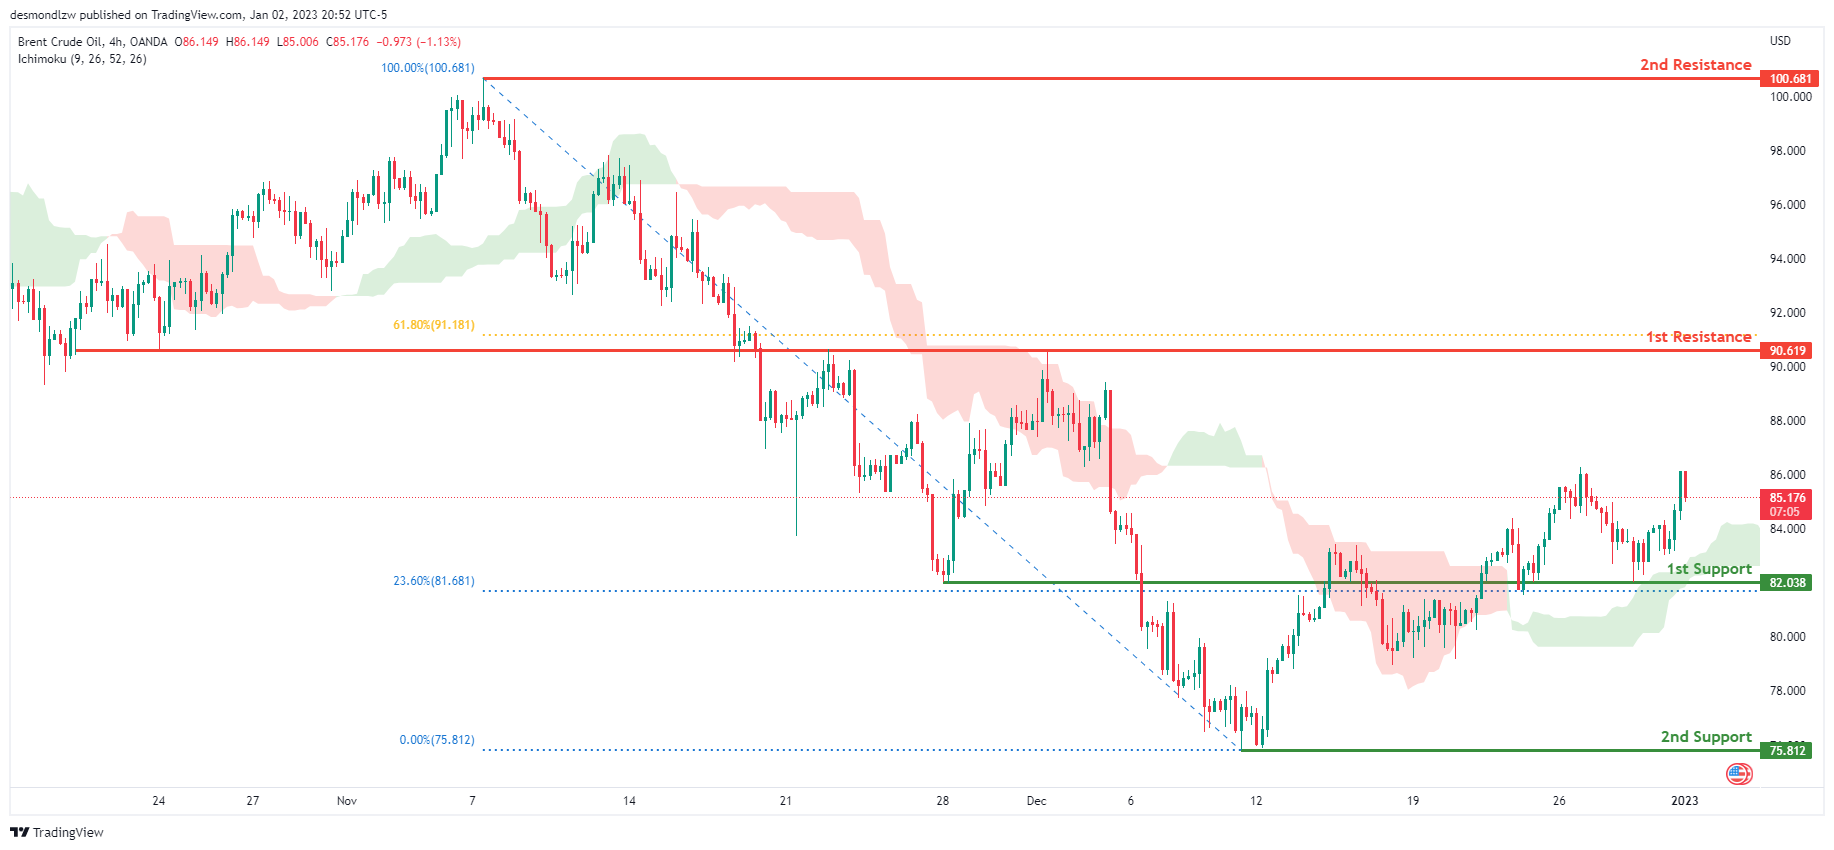
Looking at the H4 chart, my overall bias for BCOUSD is bullish due to the current price being above the Ichimoku cloud, indicating a bullish market. If this bullish momentum continues, expect the price to possibly head towards the 1st resistance at 90.619, where the 61.8% Fibonacci line is. In an alternate scenario, price could possibly head back down to retest the 1st support level at 82.038, where the 23.6% Fibonacci line is.
Areas of consideration:
- H4 time frame, 1st resistance at 90.619
- H4 time frame, 1st support at 82.038
Dow Jones Industrial Average:
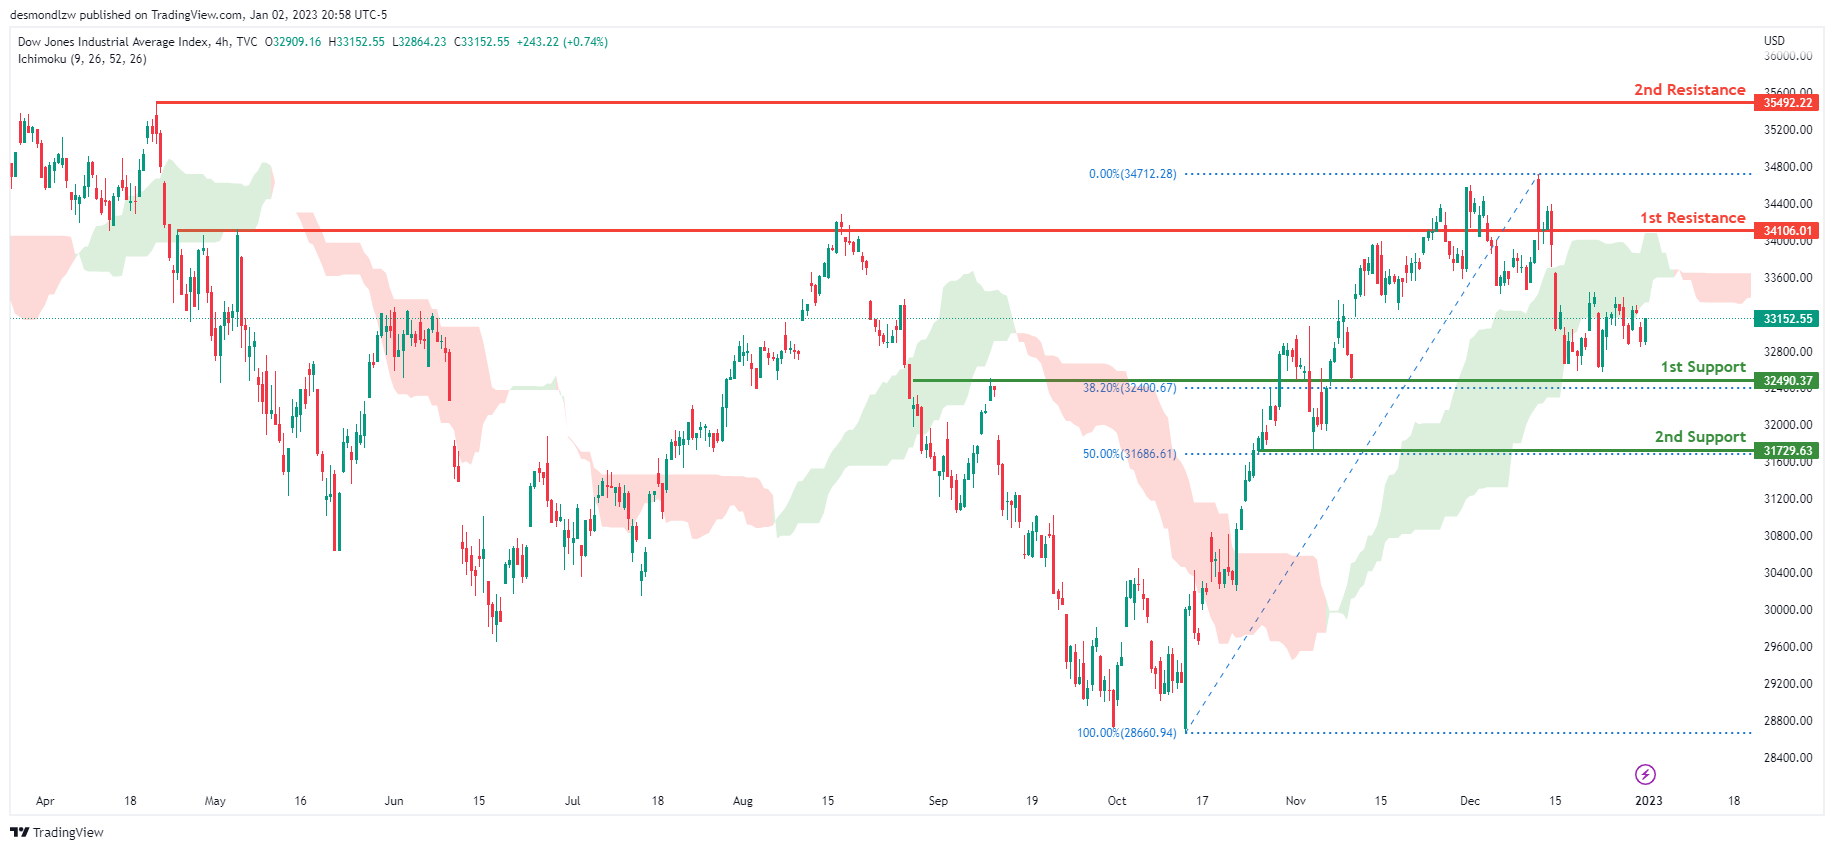
On the H4 chart, the overall bias for DJI is bearish. To add confluence to this, the price is below the Ichimoku cloud which indicates a bearish market. If this bearish momentum continues, expect the price to head back down towards the 1st support at 32490.37, where the 61.8% Fibonacci line is. In an alternative scenario, price could possibly break the 1st resistance line at 34106.01, where the previous swing high is before heading towards the 2nd resistance line at 35492.22, where the previous swing high is.
Areas of consideration:
- H4 time frame, 1st support at 32490.37
- H4 time frame, 1st Resistance at 34106.01
- H4 time frame, 2nd Resistance at 35492.22
DAX:
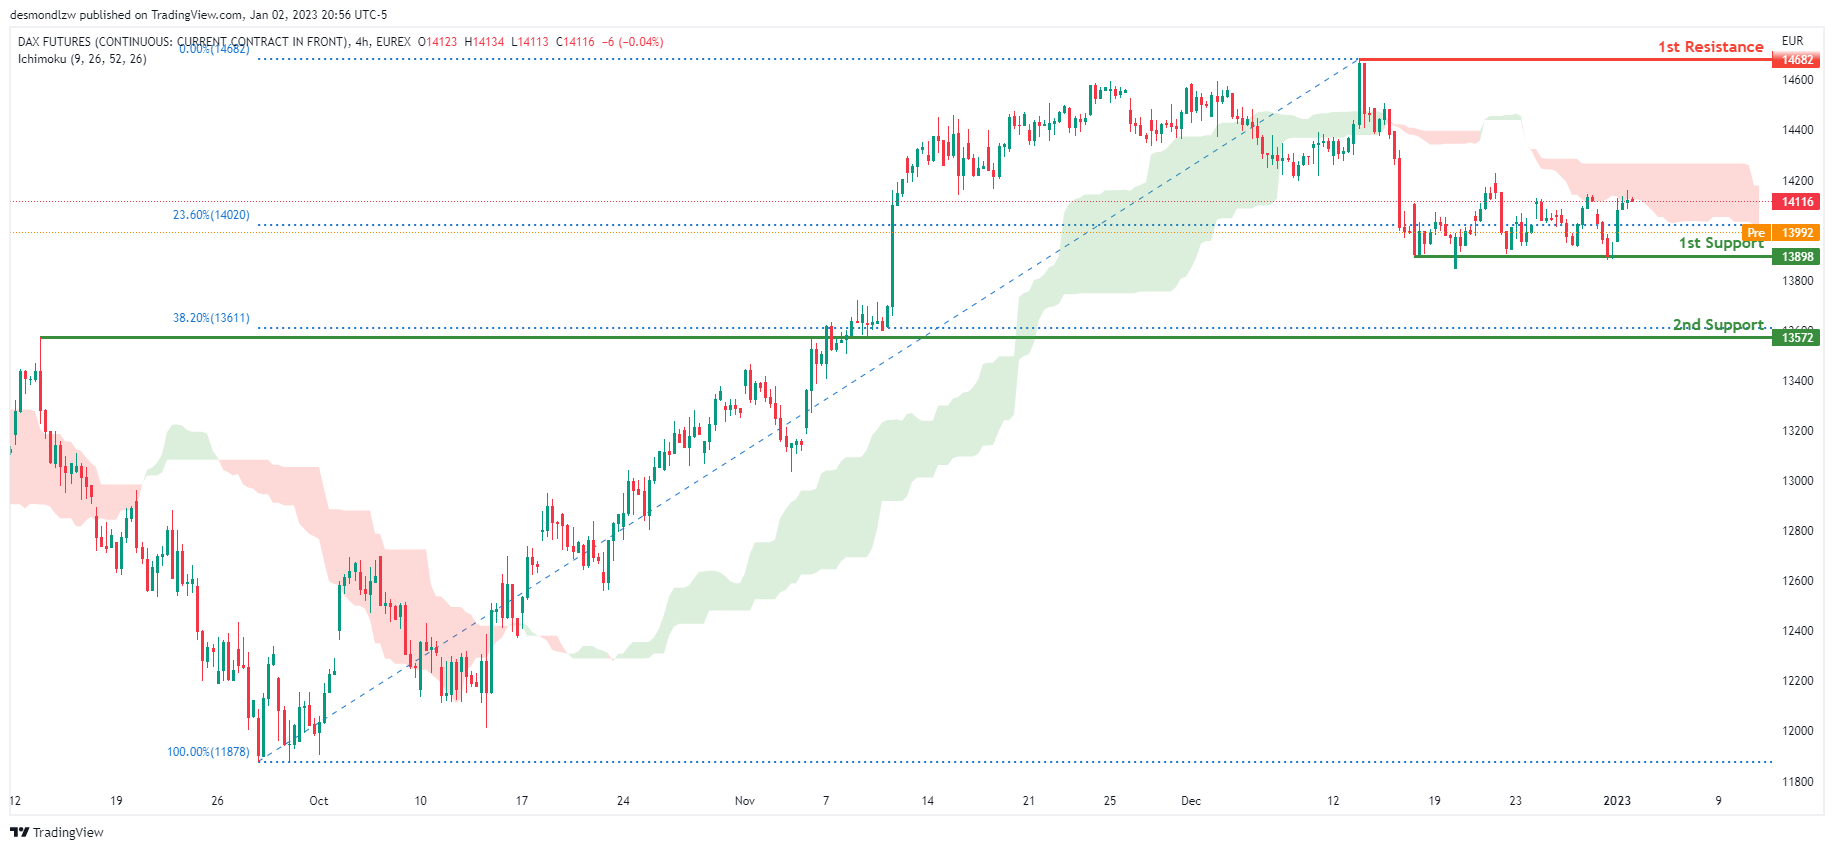
Looking at the H4 chart, my overall bias for DAX is bullish due to the current price crossing above the Ichimoku cloud, indicating a bullish market. If this bullish momentum continues, expect the price to possibly head towards the 1st resistance line at 14682, where the previous swing high is. In an alternative scenario, price could possibly head down to retest the 1st support at 13898, where the 23.6% Fibonacci line is.
Areas of consideration:
- H4 time frame, 1st resistance is at 14682
- H4 time frame, 1st support is at 13898
ETHUSD:
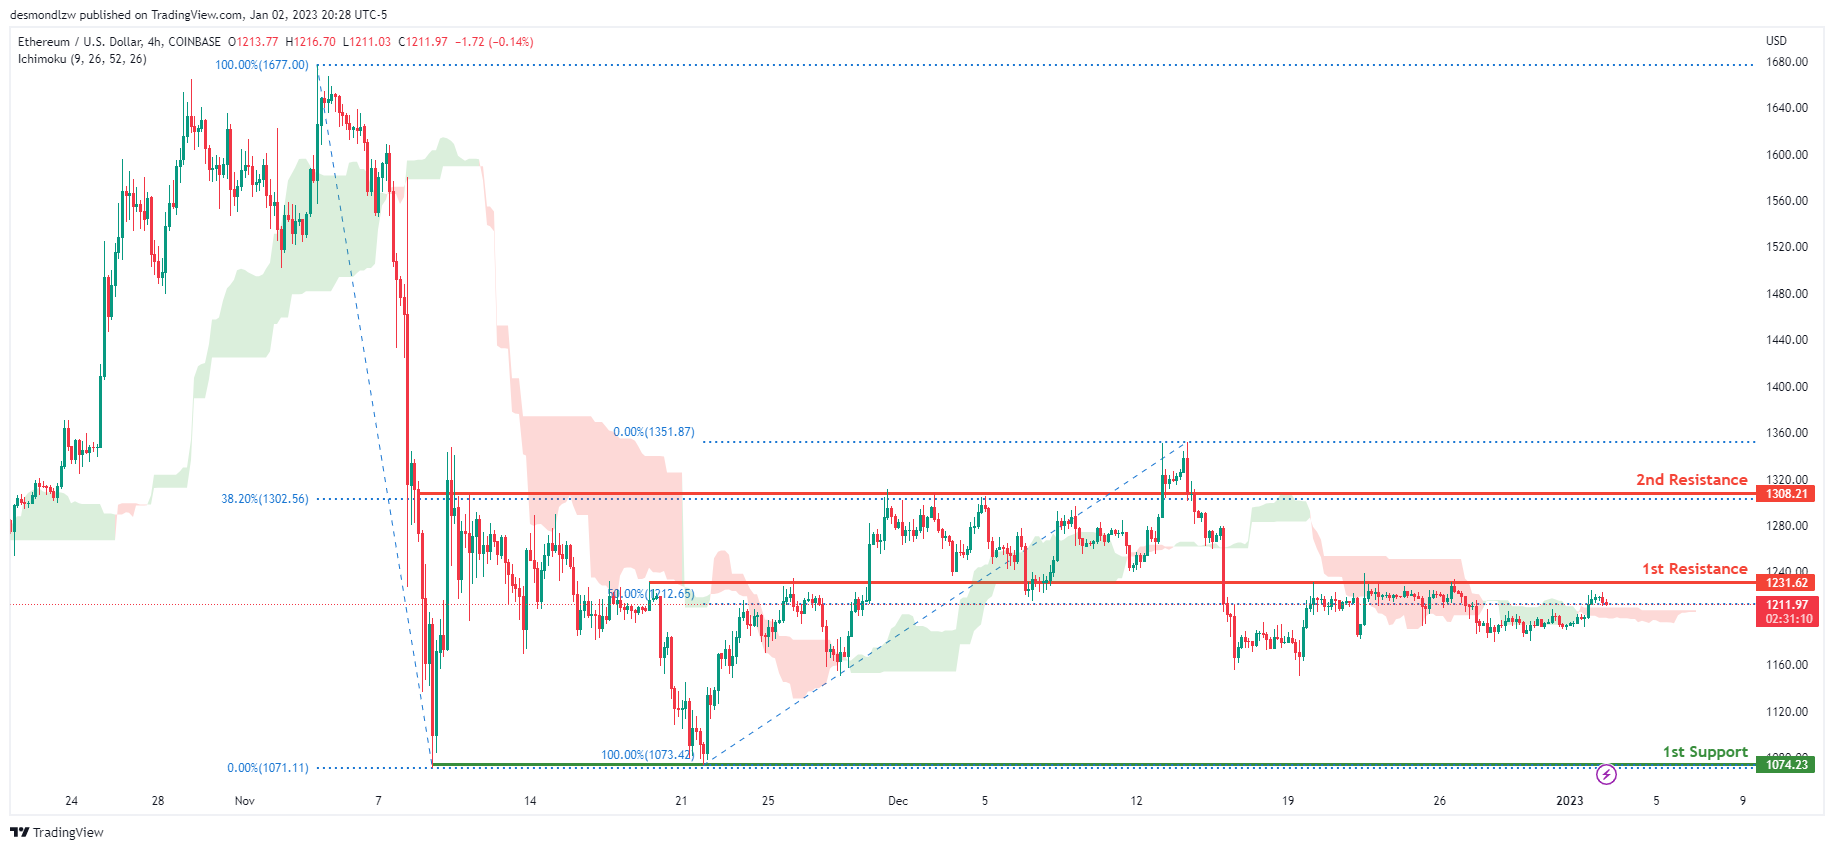
Looking at the H4 chart, my overall bias for ETHUSD is bearish due to the current price crossing below the Ichimoku cloud, indicating a bearish market. If this bearish momentum continues, expect price to head towards the 1st support at 1074.23, where the previous swing low is. In an alternative scenario, price could head back up to break the 1st resistance at 1231.62, where the 50% Fibonacci line is, before heading towards the 2nd resistance at 1308.21, where the 38.2% Fibonacci line is.
Areas of consideration:
- H4 time frame, 1st resistance of 1231.62
- H4 time frame, 2nd resistance of 1308.21
- H4 time frame, 1st support at 1074.23
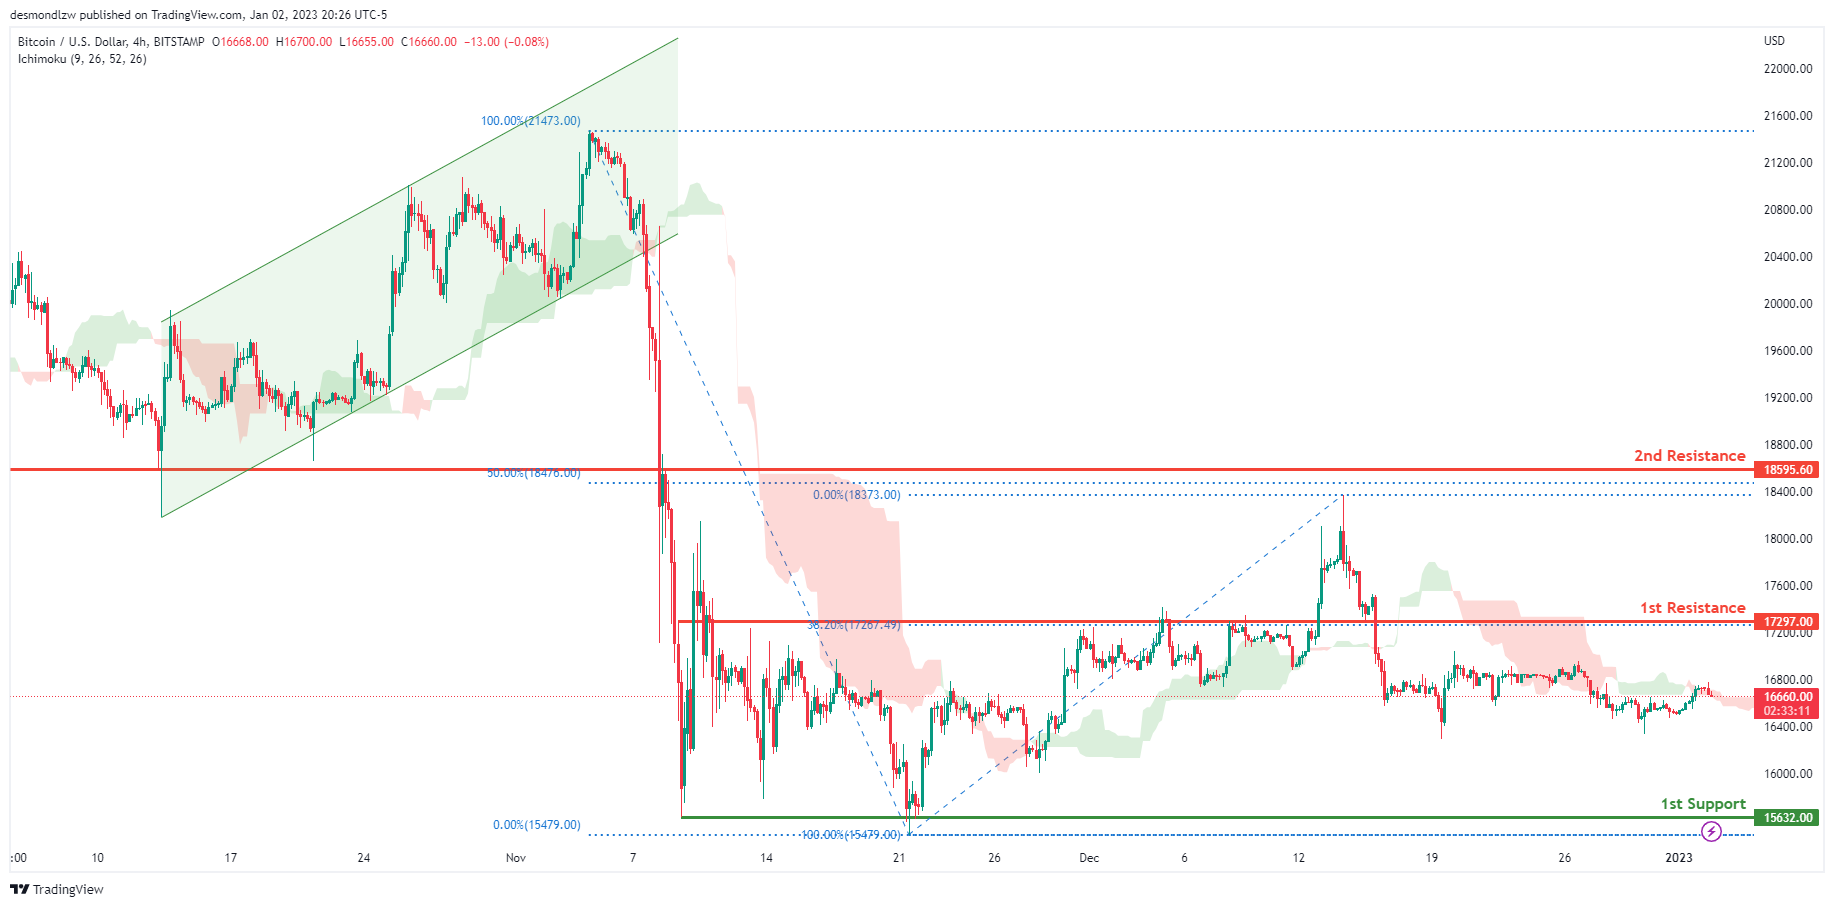
BTCUSD:
Looking at the H4 chart, my overall bias for BTCUSD is bearish due to the current price crossing below the Ichimoku cloud, indicating a bearish market. To add support to this bias, price has also broken down through the bullish ascending channel. If this bearish momentum continues, expect price to possibly continue heading towards the 1st support at 15632.00, where the previous swing low is. In an alternative scenario, price could possibly head up towards the 1st resistance at 17297.00, where the 38.2% Fibonacci line is.
Areas of consideration:
- H4 time frame, 1st resistance 17297.00
- H4 time frame, 1st support at 15632.00
S&P 500:
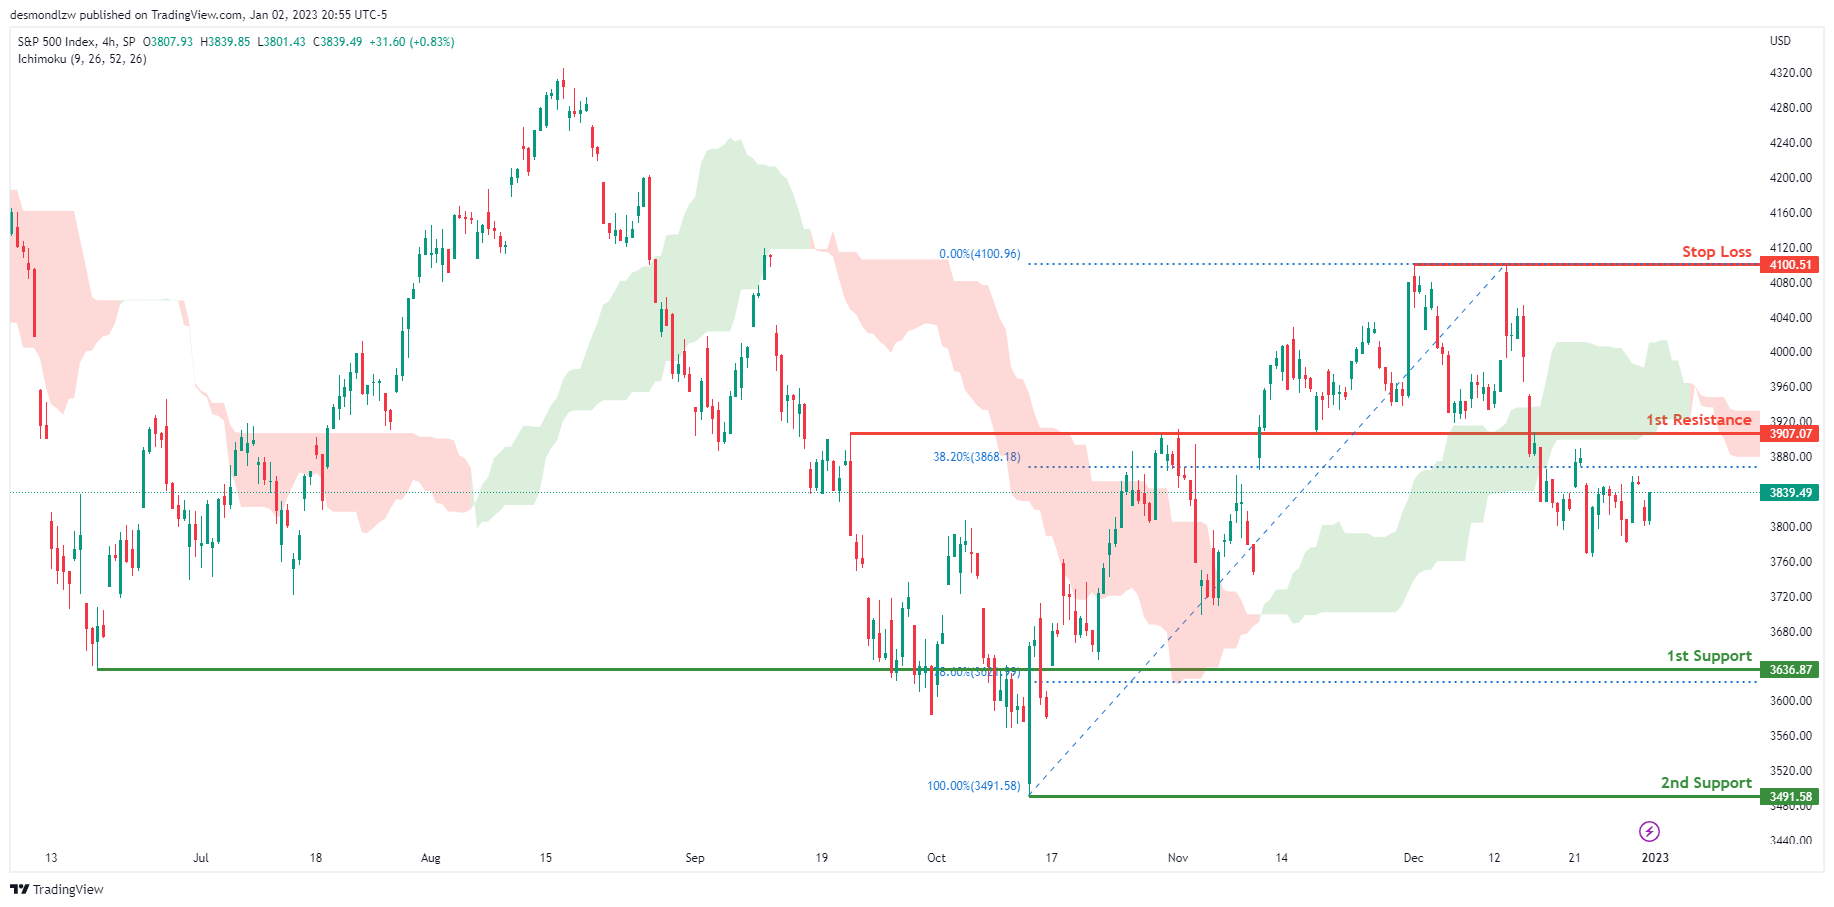
Looking at the H4 chart, my overall bias for S&P500 is bearish due to the current price being below the Ichimoku cloud, indicating a bearish market. If this bearish momentum continues, expect the price to continue heading towards the 1st support at 3636.87, where the 78.6% Fibonacci line is. In an alternative scenario, price could possibly head back up to retest the 1st resistance at 3907.07, where the 38.2% Fibonacci line is.
Areas of consideration:
- H4 time frame, 1st support at 3636.87
- H4 time frame, 1st resistance at 3907.07
Impulsive Decline in CADJPY Nearing the End
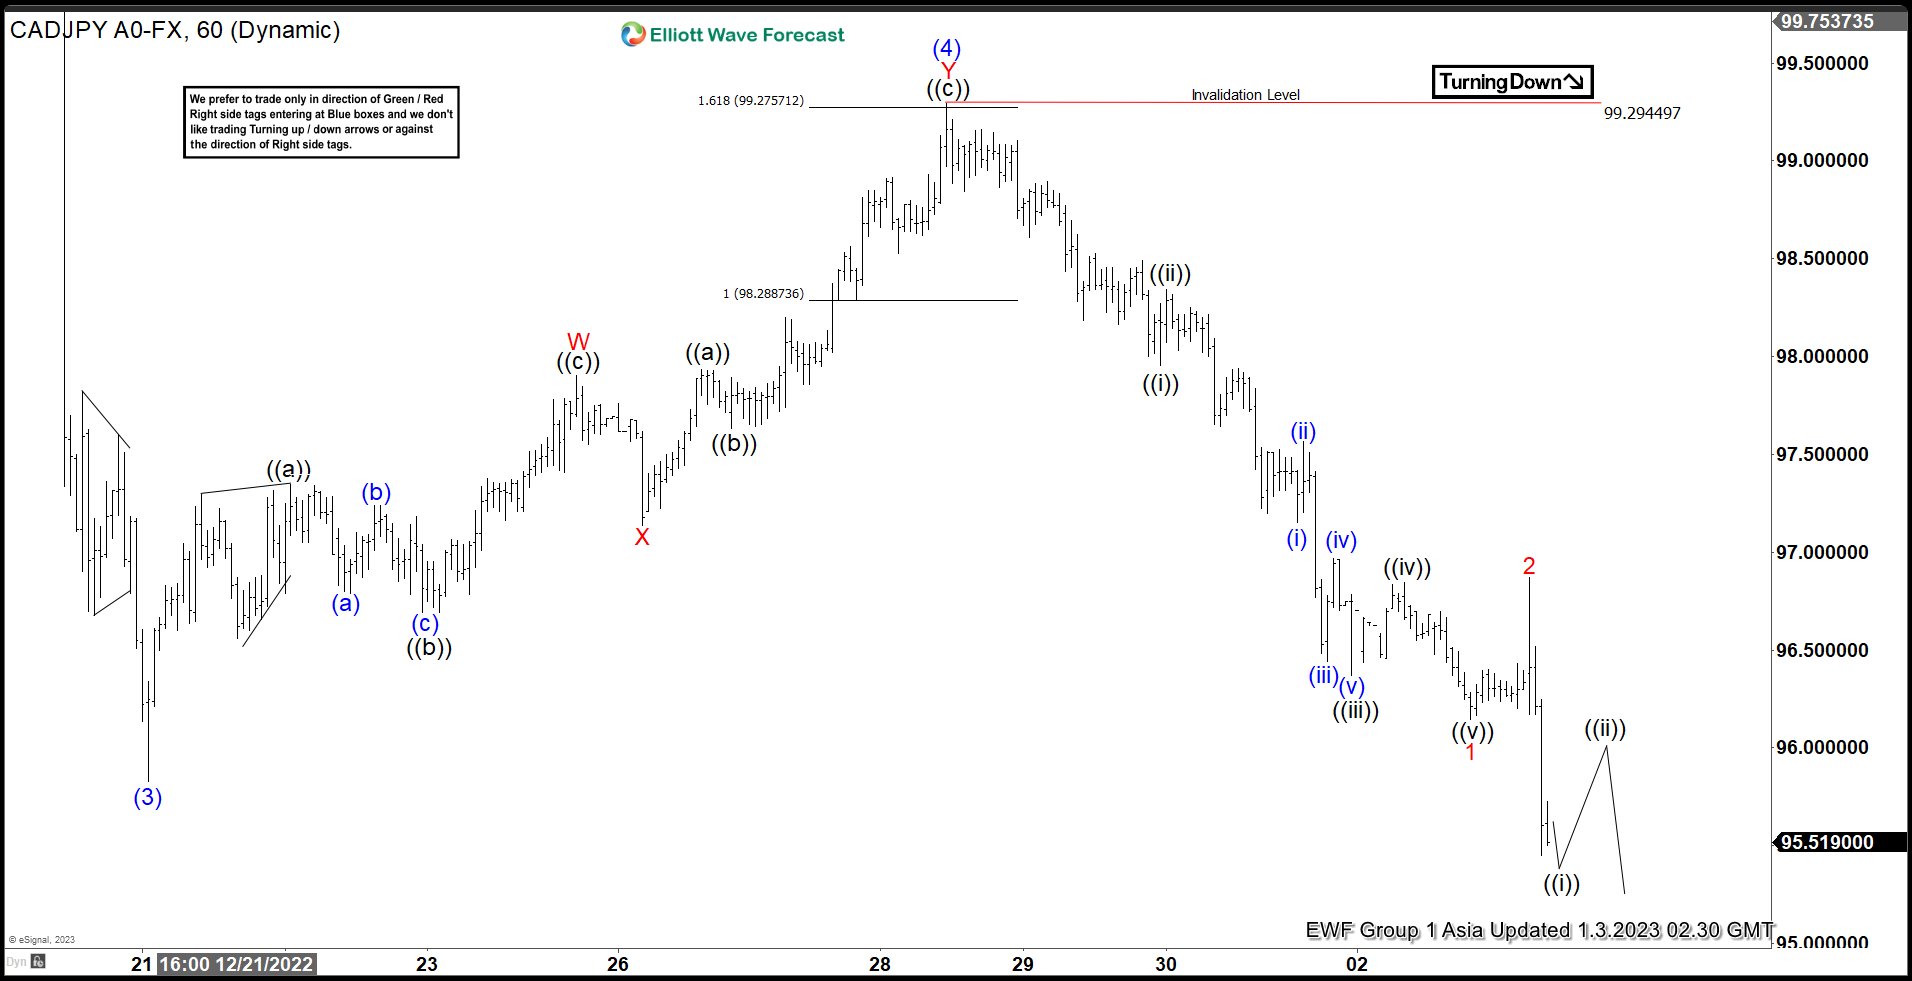
Cycle from 9.13.2022 high is in progress as a 5 waves impulse Elliott Wave structure and the structure is nearing the end. Down from 9.13.2022 high, wave (1) ended at 104.51, and wave (2) rally ended at 110.35. Pair declines lower in wave (3) towards 95.86 as the 1 hour chart below shows. Rally in wave (4) ended at 99.29 with internal subdivision as a double three Elliott Wave. Up from wave (3), wave W ended at 97.9 and pullback in wave X ended at 97.138. Final leg higher wave Y ended at 99.296 which completed wave (4) in higher degree.
Wave (5) lower is now in progress with internal subdivision as an impulse in lesser degree. Down from wave (4), wave ((i)) ended at 97.95 and wave ((ii)) ended at 98.34. Pair extends lower in wave ((iii)) towards 96.84, and wave ((iv)) ended at 96.84. Final leg lower wave ((v)) ended at 96.14 which completed wave 1. Rally in wave 2 ended at 96.87 and pair has extended lower again. Near term, as far as pivot at 99.29 high stays intact, expect rally to fail in 3, 7, 11 swing for further downside.
CADJPY 60 Minutes Elliott Wave Chart
https://www.youtube.com/watch?v=6cB1Vxr2VTw
USD/JPY, CAD/JPY, CHF/JPY downside breakout as Yen surges
Yen opens the year with a strong note and rises to a six-month high against Dollar. The strength is also broad based. The move extends the rally since BoJ's decision to raise the cap on 10-year JGB yield last month. There is some expectation of further tweak of the yield curve control in the early part of this year, or even an exit of the decade long ultra-loose monetary policy.
USD/JPY's break of 130.55 support confirms resumption of whole down trend from 151.93. Near term outlook will stay bearish as long as 134.49 resistance holds in case of recovery. Sustained trading below 55 week EMA (now at 131.65) would pave the way to 61.8% retracement of 102.58 to 151.93 at 121.43 in the medium term.
CAD/JPY's break of 95.83 also indicate resumption of whole down trend from 110.87. Near term outlook will remain bearish as long as 99.28 resistance holds, in case of recovery. Next medium term target is 61.8% retracement of 73.80 to 110.87 at 87.96.
Even the relatively resilient CHF/JPY is resuming the fall from 151.43. Rejection below 55 day EMA is a bearish sign. Fall from 151.43 would target 55 week EMA (now at 138.19), or even further to 38.2% retracement to 38.2% retracement of 106.71 to 151.43 at 134.34.
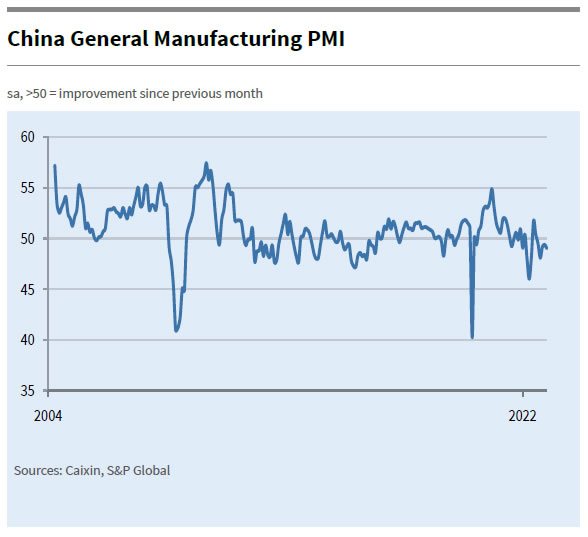
China Caixin PMI manufacturing fell to 49.0, infections expected to explode in short term
China Caixin PMI Manufacturing fell from 49.4 to 49.0 in December, below expectation of 49.3. Caixin added that production declined further albeit at a slower rate. Steeper fall was seen in new orders. But business confidence improved to 10-month high.
Wang Zhe, Senior Economist at Caixin Insight Group said: "Covid outbreaks rapidly spread across China in November, causing a number of macroeconomic indicators to fall sharply and adding to pressure on the economy. On Dec. 7, China announced 10 new measures to further optimize Covid containment. In the short term, infections are expected to explode, which will severely interfere with production and everyday life. How to effectively coordinate Covid controls with economic and social development has once again become a crucial question."
Bundesbank Nagel: Further policy action needed to halt and reverse rising inflation expectations
Bundesbank President Joachim Nagel warned in an interview, "our monthly surveys of firms and households are showing a significant increase in long-term inflation expectations."
"I firmly believe that we need to take further monetary policy action to halt and reverse this trend," he added.
Nagel also said that allowing inflation to become entrenched would be even worse. "Then we would be forced to tighten policy all the more sharply further down the line, thus placing even more of a strain on the economy."
"I am optimistic that Germany will be able to avoid a severe economic slump and we will get off lightly with a mild downturn. And I am confident that we will be able to tame the high rate of inflation over the medium term", he noted.
"There is a distinct risk of stronger second-round effects because the higher wage deals that are being reached could prolong the prevailing period of high inflation rates"