Sample Category Title
Bundesbank Nagel: Further policy action needed to halt and reverse rising inflation expectations
Bundesbank President Joachim Nagel warned in an interview, "our monthly surveys of firms and households are showing a significant increase in long-term inflation expectations."
"I firmly believe that we need to take further monetary policy action to halt and reverse this trend," he added.
Nagel also said that allowing inflation to become entrenched would be even worse. "Then we would be forced to tighten policy all the more sharply further down the line, thus placing even more of a strain on the economy."
"I am optimistic that Germany will be able to avoid a severe economic slump and we will get off lightly with a mild downturn. And I am confident that we will be able to tame the high rate of inflation over the medium term", he noted.
"There is a distinct risk of stronger second-round effects because the higher wage deals that are being reached could prolong the prevailing period of high inflation rates"
Japanese Yen’s Rally Continues
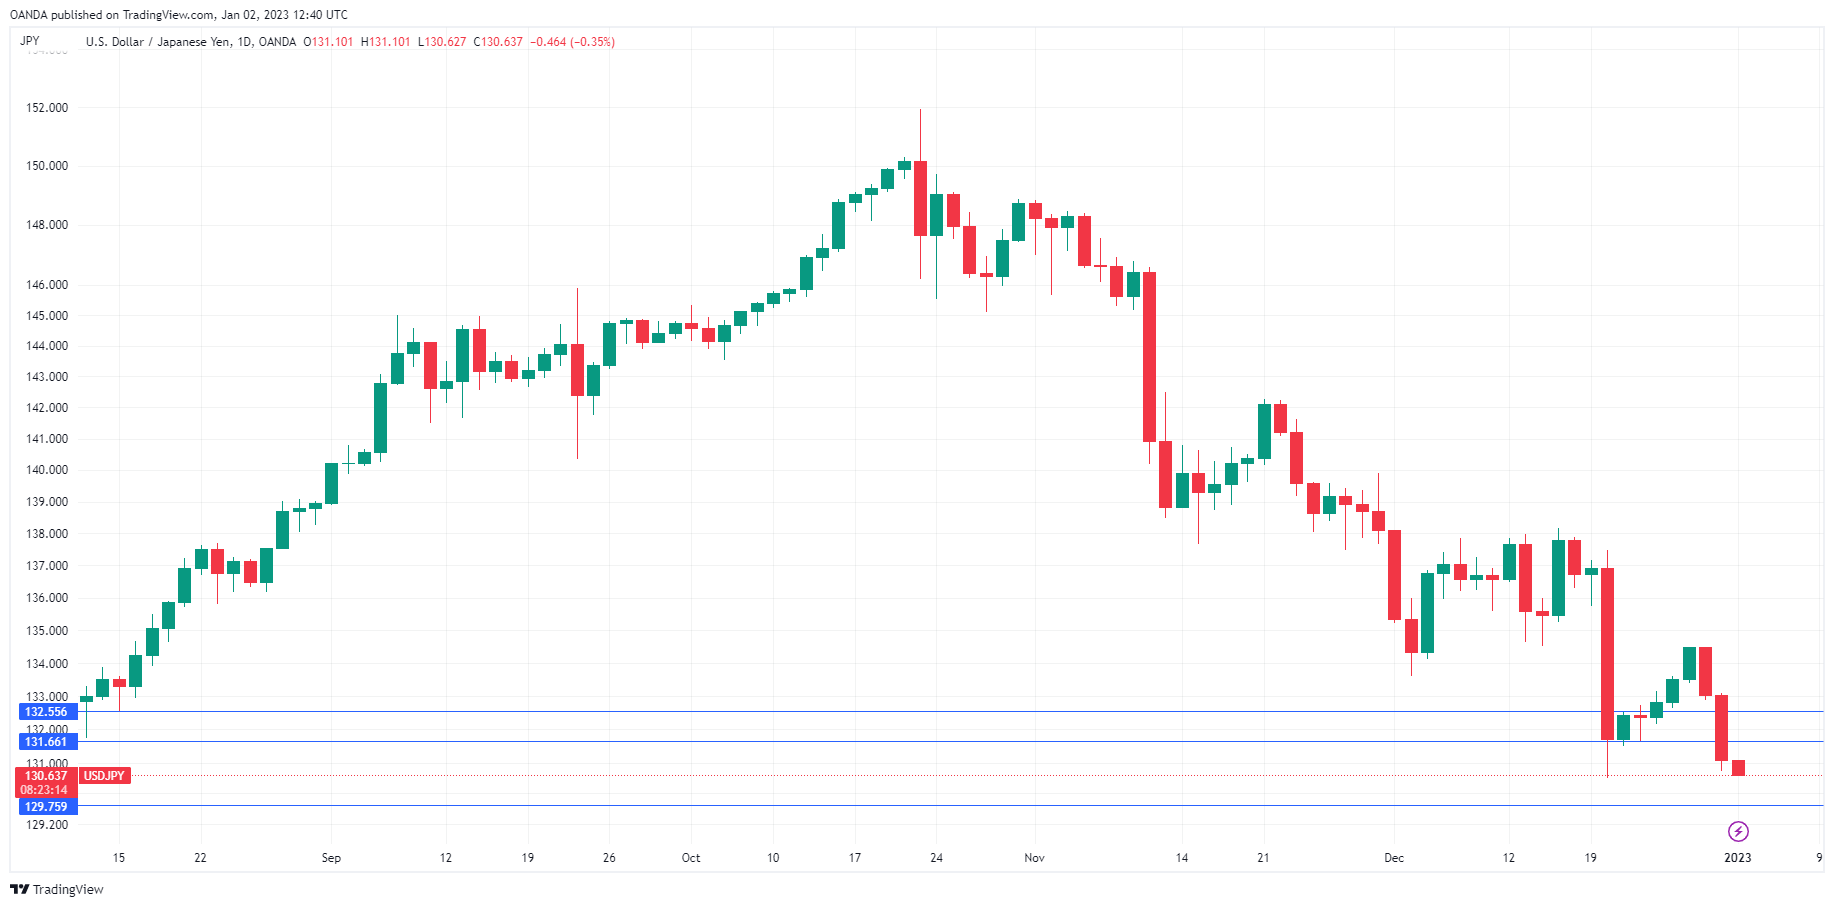
The Japanese yen is in positive territory on the first trading day of the new year. US and Japan markets are both closed today, and the yen will likely continue to remain calm in holiday-thinned trading. Currently, USD/JPY is trading at 130.65, down 0.34%.
Markets keep an eye on BoJ
There are no tier-1 events out of Japan this week, but investors will be nevertheless keeping a close eye on the surging Japanese yen. The currency had a long slide for most of 2022 and fell below 151 in October, its lowest level in 24 years. This forced the Ministry of Finance to intervene in the currency markets. The yen has made a remarkable comeback since then, rising about 11%. The Bank of Japan shocked the markets in December when it widened the yield curve band from 0.25% to 0.50%. The move sent the yen sharply higher and has raised speculation that the Bank of Japan could be planning to exit its massive stimulus programme, although the BoJ has denied it has any such plans. The Bank of Japan holds its next meeting on January 18th.
What made the BoJ move so dramatic is that the markets were expecting the BoJ to remain in cruise control until BoJ Governor Kuroda’s term ends in April, after a decade at the helm of the central bank. BoJ policy could well change, depending on the new governor, but Kuroda has demonstrated that he is not shy about making policy moves at the end of his term and the markets will watching for further measures which could shake up the Japanese yen.
The yen may have bounced back over the past two months, but USD/JPY has still gained 13.7% in 2022, which is the yen’s worst performance since 2013. The driver behind the yen’s descent was the BoJ’s ultra-loose policy, which capped 10-year yields at 0.25%, contributing to a constantly widening US/Japan rate differential. The BoJ’s tweak which widened the yield curve band to 0.50% has given the yen a boost, but we’ll have to wait to see if the yen can hold onto these recent gains.
USD/JPY Technical
- USD/JPY faces resistance at 131.66 and 132.55
- There is support at 129.76 and 128.41
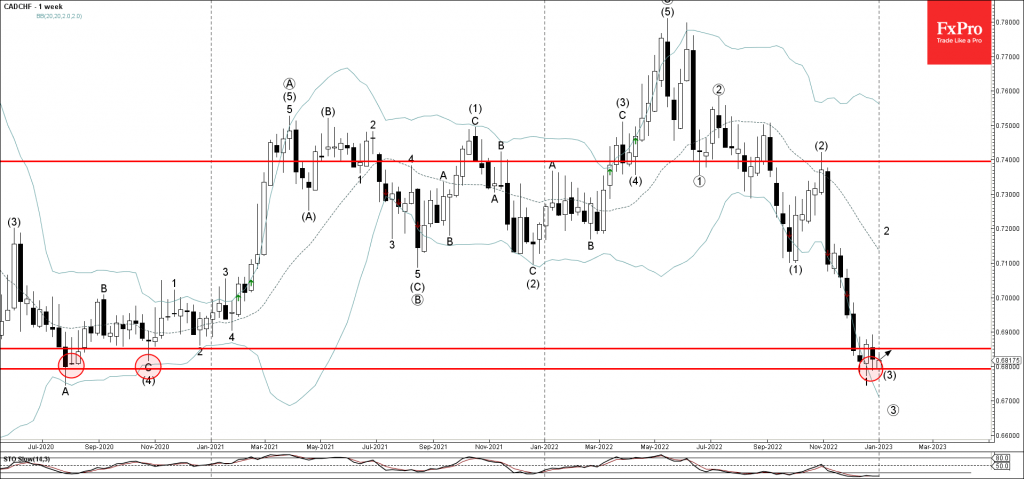
CADCHF Wave Analysis
- CADCHF reversed from support level 0.6790
- Likely to rise to resistance level 0.6850
CADCHF recently reversed up from the key long-term support level 0.6790 (which has been reversing the price from the middle of 2020, as can be seen from the weekly CADCHF chart below).
The support area near the support level 0.6790 was strengthened by the lower weekly Bollinger band.
Given the oversold reading on the weekly Stochastic indicator, CADCHF can be expected to rise further toward the next resistance level 0.6850.
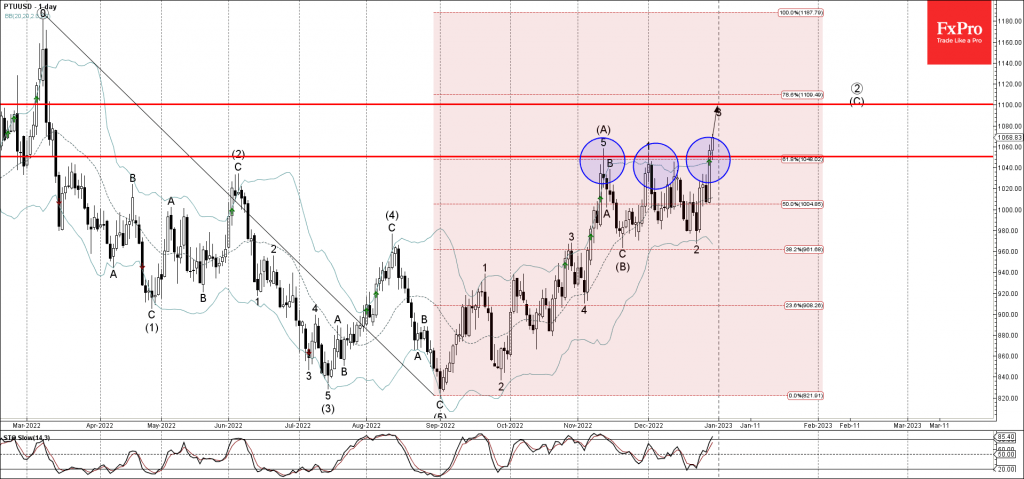
Platinum Wave Analysis
- Platinum broke key resistance level 1050.00
- Likely to rise to resistance level 1100.00
Platinum recently broke above the key resistance level 1050.00 (which stopped the previous waves (A) and 1, as can be seen below).
The breakout of the resistance level 1050.00 coincided with the breakout of the 61.8% Fibonacci correction of the previous extended downward impulse from the start of March.
Platinum can be expected to rise further toward the next resistance level 1100.00 (target price for the completion of the active impulse wave (C)).
Crypto Bulls Try to Encourage Buyers
Bitcoin has added 1.4% in the last 24 hours, reaching the 16.7K level. It is a new attempt to test the 50-day moving average on a general lull and an effort by the bulls to paint a more optimistic technical picture with less strength while liquidity remains depressed.
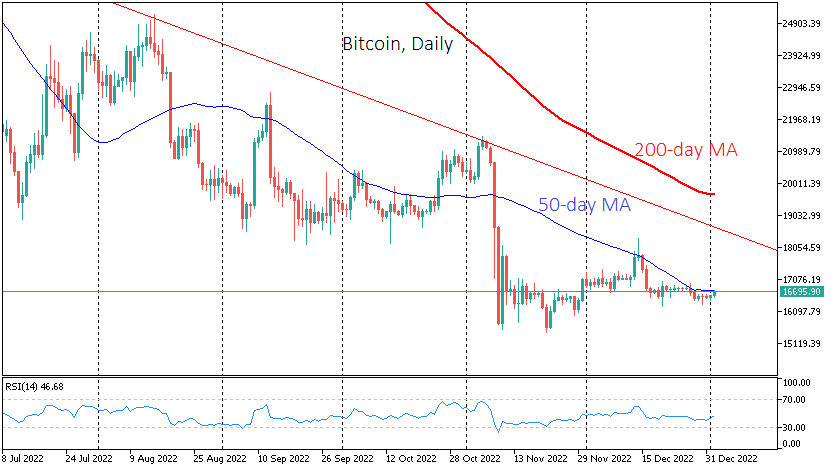
This tactic is already successful, as the total capitalisation exceeds 800 billion (+1.6% in 24 hours).
The current dynamic looks like an attempt to draw a line under a bearish 2022. We also note that the December lows were higher than the November lows. But to argue for a reversal, it is more prudent to wait for a renewal of the local highs rather than relying only on the waning declines.
Closing the day above the 50-day average (around 16750) might give new momentum to the upside, and consolidation above 17K might be notable news in the quiet information flow and serve as a decoy for the bulls.
At the same time, we recall that since July 2022, overcoming the 50-day average served as a trigger for selling on impressive volumes, and bitcoin soon renewed lows.
EUR/USD Dips Lower, German PMI Improves
Welcome to the first trading day of the New Year.
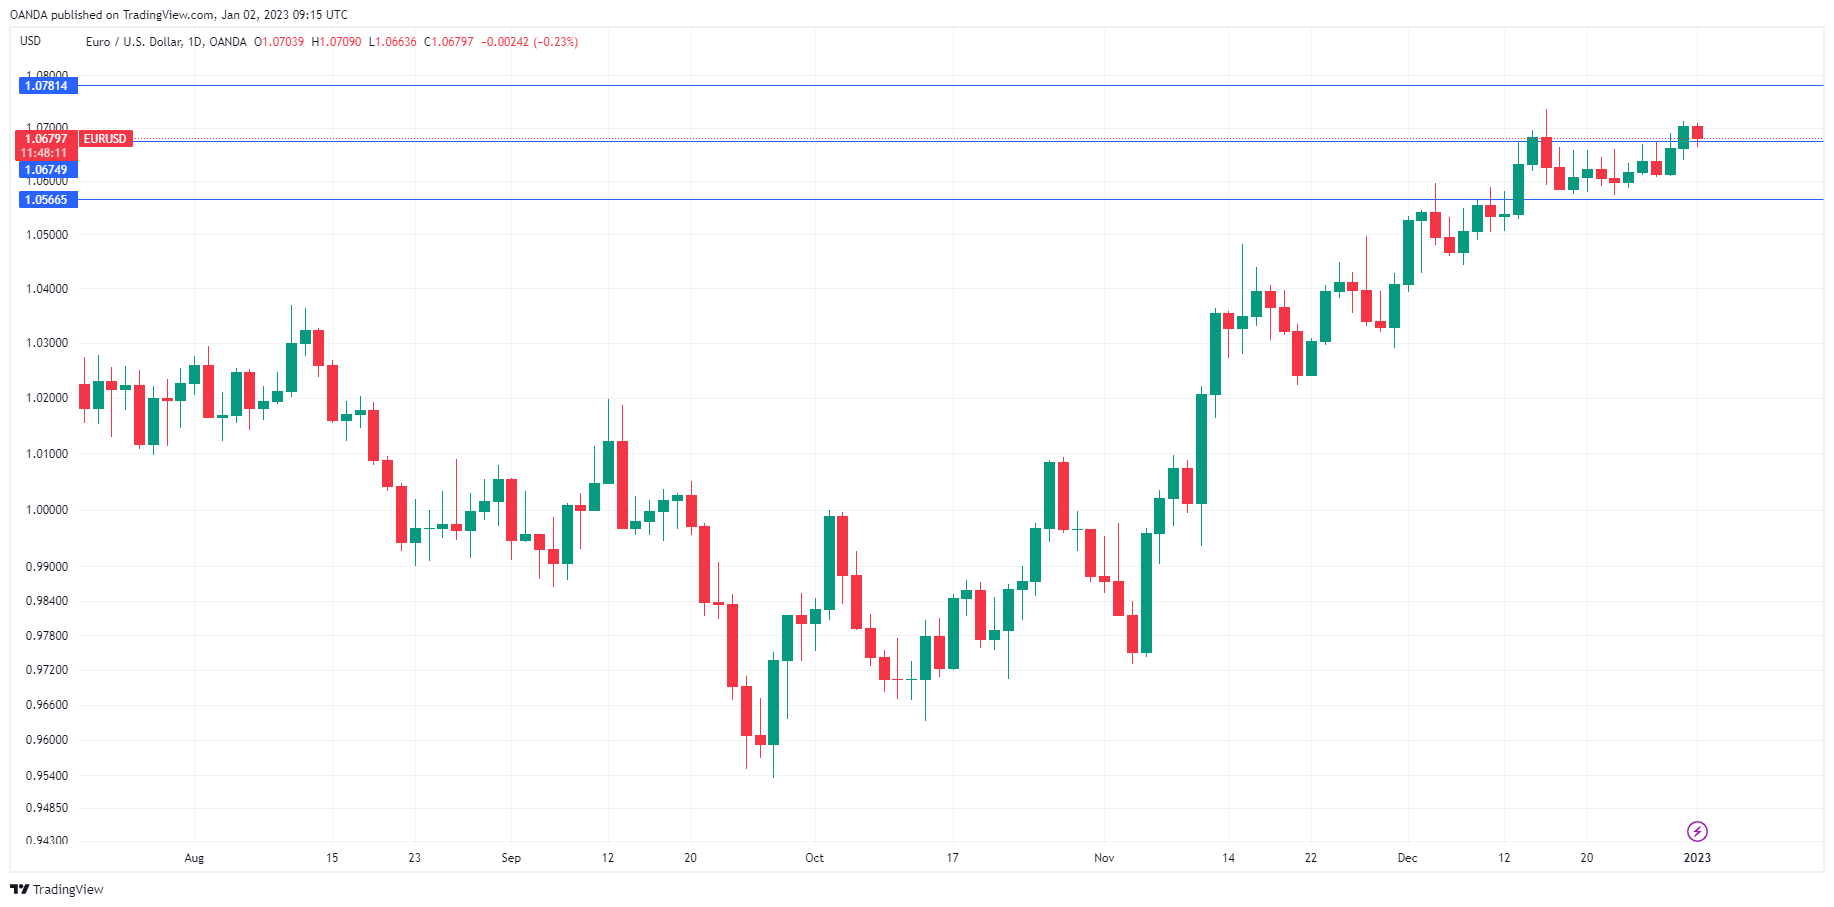
Trading remains thin, as most markets are closed. In the European session, EUR/USD is trading at 1.0679, down 0.23%. I expect a quiet day for the euro.
German Manufacturing PMI improves
There are no US events on the schedule. German Manufacturing PMI improved to 47.1 in December, up from 46.2 in November and shy of the consensus of 47.4 points. Manufacturing remains below the 50.0 level that separates contraction from expansion, and expectations remain pessimistic. The silver lining to a gloomy situation is that the outlook has improved slightly, as the December release was the strongest in three months. It was a similar pattern in the eurozone, as the Manufacturing PMI rose to 47.8, up from 47.1 in November, also a three-month high.
Manufacturing in Germany and the eurozone has suffered a tough year, and demand remains weak. The global outlook remains uncertain and with the ECB promising further rate hikes, the risk-to-demand outlook is tilted to the downside. Still, December showed an improvement, as concerns over an energy crisis have lessened and inflation has eased.
We’ll get a look at key inflation releases this week. German publishes December CPI on Tuesday, followed by eurozone CPI on Friday. Both indicators are pointing to inflation heading lower, which could have an impact on ECB rate policy. The ECB raised rates by 50-bp in December and meets next on February 2nd.
If anyone needed a sober forecast for 2023, there was one today from the International Monetary Fund. The head of the IMF, Kristalina Georgieva, warned that 2023 would be tougher than last year, as the US, EU and China would see growth slow. Georgieva said that she expected one-third of the global economy to be in recession. In October, the IMF cut its growth outlook from 2.9% to 2.7%, due to the war in Ukraine as well as central banks around the world raising interest rates.
EUR/USD Technical
- EUR/USD is testing support at 1.0674. Below, there is support at 1.0566
- There is resistance at 1.0782 and 1.0852
USDJPY Flounders as the Near Year Kicks in
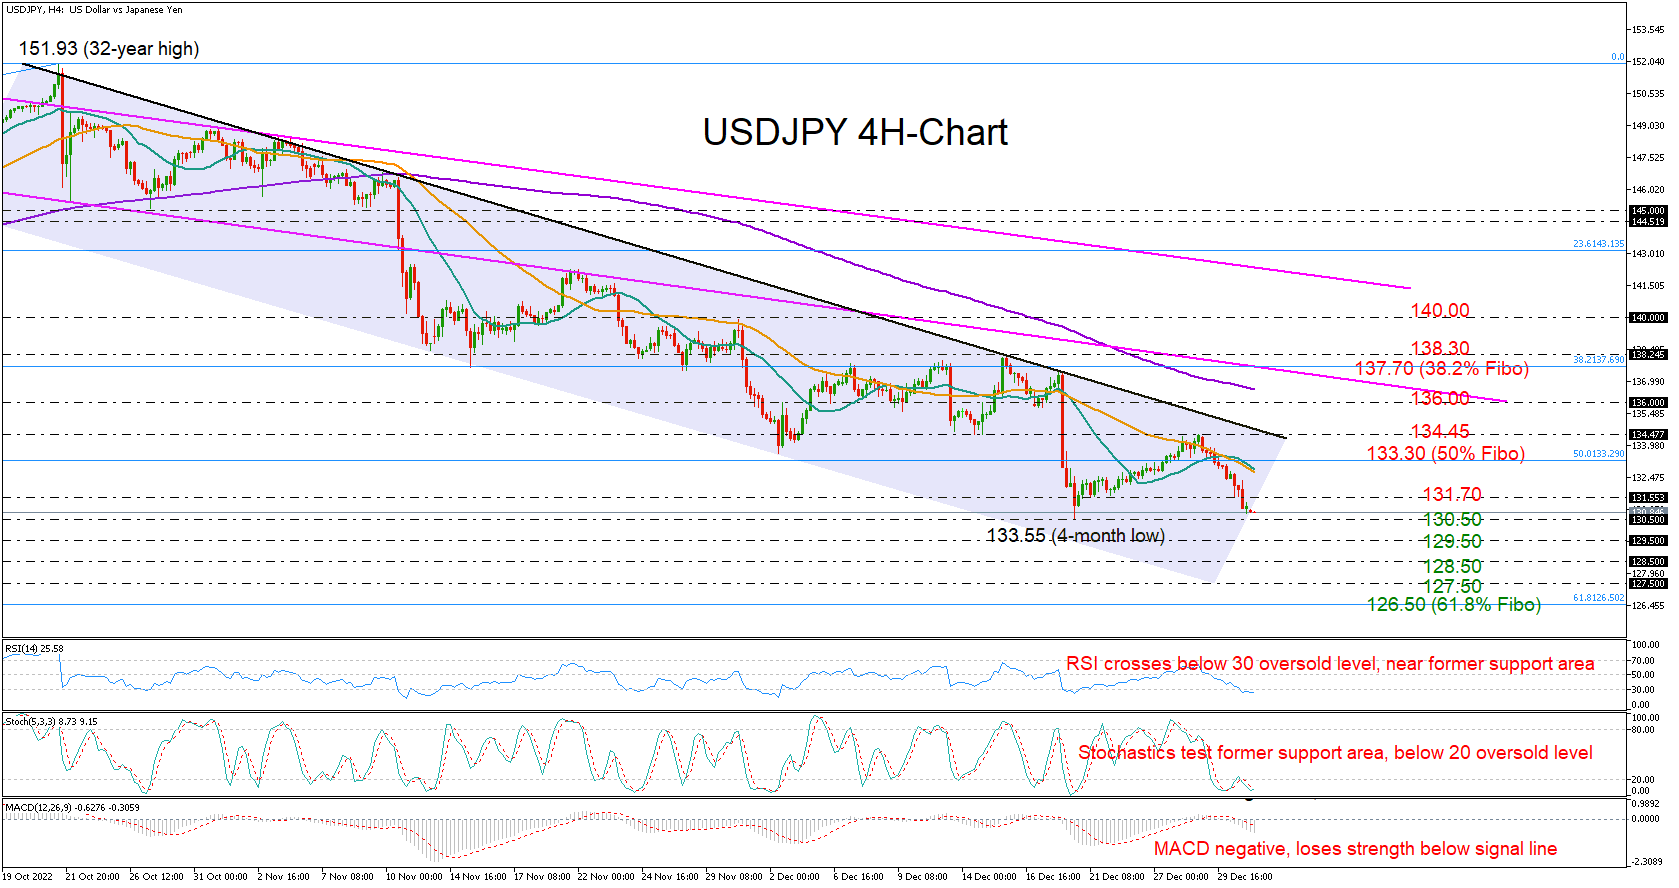
USDJPY could not gain fresh impetus on the first trading day of the year, retaining a muted tone near December’s four-month low of 133.55.
The pair suffered its worst monthly loss since 2016 in December, with the decline worsening significantly following the rejection from the key resistance trendline that connects all the highs from the peak of 151.93. Failure to reach that trendline last week increased the odds for more downside in the four-hour timeframe.
The negative trajectory in the momentum indicators is also dashing hopes for a meaningful rally, though with the RSI and the stochastics hovering near support levels within the oversold territory, an upside correction cannot be excluded.
If the floor at 130.50 collapses, the spotlight will immediately fall on the 129.50 barricade, which has been an important pivot point since April. A continuation lower could aggressively press the price to 127.50, unless the 128.50 handle comes to the rescue. The 61.8% Fibonacci retracement of the 114.64–151.93 upleg at 126.50 could be the next destination.
In case the price crawls back above 131.70, the 20- and 50-period simple moving averages (SMAs) may attempt to pause the bullish action around 133.00. Note that the 50% Fibonacci is within a breathing distance at 133.30, while the crucial descending trendline seen higher at 134.45 will remain a major threat as long as it stays solid. Should the bulls crash that wall, the price could speed up to 136.00.
All in all, the short-term outlook for USDJPY does not look bright at the moment, warning of more declines in the coming sessions. Specifically, a clear step below 130.50 is expected to trigger the next selling phase.
EURUSD Trades Sideways Despite Golden Cross
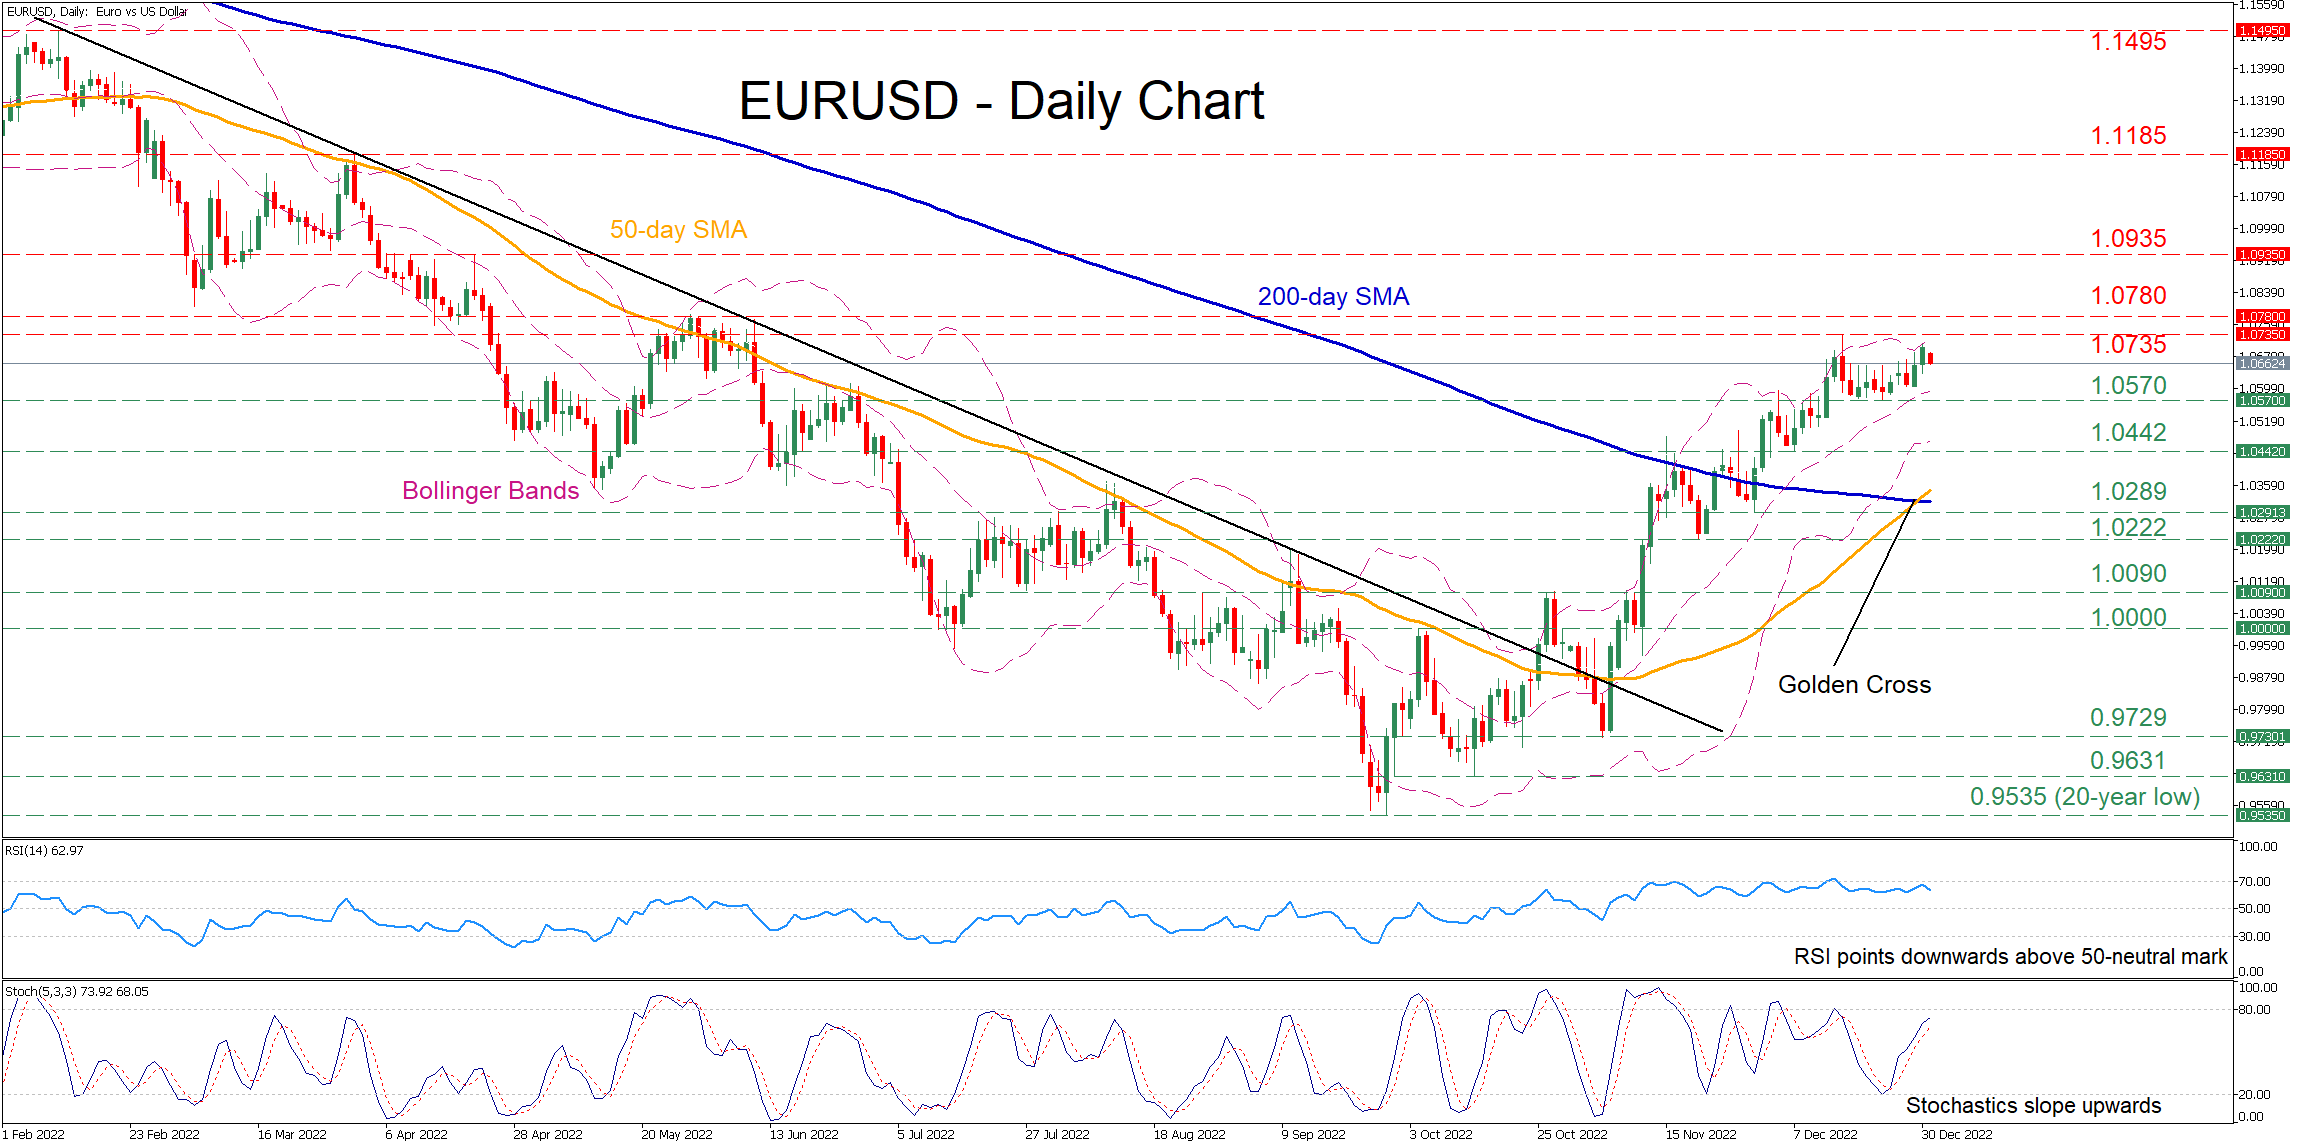
EURUSD has been edging higher since early October after its long-term downtrend ceased at the 20-year low of 0.9535. In the short term, the pair has been trading sideways, with the completion of a golden cross between the 50 and 200-day simple moving averages (SMAs) failing to spark an upside rally.
The momentum indicators currently suggest that bullish forces are in control. Specifically, the RSI is pointing downwards but remains comfortably above its 50-neutral mark, while the stochastic oscillator is ascending near the 80-overbought zone.
To the upside, if buyers manage to push the price higher, initial resistance might be encountered at the recent peak of 1.0735, which is also a six-month high. Conquering this barricade, the bulls could then aim for the May high of 1.0780. Failing to halt there, further advances could come to a halt at the 1.0935 hurdle.
Alternatively, should the pair reverse lower, the recent support of 1.0570 may act as the first line of defence. Should that floor collapse, the spotlight could turn to 1.0442 before the November support of 1.0289 comes under examination. Even lower, the price could descend towards the 1.0222 support zone.
In brief, EURUSD appears to be in a consolidation mode despite the emergence of bullish short-term technical signals. Hence, a break above the 1.0735 ceiling is needed to validate the resumption of its recovery.
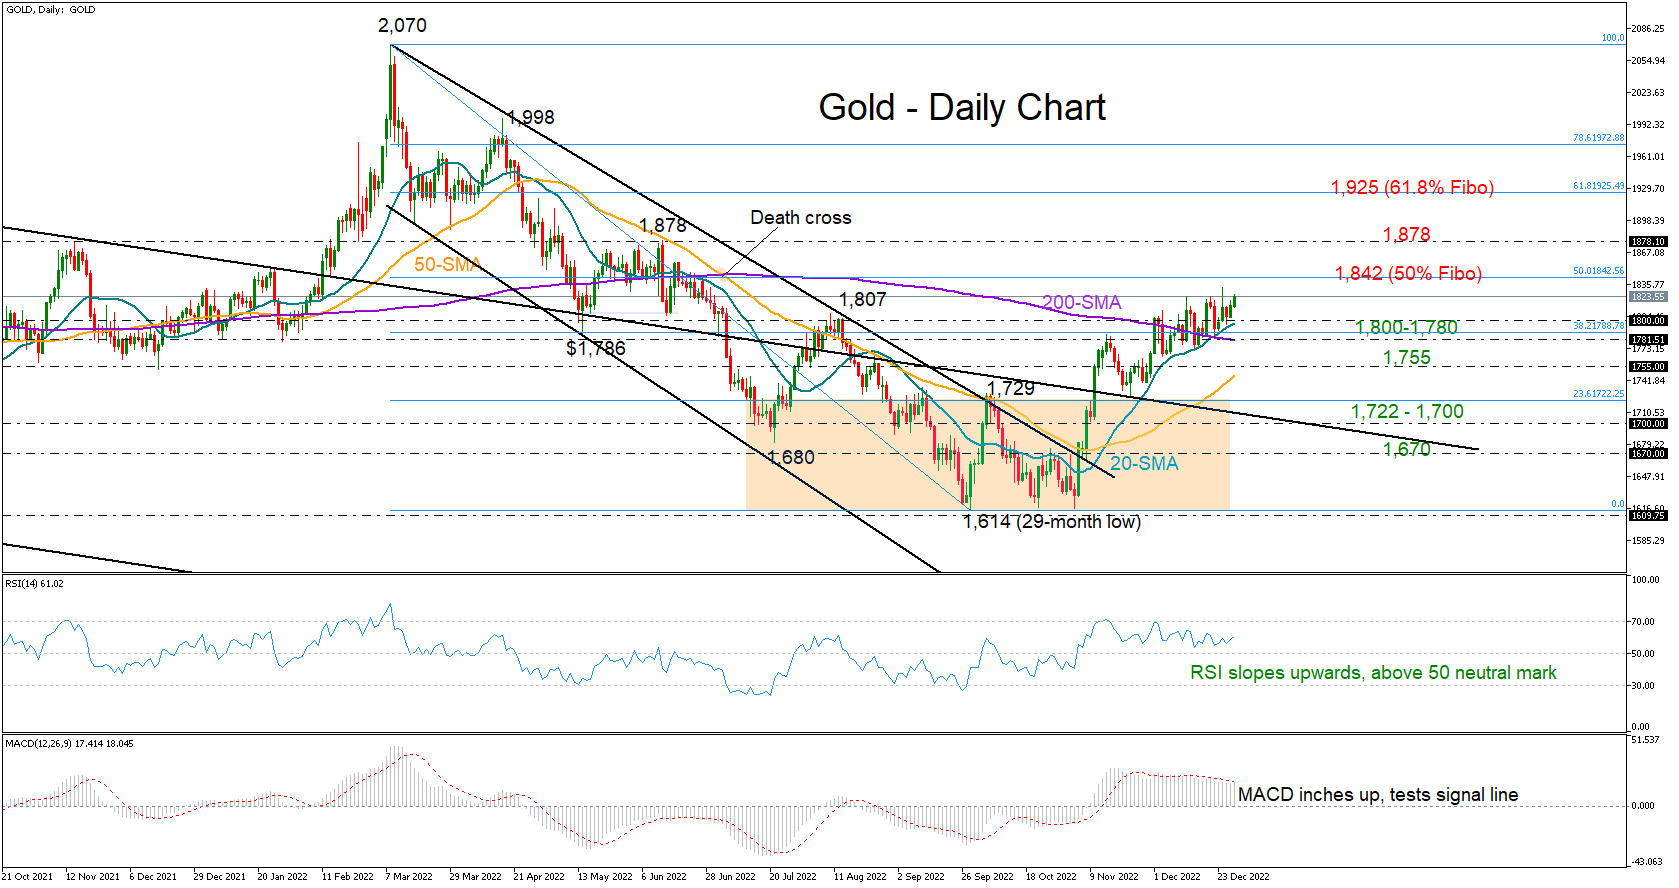
Gold Has a Promising Start to 2023
Gold sought fresh gains on the first trading day of the year after a remarkable 8.0% rally to 1,833 in December.
According to the technical indicators, the market seems to have the foundation to flourish further. The 20- and 200-day simple moving averages (SMAs) have recently bullishly crossed each other, endorsing the positive trend in the short-term picture. The RSI, although in horizontal trajectory, is comfortably above its 50 neutral mark and is pointing upwards, while the MACD has recouped some ground in the positive area to test its red signal line.
Resistance could initially occur around the 50% Fibonacci retracement of the March-September downtrend at 1,842. A successful penetration higher could drive the price up to June’s bar of 1,878, a break of which is probably required to clear the way towards the 61.8% Fibonacci of 1,925.
On the downside, the 1,800-1,780 area, which encapsulates the 38.2% Fibonacci and the 20- and 200-day SMAs, will come first into view if selling forces resurface. A bearish correction at this point may stabilize around the 1,750 handle, where the 50-day SMA is converging. Otherwise, the decline could continue towards the 23.6% Fibonacci of 1,722 and the key descending line at 1,700, which has been limiting both upside and downside movements since the peak at the record high of 2,079.
In brief, the bullish short-term pattern in gold could encourage more buying in the coming sessions, especially if the 1,842 barrier gives way as well.