Sample Category Title
Aussie Finishes Strong in 2022
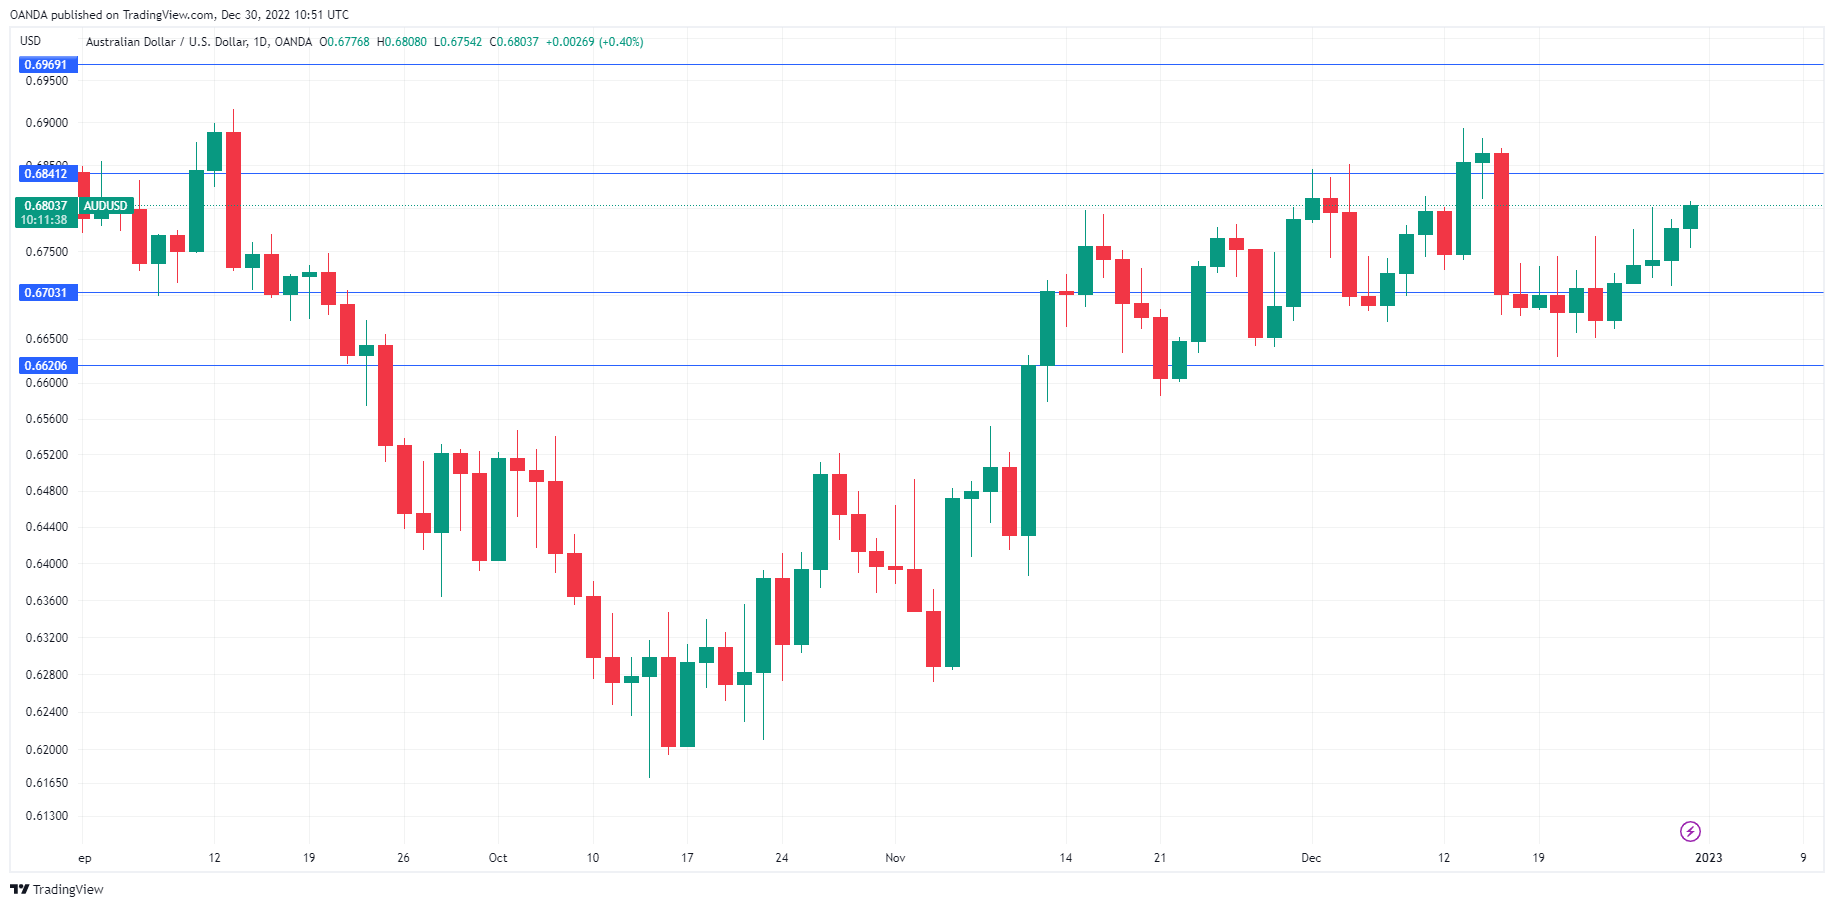
The Australian dollar has been rising since last Friday and is in positive territory today. In the European session, AUD/USD is trading at 0.6801, up 0.37%.
The final week of the year, bookended by Christmas and New Year’s, is usually quiet, with reduced trading volumes and a very light economic calendar. Still, the Australian dollar managed to put together an end-of-the-year rally, rising around 2% since December 23rd.
Australia watching China reopening
In a week short on economic news, one of the highlights was China’s announcement that international tourists would no longer be required to enter quarantine upon arrival. This marks another step in China’s rush to reopen, a massive shift from its harsh zero-Covid policy that choked economic activity. The pivot is expected to invigorate China’s economy, which has been experiencing a slowdown. The reopening policy is expected to boost the economy in the long term but has already led to a surge in Covid cases. This has kept many people indoors, hurting businesses, and many workers have reported being sick, which has reduced factory production. The reopening has been abrupt and chaotic, and that is likely to result in a contraction in GDP in the first quarter of 2023. China’s economy is, however, expected to recover, and HSBC is projecting 5% growth for 2023.
Australia is watching these developments closely. China is Australia’s largest trading partner, and how well China’s economy performs can have a strong impact on the direction of the Australian dollar. If China’s economy contracts in Q1, Australian exports will suffer and the Australian dollar could be in for a bumpy start to the year.
AUD/USD Technical
- AUD/USD has support at 0.6703 and 0.6620
- There is resistance at 0.6841 and 0.6969
Swiss Franc Touches 9-Month High
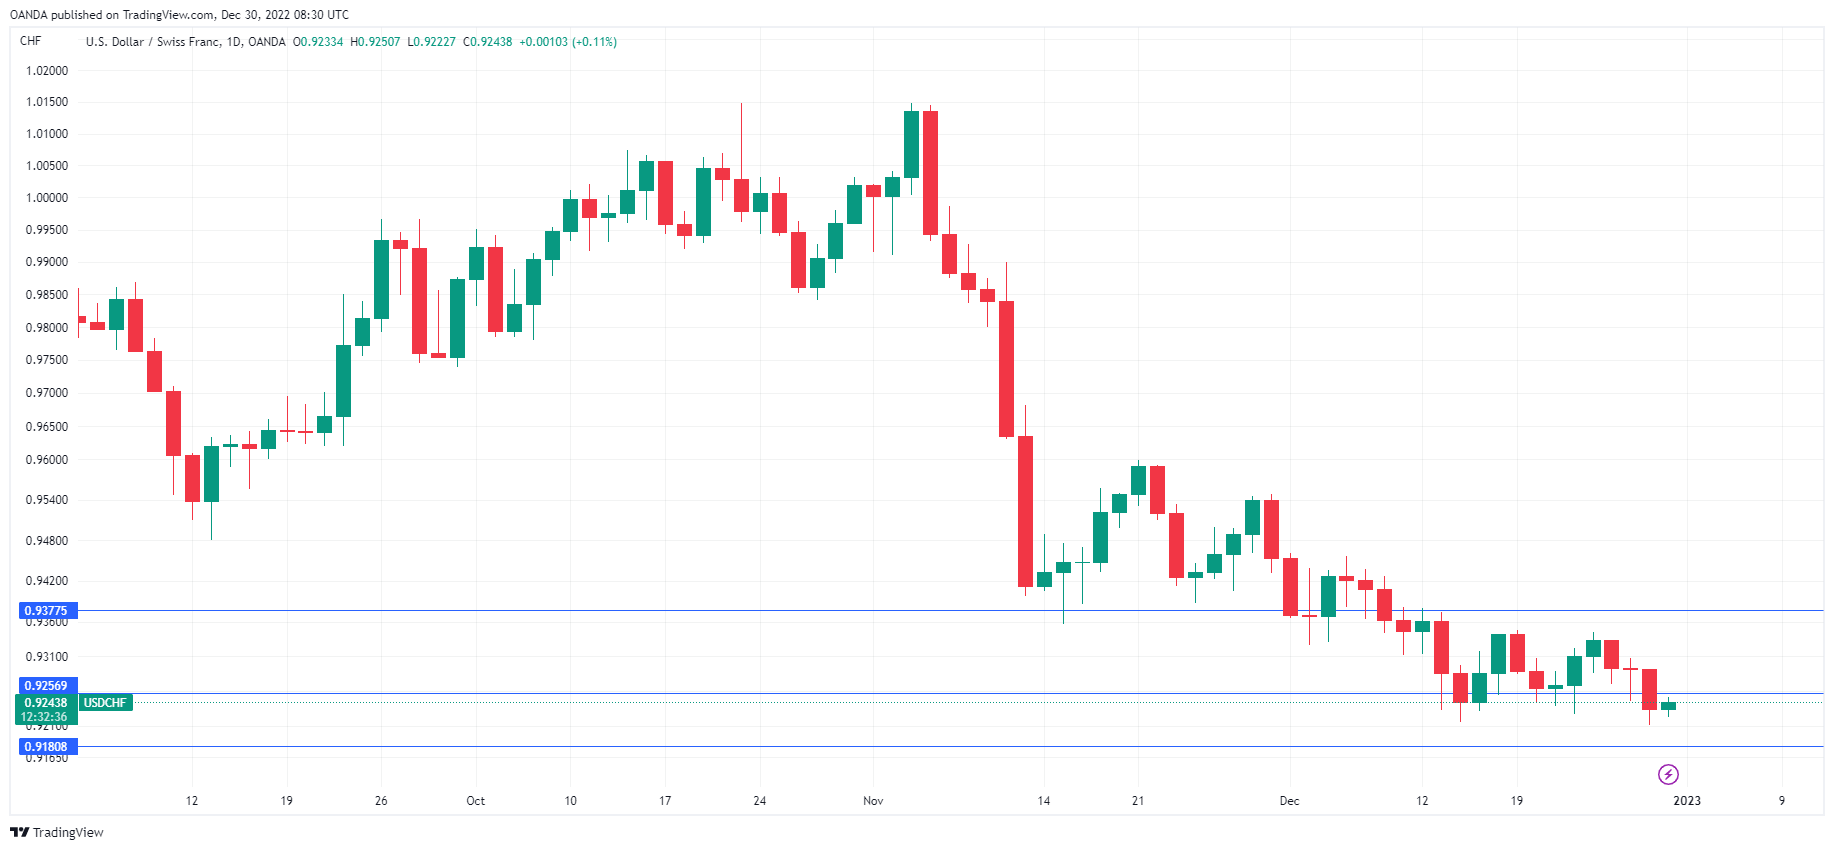
The Swiss franc is steady on Friday. In the European session, USD/CHF is almost trading at 0.9240, up 0.08%. On Thursday, USD/CHF dropped by 0.6% and hit a low of 0.9210, its lowest level since March 28th.
KOF rebounds in December
A quiet post-Christmas week wrapped up with the KOF Economic Barometer release today. After losing ground in the past two readings, the index rebounded in December and climbed to 92.2, up from 89.2 in November. This easily beat the estimate of 86.9 points. The main driver for the improvement was stronger manufacturing activity. Earlier this week, ZEW Economic Expectations also headed higher, rising from -57.5 to -42.8 points. The upturn is encouraging, but the indicator is still mired deeply in negative territory, as financial experts remain pessimistic about the Swiss economy’s outlook.
As we turn the page to 2023, let’s take a quick look at the highlights of the Swiss franc’s performance over this past year. There have been plenty of ups and downs, but interestingly, USD/CHF is only about 100 points higher from where it was on January 1st. A US dollar rally in September and October saw USD/CHF break parity and hit 1.0148, its highest level since May. Since, then, the momentum has reversed, with the Swiss franc gaining an impressive 800 points since November 1st.
The US dollar has enjoyed a strong year, with the dollar index rising 8%, its best performance since 2015. The greenback has been boosted by a drop in risk appetite, but this didn’t hurt the Swiss franc, as both the dollar and the franc are Swiss haven currencies. In a major policy change, the Swiss central bank raised rates three times this year, which helped the Swiss franc keep pace with the US dollar even as the Fed aggressively raised rates.
USD/CHF Technical
- USD/CHF is putting pressure on support at 0.9256. Below, there is support at 0.9159
- There is resistance at 0.9377 and 0.9498
USD/JPY: Bearish Trend Likely to Complete Near 127.93
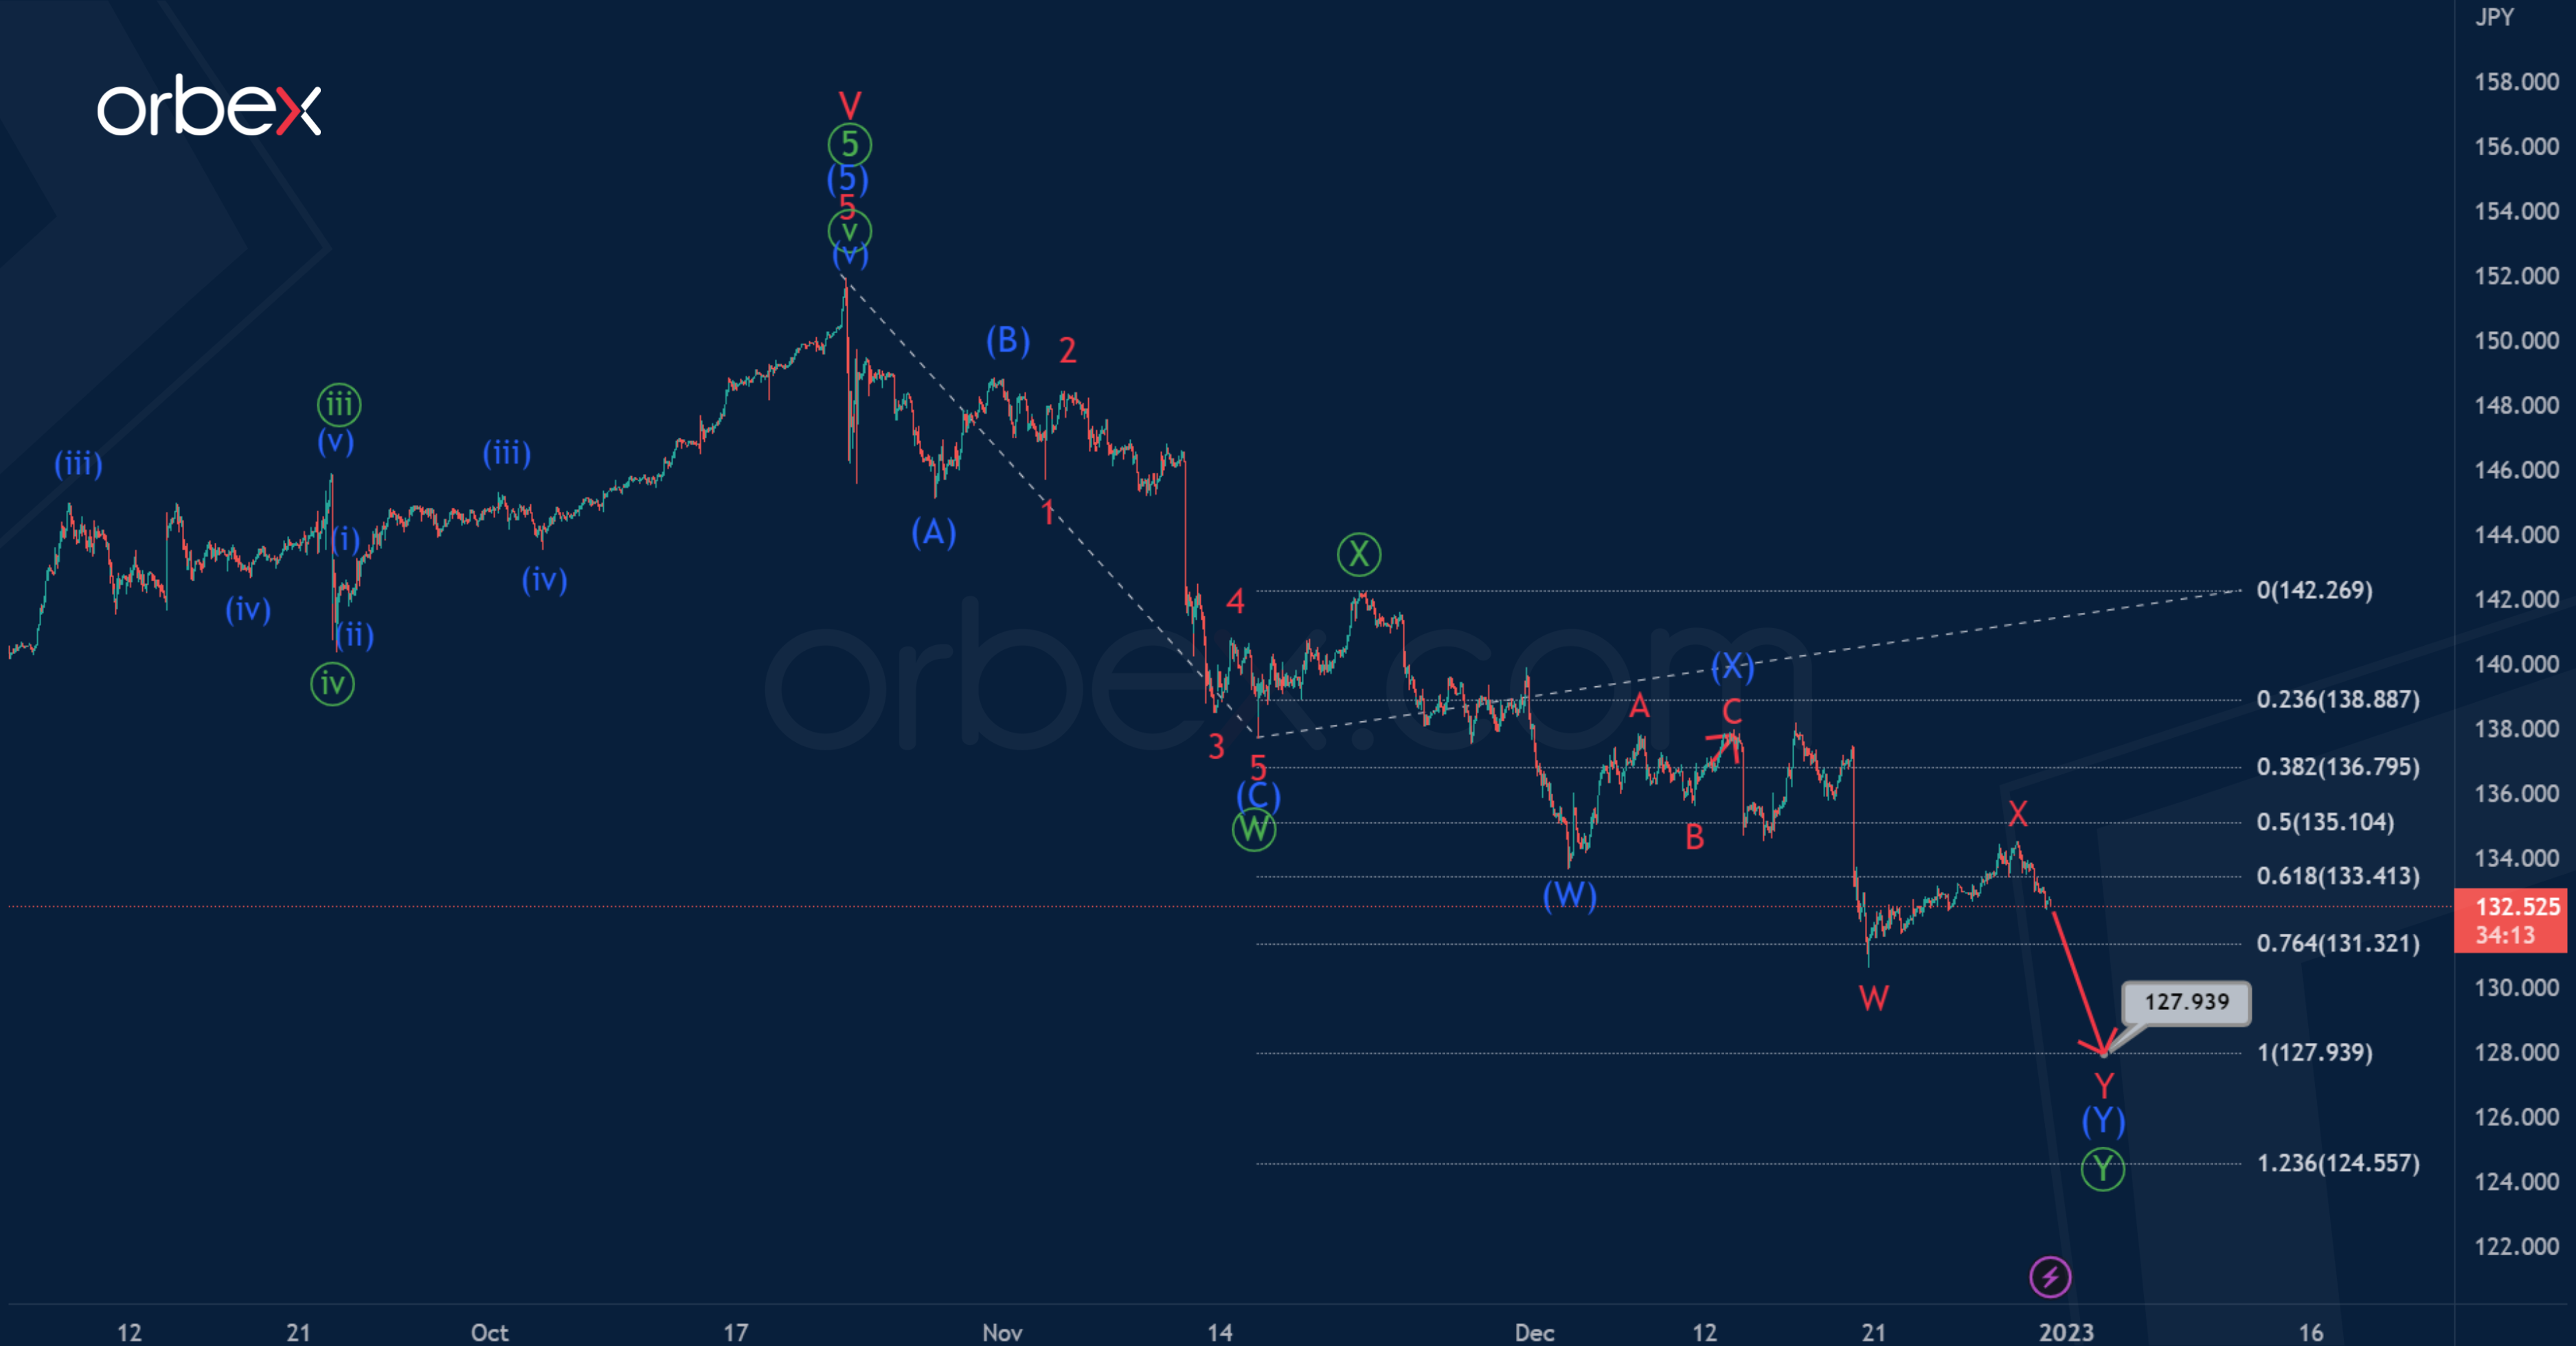
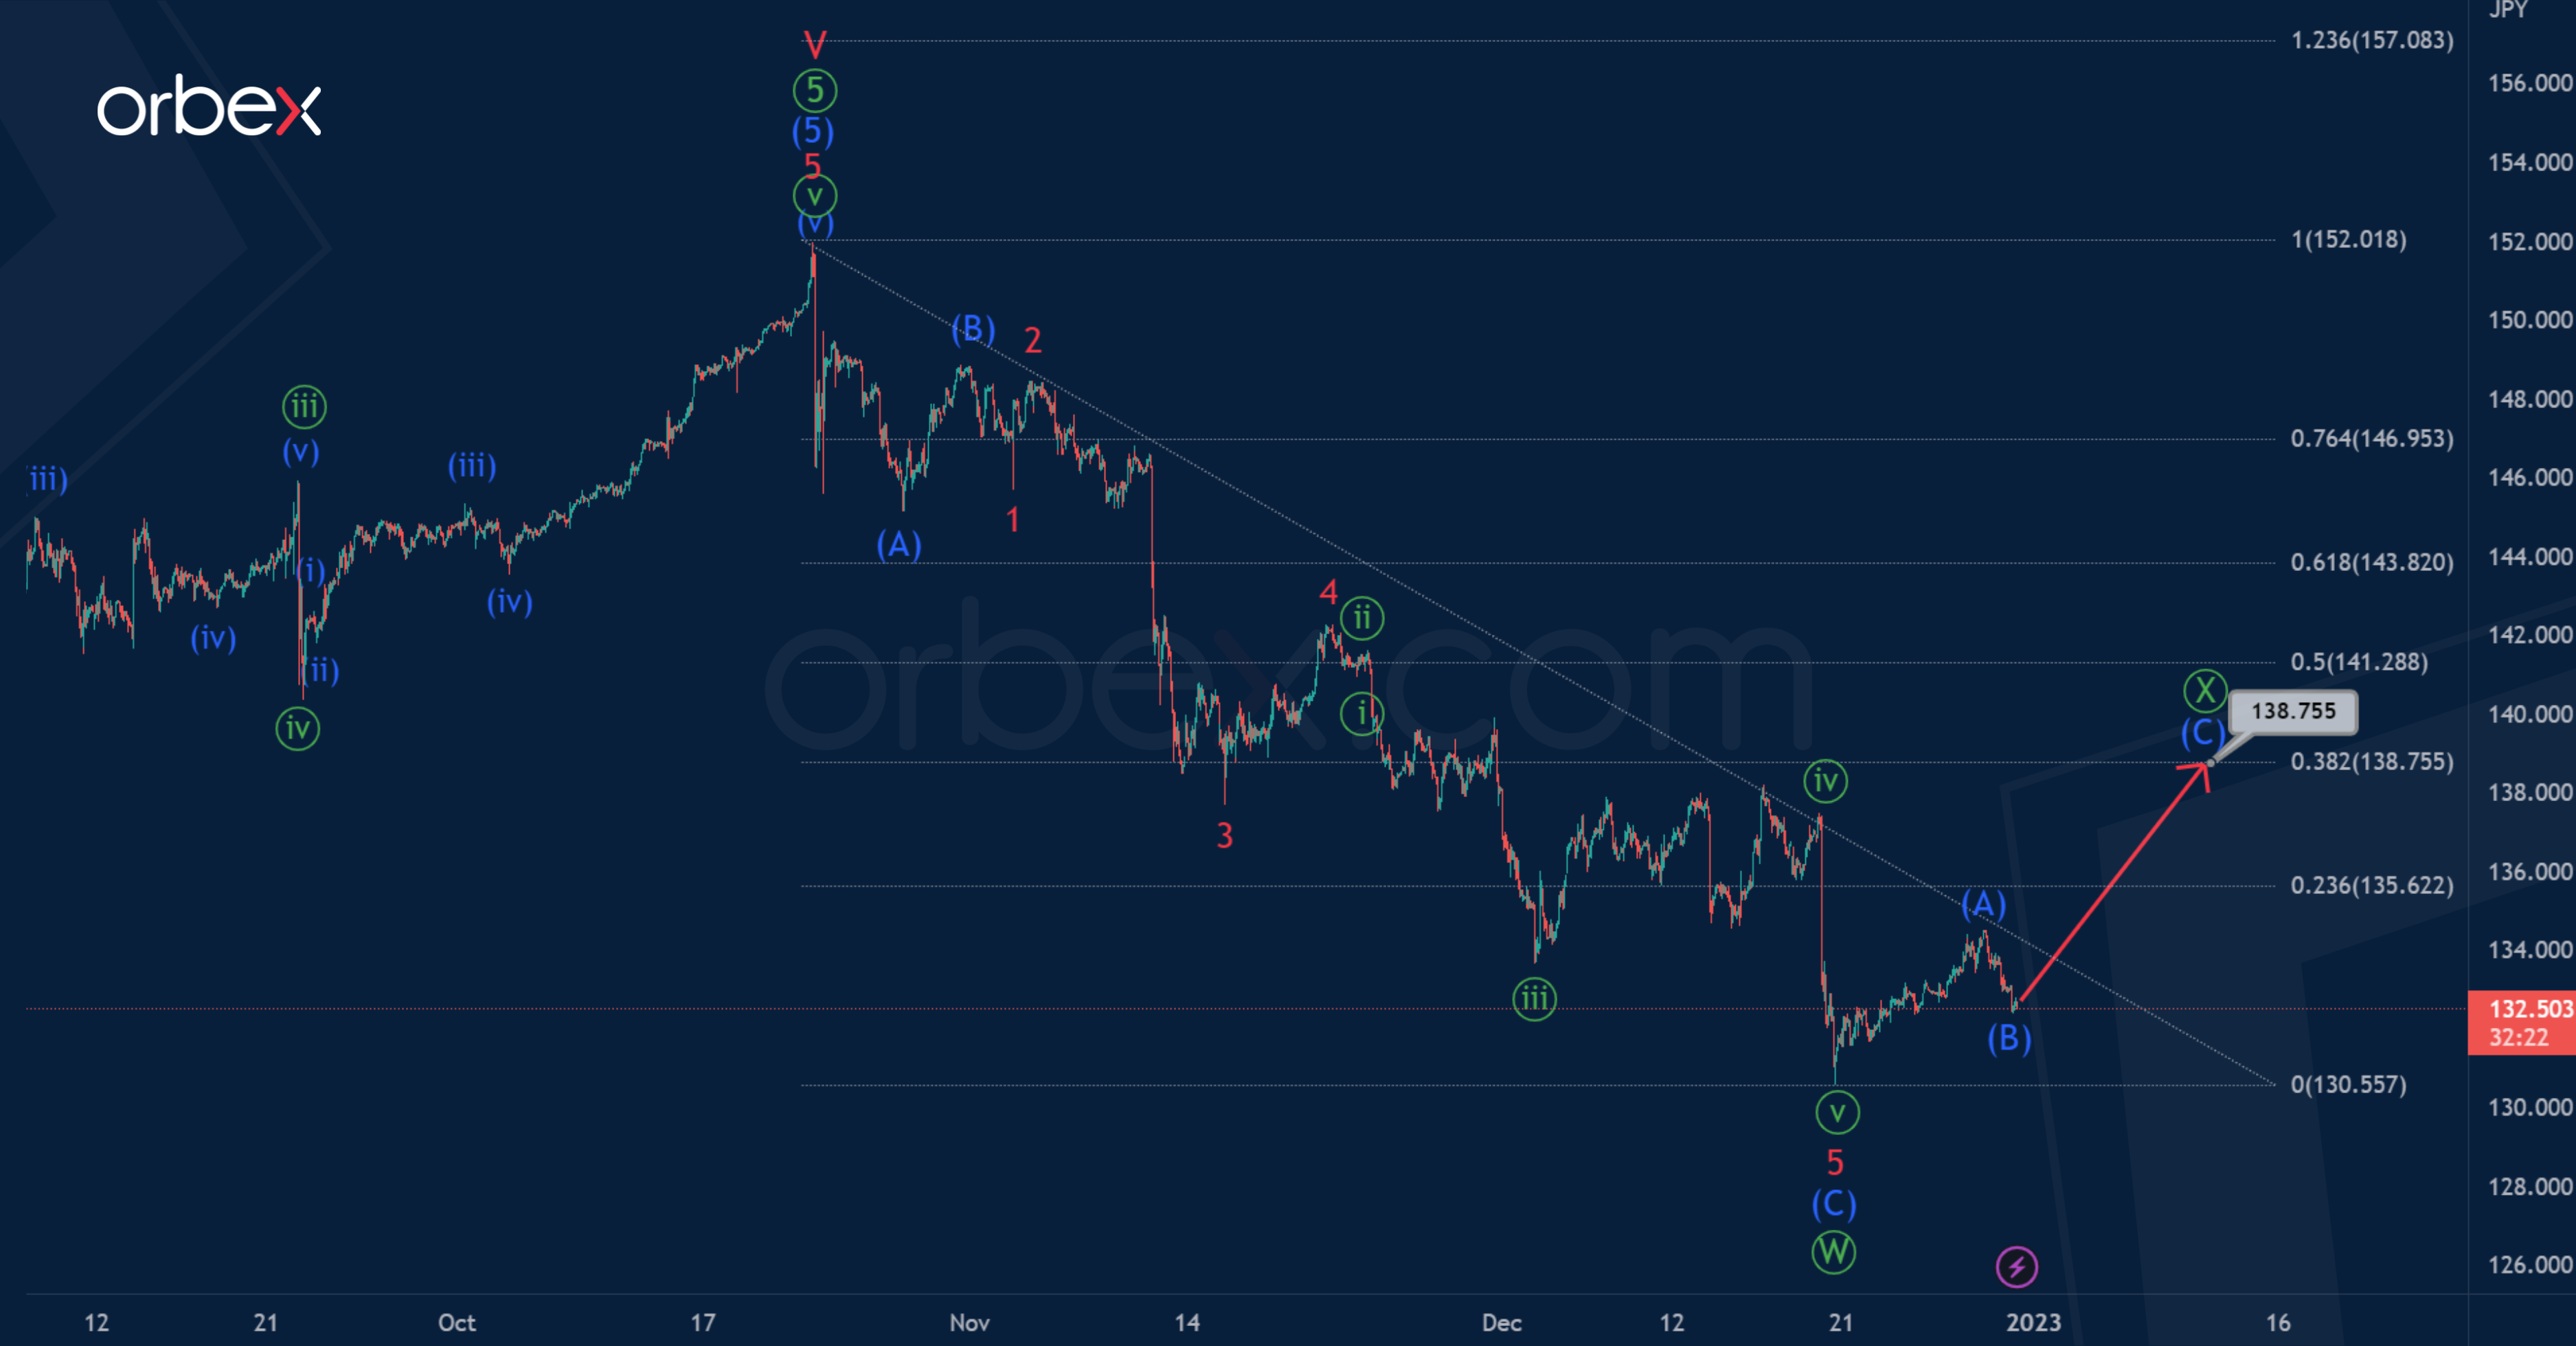
The current USDJPY structure suggests that the formation of a global cycle impulse could have been completed not so long ago. Then the fall of the exchange rate and the formation of a new bearish trend began.
It is assumed that a bearish double zigzag of the primary degree Ⓦ-Ⓧ-Ⓨ may form in the market. To date, the actionary wave Ⓦ and the intervening wave Ⓧ may have been completed.
Thus, in the near future we can expect the development of the final actionary wave Ⓨ, which may take the form of a double zigzag (W)-(X)-(Y), and end near 127.93. At that level, wave Ⓨ will be equal to wave Ⓦ.
Alternatively, it is assumed that in the bearish double zigzag, only the first actionary wave Ⓦ is completed, and the intervening wave Ⓧ is still under development.
Perhaps the wave Ⓧ will have the form of a zigzag (A)-(B)-(C), as shown in the chart. In the near future, the price growth may continue in the sub-wave (C) to 138.75.
At that level, wave Ⓧ will be at 38.2% along the Fibonacci lines of wave Ⓦ.
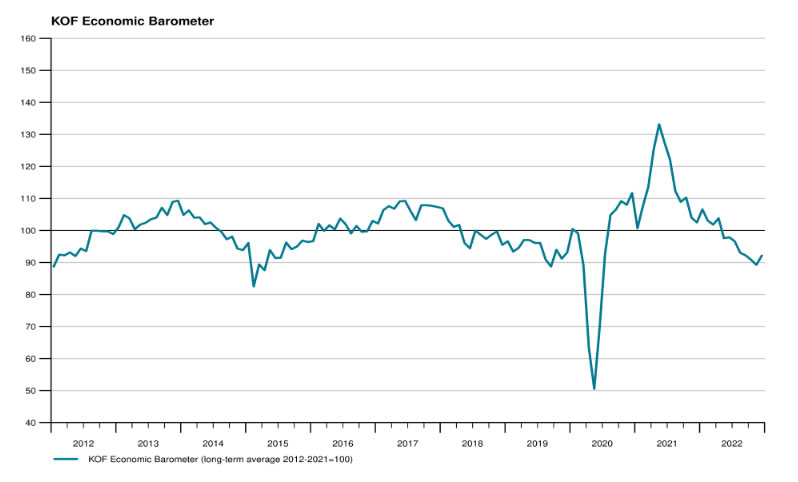
Swiss KOF rose to 92.2, outlook brightening at a low level
Swiss KOF Economic Barometer rose from 89.2 to 92.2 in December, above expectation of 90.9. This is also the first rise since April. KOF said, "the outlook for the Swiss economy is thus brightening slightly for the beginning of 2023, although remaining at a low level."
KOF also noted: "The comparatively strong upward movement of the barometer is primarily driven by bundles of indicators from the manufacturing sector and the other services sector. Indicators covering financial and insurance services as well as accommodation and food service activities also send a positive signal."
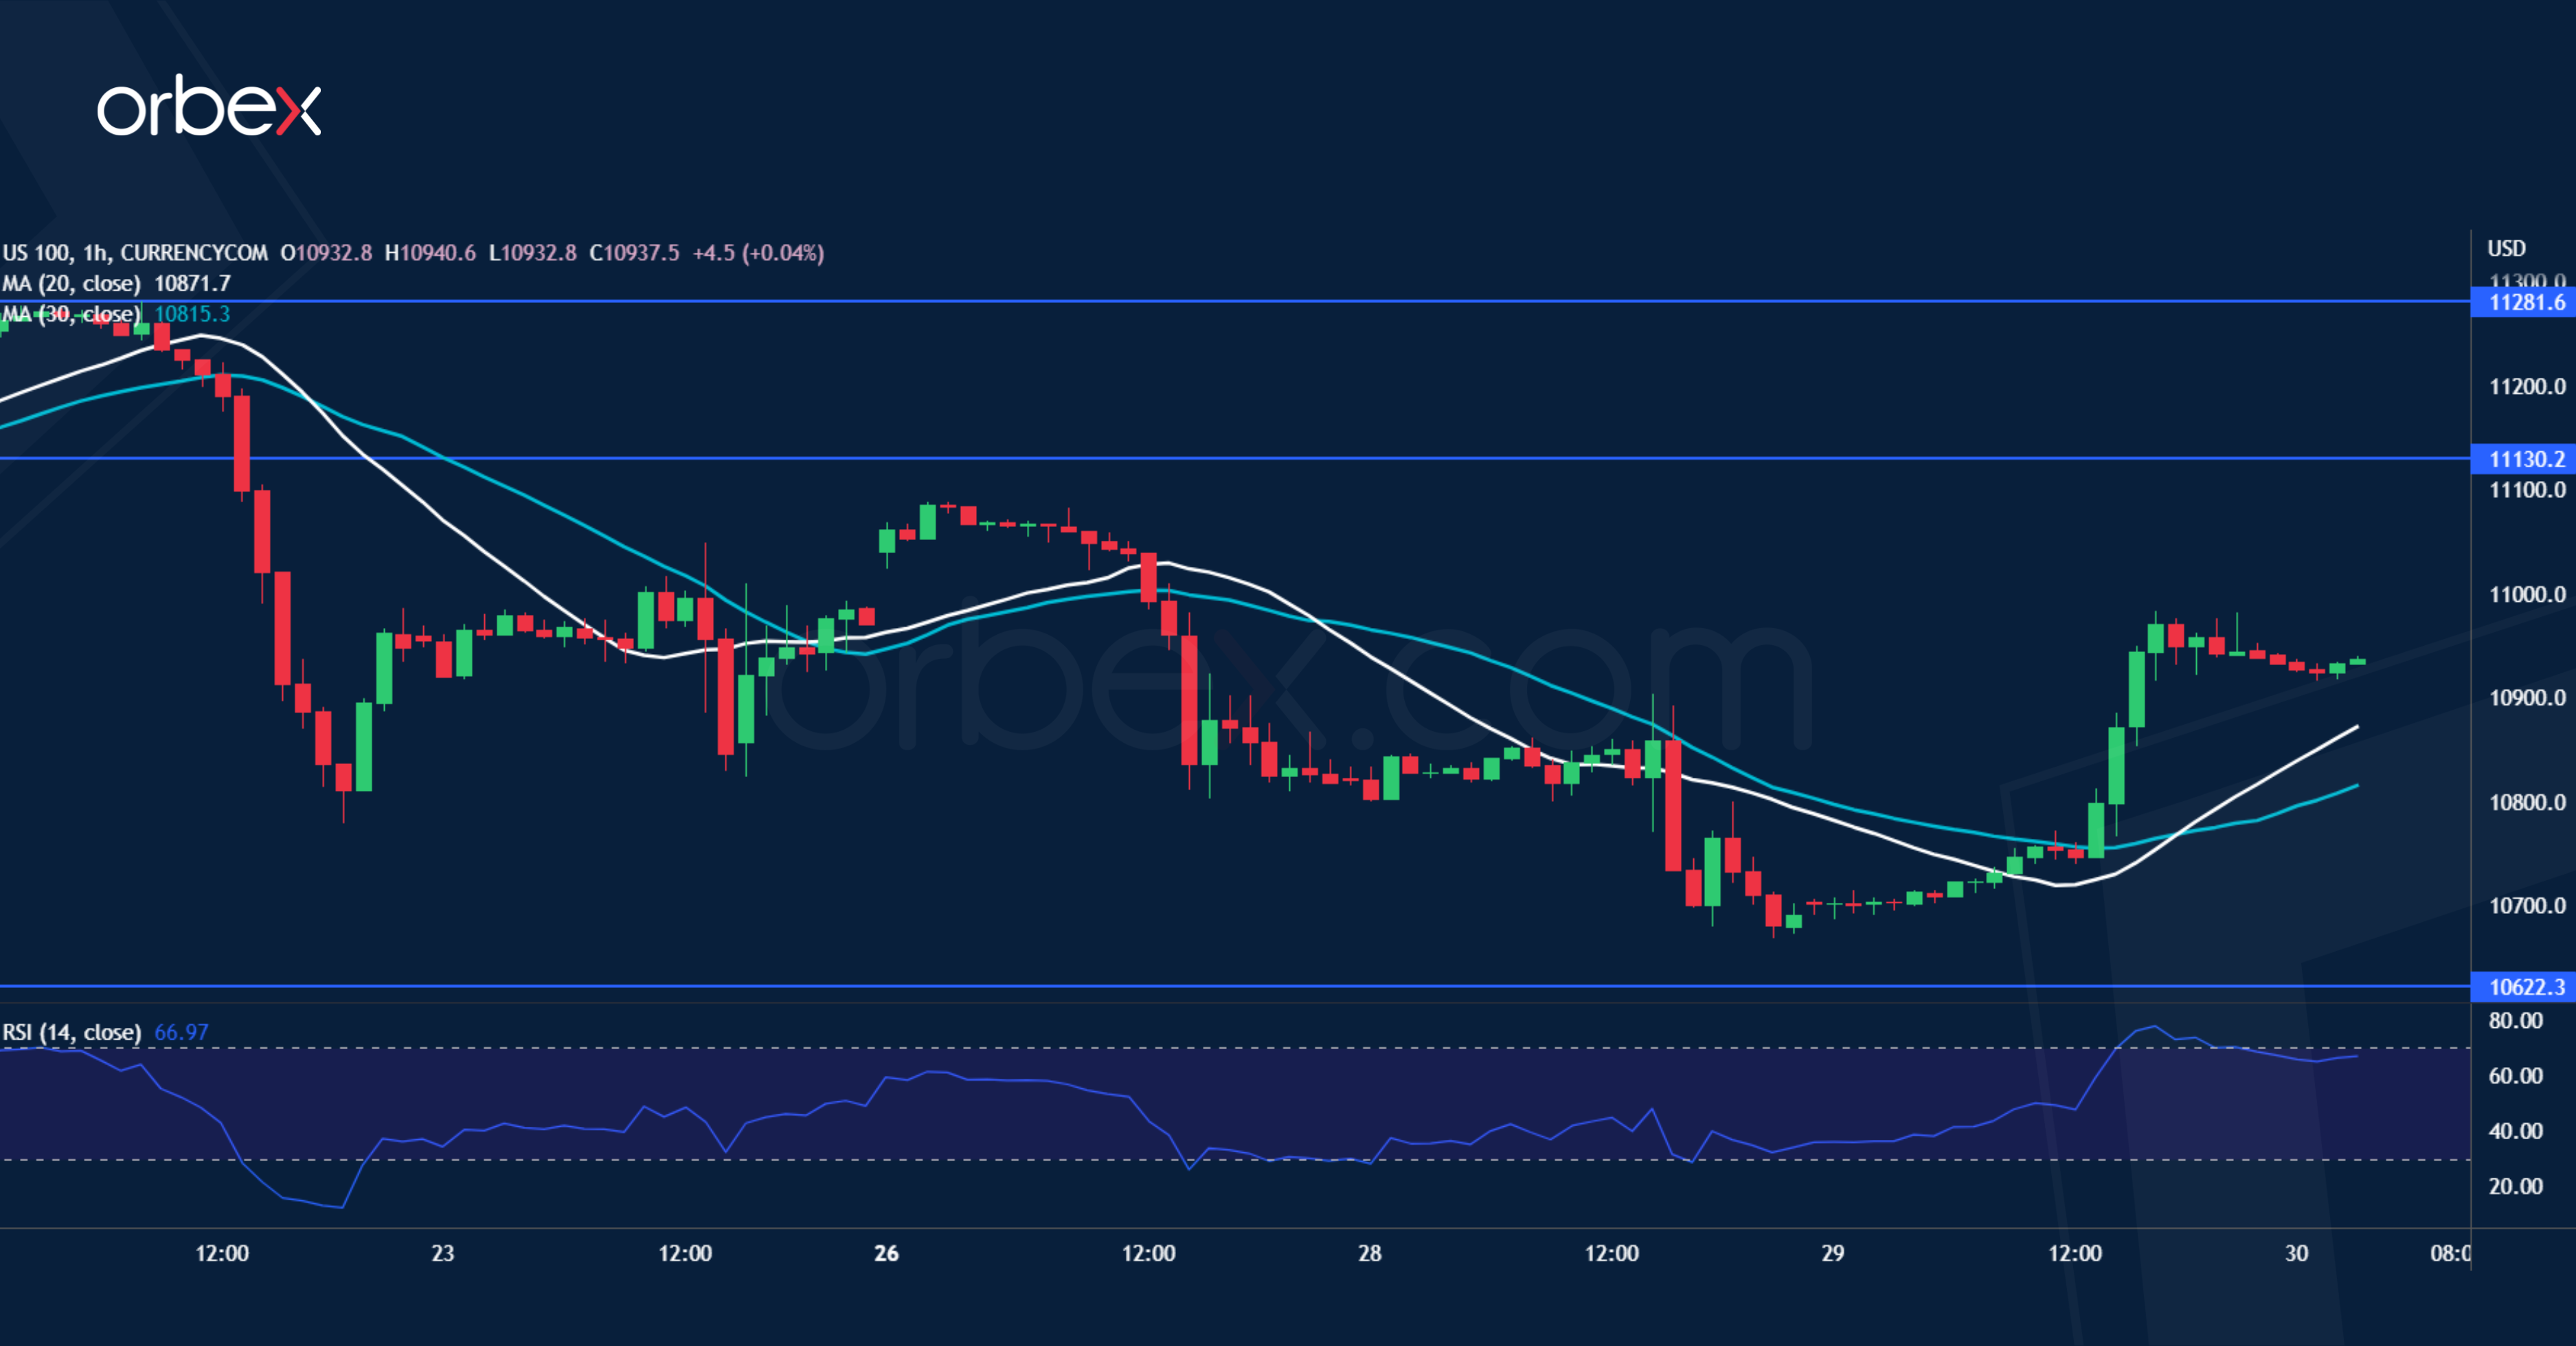
Nasdaq 100 Tests Critical Floor
The Nasdaq 100 bounces as signs of a cooling US labour market eases concerns about a hawkish Fed. On the daily chart, a U-turn from mid-September’s sell-off point (12200) was disconcerting. With the price having retraced all the way back to the start (10620) of the November rally, the index could be vulnerable to renewed selling. A break below 10450 would confirm a dead cat bounce and cause a sustained bear market. 11130 is the first resistance and 11280 a key level to lift before buyers could turn the situation around.
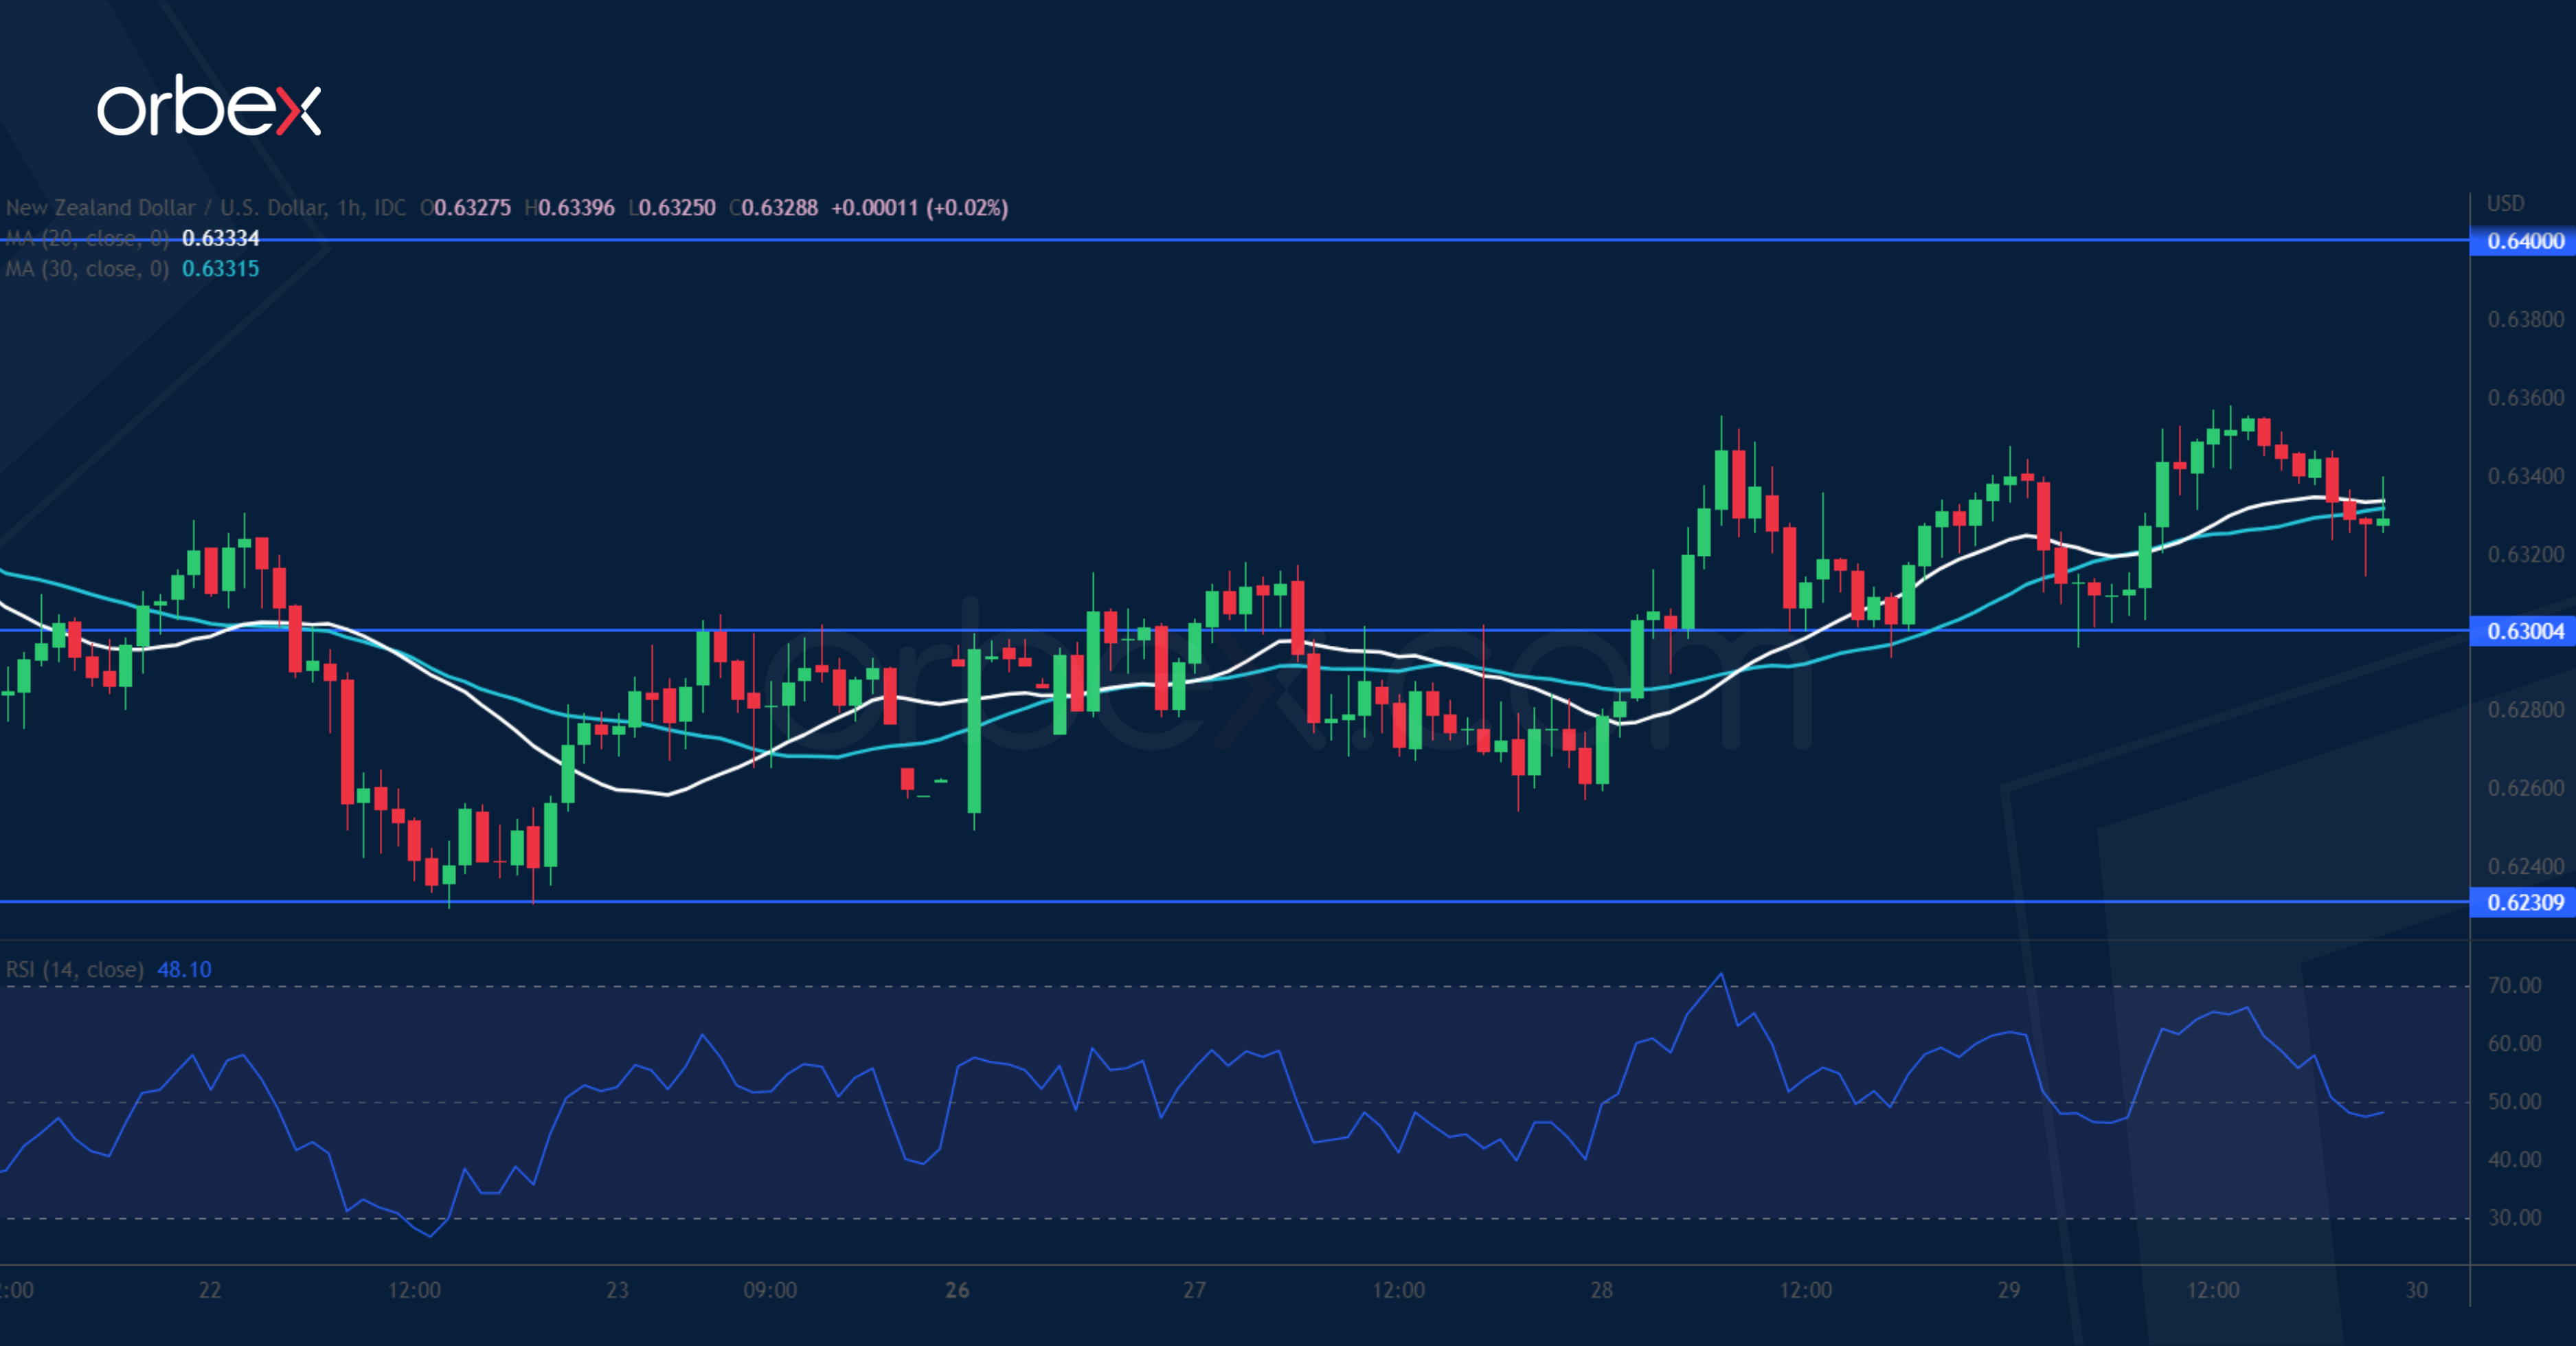
NZD/USD Bounces Back
The New Zealand dollar recovers thanks to an uptick in overall risk appetite. After the pair cleared the August high of 0.6460, sentiment favours the kiwi as it goes into a consolidation mode. A bounce off 0.6230 indicates that buyers have stepped in and a close above 0.6330 has prompted short-term sellers to cover their bets. 0.6300 has become a fresh support. The support-turned-resistance at 0.6400 is a major obstacle and its breach could help the bulls regain control and extend the rally beyond 0.6500 eventually.
USD/CHF Tests Major Support
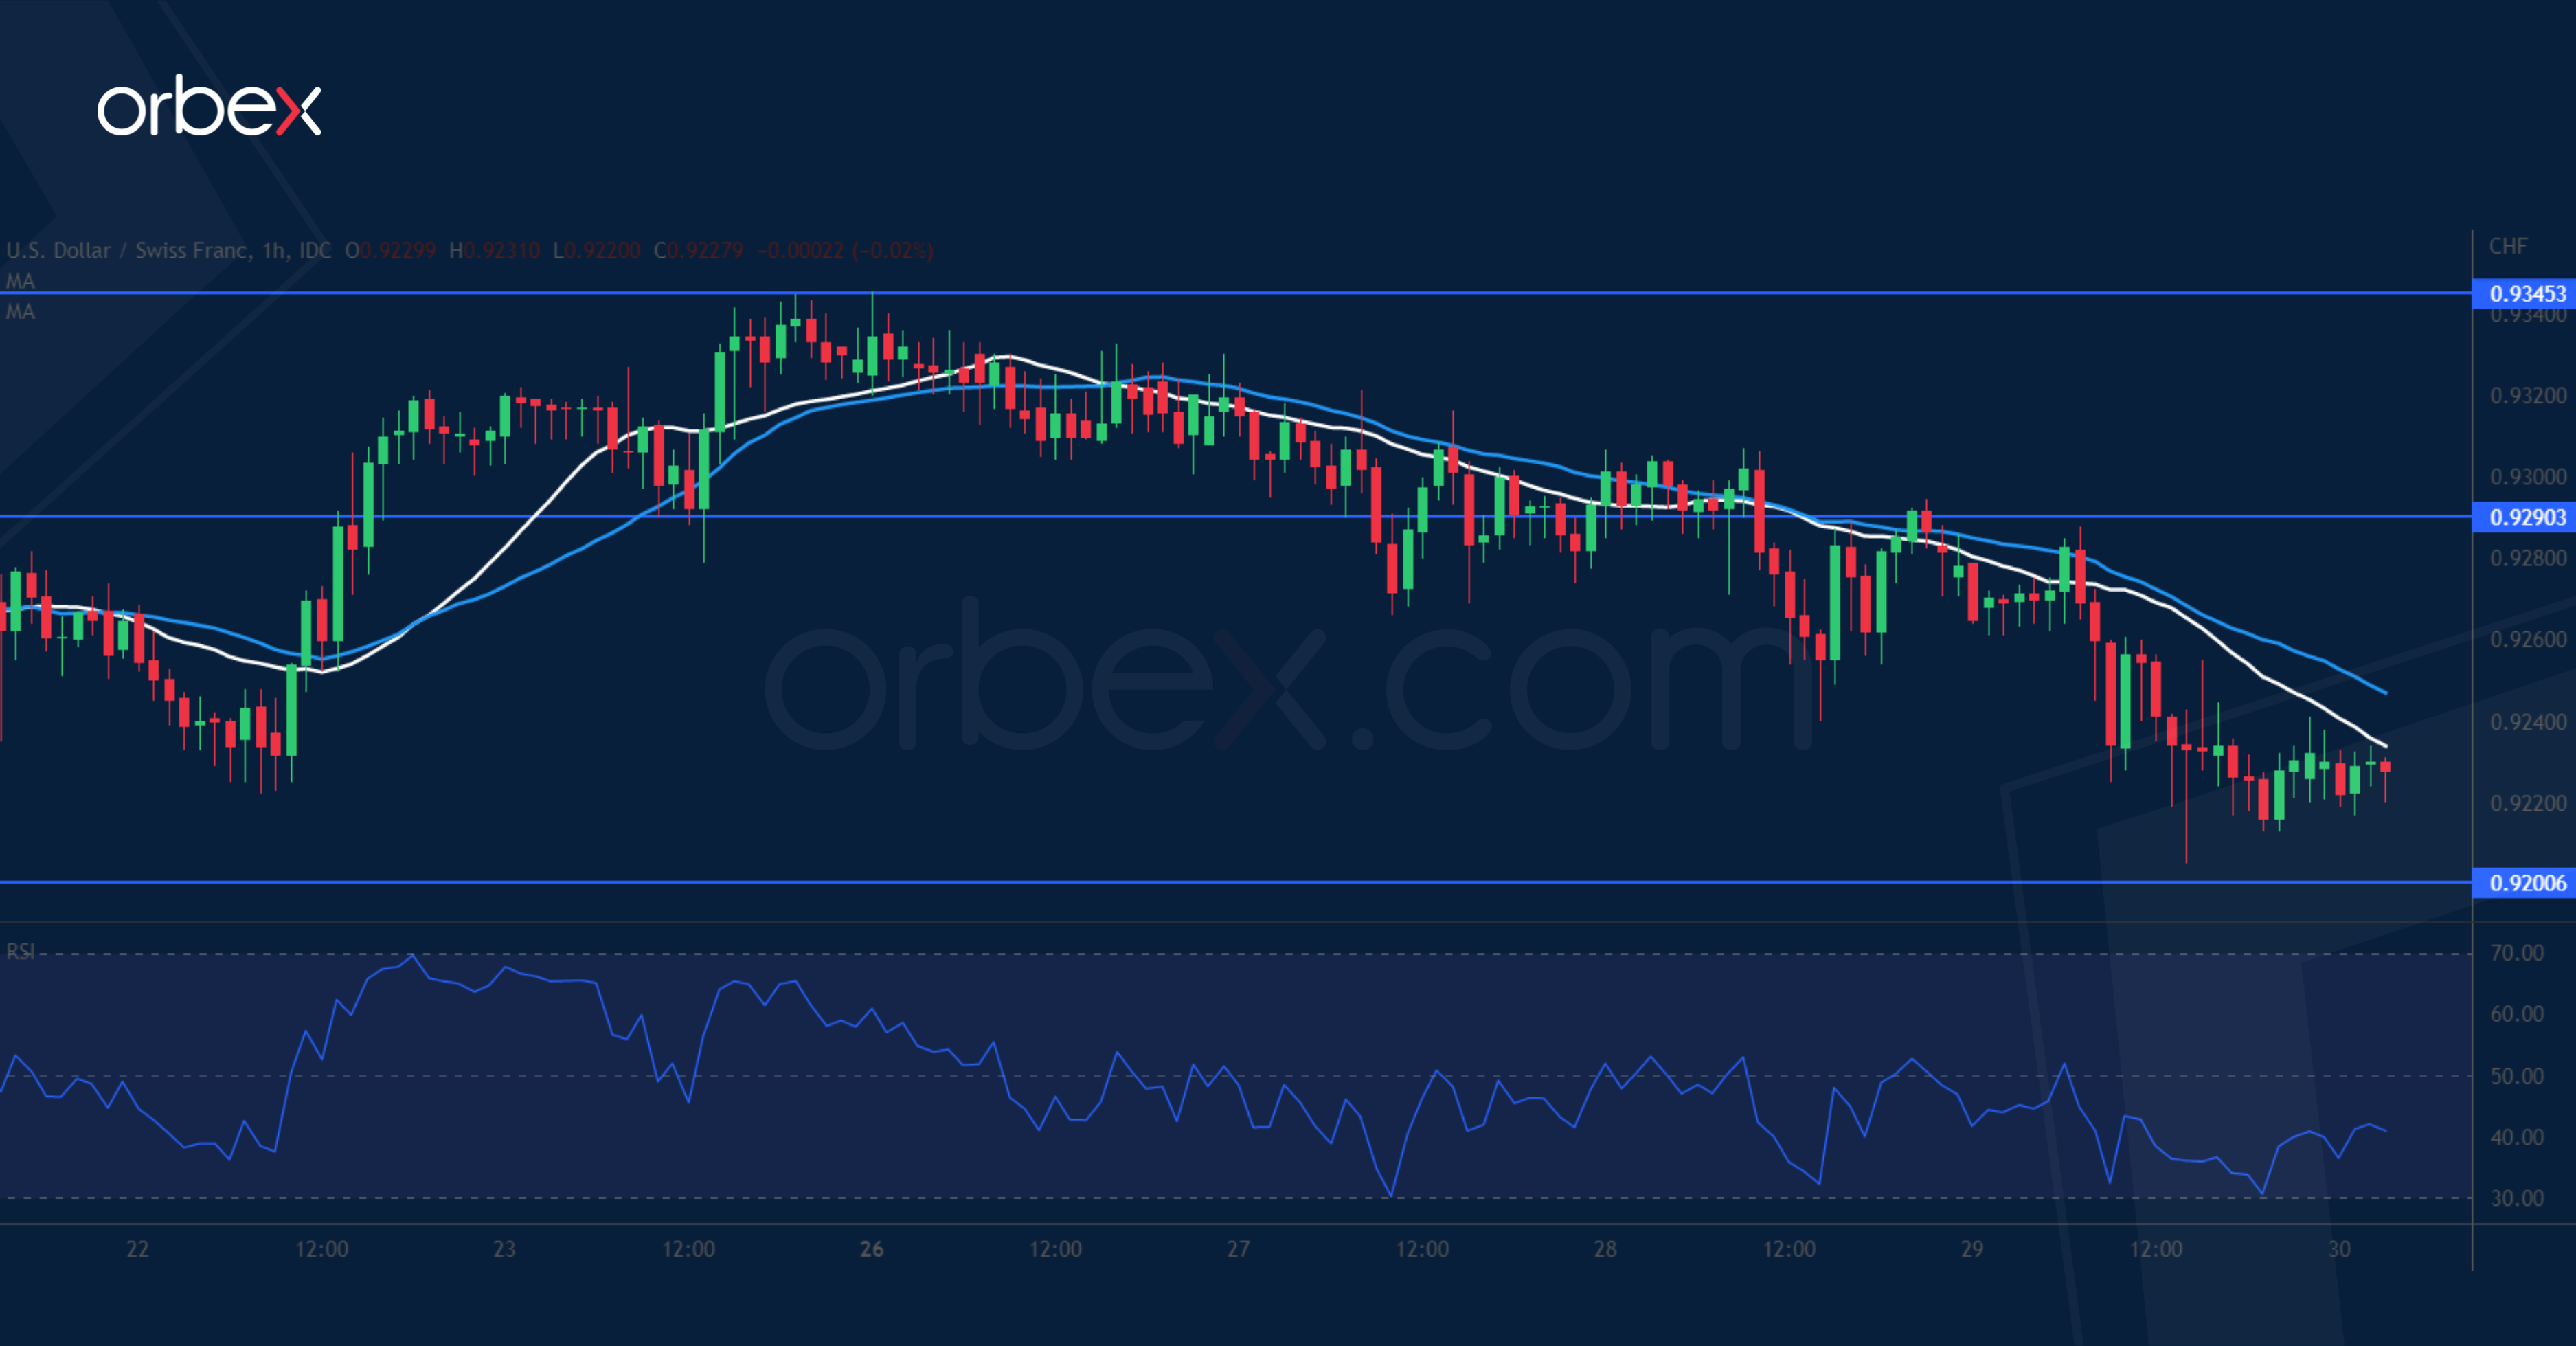
The US dollar slipped after data showed a rise in initial claims for unemployment benefits. The price is testing last April’s low near 0.9200 after giving up all the gains from the breakout rally eight months ago. This means that the greenback is at a critical level as a deeper fall would cause a bearish reversal in the medium-term. On the hourly chart, the latest rebounds hit resistance at 0.9345, forming a double top in the process. 0.9290 would be the first hurdle to lift before a recovery could materialise.
USD/JPY Daily Outlook
Daily Pivots: (S1) 132.45; (P) 133.45; (R1) 134.03; More...
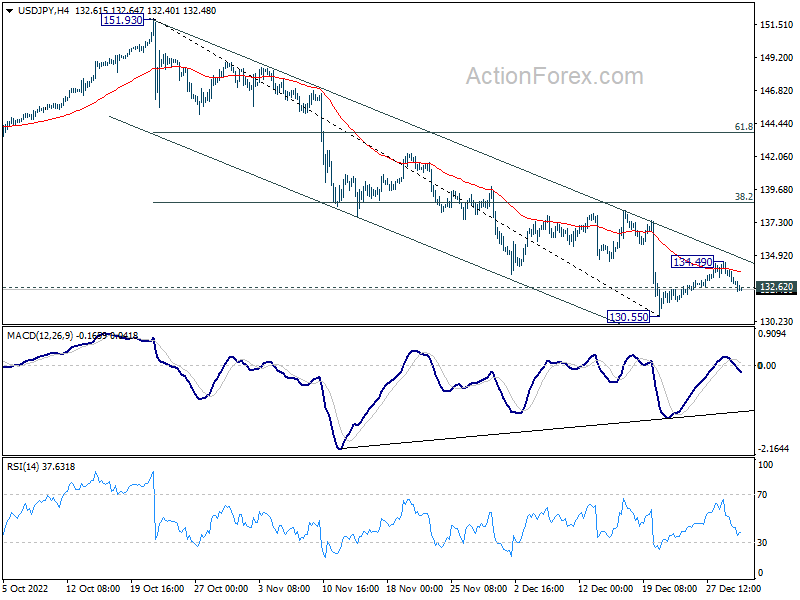
Break of 132.61 minor support argues that recovery form 130.55 has completed earlier than expected at 134.49. Intraday bias is back on the downside for 130.55 support. On the upside, above 134.49 should resume the rebound through near term channel resistance, towards 38.2% retracement of 151.93 to 130.55 at 138.71.
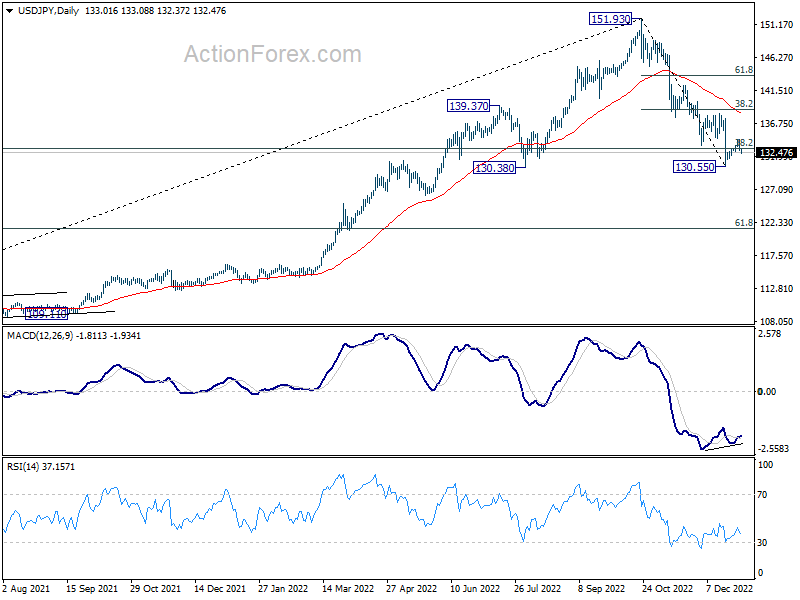
In the bigger picture, price actions from 151.93 medium term could be just a corrective pattern to up trend from 102.58 (2021 low). Strong support from 38.2% retracement of 102.58 to 151.93 at 133.07 and 55 week EMA (now at 131.76) will set the range for such corrective pattern. However, sustained break of 55 week EMA will pave the way to 61.8% retracement at 121.43.
USD/CHF Daily Outlook
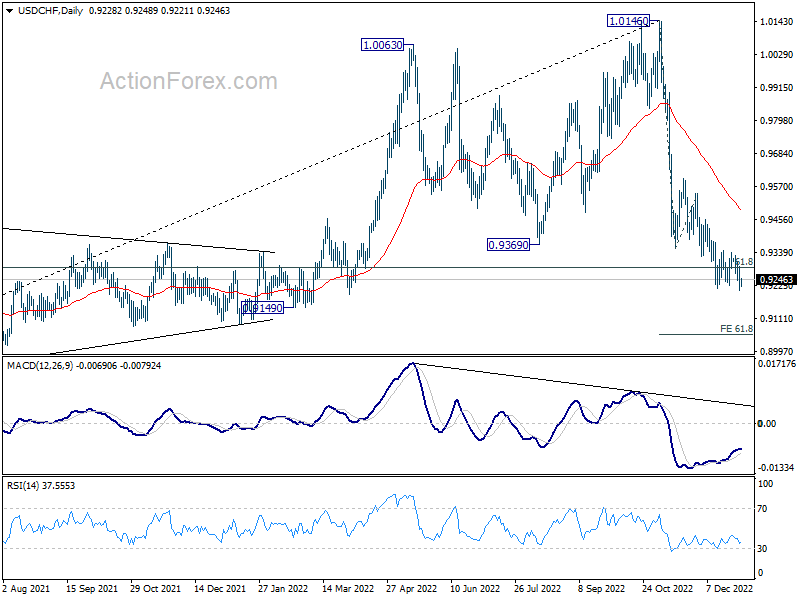
Daily Pivots: (S1) 0.9198; (P) 0.9246; (R1) 0.9282; More...
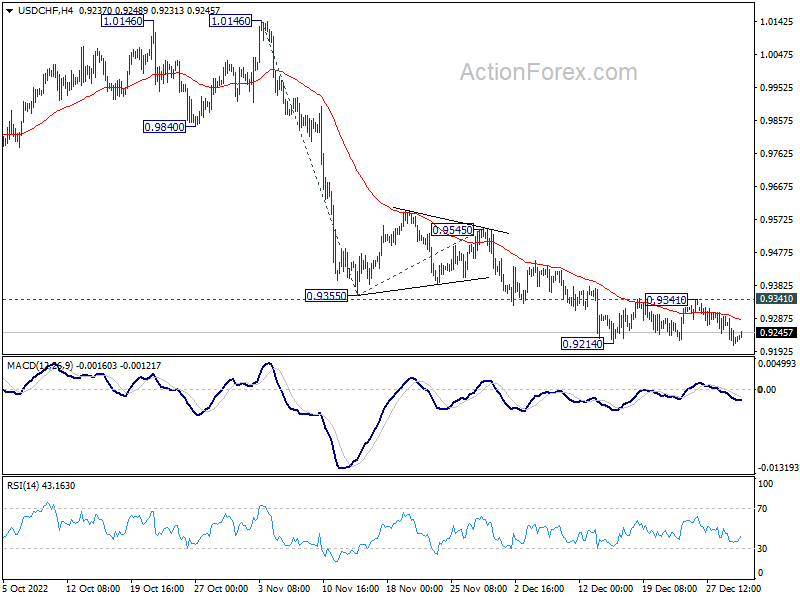
Intraday bias in USD/CHF remains on the downside for the moment. Decline from 1.0146 would target 61.8% projection of 1.0146 to 0.9355 from 0.9545 at 0.9056. For now, outlook will remain bearish as long as 0.9341 resistance holds, in case of recovery.
In the bigger picture, rise from 0.8756 (2021 low) has completed at 1.0146, well ahead of 1.0342 long term resistance (2016 high). Based on current downside momentum, fall from 1.0146 might be a medium term down trend itself. Sustained break of 61.8% retracement of 0.8756 to 1.0146 at 0.9287 will pave the way to 0.8756. In any case, risk will stay on the downside as long as 0.9545 resistance holds.
GBP/USD Daily Outlook
Daily Pivots: (S1) 1.2021; (P) 1.2050; (R1) 1.2085; More...
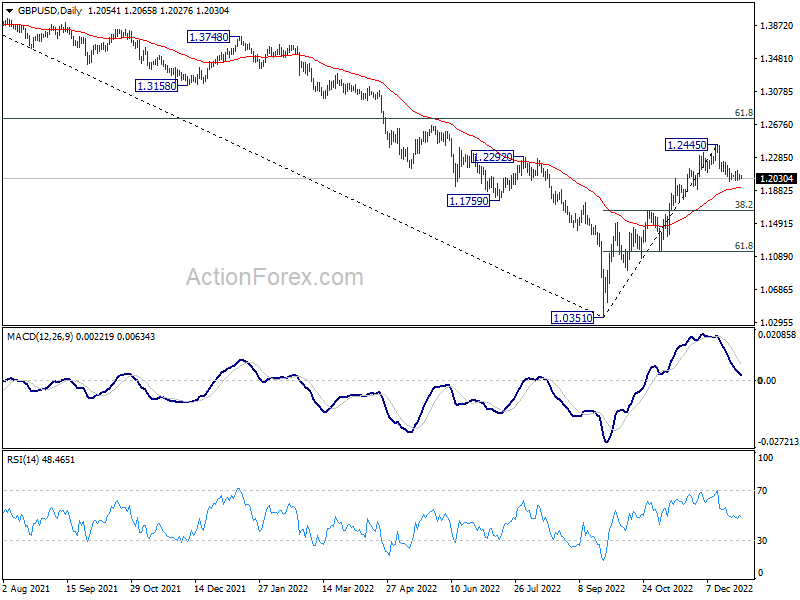
Intraday bias in GBP/USD remains neutral as range trading continues. On the downside, break of 1.1991 will resume the fall from 1.2445 to 55 day EMA (now at 1.1916). Firm break there will target 38.2% retracement of 1.0351 to 1.2445 at 1.1645. On the upside, break of 1.2240 minor resistance will turn bias back to the upside for retesting 1.2445 instead.
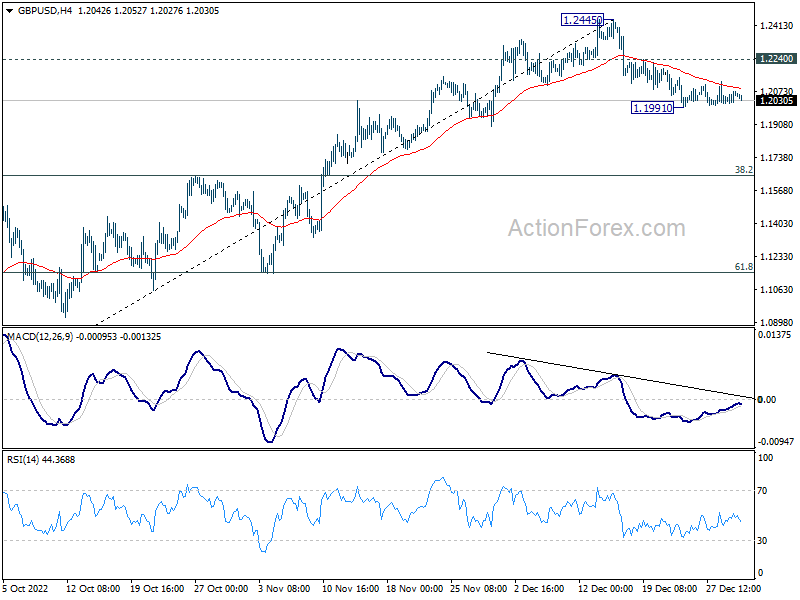
In the bigger picture, rise from 1.0351 medium term bottom is at least correcting whole down trend from 1.4248 (2021 high). Further rise is expected as long as 1.1644 resistance turned support holds. Next target is 61.8% retracement of 1.4248 to 1.0351 at 1.2759. Sustained break there will pave the way back to 1.4248. This will remain the favored case as long as 55 day EMA (now at 1.1916) holds.