Sample Category Title
The Major Take of 2022: End of the Cheap Money Era
US indices rallied yesterday, in an effort to recover a part of the past few session losses, rather than a fresh move, on fresh news, as there was no fresh news yesterday.
But yesterday’s jump in US indices was relatively strong, perhaps due to thin trading volumes that make look the year-end moves impressive, while they are not.
Anyway, the S&P 500 gained 1.75% yesterday, and could maybe finish the year with less than a 20% loss, while Nasdaq jumped more than 2.50%, but will still end the year with more than a 30% drawdown.
Things have changed so much in one year!
The pivot
Remember, last year at this time, we were about to see Apple become the world’s first $3 trillion company. The S&P500 and Nasdaq were running from record to record, and no one imagined how bad the hangover would be.
We didn’t know it at that time but the 2022 bear market officially kicked off just a couple of days after the year started, when the first FOMC minutes release of the year showed that the Federal Reserve (Fed) was no kidding about the rate hikes, and that the financial conditions would get real tighter over the year.
And man, they got tighter… way tighter than we expected a year ago, with the Fed raising its interest rates 425bp starting from March.
As a result, Apple lost a third of its value, Amazon lost half of its valuation since the beginning of the year and, this month, became the first US big cap to lose more than $1 trillion in valuation. Netflix lost up to 75% of its value compared to November 2021 peak, and Facebook scraped 77% of its value since September 2021 peak.
It has been a terrible year for chipmakers as well. Nvidia, one of the most promising and hyped chipmakers in the US has also lost half of its valuation as, on top of slowing post-pandemic demand, the US blocked exports to the fructuous Chinese market.
And last but not least, Tesla contributed greatly to the fall of the S&P500, losing almost half of its valuation only since the start of the year. And the share price is down by more than 70% since its November 2021 peak, as Elon Musk made the headlines again this year, but not for good reasons. Twitter has in fact taken a huge toll on man’s reputation. 2022 hasn’t been his year.
A bad year
In reality, 2022 hasn’t been the year of no one, I guess. A was started in Ukraine as soon as end February and wreaked havoc in the markets. The Western nations imposed sanctions on Russia in March. Ruble lost half of its value against the dollar at the wake of its first attack in Ukraine, but only to close the year flat, and even slightly stronger against the dollar compared to before the war, as the skyrocketing oil prices filled the country’s coffers.
Oil on the other hand soared to $130pb at the wake of Russia’s first attacks on Ukraine. We had all kind of speculation that it would rally to the $180-200pb area. But Thank God that didn’t happen. We are preparing to end the year below $80pb instead, as the recession fears took a toll on bullish bets.
But energy stocks had a great year. Exxon Mobil, Chevron, BP, Shell did so great that the desperate Western governments watching inflation cause a huge cost of living crisis decided to impose windfall taxes on these companies who announced jaw dropping earnings throughout the year and Exxon ended up suing the EU for this decision just a couple of days ago.
While all this was happening, the US’ national debt went above the $30 trillion mark.
But the US dollar gained, as the Fed raised rates. Others raised rates as well, but the dollar kept rising.
Cryptocurrencies saw massive outflows, and the outflows revealed the cracks in the system, causing the collapse of the major institutions like Terra Luna, and FTX lately.
And gold hasn’t been great in tempering inflation, but at the end of the year, and despite the soaring yields, the yellow metal managed to recover yearly losses, and is even preparing to end the year around 1% higher than where it started in US dollar terms.
So voilà. Everything looked ugly this year, except for energy and the US dollar.
The major take of 2022
The most important take of the year is: the era of easy money ended, and ended for good. It means that the financial markets won’t look like anything we knew since the subprime crisis.
This is the beginning of a new era, when central banks will be playing a more subdued role in the markets, with less liquidity available to fix problems – a more than necessary move that came perhaps too late, and too painfully.
And given that there is still plenty of cheap central bank liquidity waiting to be pulled back, the situation may not get better before it gets worse in the first quarters of next year. Recession, inflation, stagflation will likely dominate headlines next year.
Happy New Year!
GBP/JPY Daily Outlook
Daily Pivots: (S1) 160.22; (P) 160.58; (R1) 160.97; More...
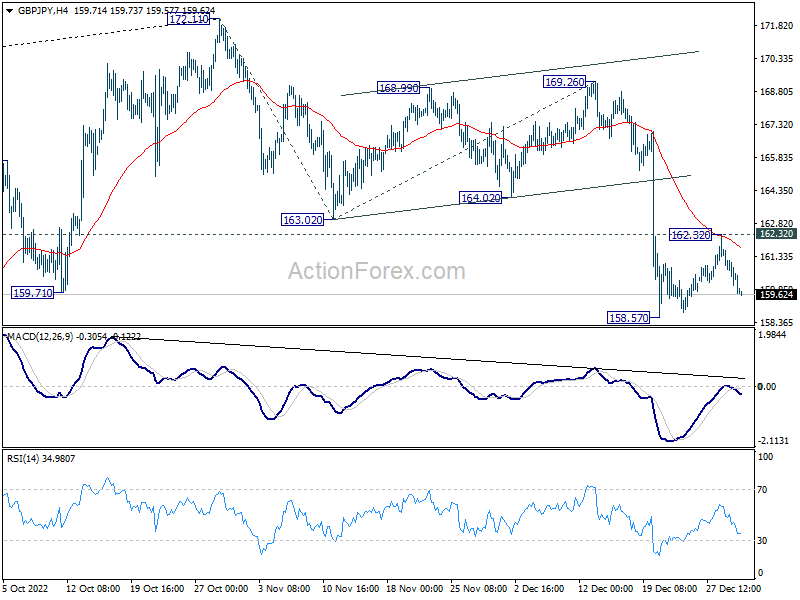
GBP/JPY declined again after rejection by 4 hour 55 EMA, but stays above 158.57 support. Intraday bias remains neutral first and further decline is expected. On the downside, firm break of 158.57 will target 161.8% projection of 172.11 to 163.02 from 169.26 at 154.55 next. However, break of 162.32 resistance will turn bias to the upside for stronger rebound.
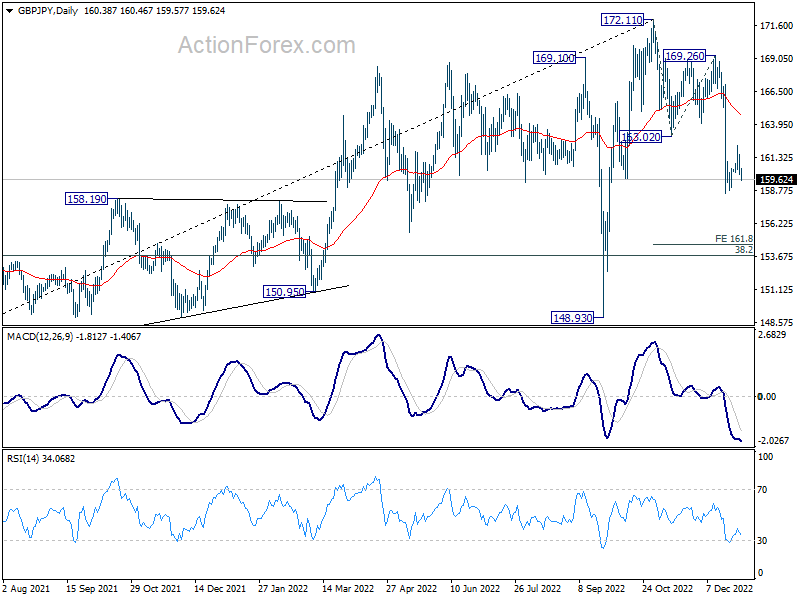
In the bigger picture, sustained break of 55 week EMA (now at 161.26) will confirm medium term topping at 172.11, on bearish divergence condition in weekly MACD. Fall from 172.11 should be correcting whole up trend from 123.94 (2020 low). Deeper decline should be seen to 38.2% retracement of 123.94 to 172.11 at 153.70 and possibly below. This will now remain the favored case as long as 55 day EMA (now at 166.11) holds.
Yen Extends Rebound to End as December’s Winner
Yen's rebound continues in Asian session today, and looks set to end as the best performer for the month. Swiss Franc follows as the next strongest with much help from buying against Euro and Sterling, and overall bearish market sentiment. Canadian and Australian Dollars are the worst in December for the same reason while Dollar is mixed. Volatility today, if there's any, should be looked through. The real moves will only come next week with lots of evens including FOMC minutes and NFP.
In Asia, Nikkei closed flat. Hong Kong HSI is up 0.39%. China Shanghai SSE is up 0.65%. Singapore Strait Times is up 0.22%. Japan 10-year JGB yield is down -0.0272 at 0.421. Overnight, DOW rose 1.05%. S&P 500 rose 1.75%. NASDAQ rose 2.59%. 10-year yield dropped -0.052 to 3.835.
Happy new year to our readers. We'll be back on January 3.
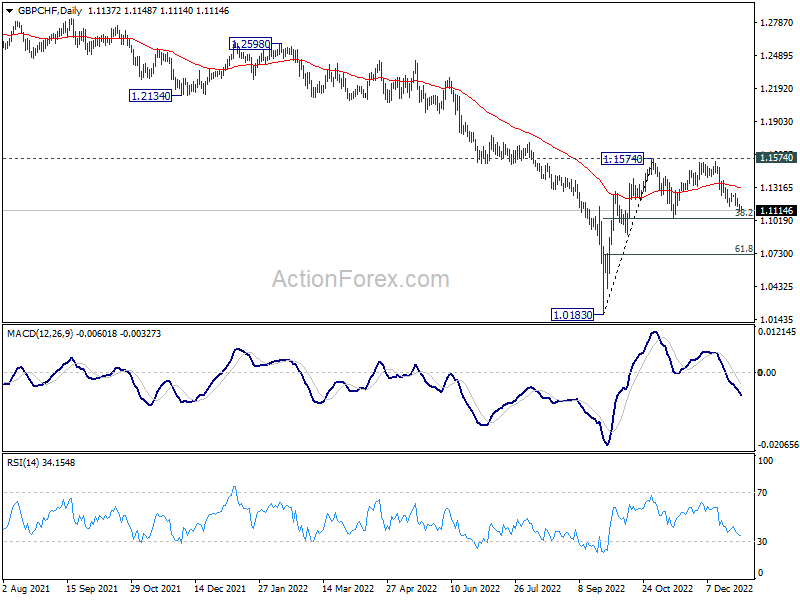
GBP/CHF continues consolidation pattern, targeting 1.104
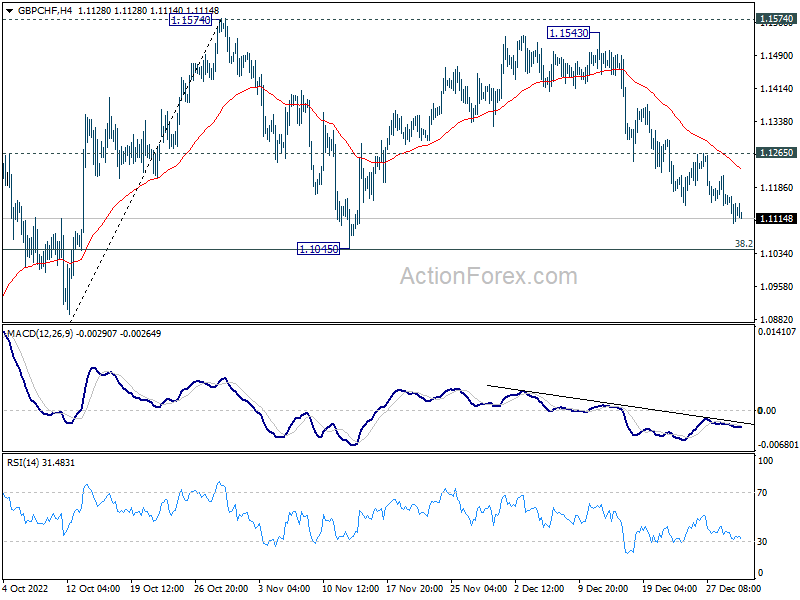
GBP/CHF is so far one of the top movers for the week, even though over movements in the markets are rather indecisive. The decline from 1.1543 is seen as the third leg of the consolidation pattern from 1.1574. Deeper fall is expected as long as 1.1265 resistance holds.
Strong support could be seen around 1.1045 cluster (38.2% retracement of 1.1043) to complete the three-wave pattern. Break of 1.1265 resistance will bring stronger rise back to retest 1.1574. Nevertheless, sustained break of 1.1043/5 will be a sign of trend reversal, and target 61.8% retracement at 1.0714.
PBoC makes largest weekly cash injection since 2019
PBoC injected CNY 183B (USD 25.28B) of liquidity through seven-day reverse repurchases agreements in open market operations today. The China's central bank said it's for "maintaining steady year-end liquidity level". Through the week, PBoC injected a net CNY 975B, the largest amount since January 2019.
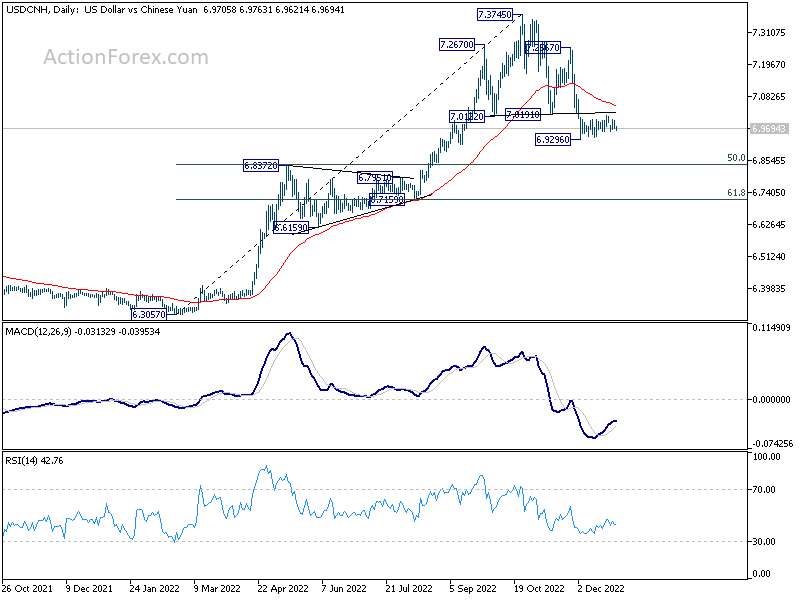
USD/CNH has been steadily in range since hitting 6.9296 earlier this month. Upside is so far capped by head and shoulder top neck line, and below 55 day EMA. Further decline remains in favor for now. As a correction to the up trend from 6.3057 to 7.3745, deeper fall would be seen to 6.8372 resistance turned support before bottoming.
Looking ahead
Swiss KOF economic barometer and US Chicago PMI are the only features today.
GBP/JPY Daily Outlook
Daily Pivots: (S1) 160.22; (P) 160.58; (R1) 160.97; More...
GBP/JPY declined again after rejection by 4 hour 55 EMA, but stays above 158.57 support. Intraday bias remains neutral first and further decline is expected. On the downside, firm break of 158.57 will target 161.8% projection of 172.11 to 163.02 from 169.26 at 154.55 next. However, break of 162.32 resistance will turn bias to the upside for stronger rebound.
In the bigger picture, sustained break of 55 week EMA (now at 161.26) will confirm medium term topping at 172.11, on bearish divergence condition in weekly MACD. Fall from 172.11 should be correcting whole up trend from 123.94 (2020 low). Deeper decline should be seen to 38.2% retracement of 123.94 to 172.11 at 153.70 and possibly below. This will now remain the favored case as long as 55 day EMA (now at 166.11) holds.
Economic Indicators Update
| GMT | Ccy | Events | Actual | Forecast | Previous | Revised |
|---|---|---|---|---|---|---|
| 08:00 | CHF | KOF Leading Indicator Dec | 90.9 | 89.5 | ||
| 14:45 | USD | Chicago PMI Dec | 41.2 | 37.2 |
Technical Outlook and Review
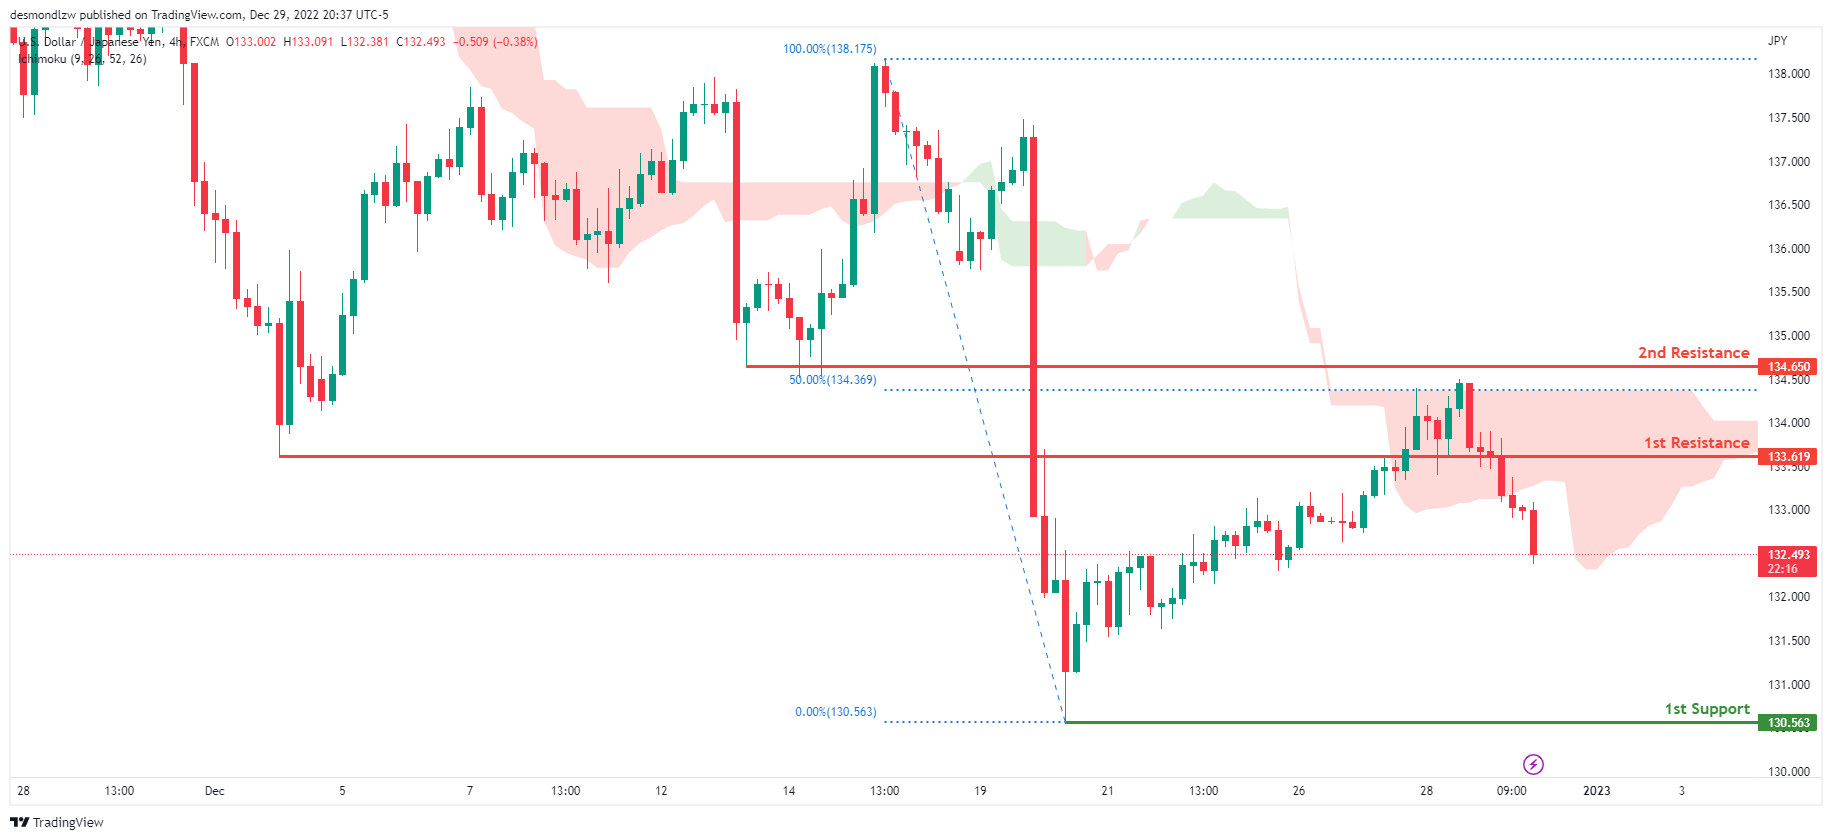
USD/JPY:
Looking at the H4 chart, my overall bias for USDJPY is bearish due to the current price being below the Ichimoku cloud, indicating a bearish market. If this bearish momentum continues, expect price to possibly continue heading towards the 1st support at 130.563, where the previous swing low is. In an alternate scenario, price could possibly head back up towards the 1st resistance level at 133.619, where the previous swing low is located
Areas of consideration:
- H4 time frame, 1st resistance at 133.619
- H4 time frame, 1st support at 130.563
DXY:
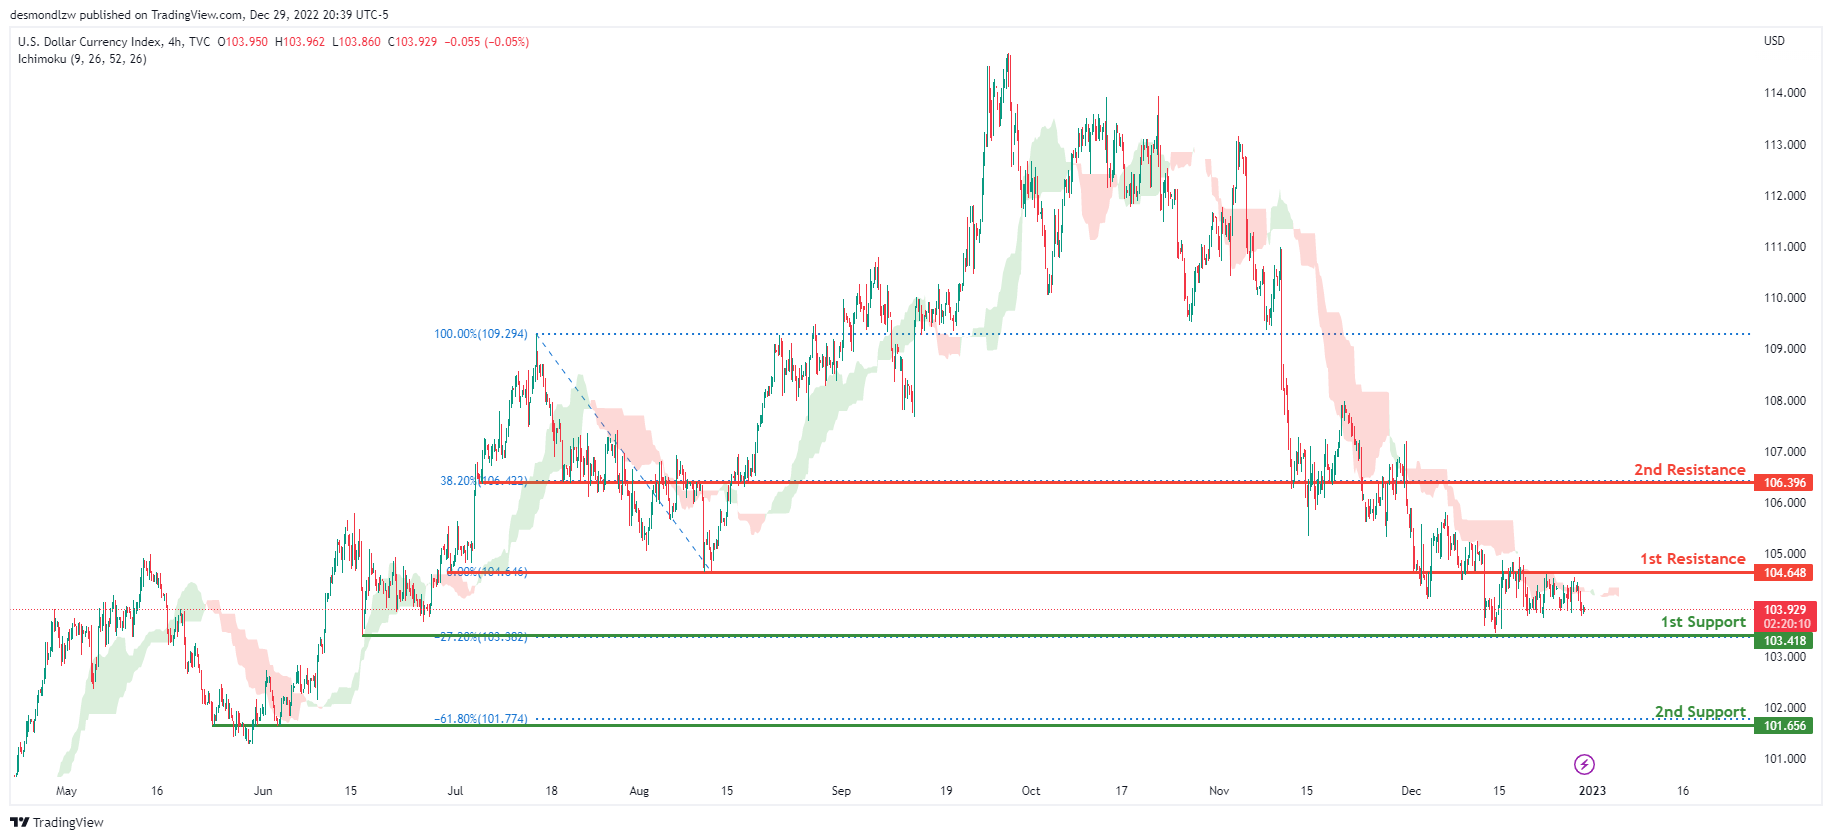
On the H4 chart, the overall bias for DXY is bearish. To add confluence to this, the price is below the Ichimoku cloud which indicates a bearish market. If this bearish momentum continues, expect the price to possibly break the 1st support line at 103.418, where the -27.2% Fibonacci expansion line is before heading towards the 2nd support at 101.656, where the -61.8% Fibonacci expansion line is. In an alternative scenario, price could head back up and break the 1st resistance line resistance at 104.648, where the previous swing low is before heading towards the 2nd resistance at 106.396, where the 38.2% Fibonacci line is.
Areas of consideration:
- H4 time frame, 1st resistance at 104.648
- H4 time frame, 1st support at 103.418
- H4 time frame, 2nd support at 101.656
EUR/USD:
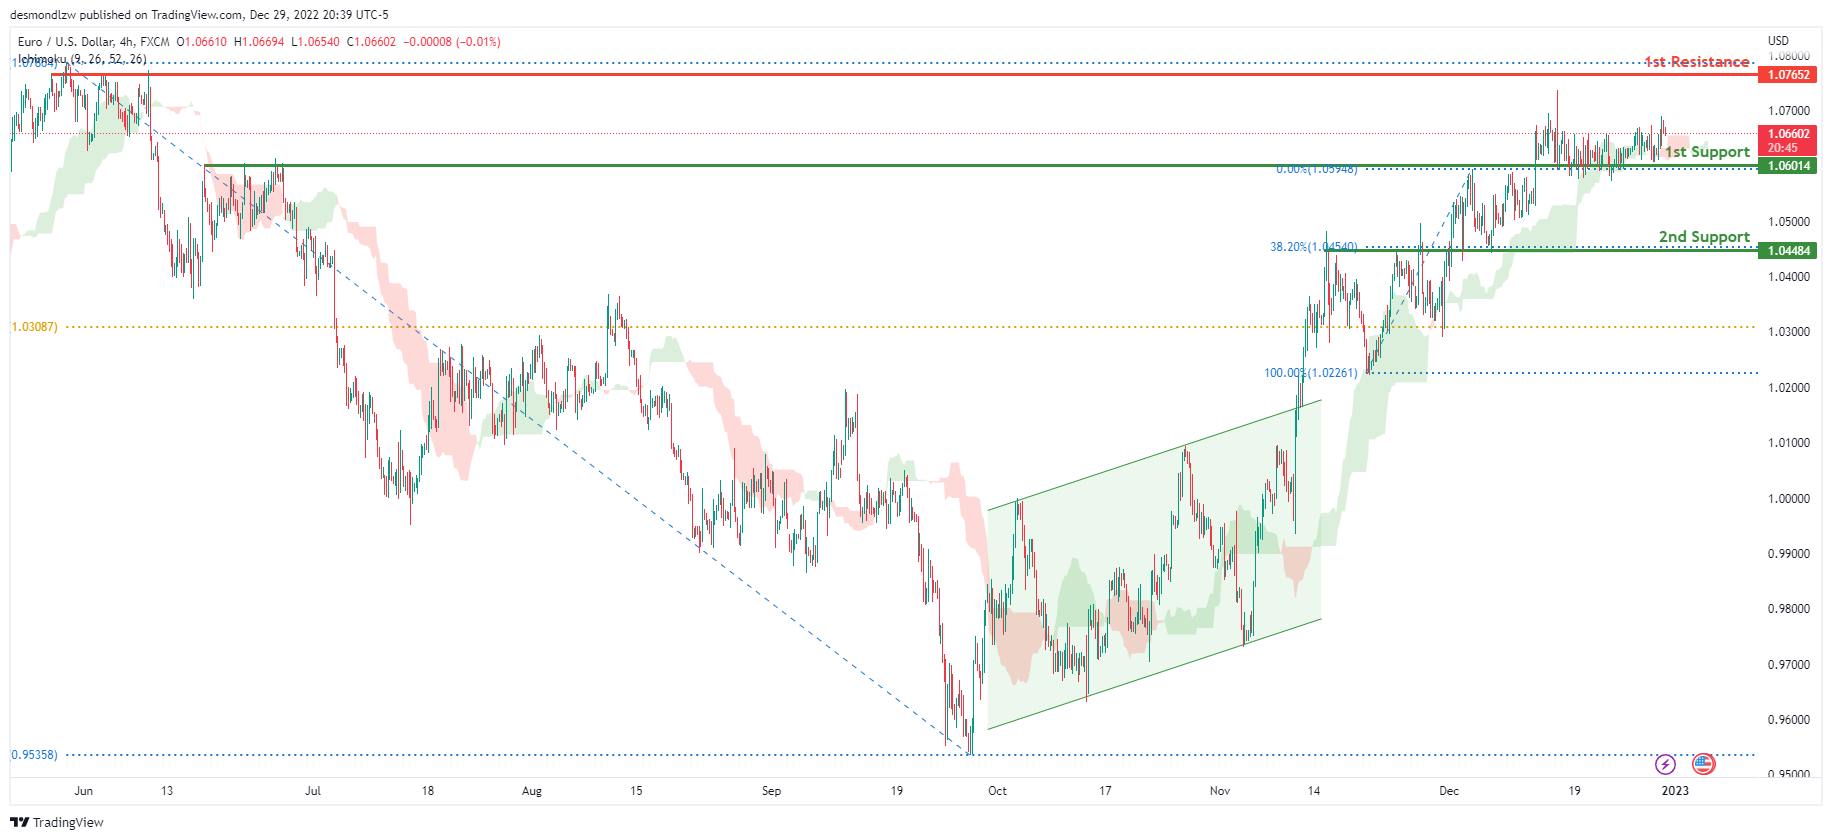
Looking at the H4 chart, my overall bias for EURUSD is bullish due to the current price being above the Ichimoku cloud, indicating a bullish market. To add confluence to this bias, price has also broken above the ascending bullish channel. If this bullish momentum continues, expect the price to possibly head towards the 1st resistance at 1.07652, where the previous swing high is. In an alternate scenario, price could possibly head back down to break the 1st support level at 1.06014, where the previous swing high and 78.6% Fibonacci line are located before heading towards the 2nd support at 1.04484, where the 38.2% Fibonacci line is.
Areas of consideration :
- H4 1st resistance at 1.07652
- H4 1st support at 1.06014
- H4 2nd support at 1.04484
GBP/USD:
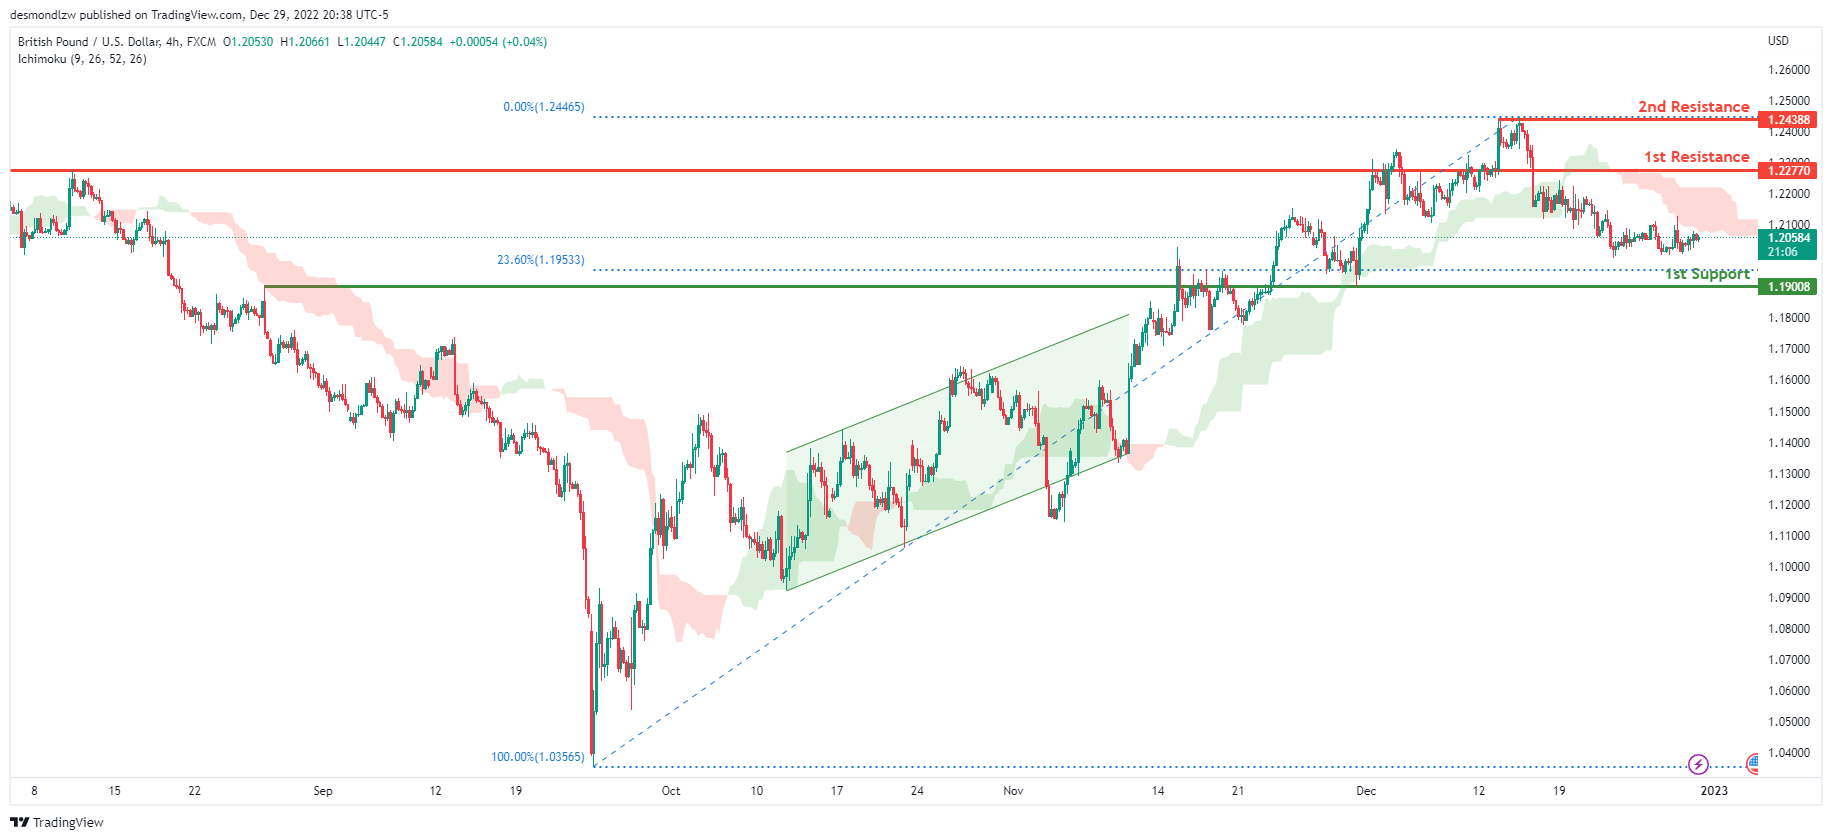
Looking at the H4 chart, my overall bias for GBPUSD is bearish due to the current price being below the Ichimoku cloud, indicating a bearish market. If this bearish momentum continues, expect price to possibly continue heading towards the 1st support at 1.19008, where the 23.6% Fibonacci line is. In an alternate scenario, price could possibly head back up to retest the 1st resistance level at 1.22770, where the previous swing high is.
Areas of consideration:
- H4 1st resistance at 1.22770
- H4 1st support at 1.19008
USD/CHF:
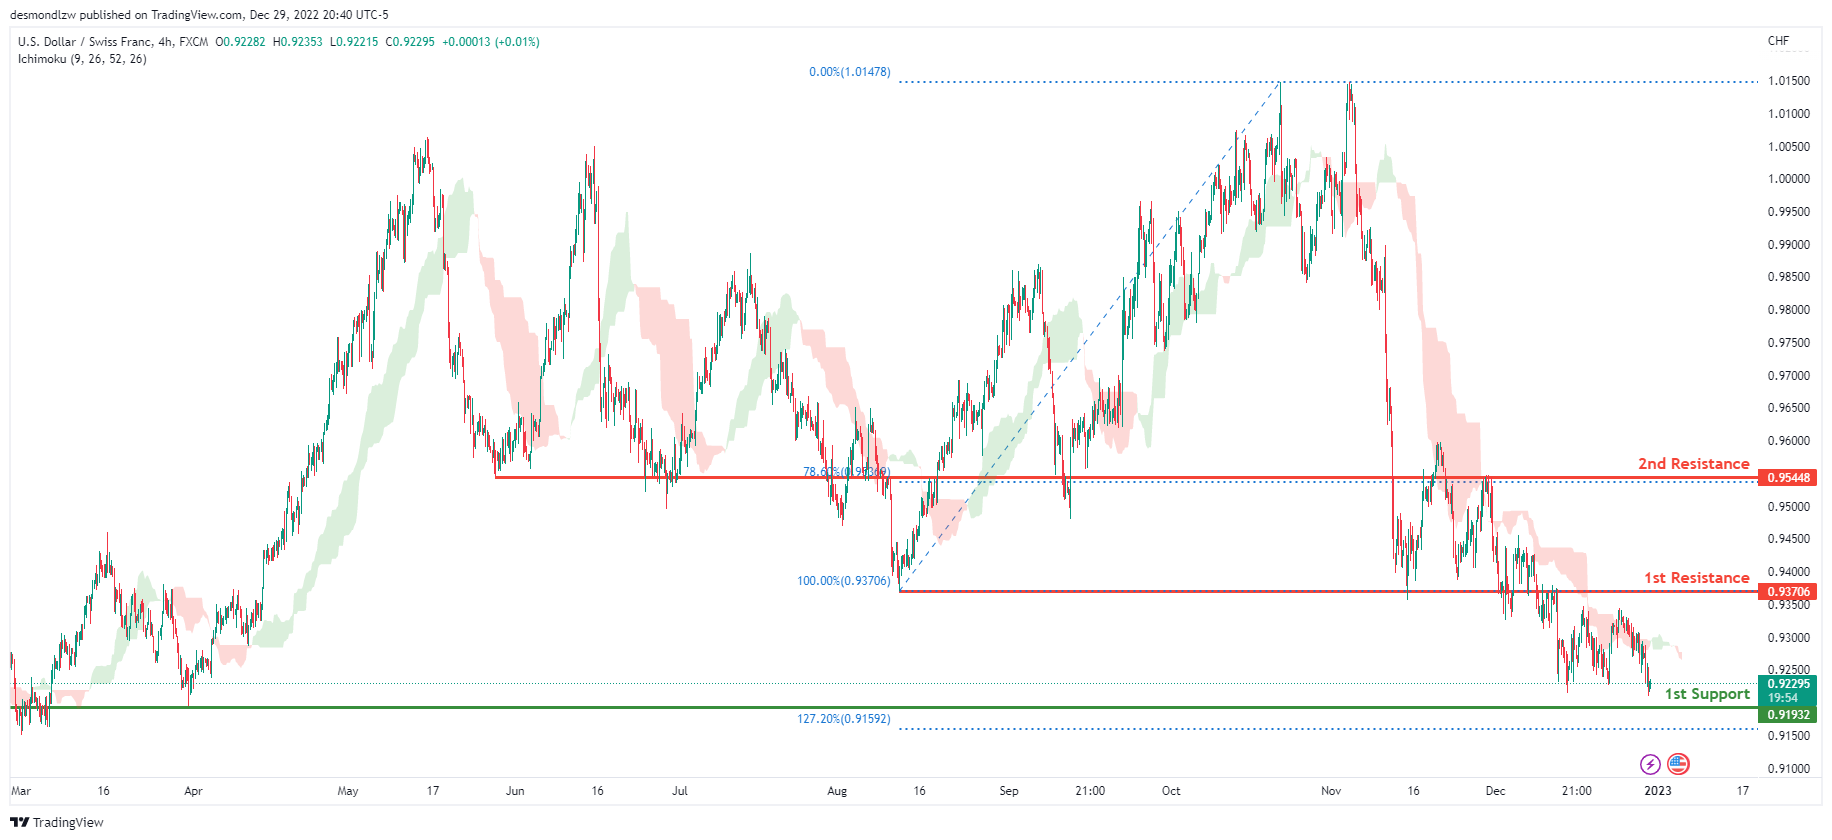
The overall bias for USDCHF on the H4 chart is bearish. In addition, the price is crossing below the Ichimoku cloud, indicating a bearish market. If the current bearish trend continues, expect the price to head back down towards the 1st support line at 0.91932, where the previous swing low and 12.72% Fibonacci extension line is . In an alternative scenario, price could possibly head up towards the 1st resistance at 0.93706, where the previous swing low is .
Areas of consideration
- H4 1st support at 0.91932
- H4 1st resistance at 0.93706
XAU/USD (GOLD):
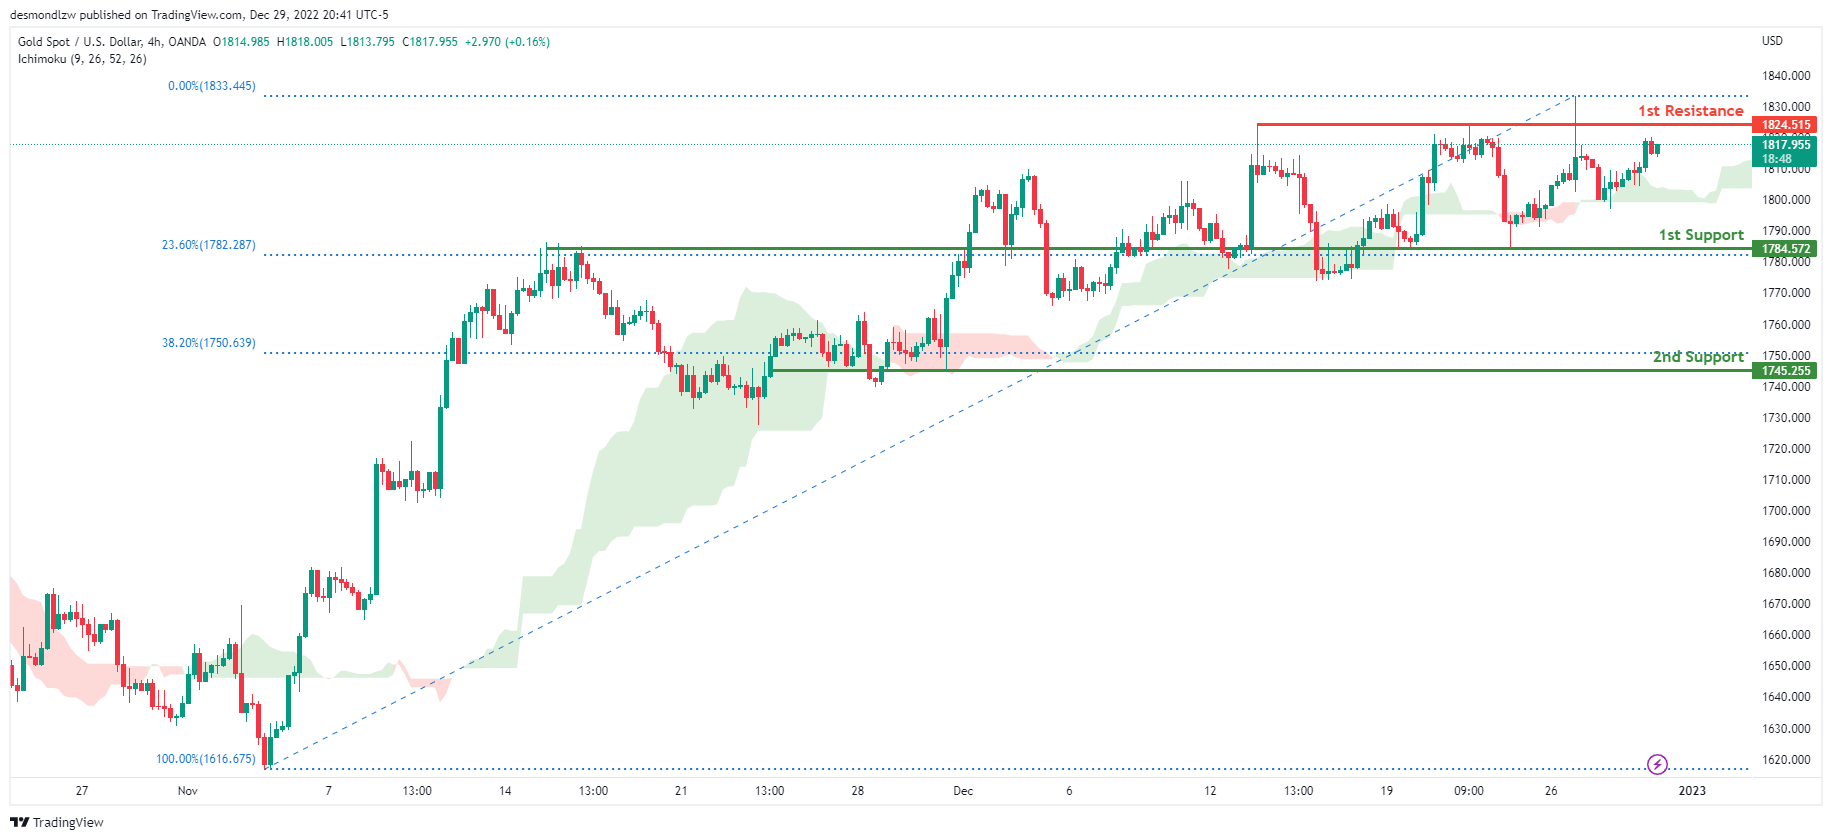
Looking at the H4 chart, my overall bias for XAUUSD is bullish due to the current price crossing above the Ichimoku cloud, indicating a bullish market. If this bullish momentum continues, expect the price to continue heading towards the 1st resistance at 1824.515 where the recent high is. In an alternative scenario, price could possibly head back down to break the 1st support at 1784.572, where the previous high is before heading towards the 2nd support at 1745.255, where the 38.2% Fibonacci line is.
Areas of consideration:
- H4 time frame, 1st resistance at 1824.515
- H4 time frame, 1st support at 1784.572
- H4 time frame, 2nd support at 1745.255
AUD/USD:
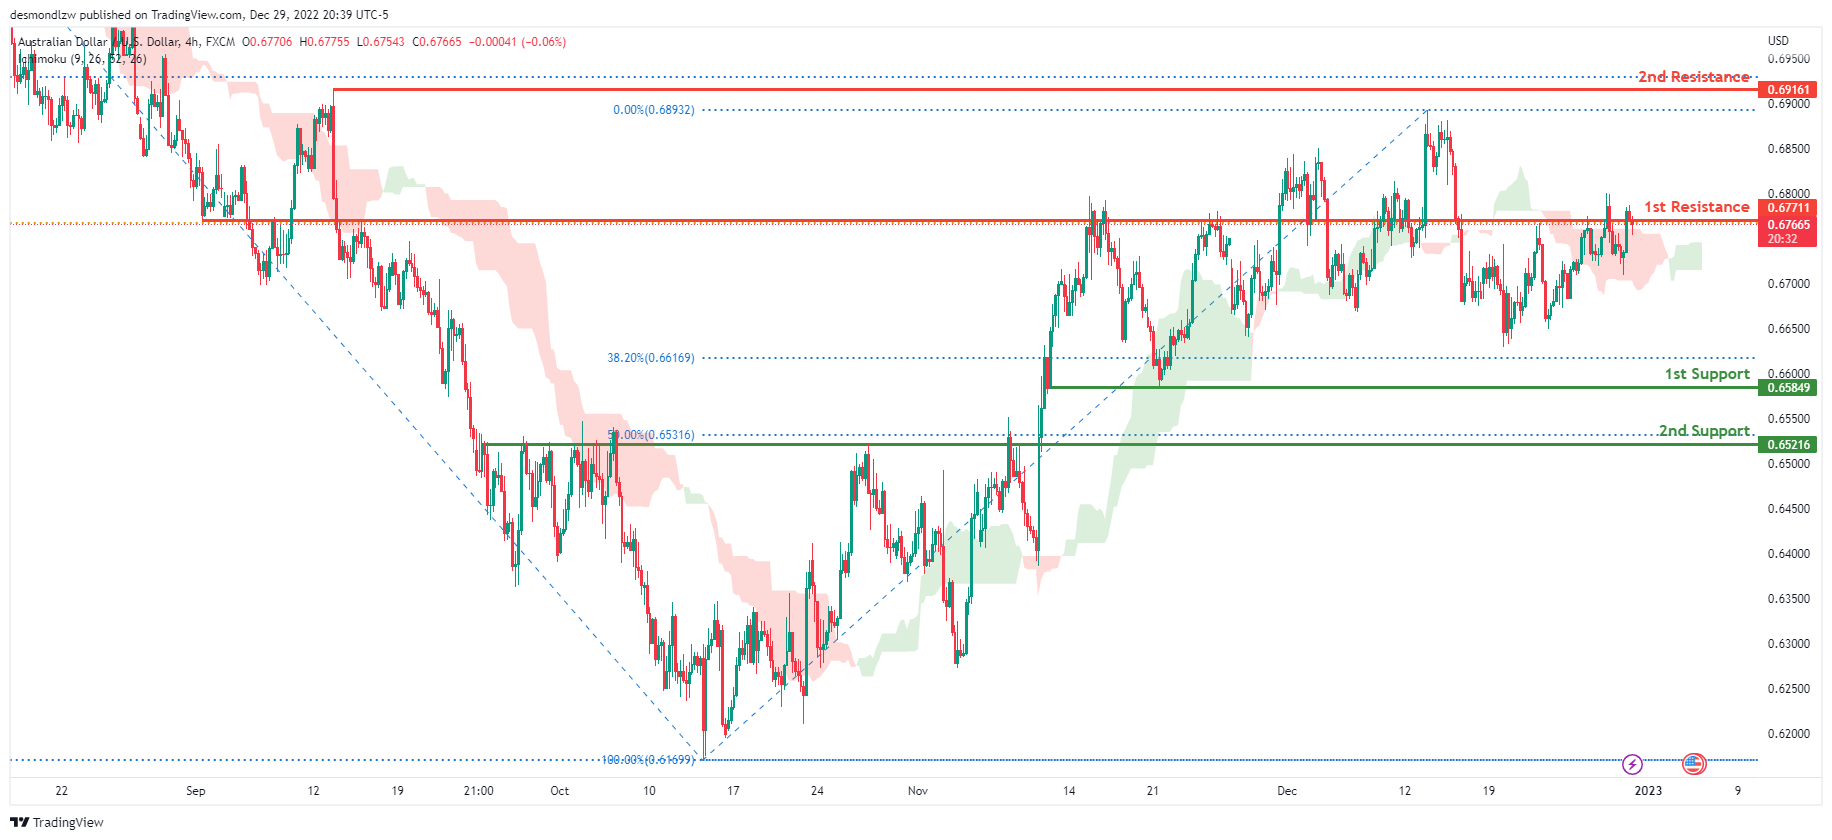
Looking at the H4 chart, my overall bias for AUDUSD is bearish due to the current price crossing below the Ichimoku cloud, indicating a bearish market. If this bearish momentum continues, expect the price to continue heading towards the 1st support at 0.65849, where the 78.6% Fibonacci line is. In an alternative scenario, price could possibly head back up towards the 1st resistance at 0.67711, where the 61.8% Fibonacci line is.
Areas of consideration
- H4, 1st resistance at 0.67711
- H4, 1st support at 0.65849
NZD/USD:
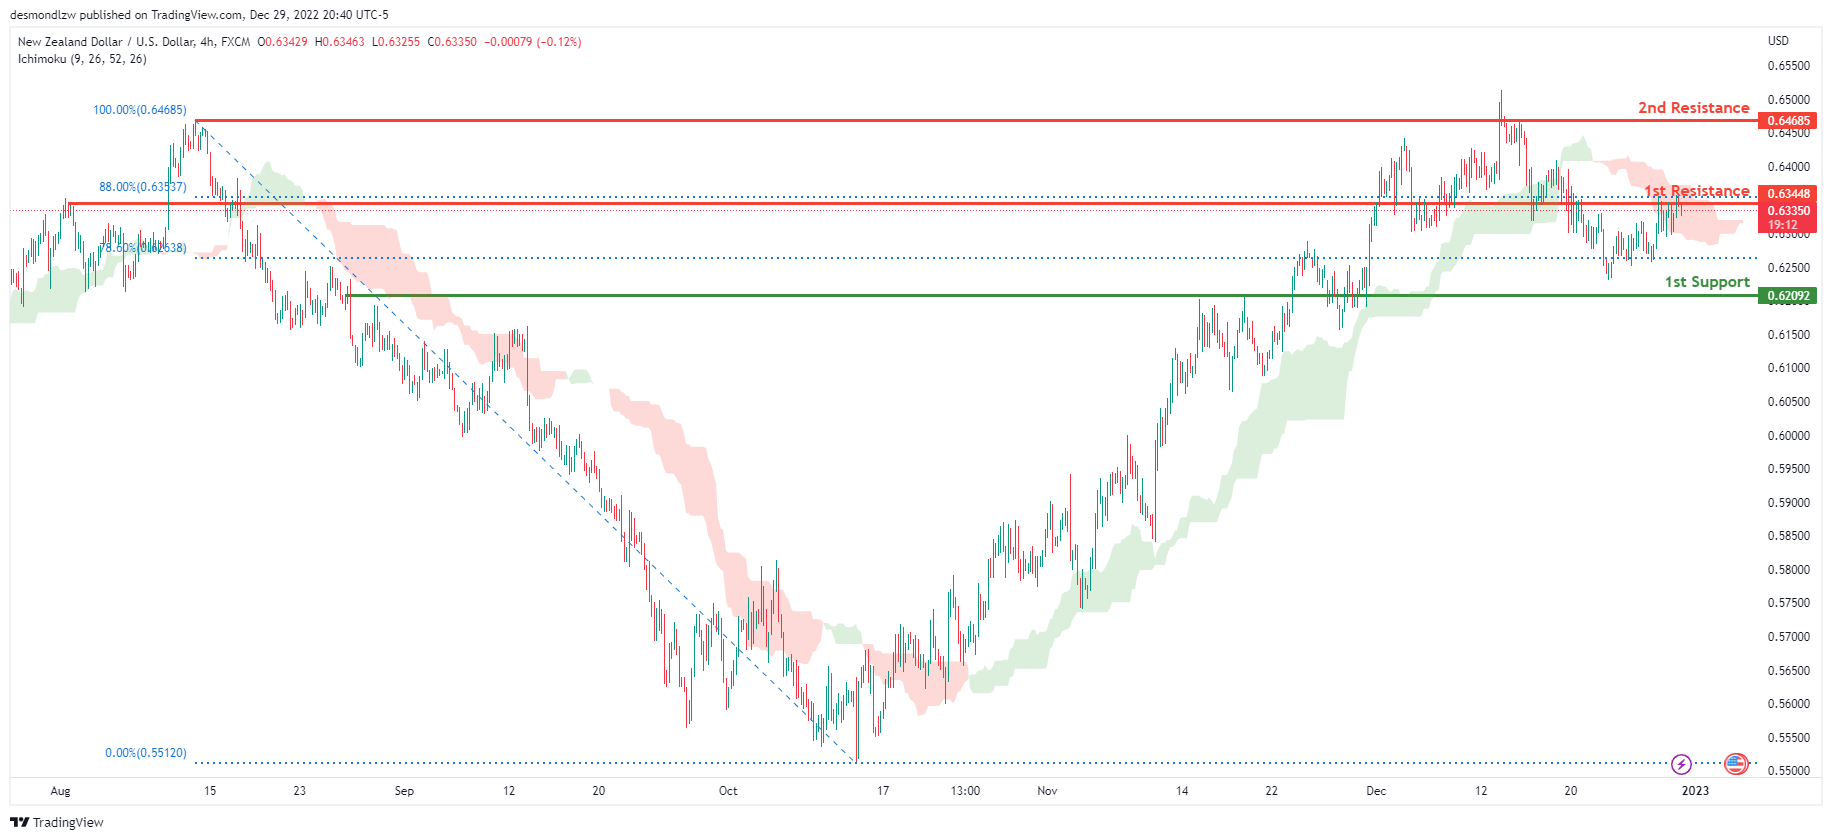
Looking at the H4 chart, my overall bias for NZDUSD is bearish due to the current price being below the Ichimoku cloud, indicating a bearish market. If this bearish momentum continues, expect price to possibly continue heading towards the 1st support at 0.62092, where the 78.6% Fibonacci line is. In an alternate scenario, price could possibly head back up towards the 1st resistance level at 0.63448, where the 88% Fibonacci line is.
Areas of consideration:
- H4 time frame, 1st resistance at 0.63448
- H4 time frame, 1st support at 0.62092
USD/CAD:
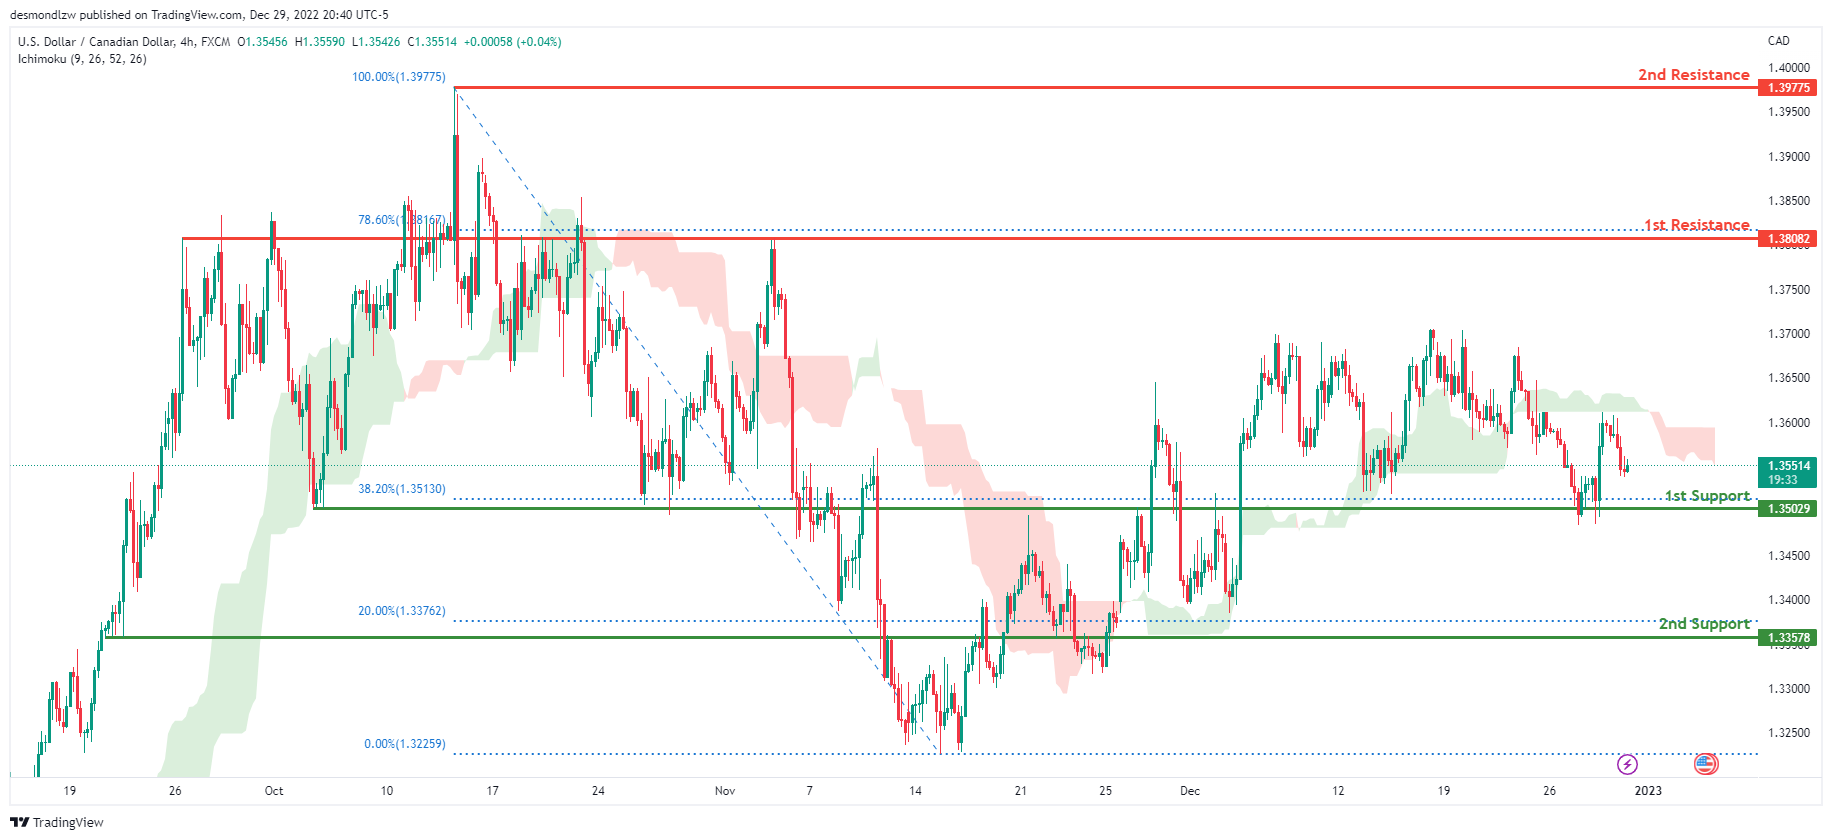
On the H4 chart, the overall bias for USDCAD is bearish. To add confluence to this, the price is below the Ichimoku cloud which indicates a bearish market. If this bearish momentum continues, expect the price to possibly break the 1st support at 1.35029, where the 38.2% Fibonacci line is, before heading towards the 2nd support at 1.33578, where the 20% Fibonacci line is. In an alternative scenario, price could head towards 1st resistance line at 1.38082, where the 78.6% Fibonacci line is.
Areas of consideration:
- H4 time frame, 1st resistance at 1.38082
- H4 time frame, 2nd resistance at 1.39775
- H4 time frame, 1st support at 1.35029
- H4 time frame, 2nd support at 1.33578
OIL:
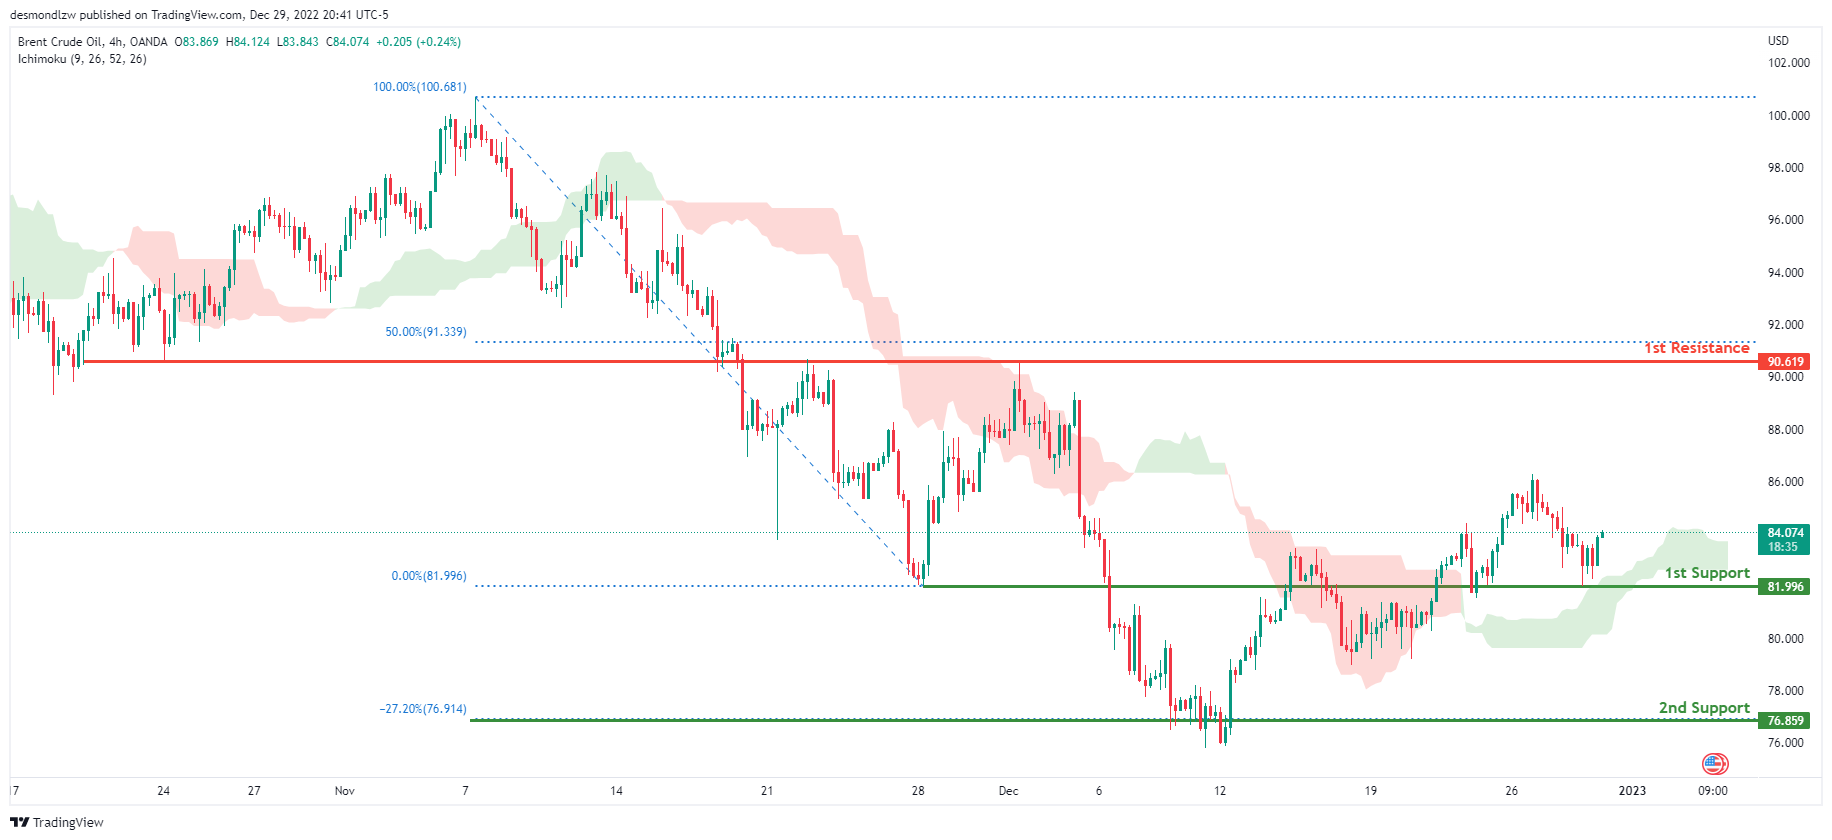
Looking at the H4 chart, my overall bias for BCOUSD is bullish due to the current price being above the Ichimoku cloud, indicating a bullish market. If this bullish momentum continues, expect the price to possibly head towards the 1st resistance at 90.619, where the 50% Fibonacci line is. In an alternate scenario, price could possibly head back down to retest the 1st support level at 81.996, where the previous low is located.
Areas of consideration:
- H4 time frame, 1st resistance at 90.619
- H4 time frame, 1st support at 81.996
Dow Jones Industrial Average:
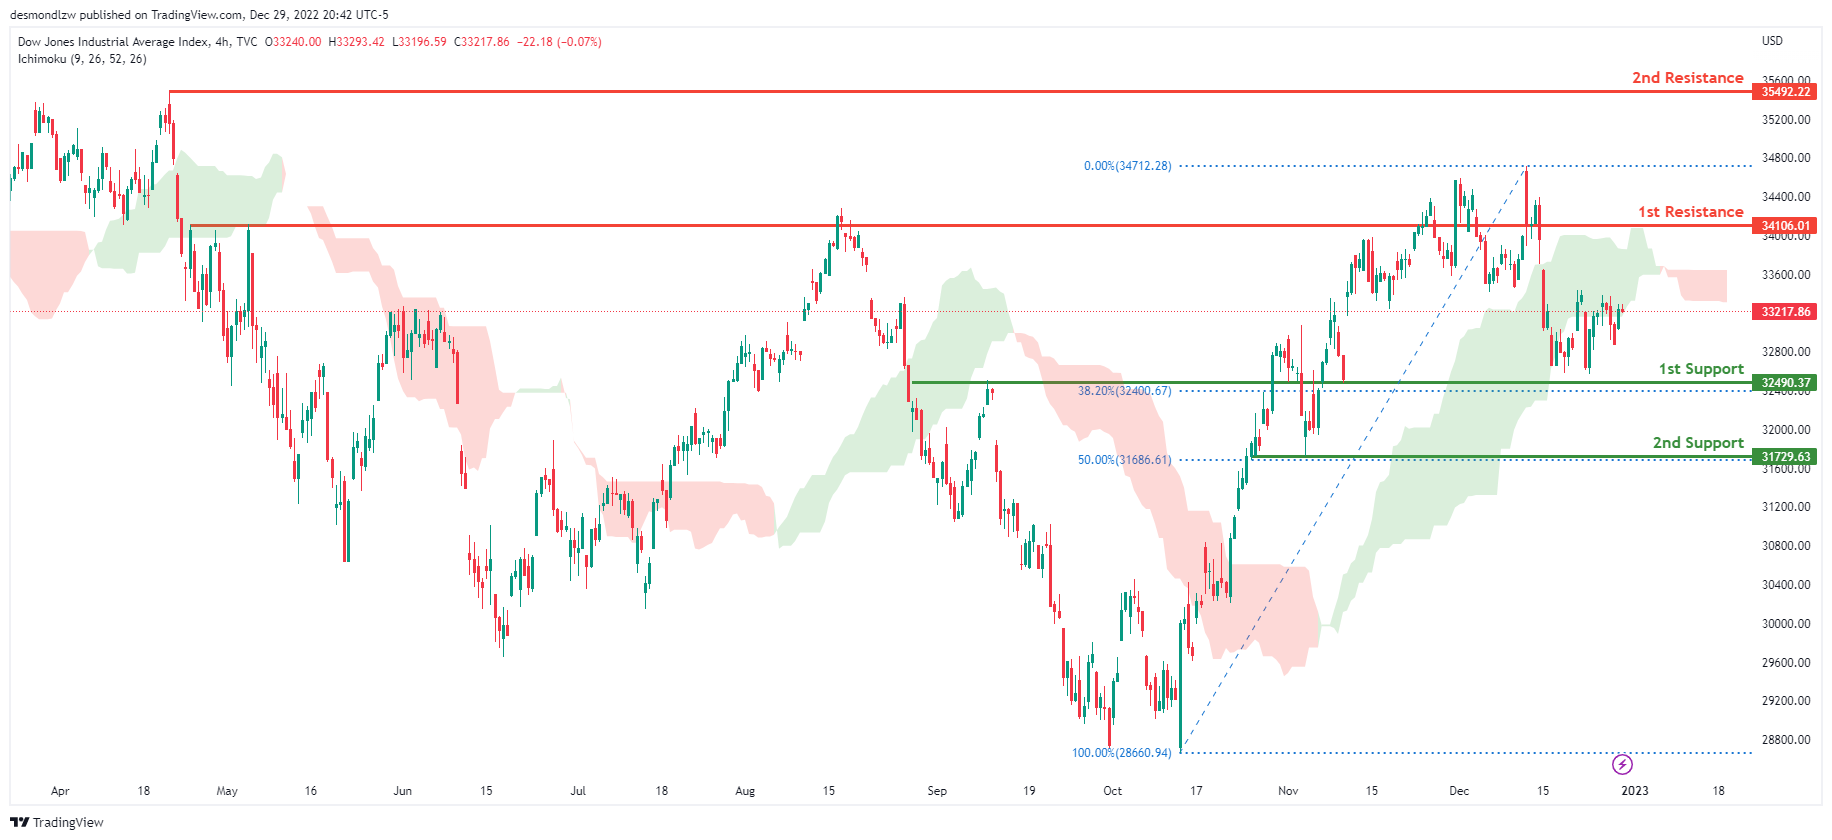
On the H4 chart, the overall bias for DJI is bearish. To add confluence to this, the price is crossing below the Ichimoku cloud which indicates a bearish market. If this bearish momentum continues, expect the price to head back down towards the 1st support at 32490.37, where the 61.8% Fibonacci line is. In an alternative scenario, price could possibly break the 1st resistance line at 34106.01, where the previous swing high is before heading towards the 2nd resistance line at 35492.22, where the previous swing high is.
Areas of consideration:
- H4 time frame, 1st support at 32490.37
- H4 time frame, 1st Resistance at 34106.01
- H4 time frame, 2nd Resistance at 35492.22
DAX:
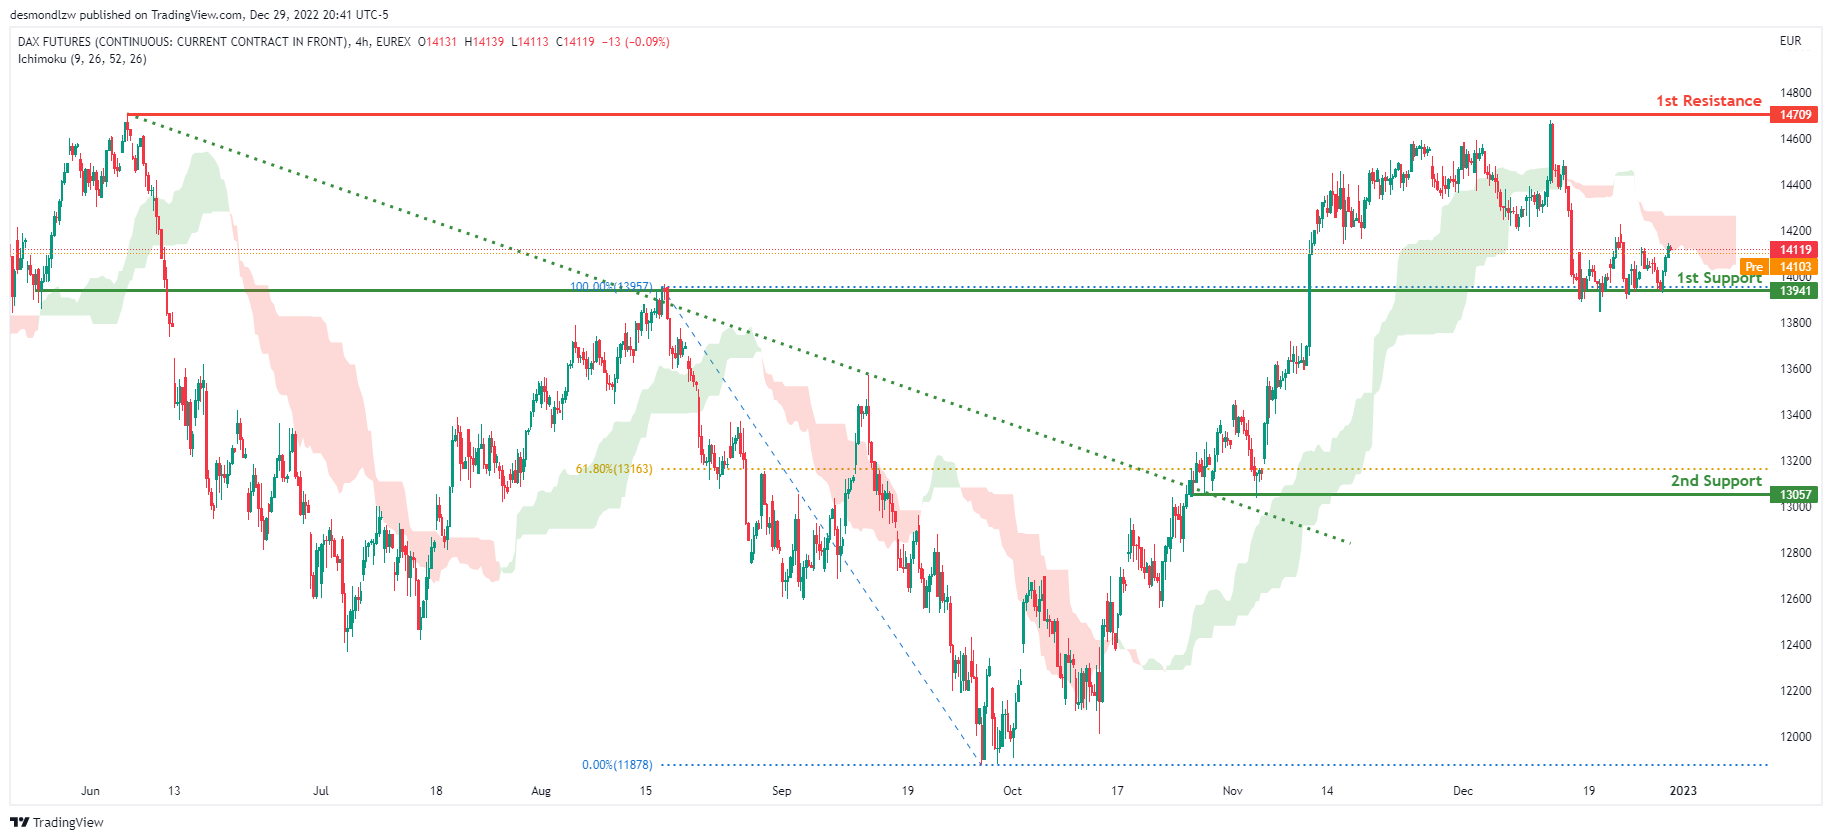
Looking at the H4 chart, my overall bias for DAX is bearish due to the current price being below the Ichimoku cloud, indicating a bearish market. If this bearish momentum continues, expect price to break the 1st support at 13941 where the previous swing high is before heading towards the 2nd support at 13057, where the 61.8% Fibonacci line is. In an alternative scenario, price could possibly head back up to retest the 1st resistance at 14709, where the previous swing high is.
Areas of consideration:
- H4 time frame, 1st resistance is at 14709
- H4 time frame, 1st support is at 13941
- H4 time frame, 2nd support is at 13057
ETHUSD:
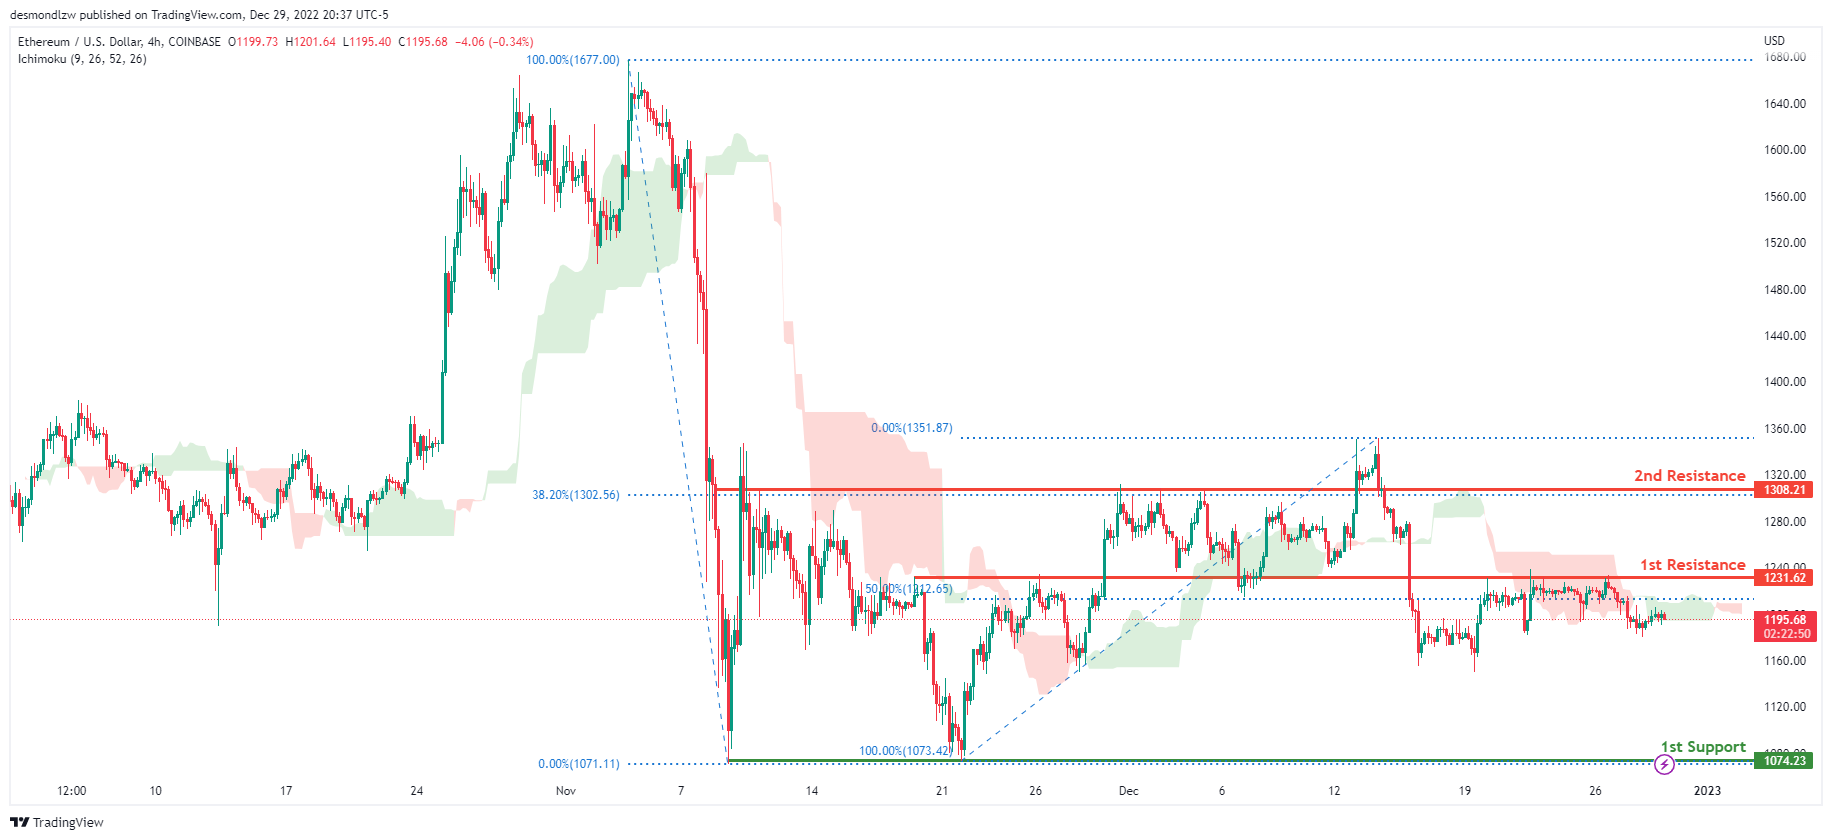
Looking at the H4 chart, my overall bias for ETHUSD is bearish due to the current price crossing below the Ichimoku cloud, indicating a bearish market. If this bearish momentum continues, expect price to head towards the 1st support at 1074.23, where the previous swing low is. In an alternative scenario, price could head back up to break the 1st resistance at 1231.62, where the 50% Fibonacci line is, before heading towards the 2nd resistance at 1308.21, where the 38.2% Fibonacci line is.
Areas of consideration:
- H4 time frame, 1st resistance of 1231.62
- H4 time frame, 2nd resistance of 1308.21
- H4 time frame, 1st support at 1074.23
BTCUSD:
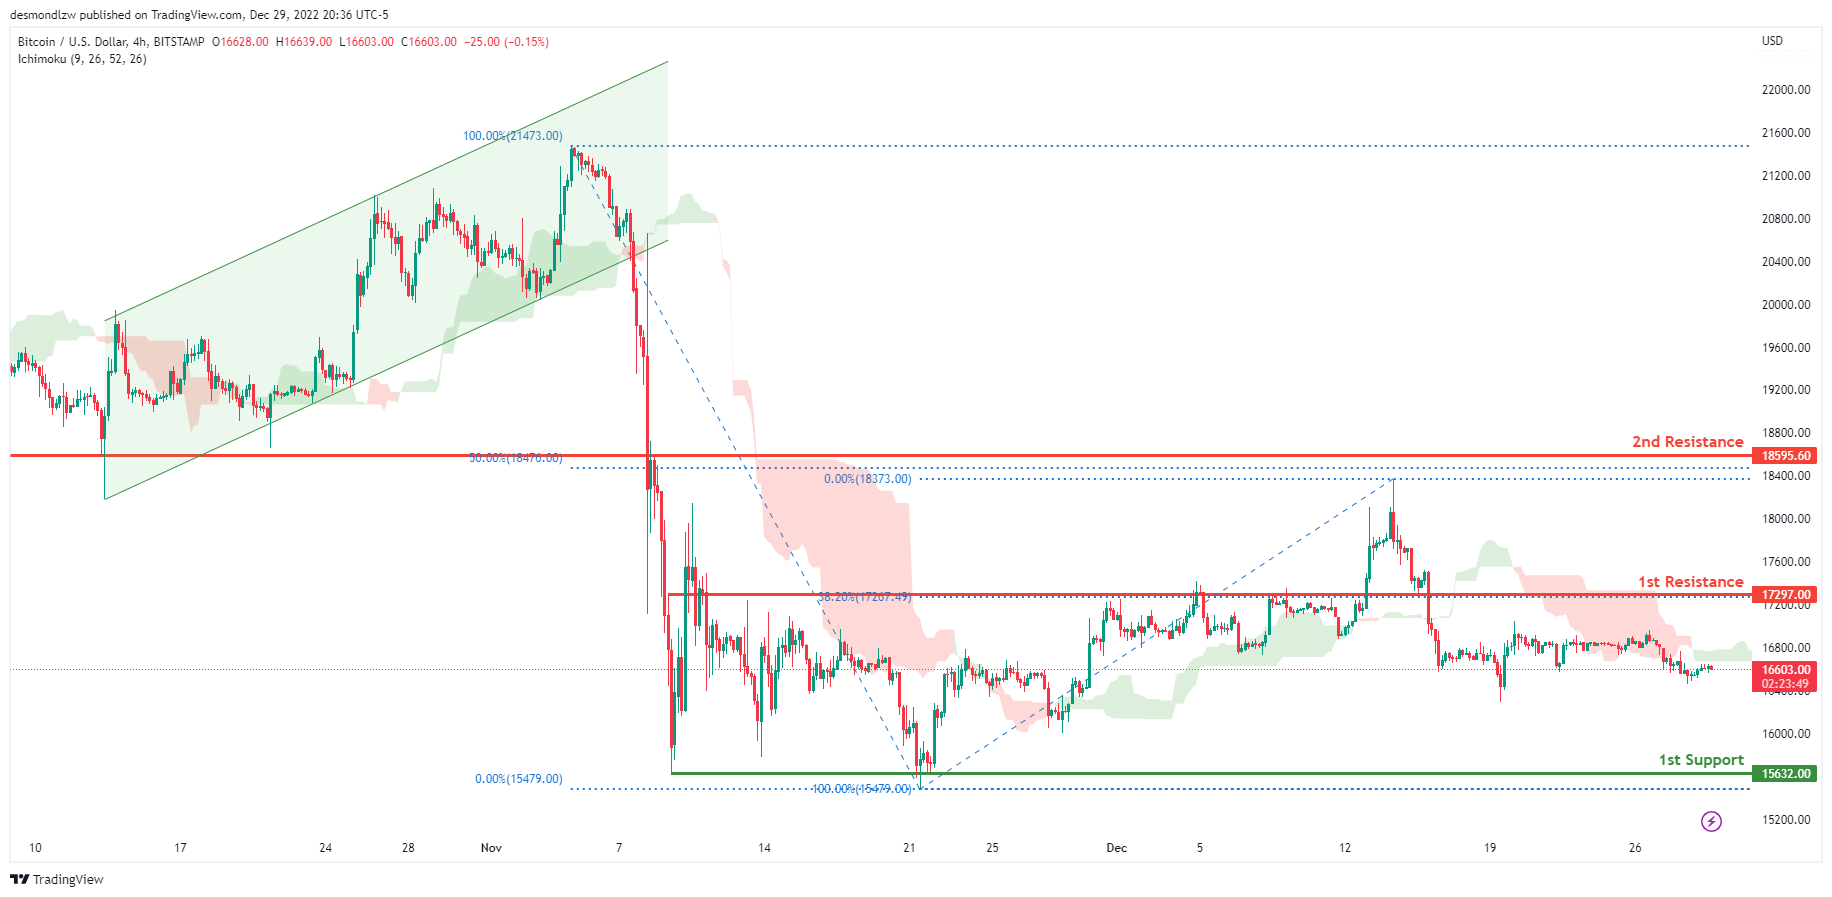
Looking at the H4 chart, my overall bias for BTCUSD is bearish due to the current price crossing below the Ichimoku cloud, indicating a bearish market. If this bearish momentum continues, expect price to possibly continue heading towards the 1st support at 15632.00, where the previous swing low is. In an alternative scenario, price could possibly head up towards the 1st resistance at 17297.00, where the 38.2% Fibonacci line is.
Areas of consideration:
- H4 time frame, 1st resistance 17297.00
- H4 time frame, 1st support at 15632.00
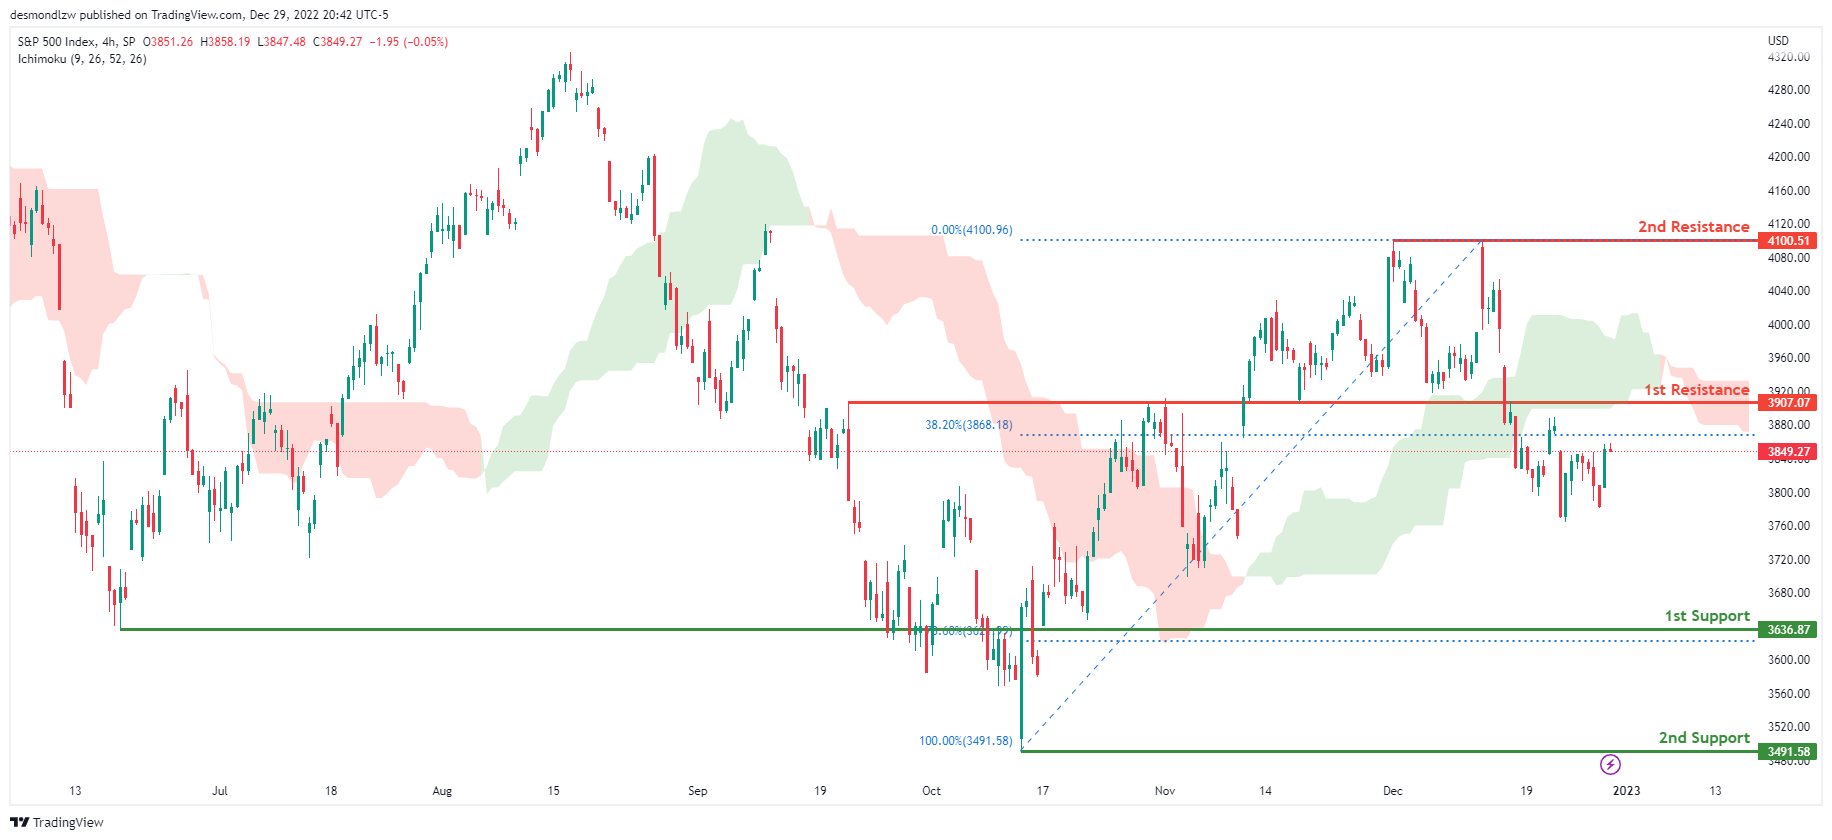
S&P 500:
Looking at the H4 chart, my overall bias for S&P500 is bearish due to the current price being below the Ichimoku cloud, indicating a bearish market. If this bearish momentum continues, expect the price to continue heading towards the 1st support at 3636.87, where the 78.6% Fibonacci line is. In an alternative scenario, price could possibly head back up to retest the 1st resistance at 3907.07, where the 38.2% Fibonacci line is.
Areas of consideration:
- H4 time frame, 1st support at 3636.87
- H4 time frame, 1st resistance at 3907.07
GBPAUD Should Soon Find Support According to Elliott Wave
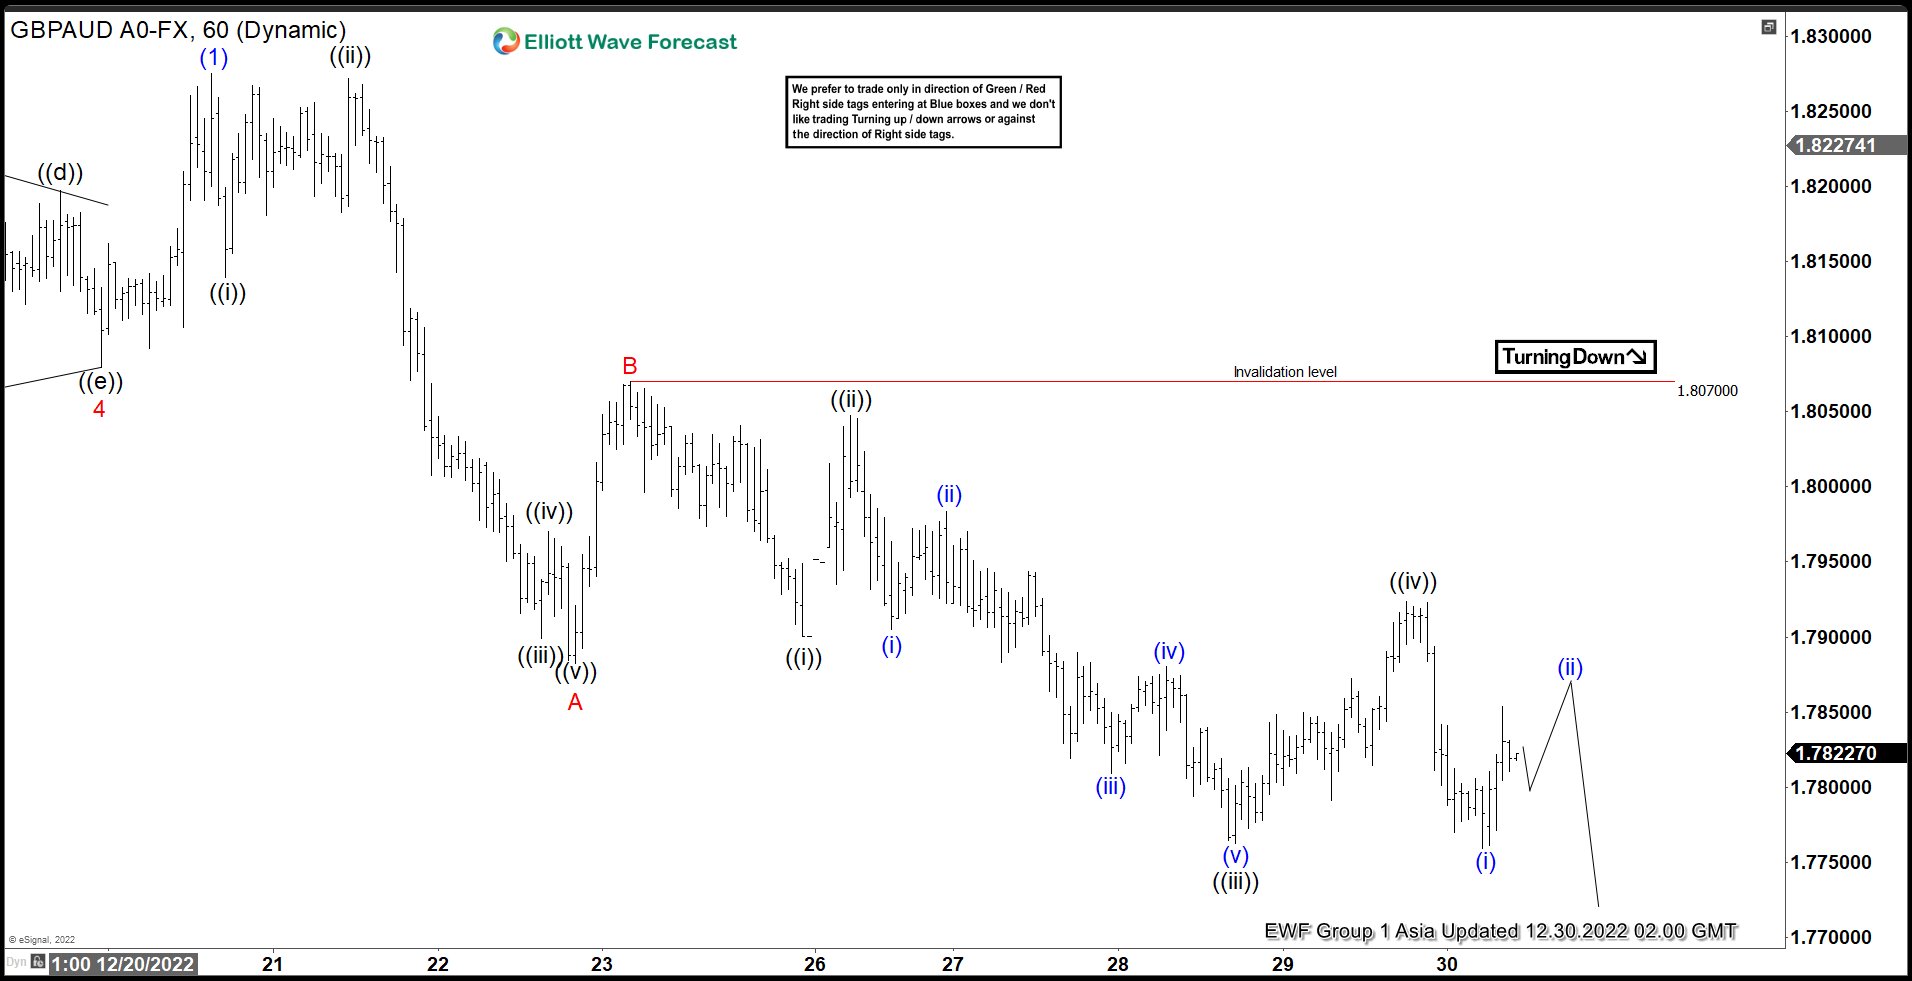
$GBPAUD shows a higher high sequence from 9.26.2022 low favoring further upside. Cycle from 11.15.2022 low ended with wave (1) at 1.8275 as an impulse. Wave (2) pullback is currently in progress to correct cycle from 11.15.2022 low. Internal subdivision of wave (2) is unfolding as a zigzag Elliott Wave structure. Down from wave (1), wave ((i)) ended at 1.8139 and wave ((ii)) ended at 1.8272. Pair then extends lower in wave ((iii)) towards 1.79, wave ((iv)) ended at 1.797. Final leg wave ((v)) ended at 1.7882 which also completed wave A in higher degree. Bounce in wave B ended at 1.807 before pair extends lower again in wave C. Internal subdivision of wave C is unfolding as a 5 waves impulse.
Down from wave B, wave ((i)) ended at 1.79 and rally in wave ((ii)) ended at 1.8047. Pair then extends lower again in wave ((iii)) towards 1.776 and rally in wave ((iv)) ended at 1.7923. Pair should now do the last leg wave ((v)) lower which should also complete wave C and (2) in higher degree. Potential target lower is 100% – 123.6% Fibonacci extension of wave A. The area comes at 1.7587 – 1.768. Near term, as far as pivot at 1.807 high stays intact, expect rally to fail in 3, 7, or 11 swing for further downside.
GBPAUD 60 Minutes Elliott Wave Chart
GBP/CHF continues consolidation pattern, targeting 1.104
GBP/CHF is so far one of the top movers for the week, even though over movements in the markets are rather indecisive. The decline from 1.1543 is seen as the third leg of the consolidation pattern from 1.1574. Deeper fall is expected as long as 1.1265 resistance holds.
Strong support could be seen around 1.1045 cluster (38.2% retracement of 1.1043) to complete the three-wave pattern. Break of 1.1265 resistance will bring stronger rise back to retest 1.1574. Nevertheless, sustained break of 1.1043/5 will be a sign of trend reversal, and target 61.8% retracement at 1.0714.
PBoC makes largest weekly cash injection since 2019
PBoC injected CNY 183B (USD 25.28B) of liquidity through seven-day reverse repurchases agreements in open market operations today. The China's central bank said it's for "maintaining steady year-end liquidity level". Through the week, PBoC injected a net CNY 975B, the largest amount since January 2019.
USD/CNH has been steadily in range since hitting 6.9296 earlier this month. Upside is so far capped by head and shoulder top neck line, and below 55 day EMA. Further decline remains in favor for now. As a correction to the up trend from 6.3057 to 7.3745, deeper fall would be seen to 6.8372 resistance turned support before bottoming.
USD/JPY Could Resume Decline, Yen Gains Further
Key Highlights
- USD/JPY started a fresh decline from the 134.50 zone.
- A major bearish trend line is forming with resistance near 134.50 on the 4-hours chart.
- EUR/USD could attempt a fresh increase above the 1.0650 and 1.0680 resistance levels.
- Gold price is still aiming a clear move above the $1,825 resistance zone.
USD/JPY Technical Analysis
The US Dollar attempted a recovery wave above the 133.50 resistance against the Japanese Yen. USD/JPY even climbed above the 134.00 resistance zone.
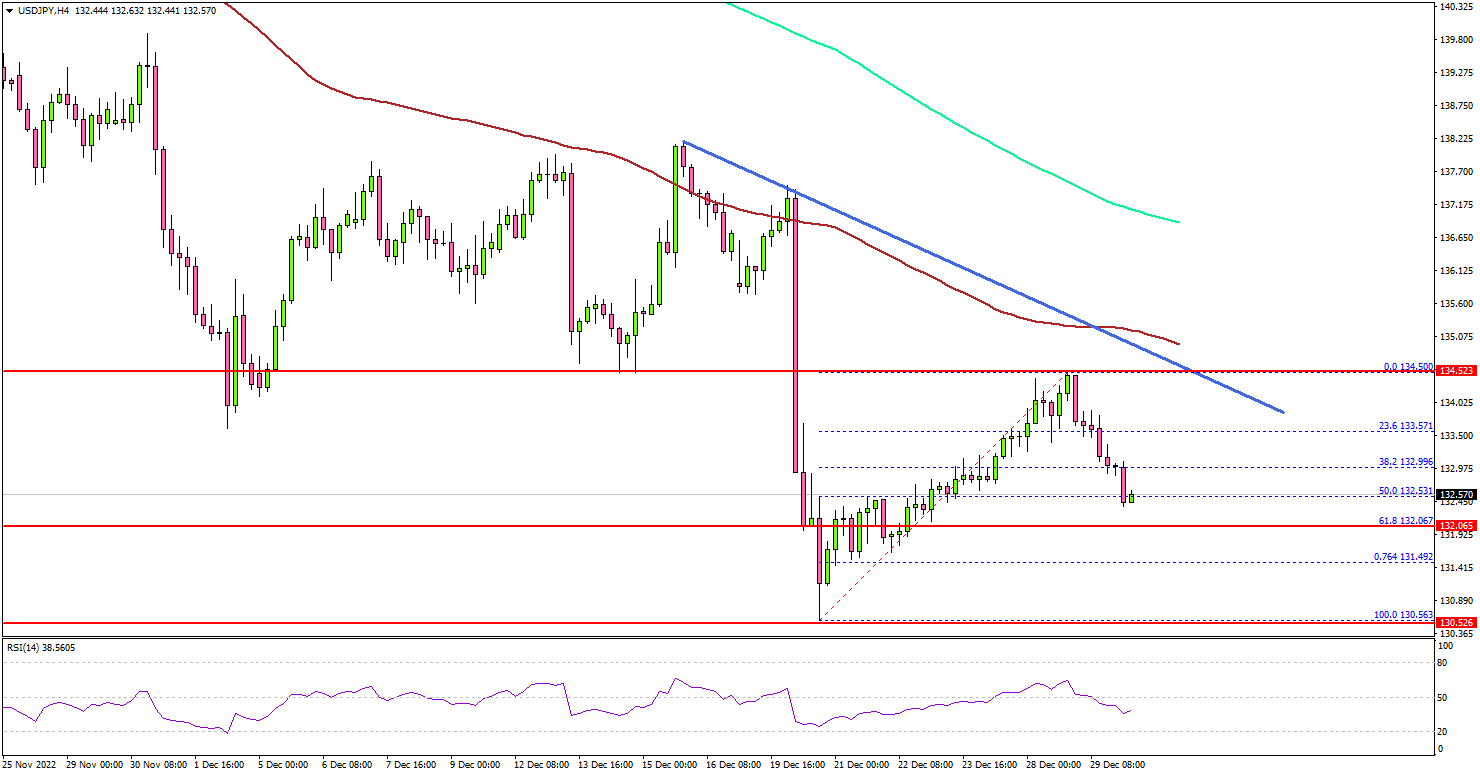
Looking at the 4-hours chart, the pair clearly struggled to clear a major resistance zone near the 134.50 level. The pair formed a high near the 134.50 and recently started a fresh decline.
There was a move below the 133.50 support zone. The pair even spiked below the 50% Fib retracement level of the upward move from the 130.56 swing low to 134.50 high. It is now trading well below 133.20 level, the 100 simple moving average (red, 4-hours), and the 200 simple moving average (green, 4-hours).
On the downside, there is a key support at 132.00. It is near the 61.8% Fib retracement level of the upward move from the 130.56 swing low to 134.50 high.
A downside break below the 132.00 zone might spark a major decline. The next major support sits near the 130.50 level. Any more losses might open the doors for a move towards the 130.00 support zone.
On the upside, an initial resistance is near the 133.80 level. The next major resistance may perhaps be near 134.50. There is also a major bearish trend line forming with resistance near 134.50 on the same chart.
A clear move above the 134.50 resistance might start a steady increase. In the stated case, USD/JPY may perhaps rise towards the 136.00 level.
Looking at gold price, the bulls may soon attempt another increase above the main resistance zone near the $1,825 level.
Economic Releases
- Chicago Purchasing Manager’s Index for Dec 2022 – Forecast 41.3, versus 37.2 previous.
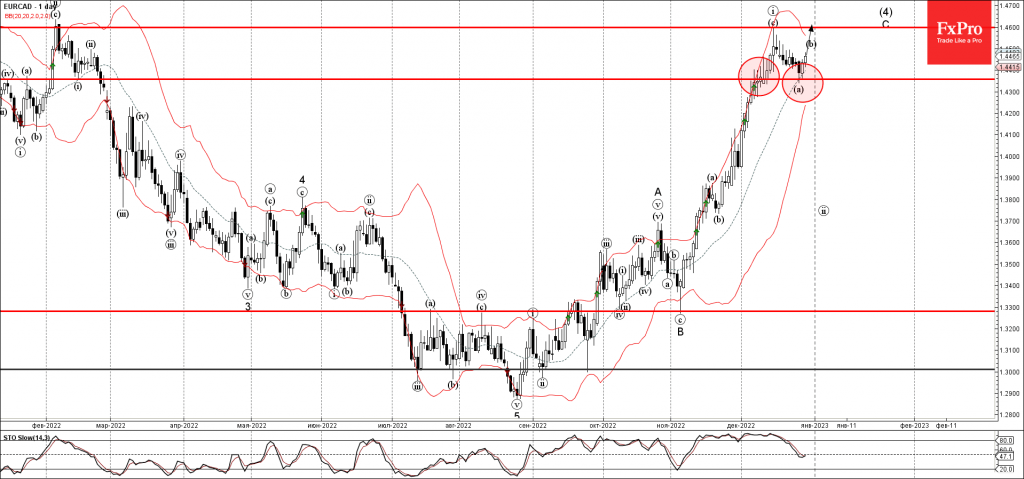
EURCAD Wave Analysis
- EURCAD rising inside the minor wave (b)
- Likely to rise to resistance level 1.4600
EURCAD continues to rise inside the minor correction (b), which previously reversed up from the key support level 1.4360 intersecting with the 20-day moving average.
The active wave (b) belongs to the sharp C-wave of the intermediate ABC correction (4) from the end of August.
EURCAD can be expected to rise further toward the next resistance level 1.4600 (target price for the completion of the active C-wave).
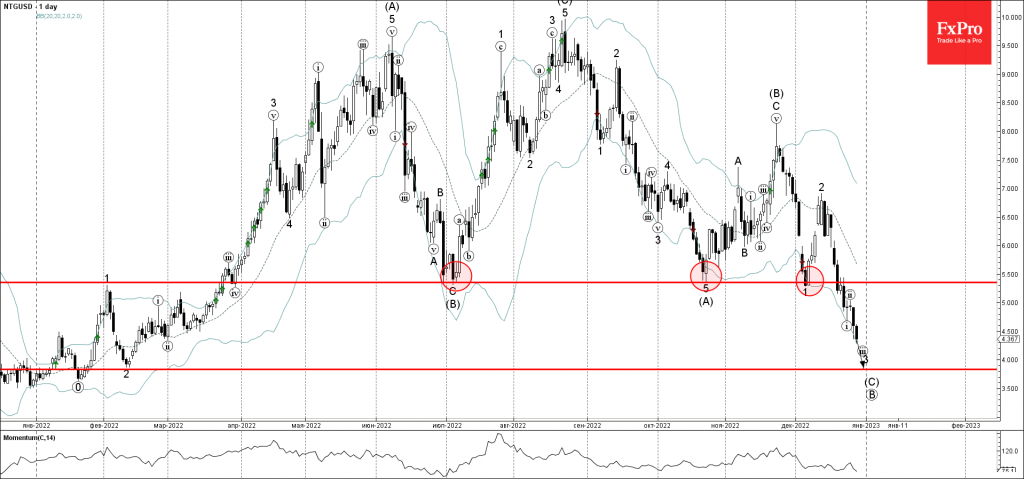
Natural Gas Wave Analysis
- Natural gas falling inside impulse wave 3
- Likely to fall to support level 3.830
Natural gas continues to fall inside the sharp impulse wave 3, which belongs to the intermediate impulse wave (C) from the end of November.
The active wave (C) belongs to the primary ABC correction B from the middle of August.
Natural gas can be expected to fall further toward the next support level 3.830 (former monthly low from February and the target price for the completion of the minor impulse wave 3).