Sample Category Title
Dollar Down, Yen Recovers, Markets Mixed in Holiday Mood
Trading in the forex markets remain mixed and non-committal. Yen's pull back appeared to have run its course already, and recover broadly today. Euro and Swiss Franc are now on the firmer side. On the other hand, Dollar is weak together with Aussie and Sterling. Canadian and New Zealand Dollar are mixed. Meanwhile, European stock indexes and US futures are trading higher but it's unsure if the rebound could persist. Gold is also struggling in range.
In Europe, at the time of writing, FTSE is up 0.01%. DAX is up 0.58%. CAC is up 0.49%. Germany 10-year yield is down -0.002 at 2.496. Earlier in Asia, Nikkei dropped -0.94%. Hong Kong HSI dropped -0.79%. China Shanghai SSE dropped -0.44%. Singapore Strait Times dropped -0.54%. Japan 10-year JGB yield dropped -0.0096 to 0.448.
US initial jobless claims rose to 225k, matched expectations
US initial jobless claims rose 9k to 225k in the week ending December 24, matched expectations. Four-week moving average of initial claims dropped -250 to 221k.
Continuing claims rose 41k to 1710k in the week ending December 17. Four-week moving average of continuing claims rose 25k to 1680k.
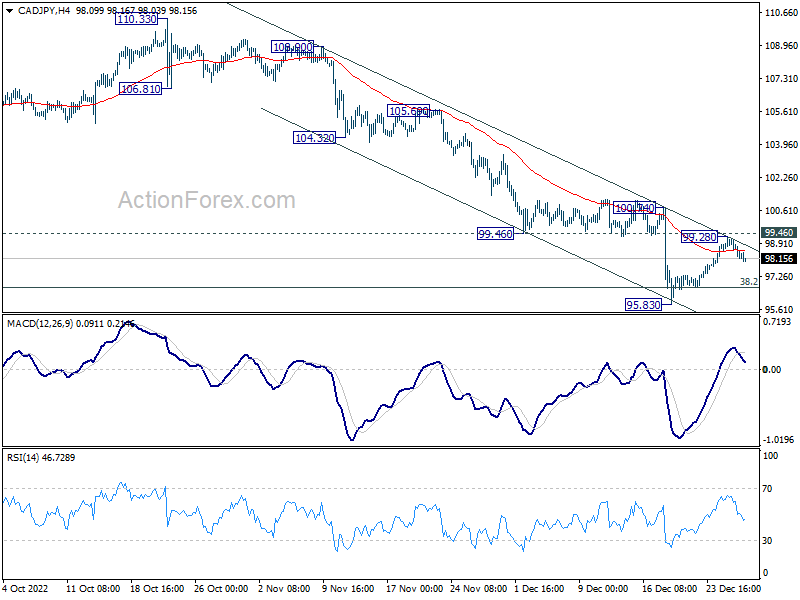
CAD/JPY rejected by channel resistance, heading back to 95.83
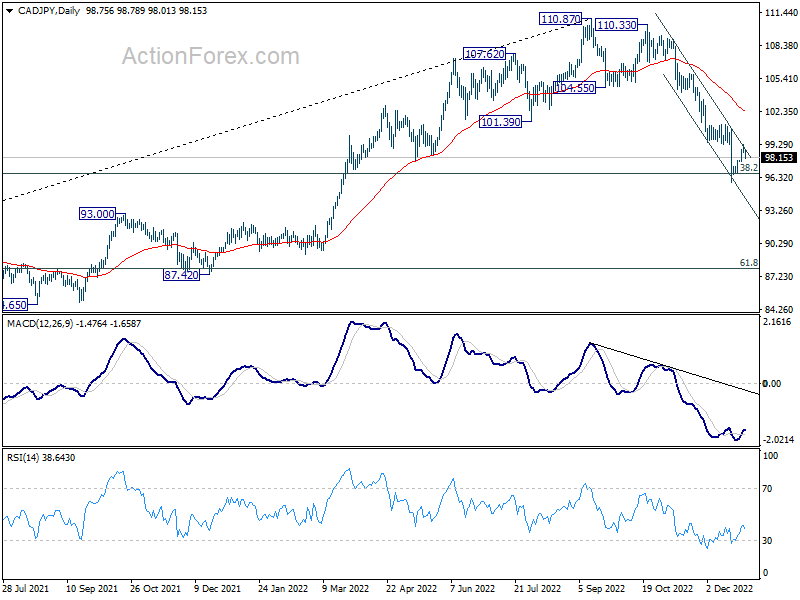
CAD/JPY is one of the top moves today, following Yen's recovery, as well as weakness in oil prices. Recovery from 95.83 might have completed at 99.28, after rejection by near term falling channel and 99.46 support turned resistance. Deeper decline is now in favor back to retest 95.83 low first. Firm break there will resume whole fall from 110.33.
Nevertheless, break of 99.28 will now be a sign of stronger rebound ahead. Further rally would likely be seen through 110.24 resistance to 55 day EMA (now at 103.32) instead.
USD/JPY Mid-Day Outlook
Daily Pivots: (S1) 132.90; (P) 133.25; (R1) 133.86; More...
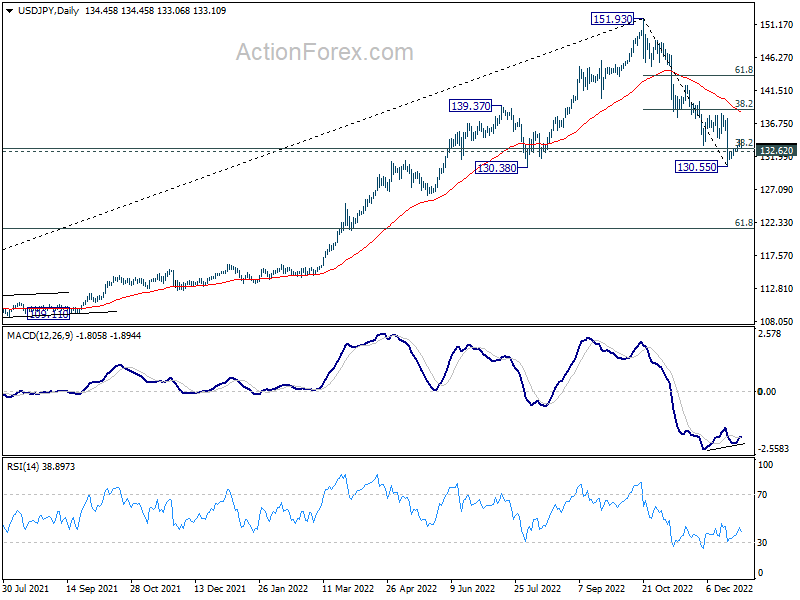
USD/JPY's recovery lost momentum after hitting 134.49 and intraday bias is turned neutral first. On the upside, above 134.49 should resume the rebound through near term channel resistance, towards 38.2% retracement of 151.93 to 130.55 at 138.71 first. On the downside, however, break of 132.62 minor support will bring retest of 130.55 instead.
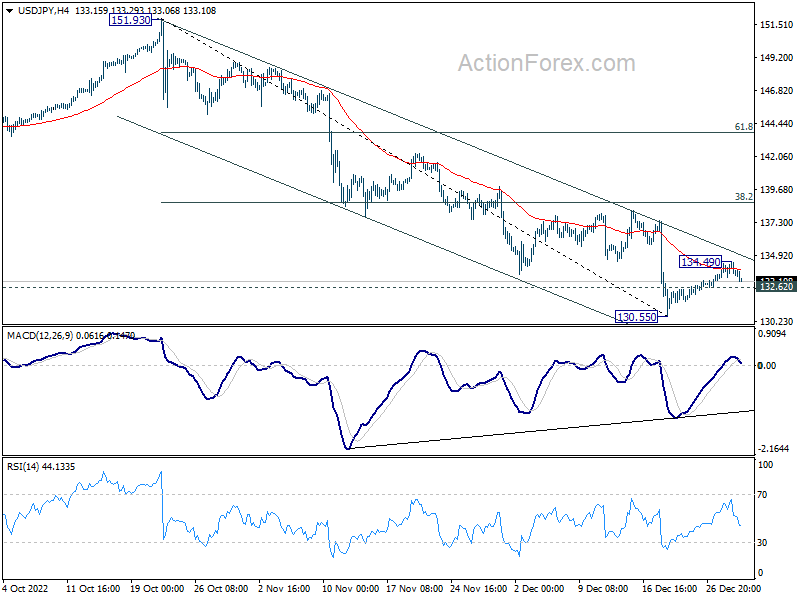
In the bigger picture, price actions from 151.93 medium term could be just a corrective pattern to up trend from 102.58 (2021 low). Strong support from 38.2% retracement of 102.58 to 151.93 at 133.07 and 55 week EMA (now at 131.76) will set the range for such corrective pattern. However, sustained break of 55 week EMA will pave the way to 61.8% retracement at 121.43.
Economic Indicators Update
| GMT | Ccy | Events | Actual | Forecast | Previous | Revised |
|---|---|---|---|---|---|---|
| 09:00 | EUR | Eurozone M3 Money Supply Y/Y Nov | 4.80% | 5.00% | 5.10% | |
| 13:30 | USD | Initial Jobless Claims (Dec 23) | 225K | 225K | 216K | |
| 15:30 | USD | Natural Gas Storage | -198B | -87B | ||
| 16:00 | USD | Crude Oil Inventories | -1.2M | -5.9M |
CAD/JPY rejected by channel resistance, heading back to 95.83
CAD/JPY is one of the top moves today, following Yen's recovery, as well as weakness in oil prices. Recovery from 95.83 might have completed at 99.28, after rejection by near term falling channel and 99.46 support turned resistance. Deeper decline is now in favor back to retest 95.83 low first. Firm break there will resume whole fall from 110.33.
Nevertheless, break of 99.28 will now be a sign of stronger rebound ahead. Further rally would likely be seen through 110.24 resistance to 55 day EMA (now at 103.32) instead.
British Pound Quiet as a Mouse
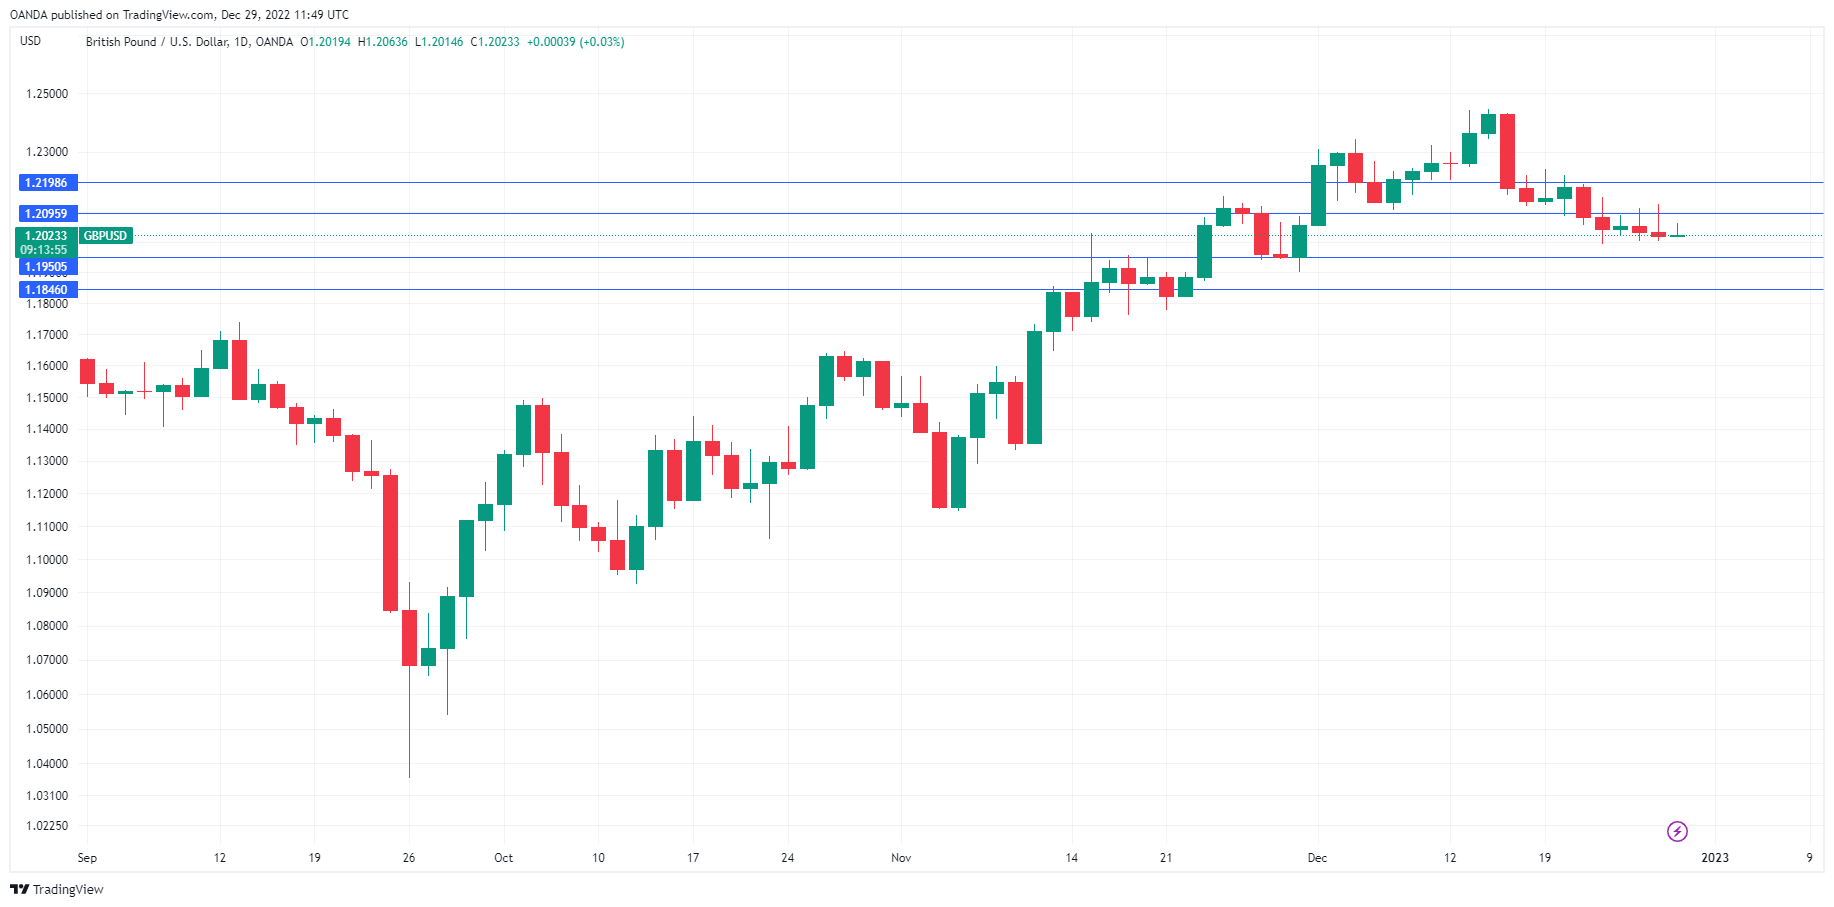
The British pound has shown little movement since before Christmas and remains quiet on Thursday. This is not surprising as trading volumes are down during the holidays and there are few key events on the calendar this week. In the European session, GBP/USD is trading at 1.2023, up 0.07%.
There are no tier-1 events out of the UK this week, leaving US data in the spotlight. On the manufacturing front, the Richmond Fed Manufacturing Index rebounded to 1 point in December, up sharply from -9 in November and ahead of the consensus of -4 points. The wage index rose to 35 in December, up from 27 in November, another indication that wage growth remains strong.
The US housing sector has been sending mixed signals for November. Existing home sales fell sharply while new home sales rebounded higher. Pending home sales were released on Wednesday, with a disappointing reading of -4.0% m/m, down from 4.7% in October and shy of the consensus of -1.0%. Pending home sales have been in a deep rut, posting a decline for six straight months and 12 of the last 13 months. The housing sector is clearly in trouble, although the silver lining could be that mortgage rates have been declining, which should lead to an increase in house purchases early next year.
Today’s highlight is US unemployment claims. Last week’s release rose slightly, from 214,000 to 216,000. The markets are braced for a jump to 225,000, but the markets are unlikely to react to volatility in the week-to-week releases; the four-week moving averages smooths the weekly data and provide a more accurate picture of unemployment.
GBP/USD Technical
- GBP/USD has support at 1.1949 and 1.1846
- There is resistance at 1.2095 and 1.2198
Japanese Yen Rebounds on BOJ Purchases
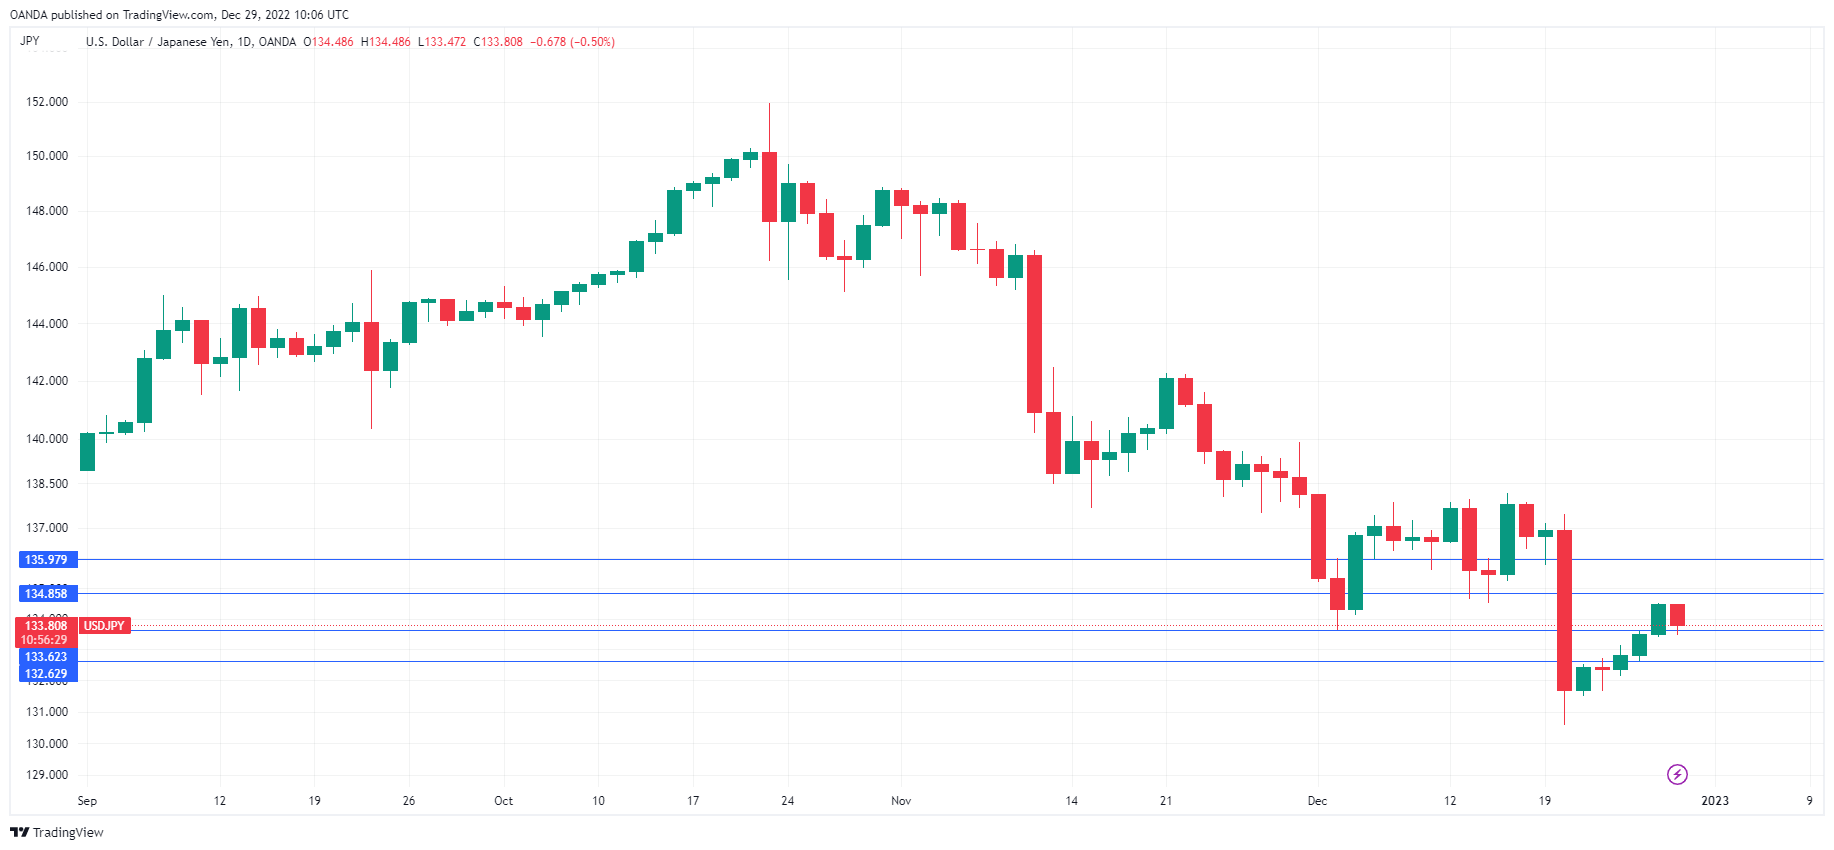
The Japanese yen has posted gains on Thursday, putting the brakes on this week’s dollar rally of over 1%. In the European session, USD/JPY is trading at 133.64, down 0.60%.
This week has been marked by low liquidity, with many traders closing their books or taking a holiday at the end of the year. Japanese markets have been open all week, and USD/JPY has shown more movement than the other majors.
BOJ defends yield curve target
In a week that has been light on economic releases, the Bank of Japan has provided plenty of material for the markets. The BoJ shocked the markets last week when it widened the yield curve band on 10-year bonds, from 0.25% to 0.50%. The move had the same effect as a rate hike and sent the yen sharply higher. After the move, Governor Kuroda said that the tweak was aimed at making the yield curve more sustainable rather than removing it. Investors remain unconvinced, with speculation rising that the BoJ could raise the cap to 0.75% or eliminate its yield curve control altogether.
The BoJ has tried to dispel speculation that further changes to the yield curve are on the way. The Bank announced on Wednesday and again today unlimited bond purchases, with the aim of defending its yield curve target, which is around 0% for 10-year bonds. The tweak on the yield curve band did not affect this target, which the BoJ has insisted will remain in place. What we are seeing here is a continuation of a cat-and-mouse game between the BoJ and investors, with each side testing the resolve of the other. In October, the yen fell close to 152 before the Ministry of Finance intervened in the currency markets and propped up the yen.
Inflation is on the rise in Japan and has climbed to 3.7%, a 40-year high. The BoJ, however, remains unconvinced that inflation is sustainable unless accompanied by stronger wage growth. If labour agreements in early 2023 result in higher wages, the BoJ could raise its yield curve control target, which would be a massive change in policy.
USD/JPY Technical
- USD/JPY tested support at 133.62 earlier. The next support level is 132.62
- There is resistance at 134.86 and 135.98
OIL ( $CL_F ) Forecasting The Decline After Elliott Wave Zig Zag
Hello fellow traders. In this technical blog we’re going to take a quick look at the Elliott Wave charts of OIL Futures ( $CL_F). As our members know, OIL has already reached the extremes from the March 2022 peak at 86.29-63.36 area. The commodity made reaction from there. However shortly after we got break of Sep 26 low, which makes cycle from the June peak incomplete and calling for potential extension within bonus time. Recently OIL made short term recovery that unfolded as Wave Zig Zag Pattern. In the further text we are going to explain the Elliott Wave Pattern and the Forecast.
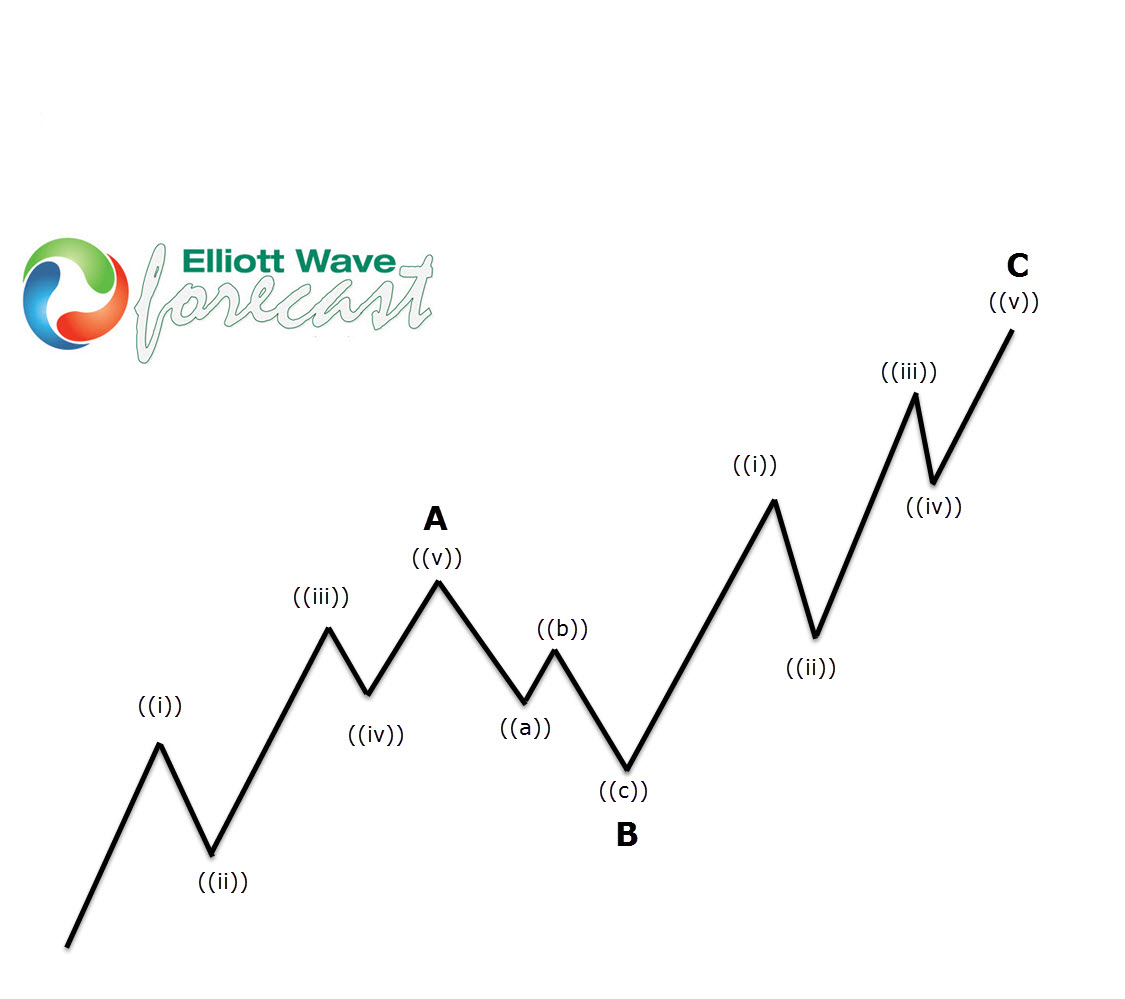
Before we take a look at the real market example, let’s explain Elliott Wave Zigzag pattern.
Elliott Wave Zigzag is the most popular corrective pattern in Elliott Wave theory . It’s made of 3 swings which have 5-3-5 inner structure. Inner swings are labeled as A,B,C where A =5 waves, B=3 waves and C=5 waves. That means A and C can be either impulsive waves or diagonals. (Leading Diagonal in case of wave A or Ending in case of wave C) . Waves A and C must meet all conditions of being 5 wave structure, such as: having RSI divergency between wave subdivisions, ideal Fibonacci extensions and ideal retracements.
OIL H1 Elliott Wave Analysis 12.23.2022
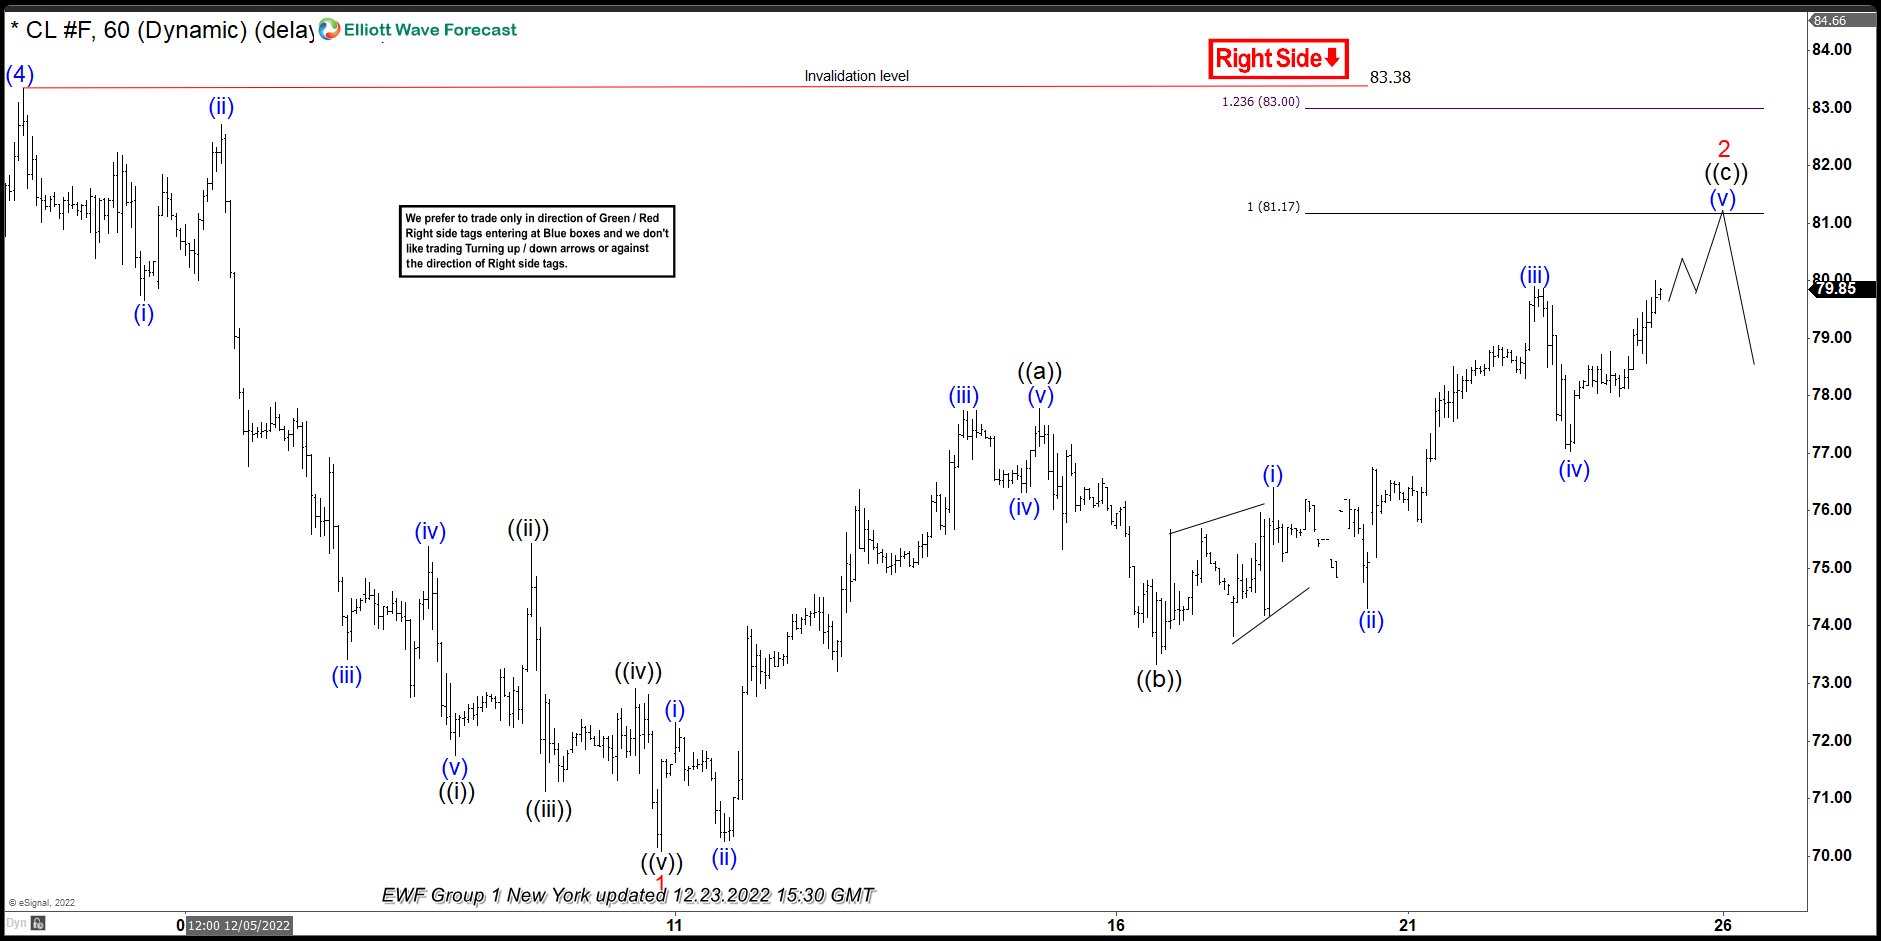
OIL is doing correction against the 83.38 peak. As the first leg of correction has 5 waves structure, we assume recovery is having form of Elliott Wave Zig Zag. The price showing higher high sequences from 12.09. low, calling for more upside in short term. Besides that ((c)) leg looks incomplete, missing another leg up to have 5 waves. Consequently we expect to get more short term strength toward 81.17-83.0 area ( sellers zone). At that zone we expect sellers to appear for further decline or for a 3 waves pull back at least.
OIL H1 Elliott Wave Analysis 12.29.2022
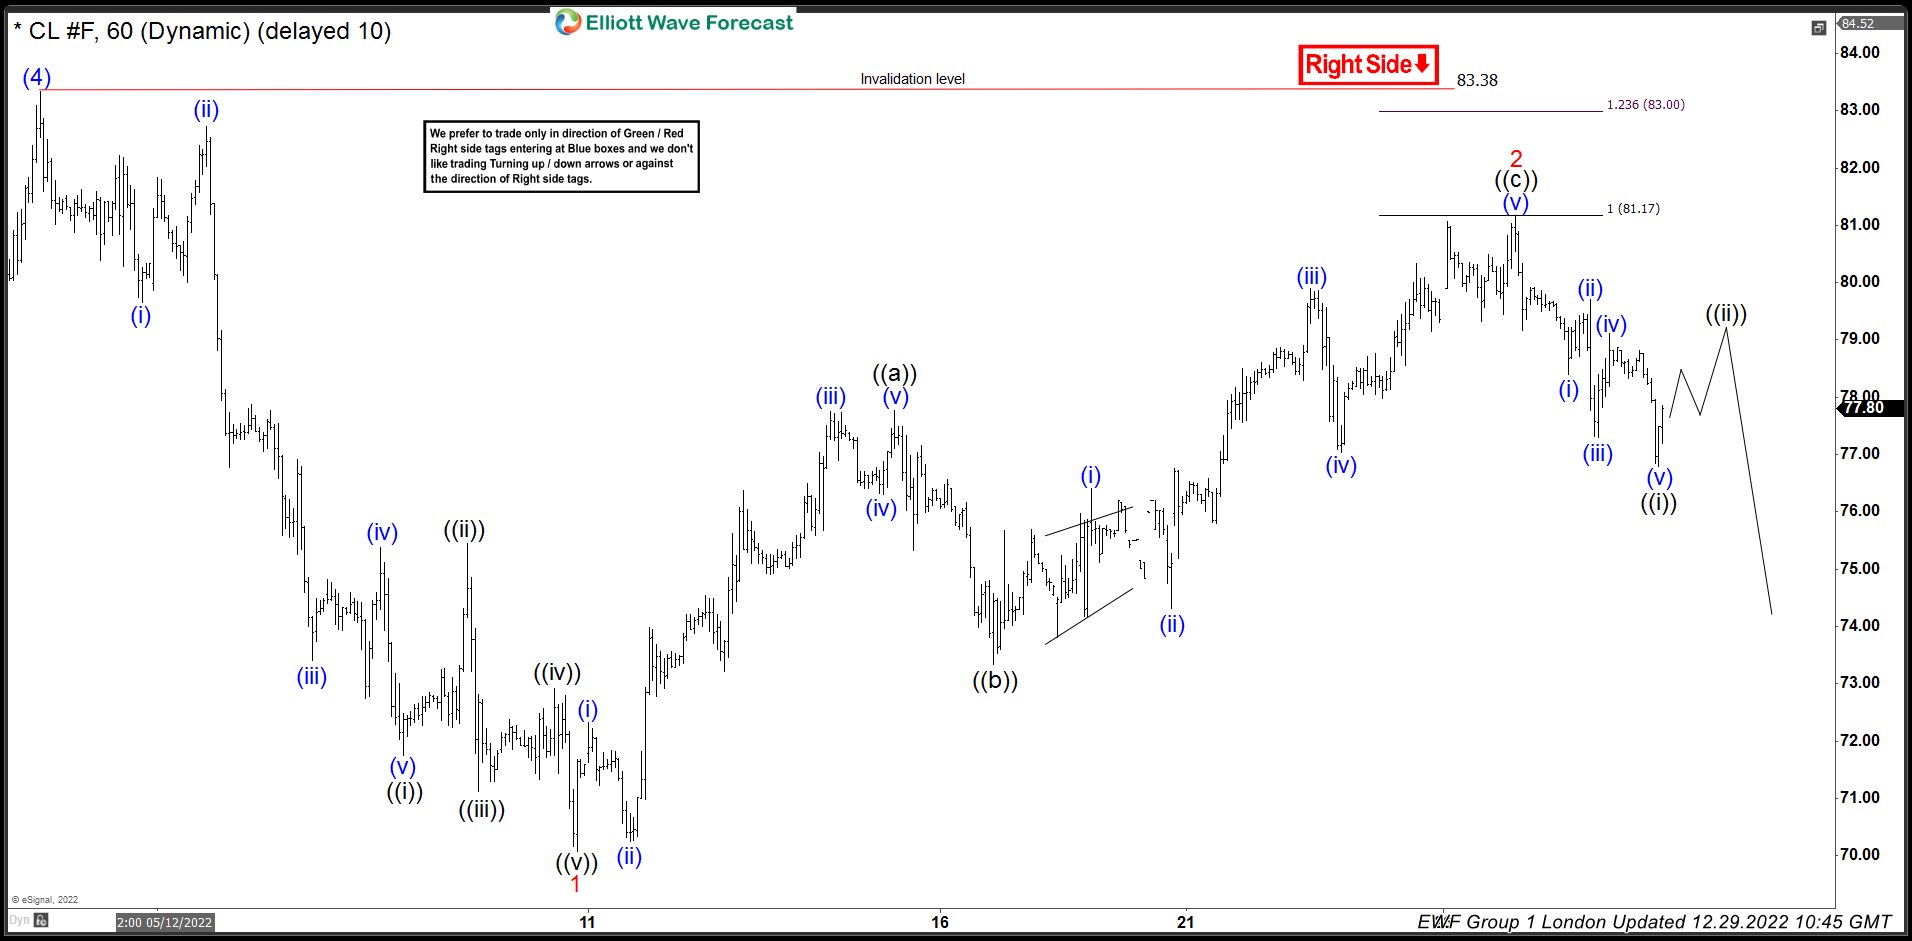
OIL made another leg up as we expected and reached sellers area at 81.17-83.0. The commodity made decent reaction from the marked zone, which reached and exceeded 50 fibs against the ((b)) connector. As a result any short trades from the marked zone should be risk free+ partial profit taken. While below 81.17 peak we see 2 red completed. Otherwise break of that high would make 83.38 pivot more vulnerable.
Keep in mind market is dynamic and presented view could have changed in the mean time. You can check most recent charts in the membership area of the site. Best instruments to trade are those having incomplete bullish or bearish swings sequences.We put them in Sequence Report and best among them are shown in the Live Trading Room.
US initial jobless claims rose to 225k, matched expectations
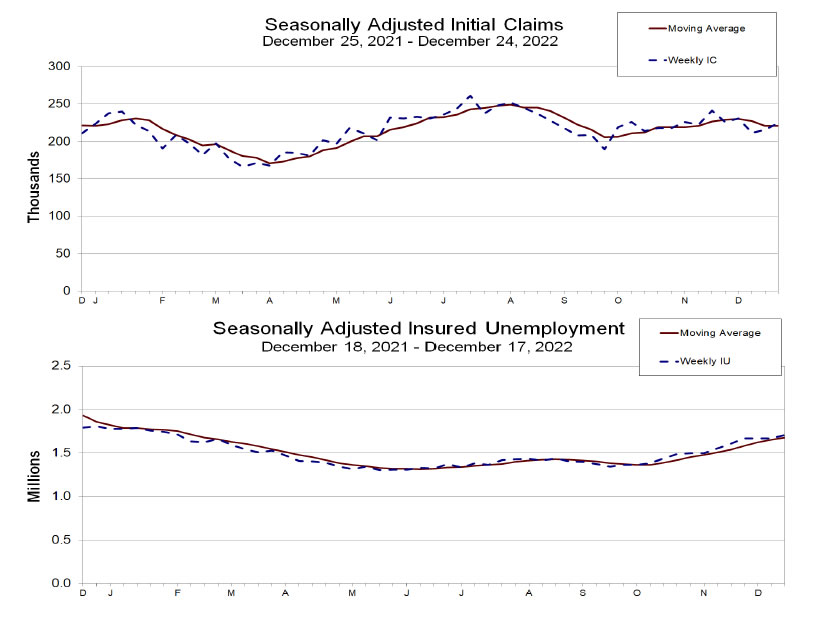
US initial jobless claims rose 9k to 225k in the week ending December 24, matched expectations. Four-week moving average of initial claims dropped -250 to 221k.
Continuing claims rose 41k to 1710k in the week ending December 17. Four-week moving average of continuing claims rose 25k to 1680k.
GBP/USD: Near-term Action Remains in a Narrow Range and Looks for Fresh Direction Signals
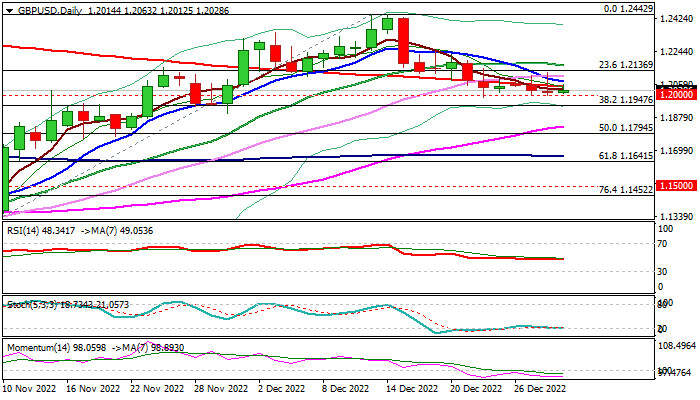
Cable continues to trade within a narrow range for the sixth consecutive day, with psychological 1.20 level offering solid support and keeping the downside protected for now, while the upside attempts repeatedly failed to register a daily close above 200DMA (1.2056).
Holiday-thinned markets and lack of news, keep the pair in a quiet mode, as mixed daily studies add to directionless near-term mode.
The pair is on track for a monthly close in Doji with long upper shadow, following strong rejection at the base of monthly Ichimoku cloud, which generates an initial signal that three-month recovery rally might be stalling.
Expect initial bullish signal on sustained break above 200DMA, which would look for a confirmation on extension above 20DMA (1.2166).
Alternatively, firm break of temporary base at 1.20 and extension through 1.1947 pivot (Fibo 38.2% of 1.1146/1.2442 upleg) would weaken near-term structure and shift focus lower.
Res: 1.2056; 1.2166; 1.2200; 1.2241
Sup: 1.2000; 1.1947; 1.1831; 1.1794
EUR/USD: Larger Bulls to Remain in Play Above Broken Pivotal Fibo Barrier
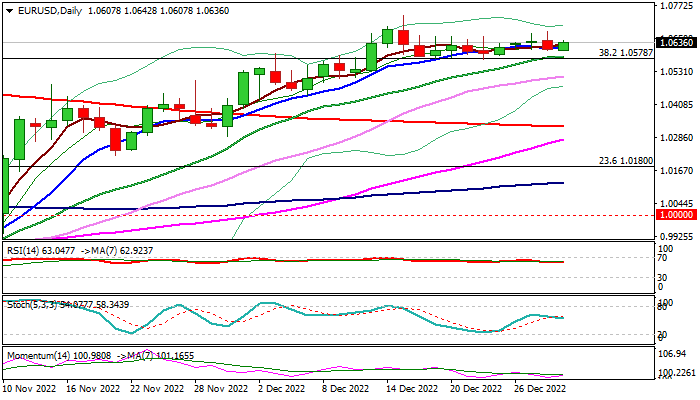
The Euro trades in an extended directionless, narrow-range mode, but underlying bullish structure remains intact, as bulls broke and holding above pivotal Fibo barrier at 1.0578 (38.2% of 1.2266/0.9535) for the third consecutive week that maintains positive tone.
Daily and weekly studies are bullish and support the action, as the pair is also on track for the third consecutive strong monthly rally, although monthly studies are mixed.
Positive bias is expected above 1.0578 Fibo level (reinforced by 20DMA) but the action needs to penetrate into falling weekly cloud (base of the cloud lays at 1.0745) to open way towards targets at 1.0901/1.1000 (50% retracement of 1.2266/0.9535 / psychological).
Conversely, loss of 1.0578 handle, where a daily higher base is also forming, would weaken near-term structure and keep the downside vulnerable of deeper pullback.
Rising 30DMA (1.0512) offers next support, guarding more significant point at 1.0325 (200DMA).
Res: 1.0674; 1.0745; 1.0786; 1.0901.
Sup: 1.0578; 1.0512; 1.0473; 1.0443.
AUDUSD Stays Trapped Below Familiar Resistance
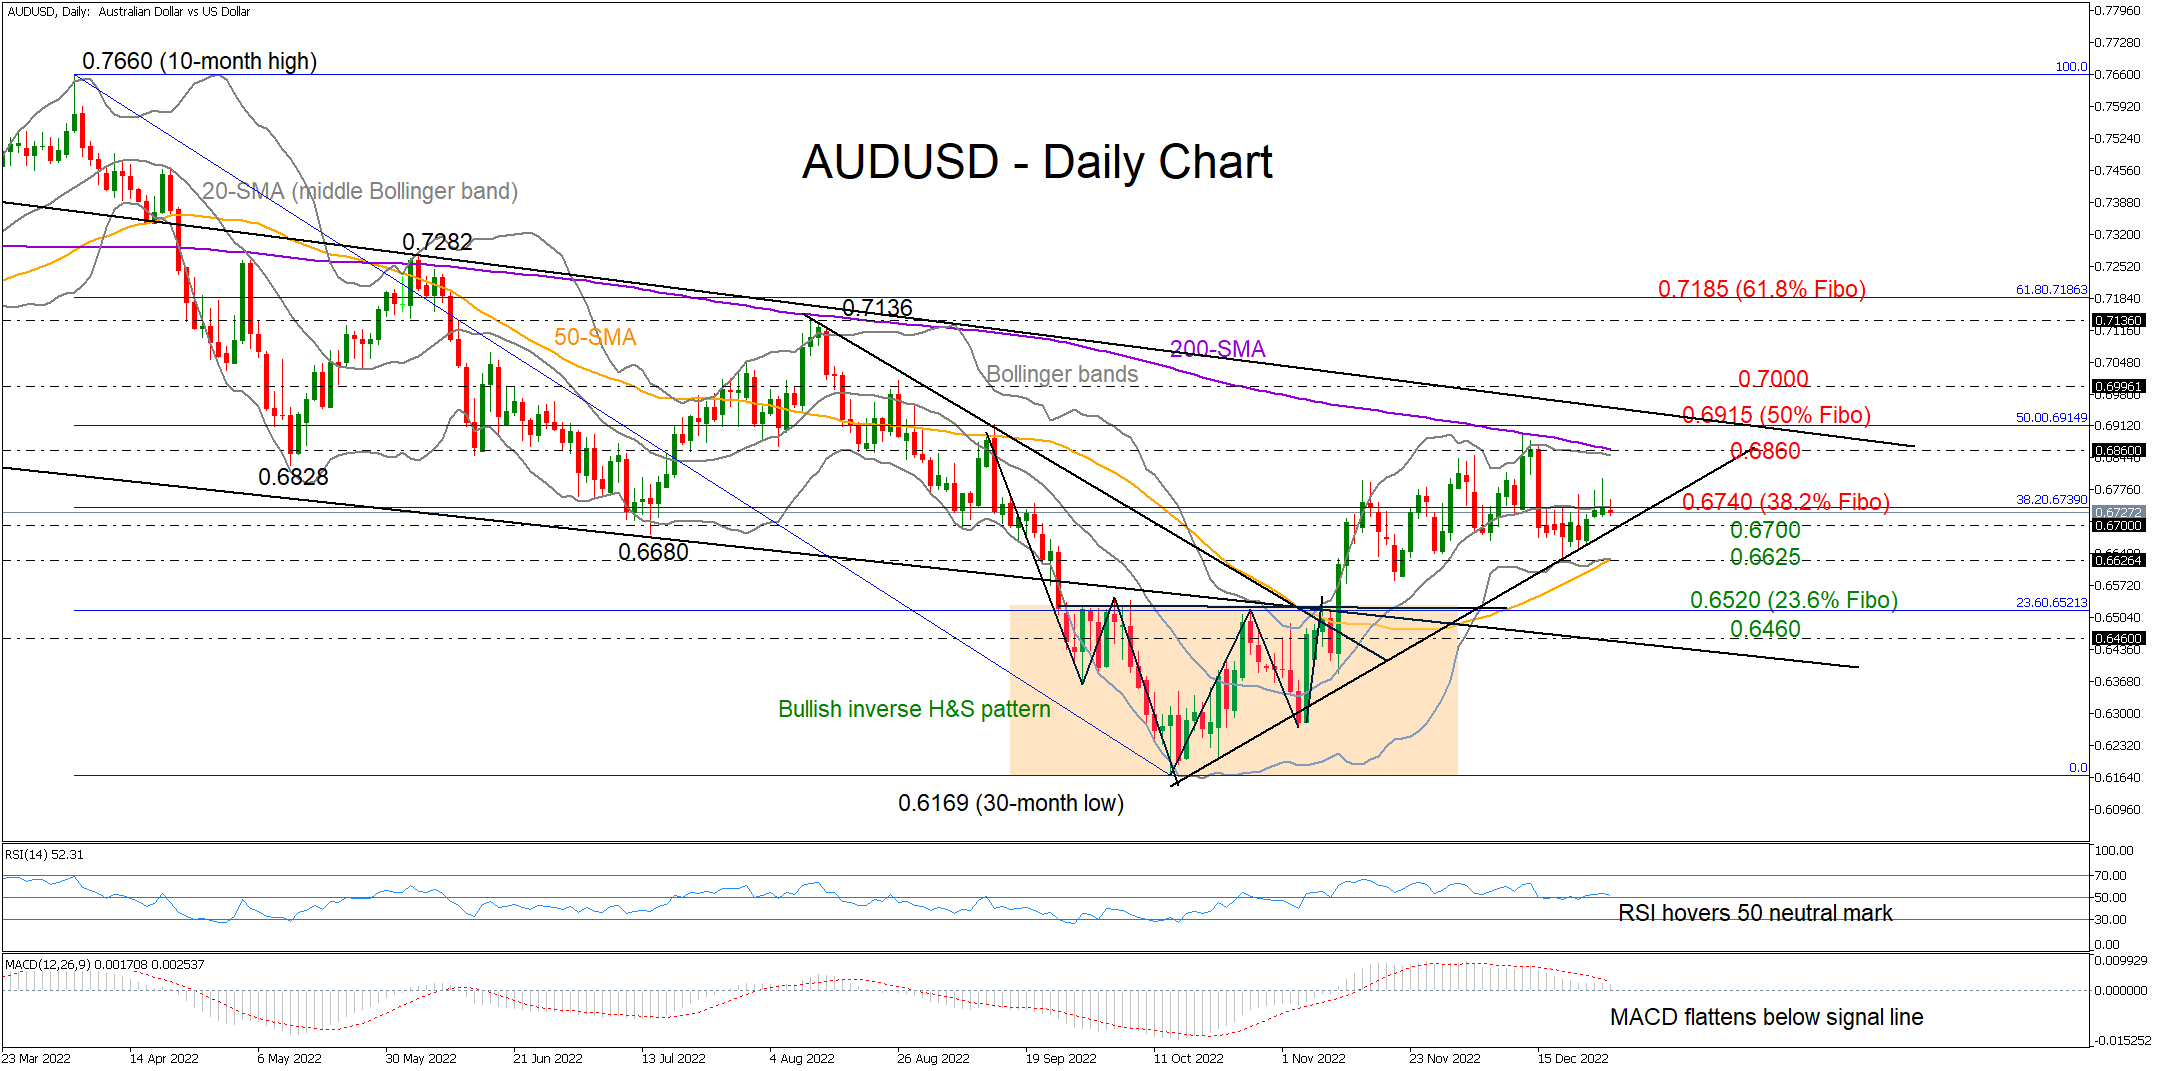
AUDUSD set another foothold around the two-month-old ascending trendline last week, correcting higher to test the 0.6800 level on Wednesday.
Despite the pickup, the 38.2% Fibonacci of the 0.7660–0.6169 downtrend and the 20-day simple moving average (SMA), which is also the middle Bollinger band, restrained the bulls around 0.6740 for the eighth consecutive trading day.
The momentum indicators are not giving directional signals, with the RSI hovering around its 50 neutral mark and the MACD flattening clearly below its red signal line. That said, as long as the price keeps trading within the lower Bollinger band area, downside movements are more likely than upside ones.
In case the support trendline cracks around 0.6700, the price could depreciate towards the 50-day SMA at 0.6625. Falling lower, selling pressures could intensify towards the neckline of the inverse head and shoulder pattern at 0.6520, where the 23.6% Fibonacci is placed too. Slightly lower, traders will also keep a close eye on the key constraining line coming from August 2021 at 0.6460.
In the positive scenario, where the pair breaks the wall at 0.6740, buyers will not get excited unless the recovery stretches above the 200-day SMA at 0.6860 and then beyond the tough descending trendline from May 2021 at 0.6915. Note that the 50% Fibonacci is in the neighborhood. Hence, a successful penetration higher could trigger a new bullish wave up to the 0.7136 – 0.7185 restrictive region, especially if the 0.7000 number gives way as well.
All in all, AUDUSD maintains a neutral status within the 0.6700 – 0.6740 zone. While a bullish breakout may attract fresh gains, a stronger rally above 0.7000 would be needed to upgrade the short-term outlook.
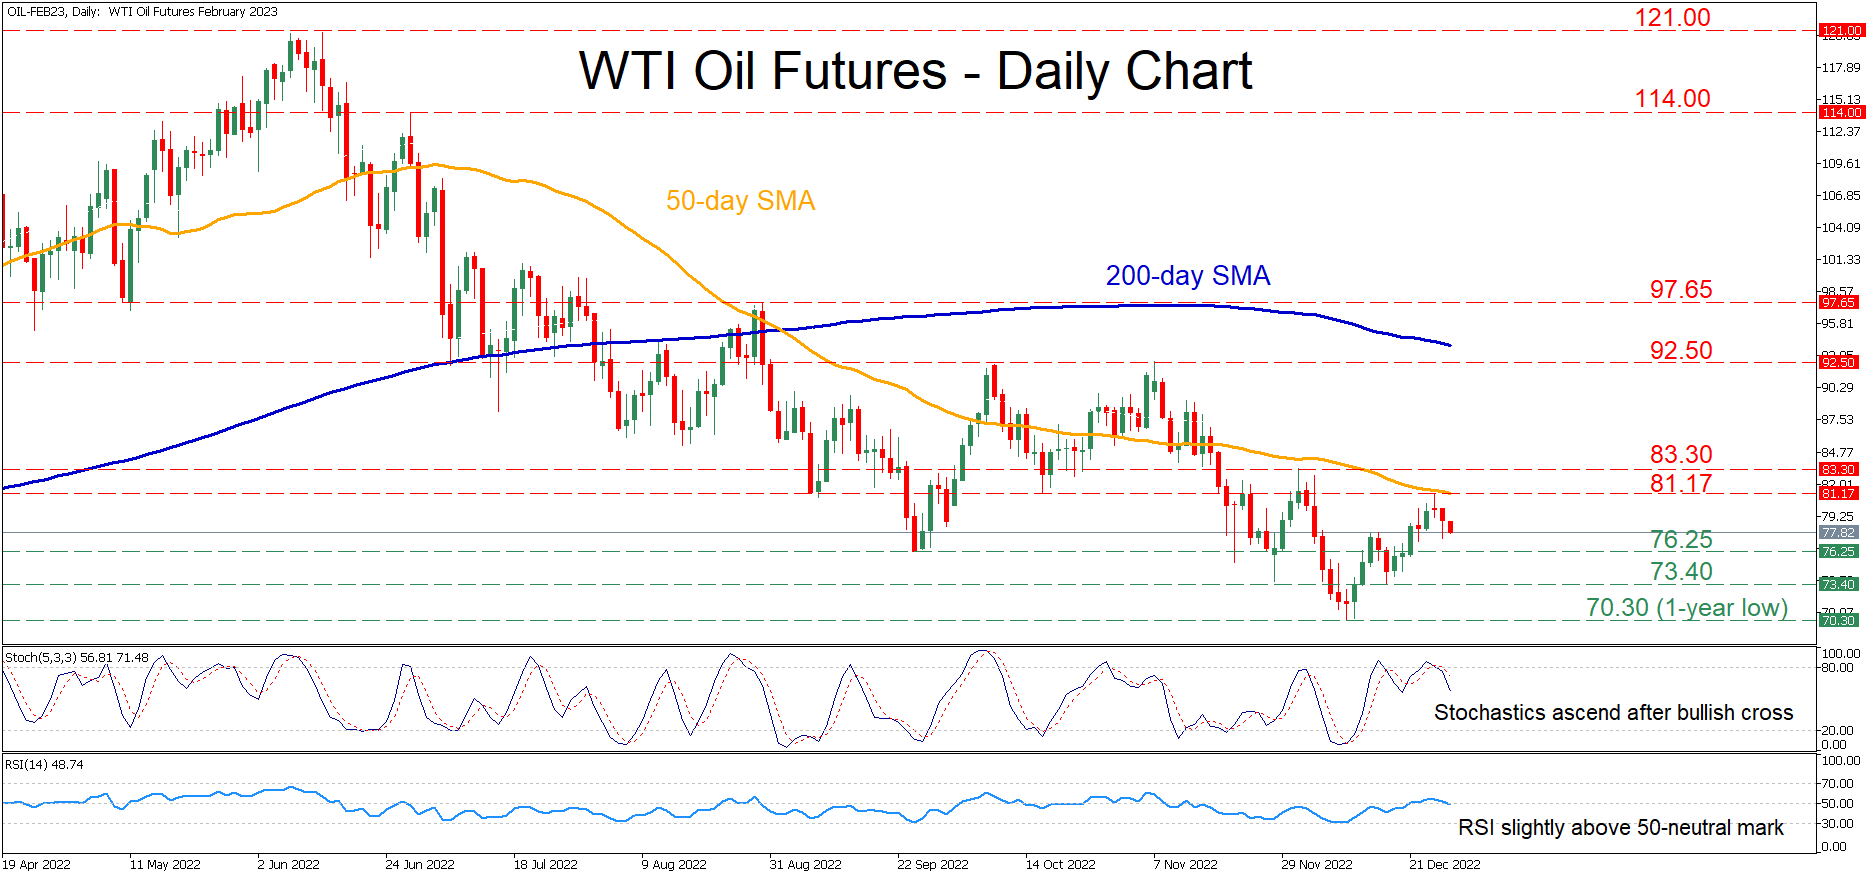
WTI Oil Futures Retreat after 50-day SMA Rejects Advance
WTI oil futures (February delivery) have been stuck in a downtrend since June but managed to bounce at the one-year low of 70.30 and recoup some losses. However, this recovery proved to be short-lived after the 50-day simple moving average (SMA) curbed the commodity’s upside.
The momentum indicators currently suggest that bearish forces have gained the upper hand. Specifically, the RSI has fallen below its 50-neutral mark, while the stochastic oscillator is sloping downwards after exiting the 80-overbought territory.
An extension of the recent pullback could shift the focus to the September low of 76.25. Sliding beneath that floor, the price could descend to test the 73.40 barrier. A break below that zone could open the door for the one-year low of 70.30.
Alternatively, if buyers re-emerge and seize control, oil futures could move higher to challenge the recent rejection point of 81.17, which overlaps with the 50-day SMA. Conquering this barricade, the bulls might then aim at 83.30 before the November high of 92.50 comes under examination. Surpassing the latter, the price could encounter strong resistance at the August peak of 97.65.
In brief, the short-term technical picture has deteriorated again for WTI oil futures since their latest advance came to a halt. For that bearish sentiment to alter, the price needs to profoundly jump above the 50-day SMA.