Sample Category Title
Technical Outlook and Review
USD/JPY:
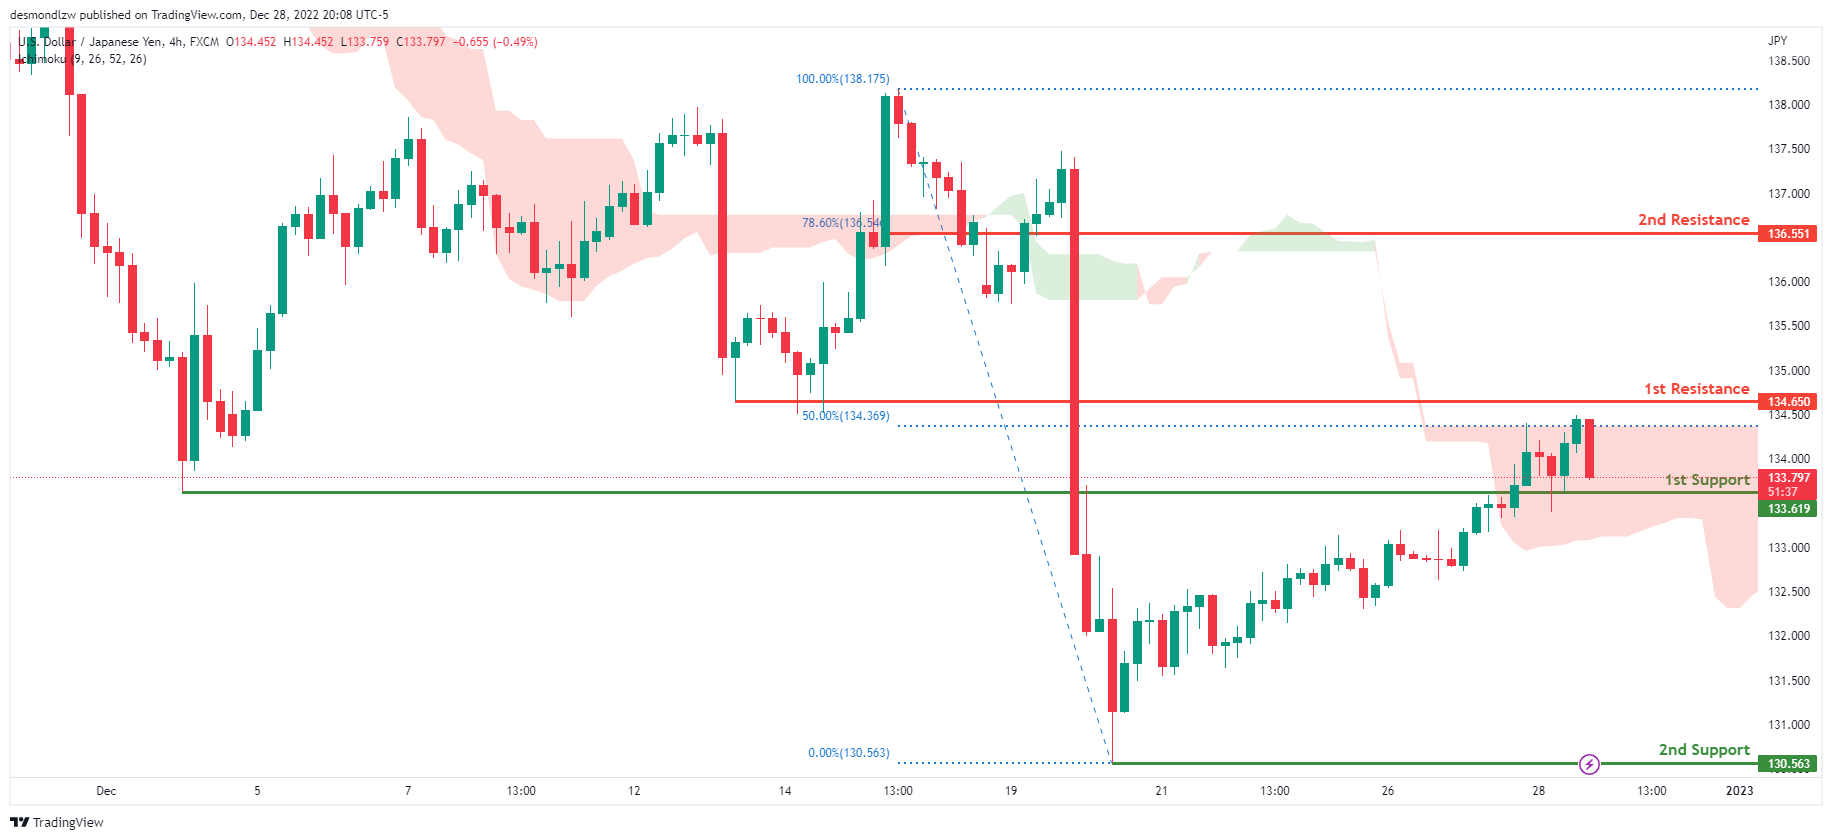
Looking at the H4 chart, my overall bias for USDJPY is bearish due to the current price crossing below the Ichimoku cloud, indicating a bearish market. If this bearish momentum continues, expect price to possibly break the 1st support at 133.619, where the previous swing low is located, before heading towards the 2nd support at 130.563, where the previous swing low is. In an alternate scenario, price could possibly head back up towards the 1st resistance level at 134.650 where the 50% Fibonacci line is.
Areas of consideration:
- H4 time frame, 1st resistance at 134.650
- H4 time frame, 1st support at 133.619
- H4 time frame, 2nd support at 130.563
DXY:
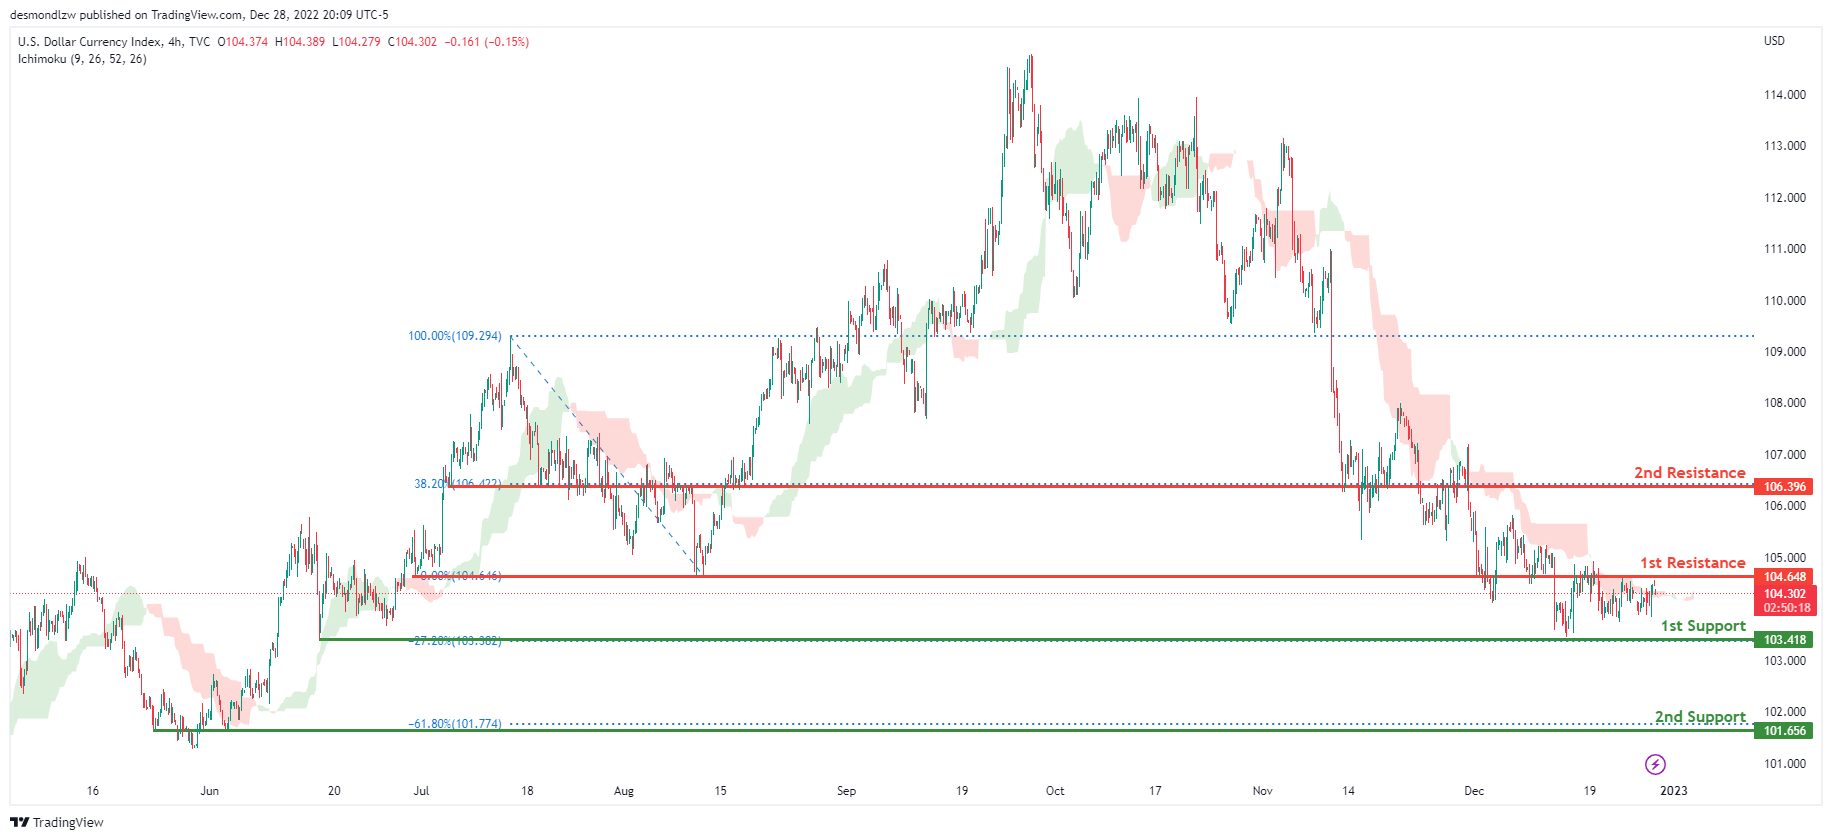
On the H4 chart, the overall bias for DXY is bearish. To add confluence to this, the price is below the Ichimoku cloud which indicates a bearish market. If this bearish momentum continues, expect the price to possibly break the 1st support line at 103.418, where the -27.2% Fibonacci expansion line is before heading towards the 2nd support at 101.656, where the -61.8% Fibonacci expansion line is. In an alternative scenario, price could head back up and break the 1st resistance line resistance at 104.648, where the previous swing low is before heading towards the 2nd resistance at 106.396, where the 38.2% Fibonacci line is.
Areas of consideration:
- H4 time frame, 1st resistance at 104.648
- H4 time frame, 1st support at 103.418
- H4 time frame, 2nd support at 101.656
EUR/USD:
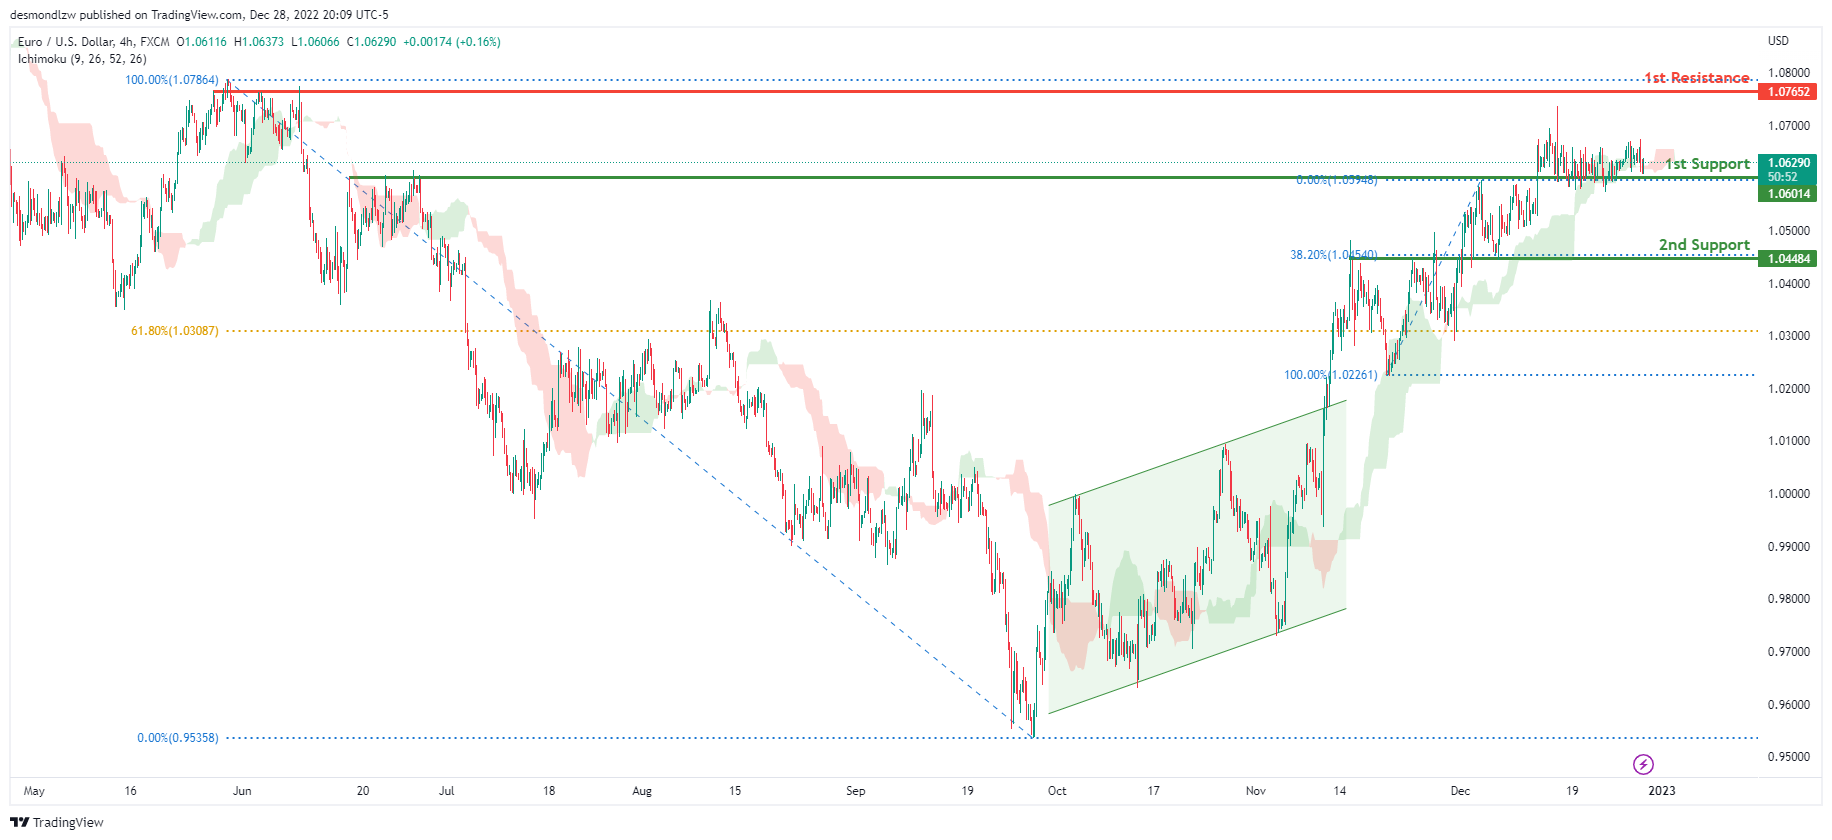
Looking at the H4 chart, my overall bias for EURUSD is bullish due to the current price being above the Ichimoku cloud, indicating a bullish market. To add confluence to this bias, price has also broken above the ascending bullish channel. If this bullish momentum continues, expect the price to possibly head towards the 1st resistance at 1.07652, where the previous swing high is. In an alternate scenario, price could possibly head back down to break the 1st support level at 1.06014, where the previous swing high and 78.6% Fibonacci line are located before heading towards the 2nd support at 1.04484, where the 38.2% Fibonacci line is.
Areas of consideration :
- H4 1st resistance at 1.07652
- H4 1st support at 1.06014
- H4 2nd support at 1.04484
GBP/USD:
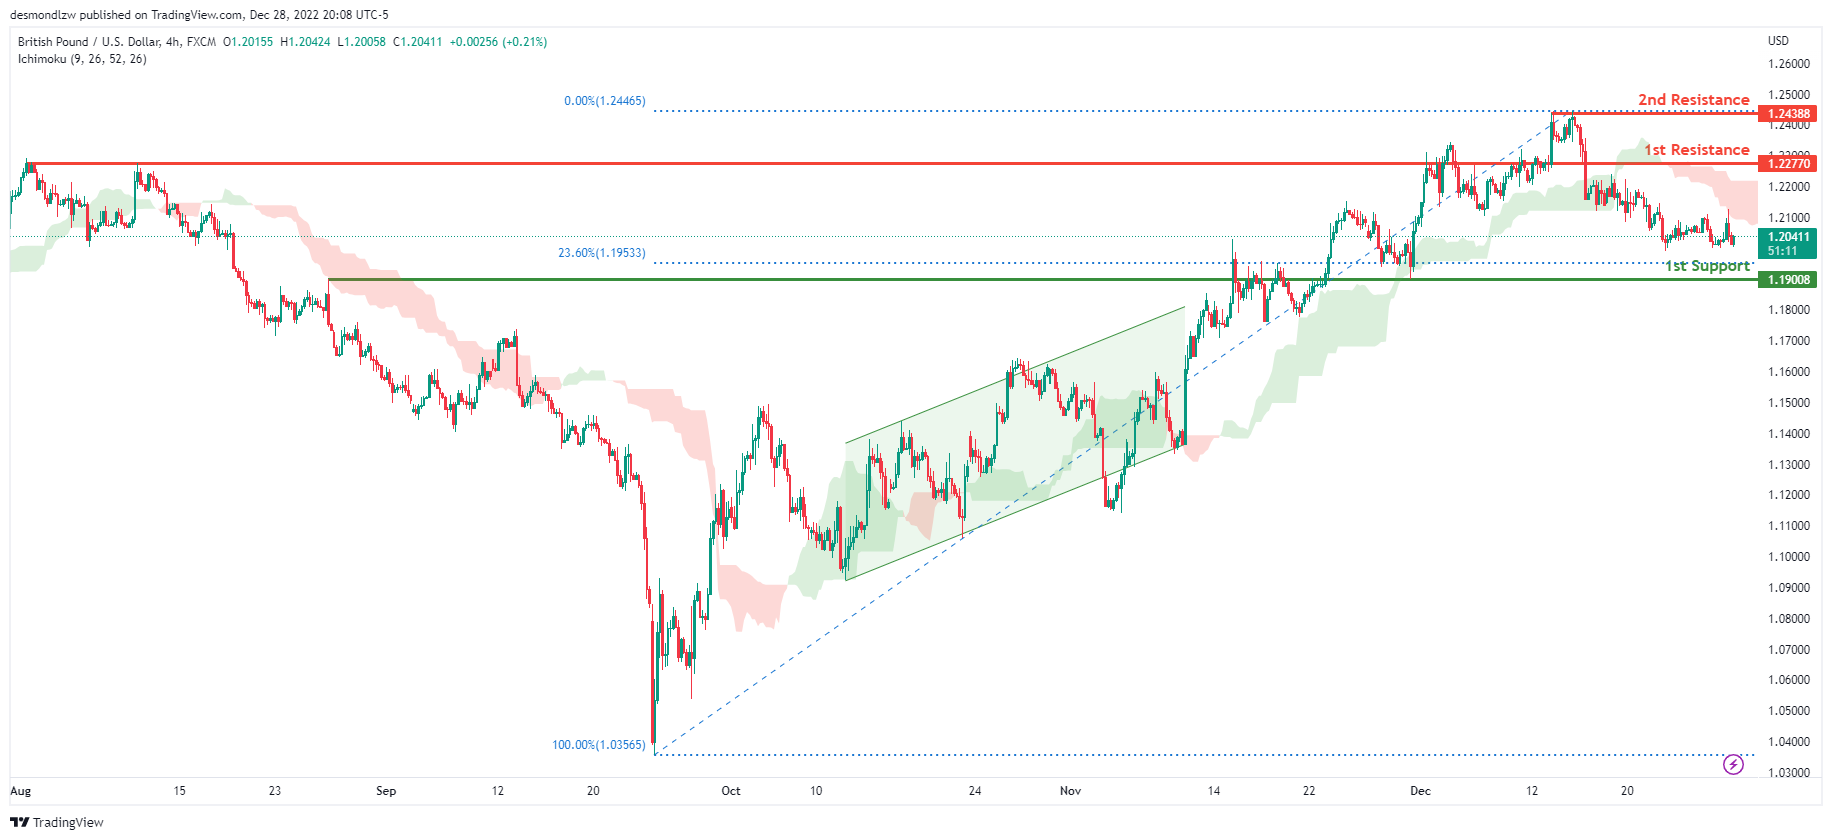
Looking at the H4 chart, my overall bias for GBPUSD is bearish due to the current price being below the Ichimoku cloud, indicating a bearish market. If this bearish momentum continues, expect price to possibly continue heading towards the 1st support at 1.19008, where the 23.6% Fibonacci line is. In an alternate scenario, price could possibly head back up to retest the 1st resistance level at 1.22770, where the previous swing high is.
Areas of consideration:
- H4 1st resistance at 1.22770
- H4 1st support at 1.19008
USD/CHF:
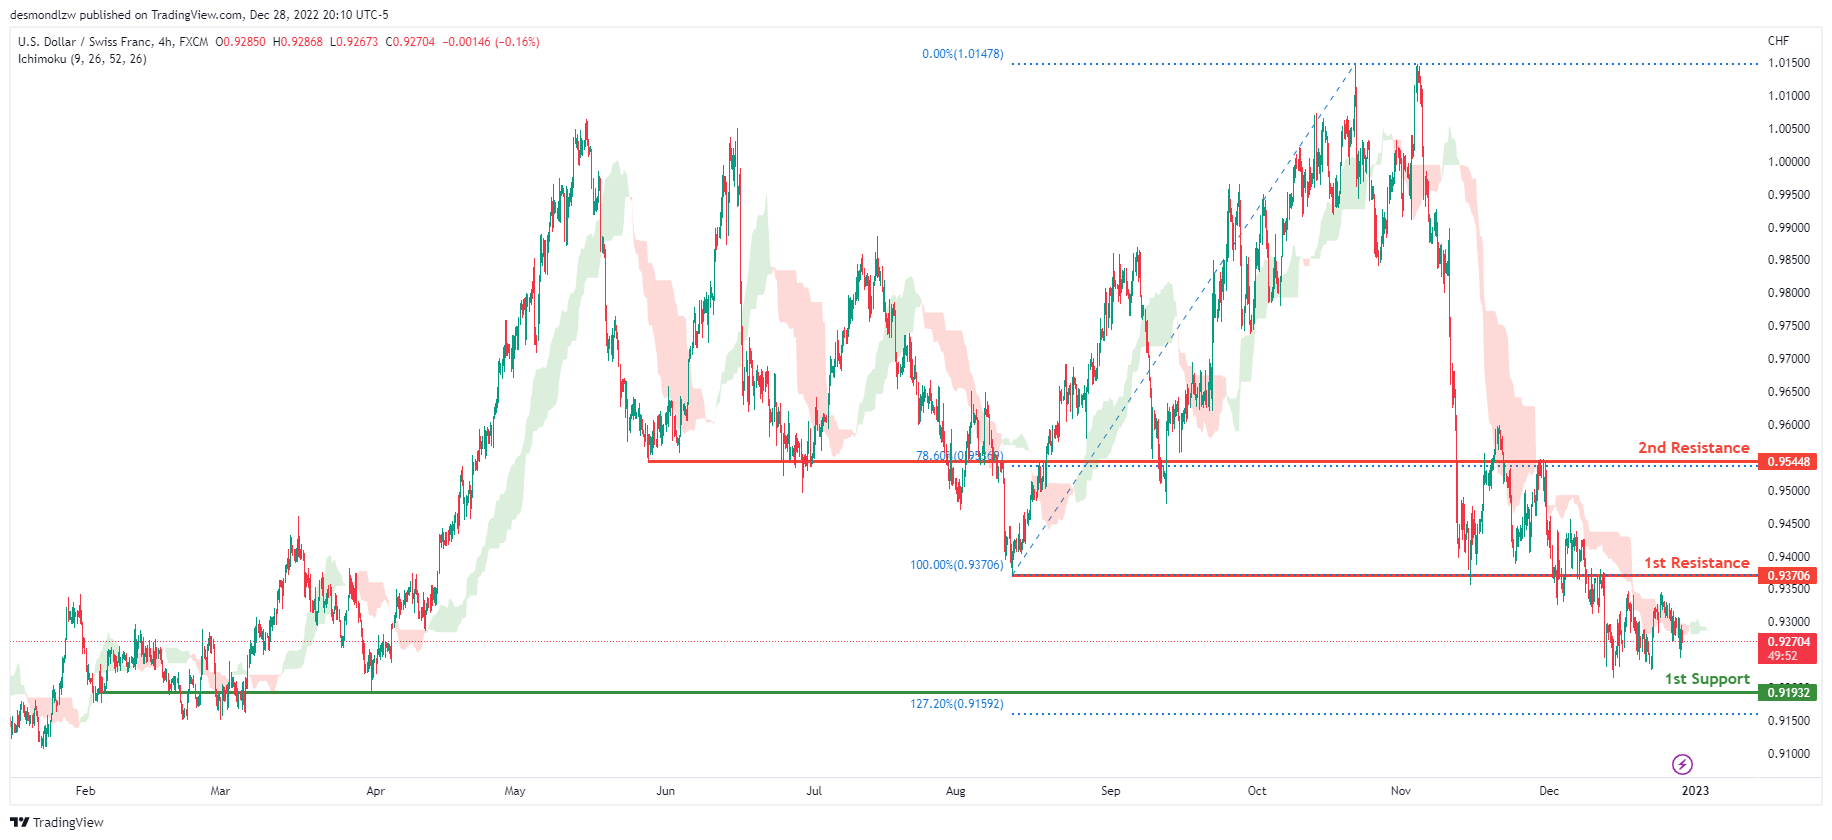
The overall bias for USDCHF on the H4 chart is bearish. In addition, the price is crossing below the Ichimoku cloud, indicating a bearish market. If the current bearish trend continues, expect the price to head back down towards the 1st support line at 0.91932, where the previous swing low and 12.72% Fibonacci extension line is . In an alternative scenario, price could possibly head up towards the 1st resistance at 0.93706, where the previous swing low is .
Areas of consideration
- H4 1st support at 0.91932
- H4 1st resistance at 0.93706
XAU/USD (GOLD):
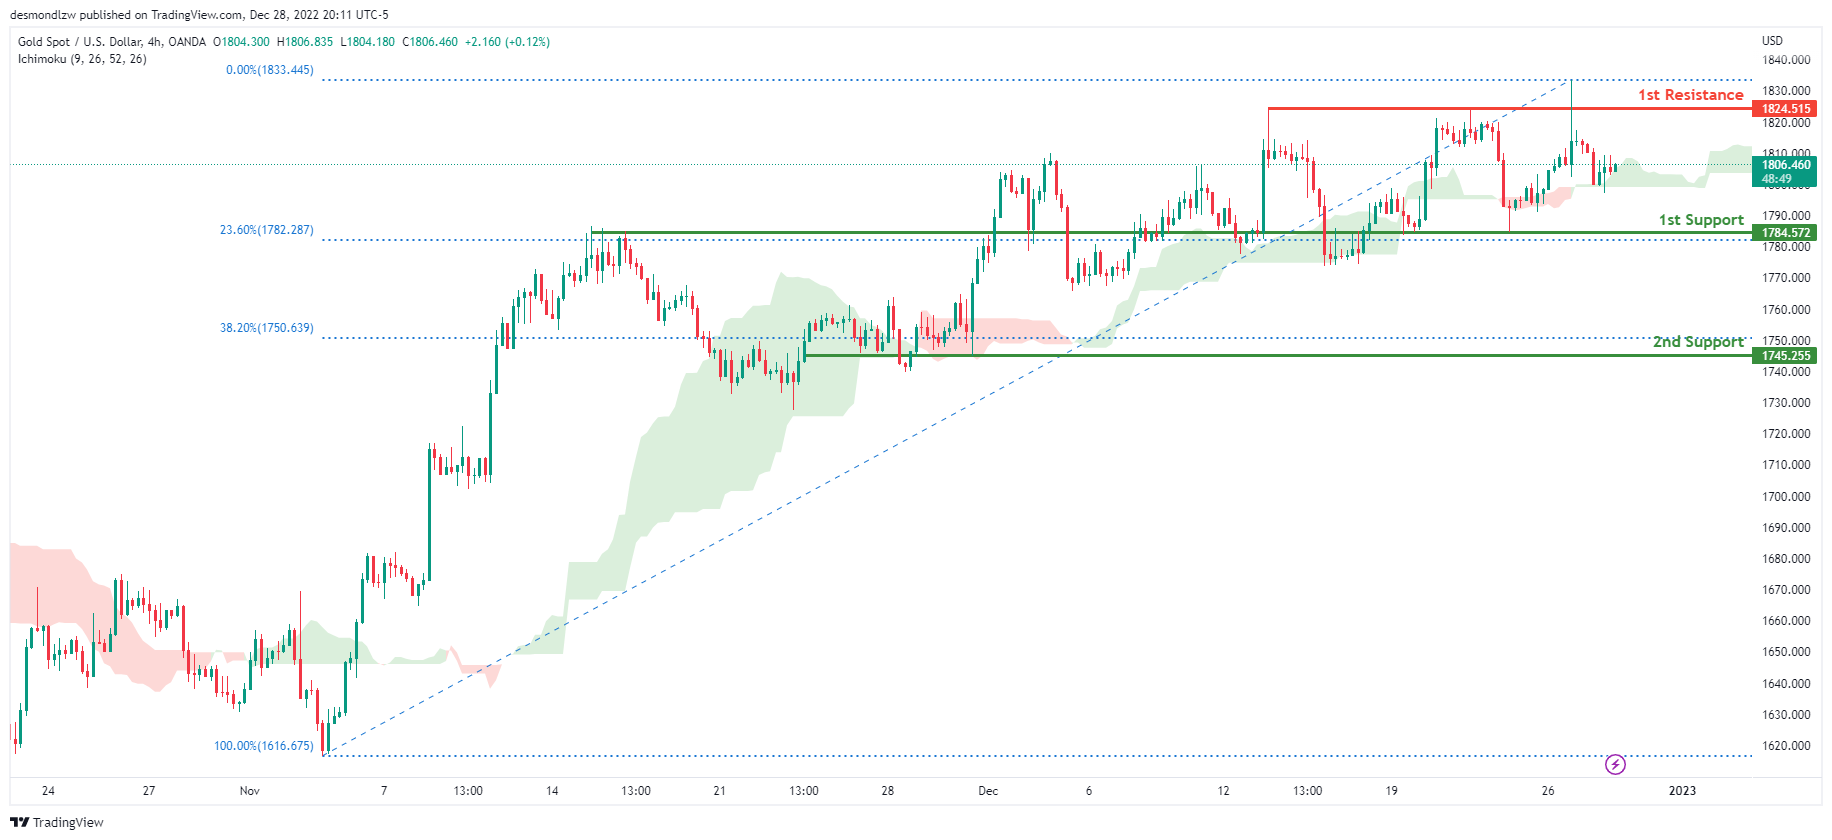
Looking at the H4 chart, my overall bias for XAUUSD is bullish due to the current price crossing above the Ichimoku cloud, indicating a bullish market. If this bullish momentum continues, expect the price to continue heading towards the 1st resistance at 1824.515 where the recent high is. In an alternative scenario, price could possibly head back down to break the 1st support at 1784.572, where the previous high is before heading towards the 2nd support at 1745.255, where the 38.2% Fibonacci line is.
Areas of consideration:
- H4 time frame, 1st resistance at 1824.515
- H4 time frame, 1st support at 1784.572
- H4 time frame, 2nd support at 1745.255
AUD/USD:
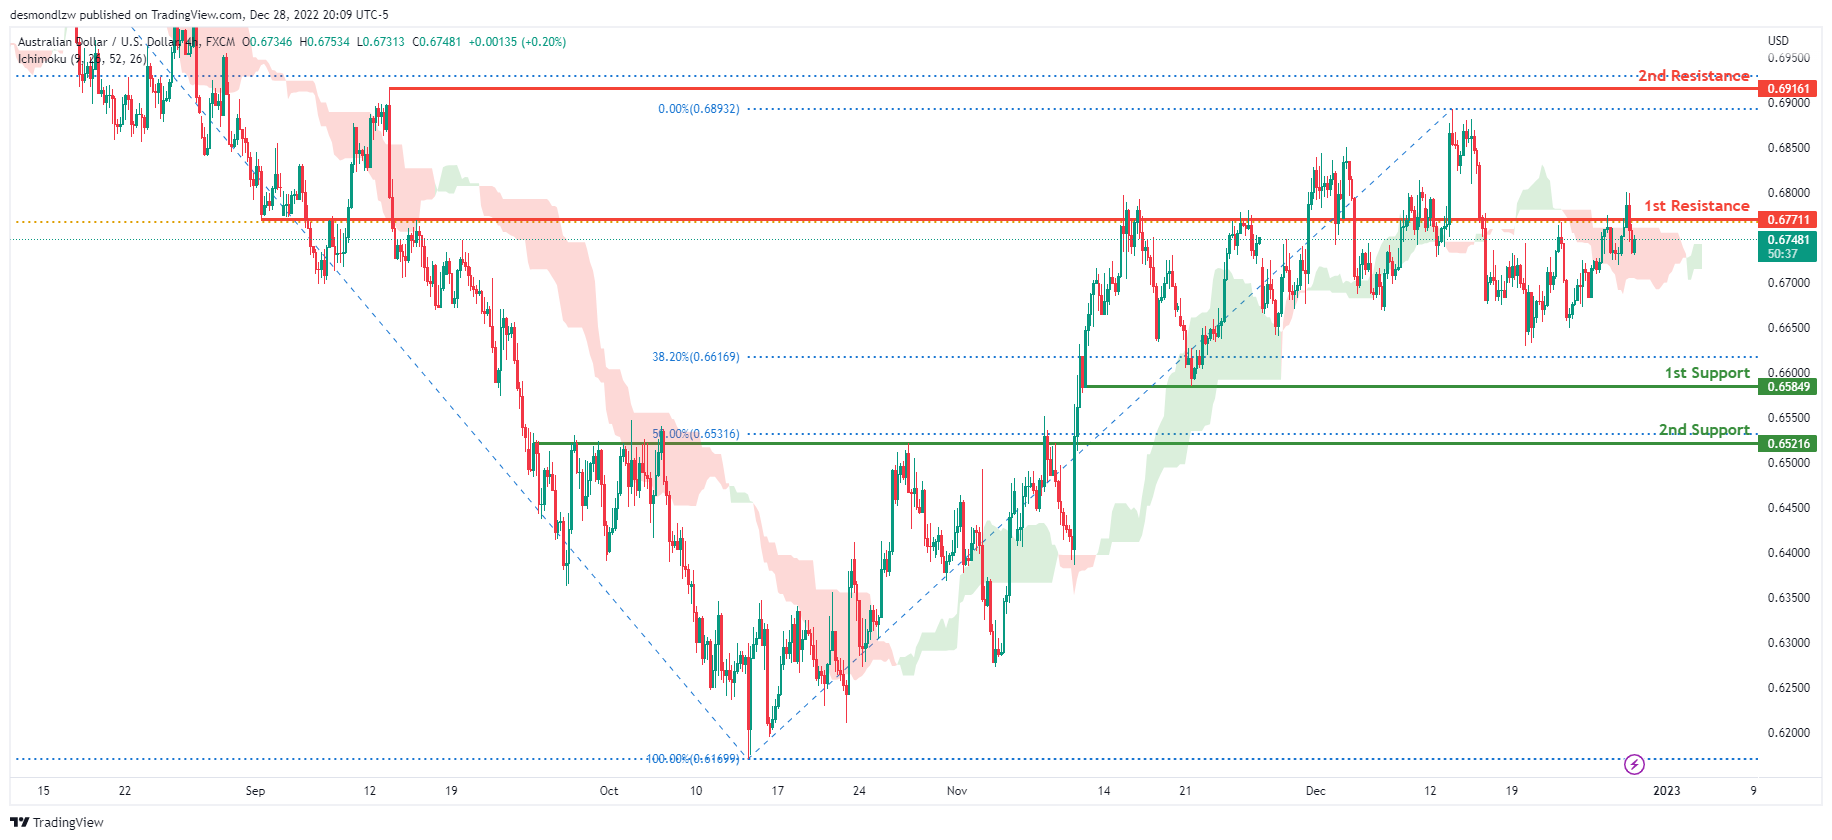
Looking at the H4 chart, my overall bias for AUDUSD is bearish due to the current price crossing below the Ichimoku cloud, indicating a bearish market. If this bearish momentum continues, expect the price to continue heading towards the 1st support at 0.65849, where the 78.6% Fibonacci line is. In an alternative scenario, price could possibly head back up towards the 1st resistance at 0.67711, where the 61.8% Fibonacci line is.
Areas of consideration
- H4, 1st resistance at 0.67711
- H4, 1st support at 0.65849
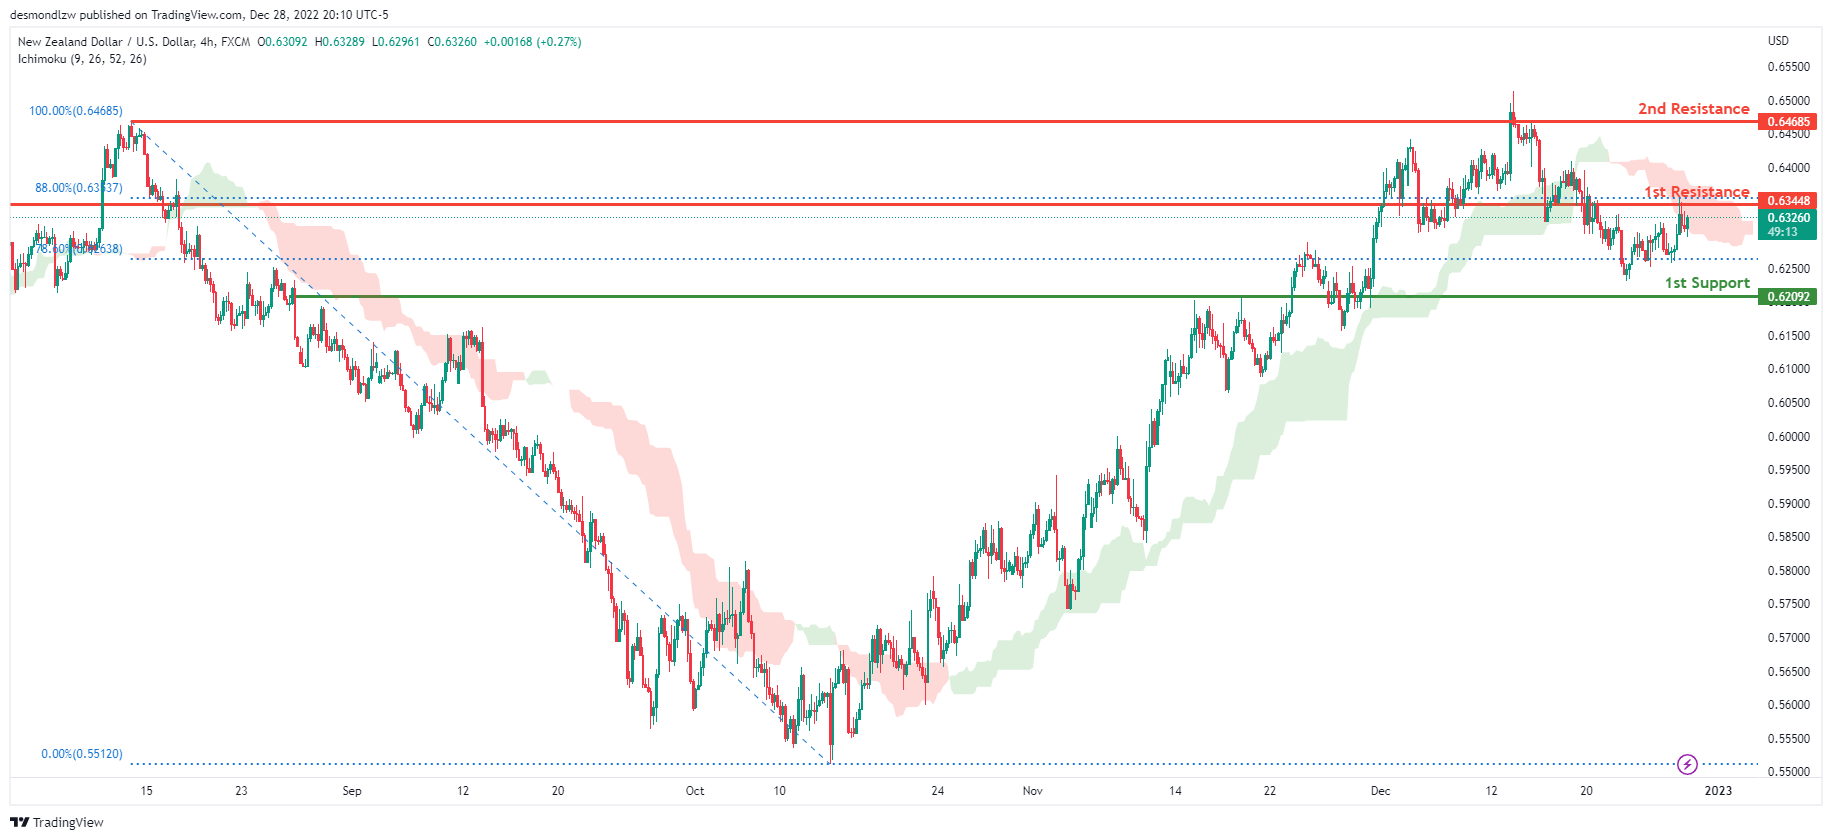
NZD/USD:
Looking at the H4 chart, my overall bias for NZDUSD is bearish due to the current price being below the Ichimoku cloud, indicating a bearish market. If this bearish momentum continues, expect price to possibly continue heading towards the 1st support at 0.62092, where the 78.6% Fibonacci line is. In an alternate scenario, price could possibly head back up towards the 1st resistance level at 0.63448, where the 88% Fibonacci line is.
Areas of consideration:
- H4 time frame, 1st resistance at 0.63448
- H4 time frame, 1st support at 0.62092
USD/CAD:
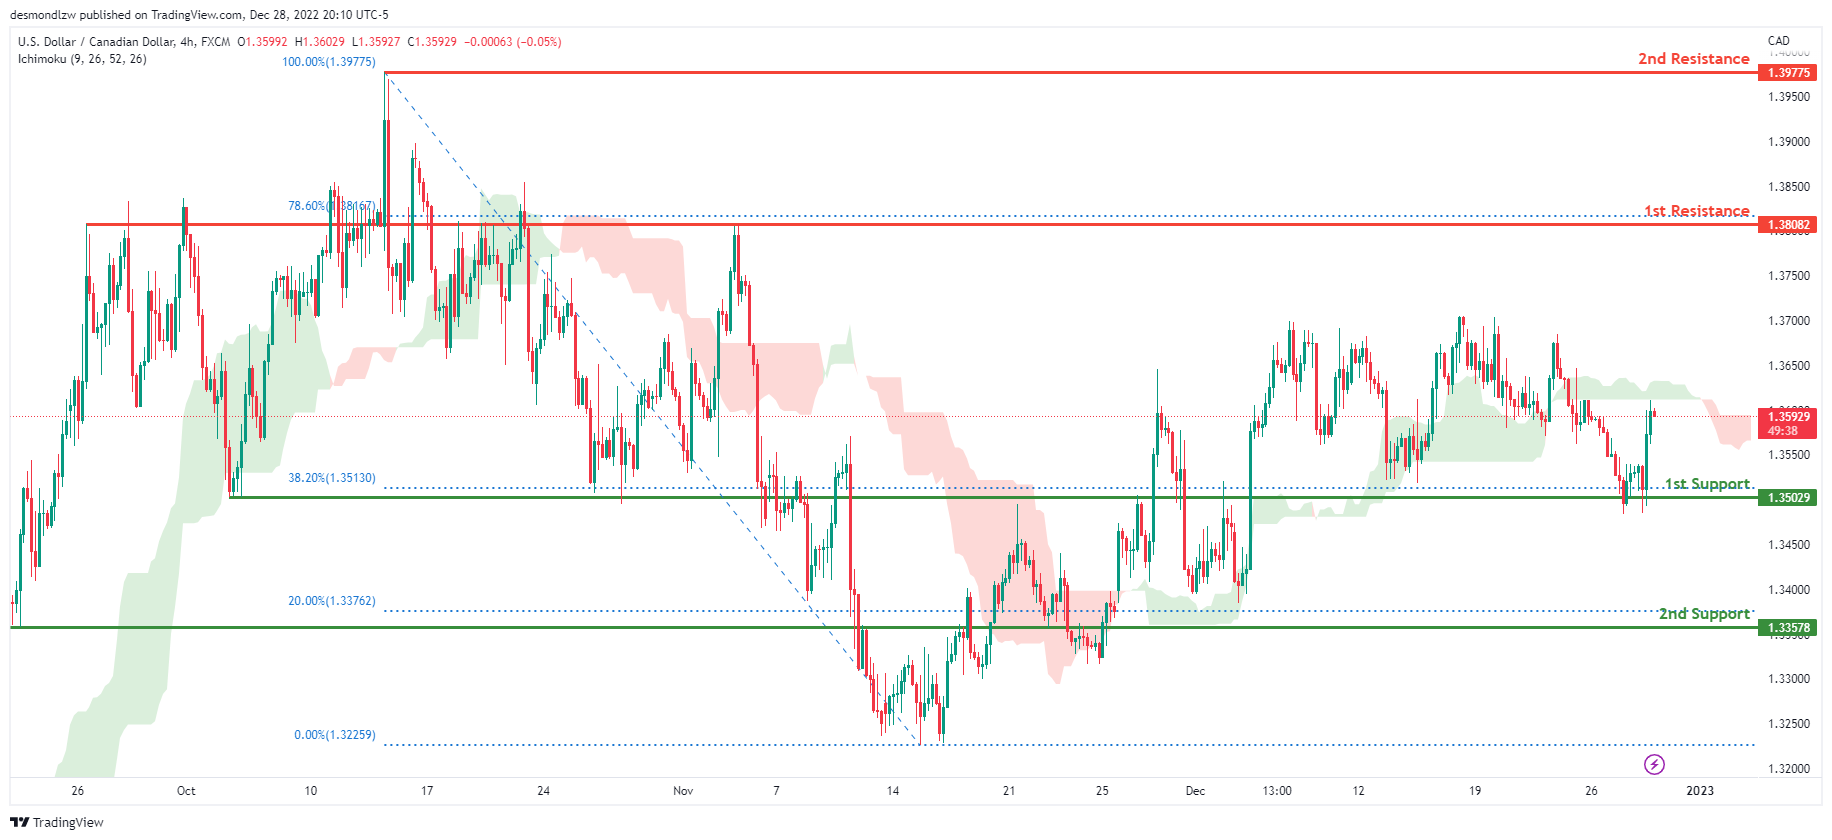
On the H4 chart, the overall bias for USDCAD is bearish. To add confluence to this, the price is below the Ichimoku cloud which indicates a bearish market. If this bearish momentum continues, expect the price to possibly break the 1st support at 1.35029, where the 38.2% Fibonacci line is, before heading towards the 2nd support at 1.33578, where the 20% Fibonacci line is. In an alternative scenario, price could head towards 1st resistance line at 1.38082, where the 78.6% Fibonacci line is.
Areas of consideration:
- H4 time frame, 1st resistance at 1.38082
- H4 time frame, 2nd resistance at 1.39775
- H4 time frame, 1st support at 1.35029
- H4 time frame, 2nd support at 1.33578
OIL:
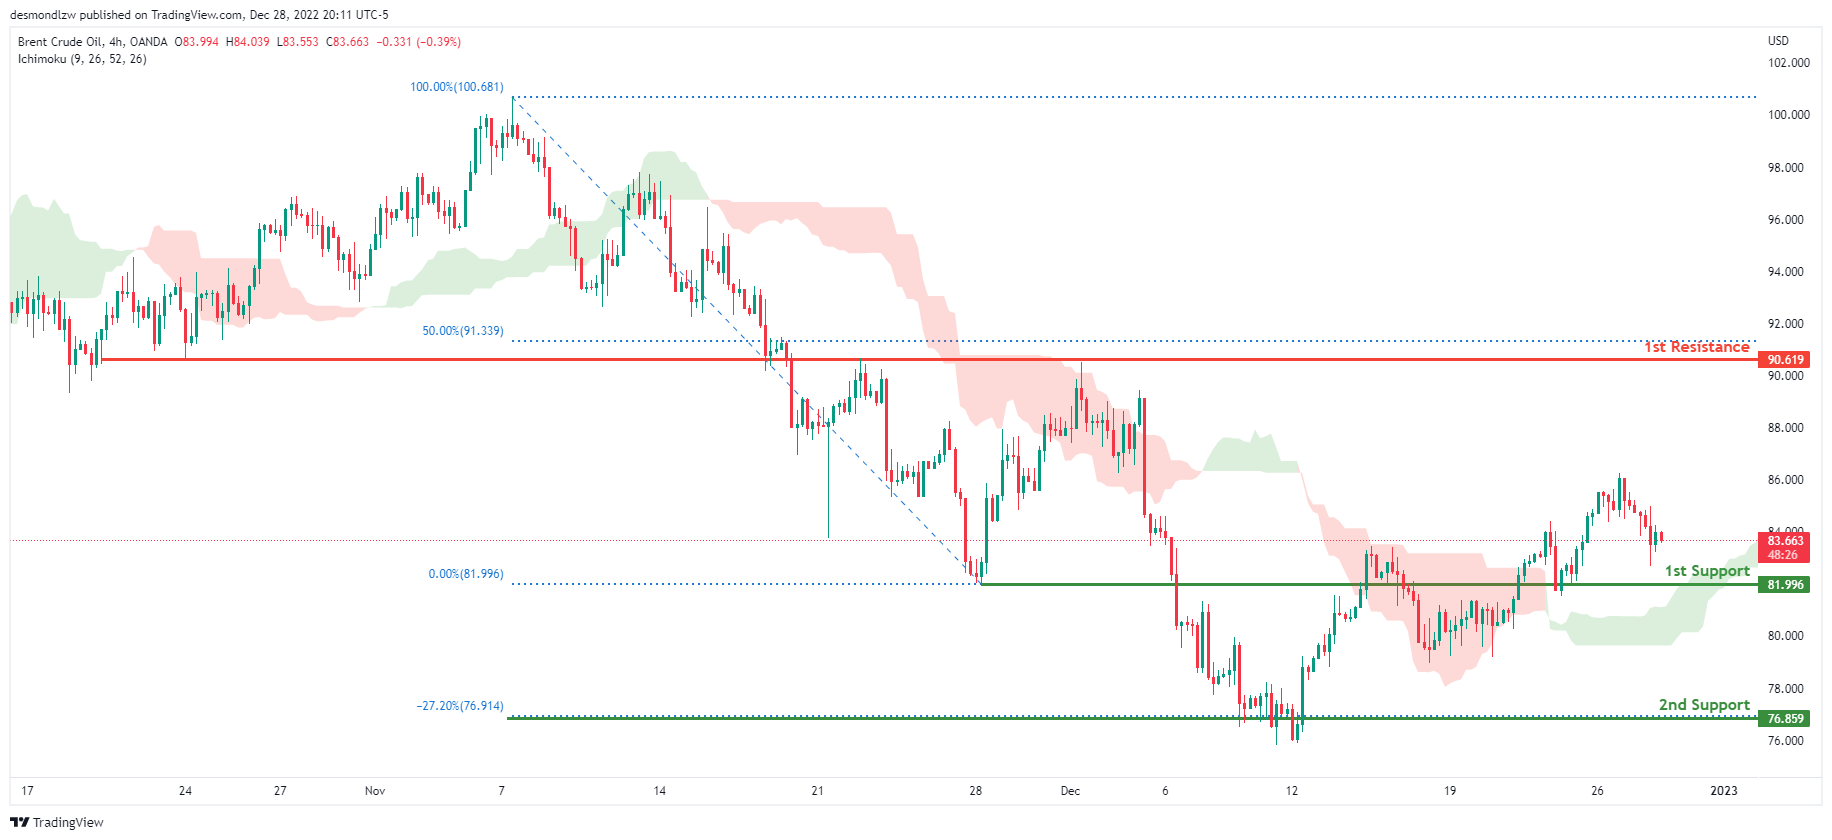
Looking at the H4 chart, my overall bias for BCOUSD is bullish due to the current price being above the Ichimoku cloud, indicating a bullish market. If this bullish momentum continues, expect the price to possibly head towards the 1st resistance at 90.619, where the 50% Fibonacci line is. In an alternate scenario, price could possibly head back down to retest the 1st support level at 81.996, where the previous low is located.
Areas of consideration:
- H4 time frame, 1st resistance at 90.619
- H4 time frame, 1st support at 81.996
Dow Jones Industrial Average:
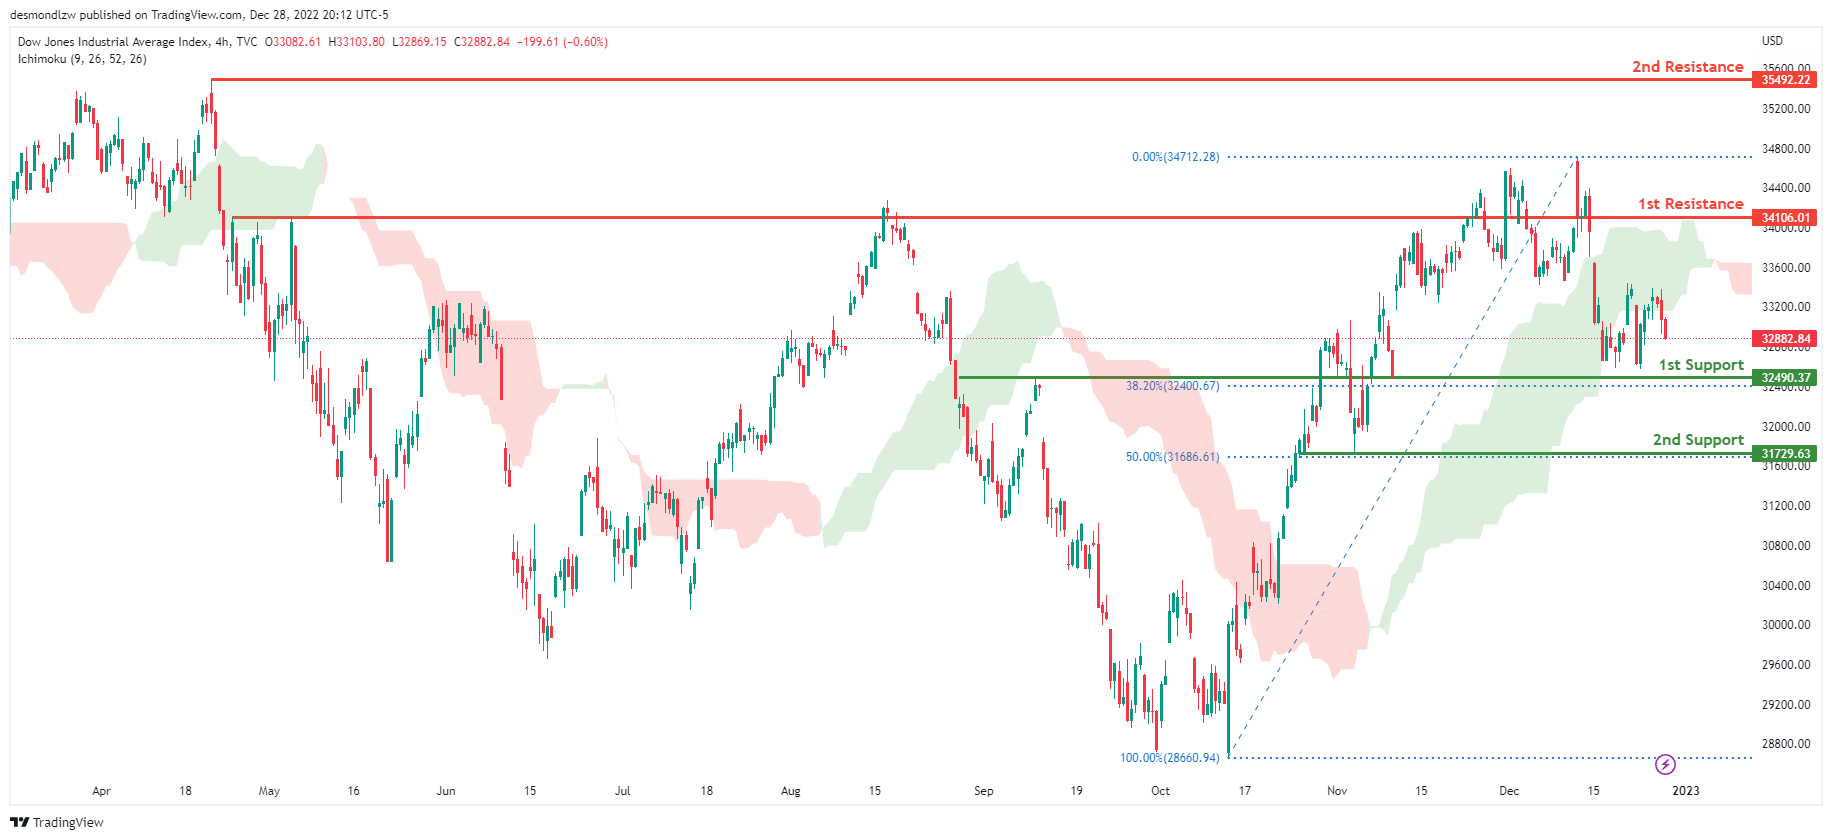
On the H4 chart, the overall bias for DJI is bearish. To add confluence to this, the price is crossing below the Ichimoku cloud which indicates a bearish market. If this bearish momentum continues, expect the price to head back down towards the 1st support at 32490.37, where the 61.8% Fibonacci line is. In an alternative scenario, price could possibly break the 1st resistance line at 34106.01, where the previous swing high is before heading towards the 2nd resistance line at 35492.22, where the previous swing high is.
Areas of consideration:
- H4 time frame, 1st support at 32490.37
- H4 time frame, 1st Resistance at 34106.01
- H4 time frame, 2nd Resistance at 35492.22
DAX:
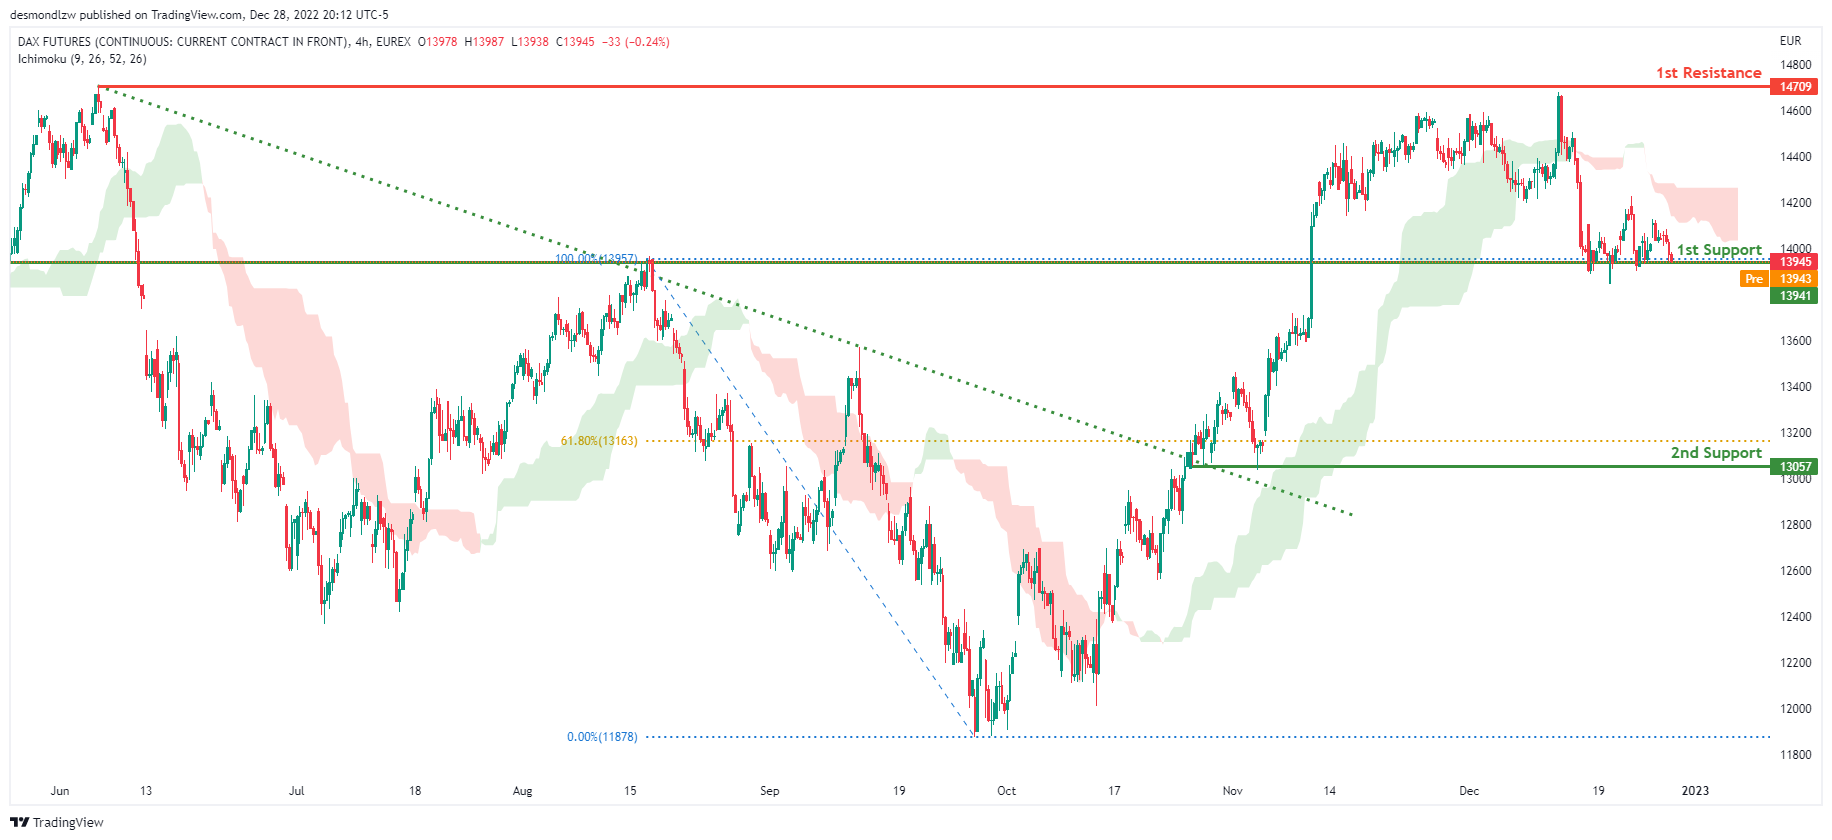
Looking at the H4 chart, my overall bias for DAX is bearish due to the current price being below the Ichimoku cloud, indicating a bearish market. If this bearish momentum continues, expect price to break the 1st support at 13941 where the previous swing high is before heading towards the 2nd support at 13057, where the 61.8% Fibonacci line is. In an alternative scenario, price could possibly head back up to retest the 1st resistance at 14709, where the previous swing high is.
Areas of consideration:
- H4 time frame, 1st resistance is at 14709
- H4 time frame, 1st support is at 13941
- H4 time frame, 2nd support is at 13057
ETHUSD:
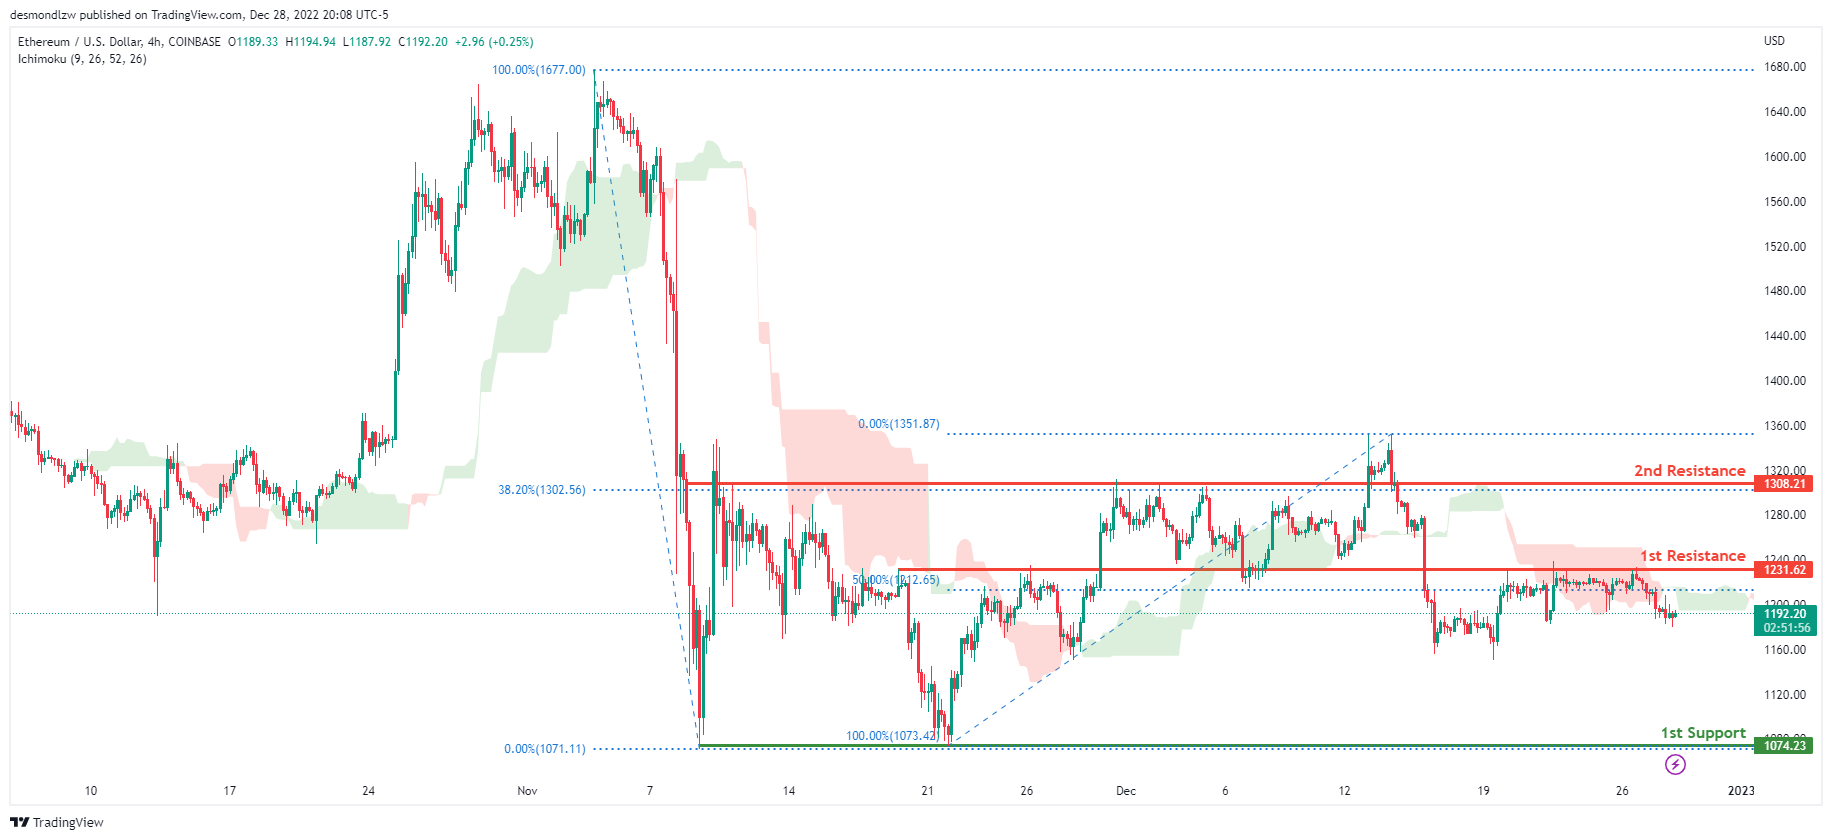
Looking at the H4 chart, my overall bias for ETHUSD is bearish due to the current price crossing below the Ichimoku cloud, indicating a bearish market. If this bearish momentum continues, expect price to head towards the 1st support at 1074.23, where the previous swing low is. In an alternative scenario, price could head back up to break the 1st resistance at 1231.62, where the 50% Fibonacci line is, before heading towards the 2nd resistance at 1308.21, where the 38.2% Fibonacci line is.
Areas of consideration:
- H4 time frame, 1st resistance of 1231.62
- H4 time frame, 2nd resistance of 1308.21
- H4 time frame, 1st support at 1074.23
BTCUSD:
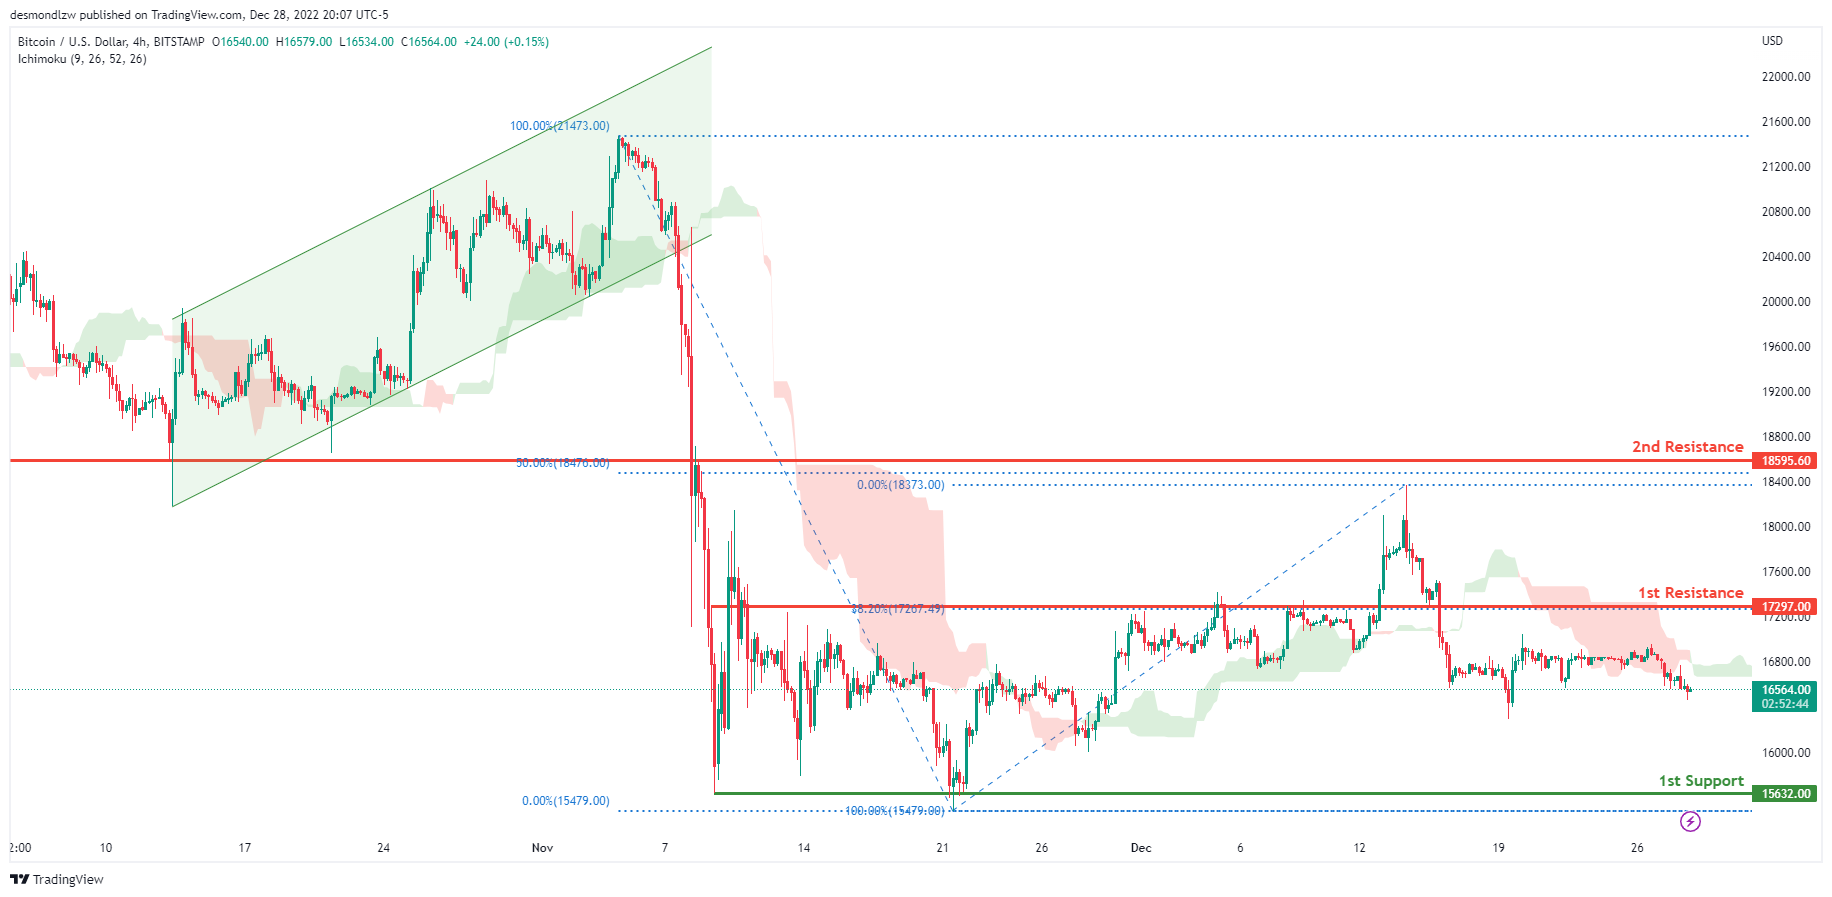
Looking at the H4 chart, my overall bias for BTCUSD is bearish due to the current price crossing below the Ichimoku cloud, indicating a bearish market. If this bearish momentum continues, expect price to possibly continue heading towards the 1st support at 15632.00, where the previous swing low is. In an alternative scenario, price could possibly head up towards the 1st resistance at 17297.00, where the 38.2% Fibonacci line is.
Areas of consideration:
- H4 time frame, 1st resistance 17297.00
- H4 time frame, 1st support at 15632.00
S&P 500:
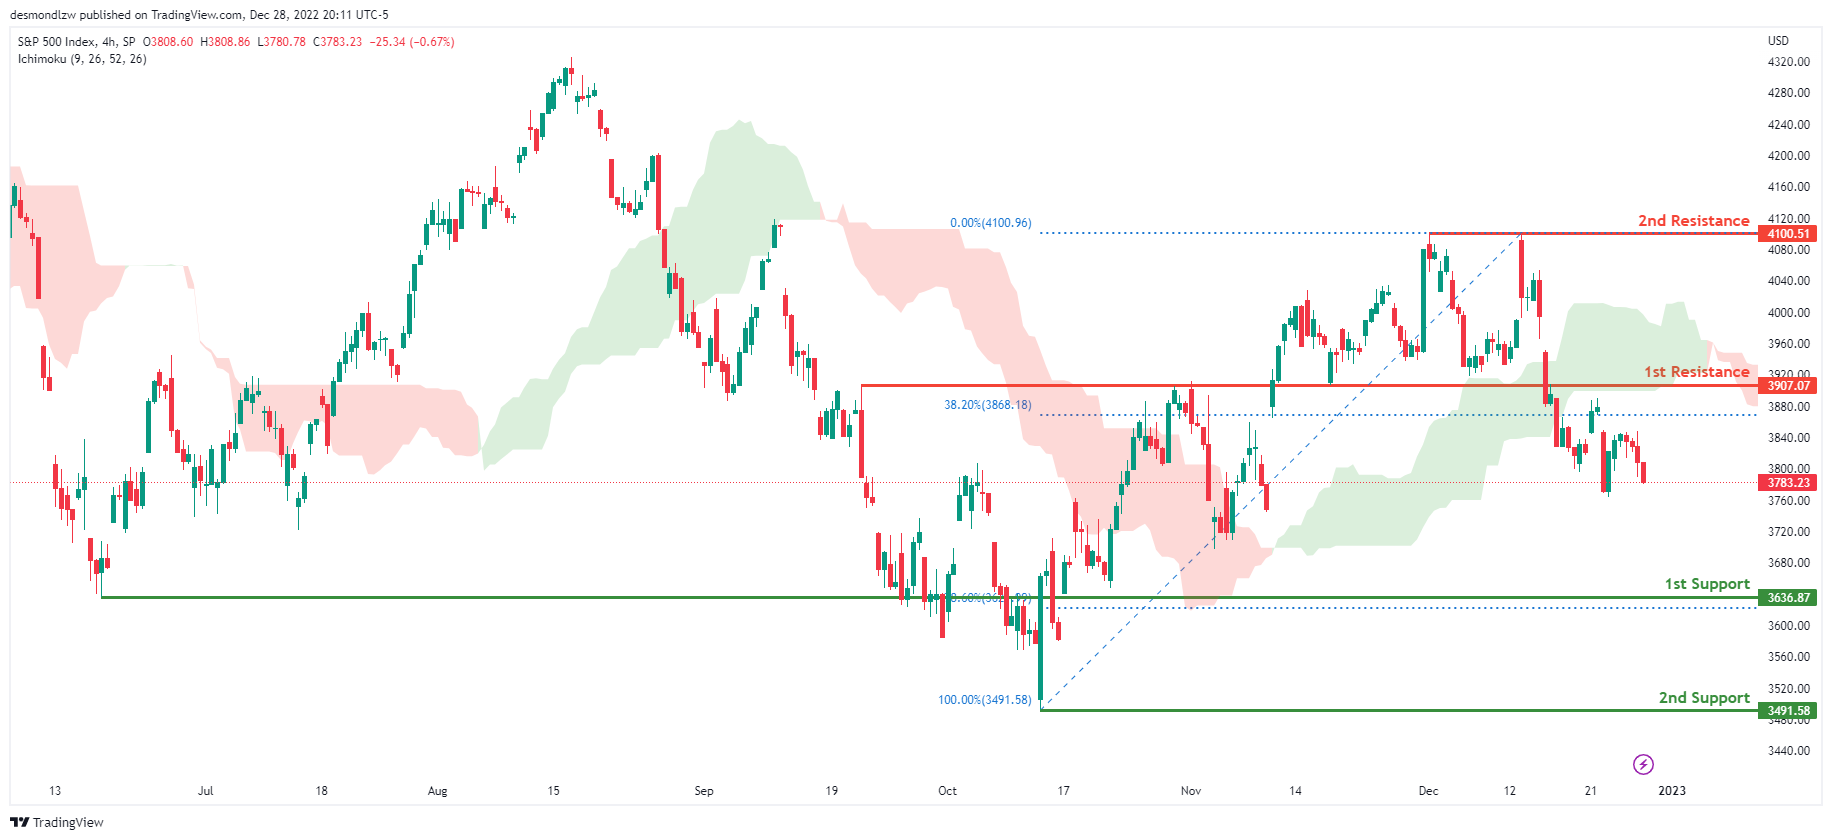
Looking at the H4 chart, my overall bias for S&P500 is bearish due to the current price being below the Ichimoku cloud, indicating a bearish market. If this bearish momentum continues, expect the price to continue heading towards the 1st support at 3636.87, where the 78.6% Fibonacci line is. In an alternative scenario, price could possibly head back up to retest the 1st resistance at 3907.07, where the 38.2% Fibonacci line is.
Areas of consideration:
- H4 time frame, 1st support at 3636.87
- H4 time frame, 1st resistance at 3907.07
AUD/USD Daily Report
Daily Pivots: (S1) 0.6706; (P) 0.6753; (R1) 0.6788; More...
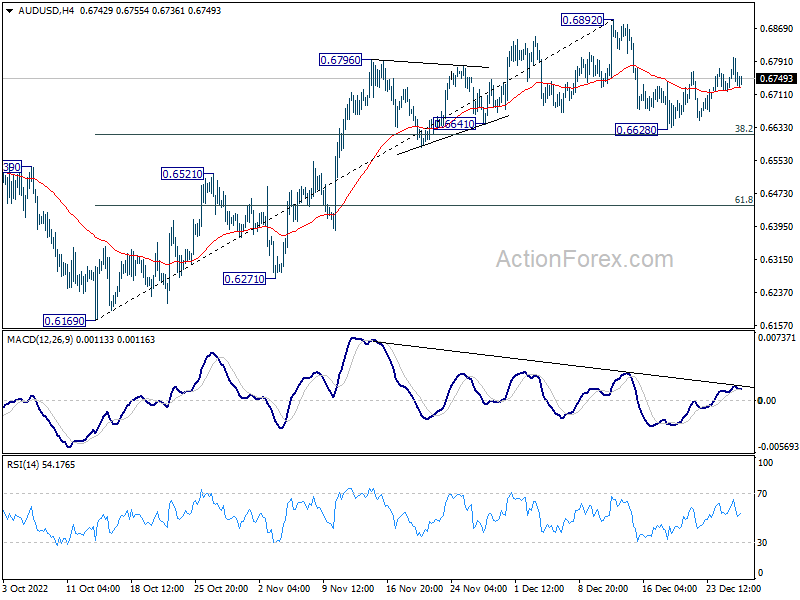
AUD/USD is staying in range of 0.6628/6892 and intraday bias remains neutral first. On the downside, sustained break of 38.2% retracement of 0.6169 to 0.6892 at 0.6616 will indicate rejection by 0.66871 fibonacci level. Deeper fall should then be seen to 61.8% retracement at 0.6445. On the upside, break of 0.6892 will resume the rally from 0.6169.
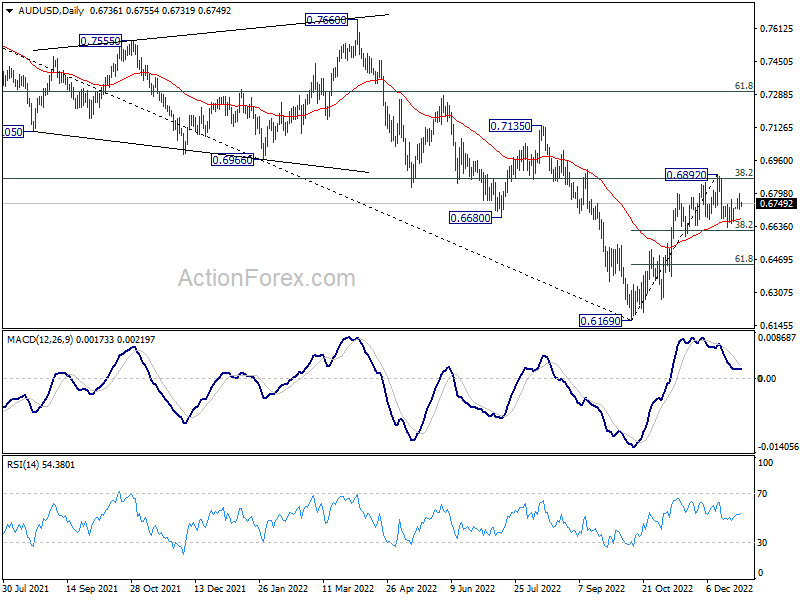
In the bigger picture, it's still unsure if price actions from 0.6169 medium term bottom are developing into a corrective pattern or trend reversal. Rejection by 38.2% retracement of 0.8006 to 0.6169 at 0.6871 will maintain medium term bearishness for another fall through 0.6169 at a later stage. However, firm break of 0.6871, and sustained trading above 55 week EMA (now at 0.6896) will raise the chance of the start of a bullish up trend.
Markets in Risk-Off Mode But Forex Mixed
The financial markets are trading more on the risk-on side as the year-end is approaching. But reactions in the forex markets are relatively mild. Yen continues to be the worst performer for the week but selloff is somewhat slowing. Euro and Sterling are soft with Dollar. Commodity currencies are the relatively stronger ones but have already pared much of the earlier gains. With most traders away, the committed moves might only come next week.
In Asia, at the time of writing, Nikkei is down -1.05%. Hong Kong HSI is down -0.92%. China Shanghai SSE is down -0.29%. Singapore Strait Times is down -0.84%. Japan 10-year JGB yield is down -0.007 at 0.450. Overnight, DOW dropped -1.10%. S&P 500 dropped -1.20%. NASDAQ dropped -1.35%. 10-year yield rose 0.027 to 3.887.
WTI oil down as China boost fades
Oil prices closed lower overnight as the near term rebound appeared to be fading. The optimism over a surge in demand in China was replaced by concerns over infections in the country, as well as its outbound tourists. A regional councillor in Italy confirmed that half of passengers on China flight to Lombardy were tested COVID positive. US also announced to require travelers from China, including Hong Kong, to show negative Covid-19 test result before flights.
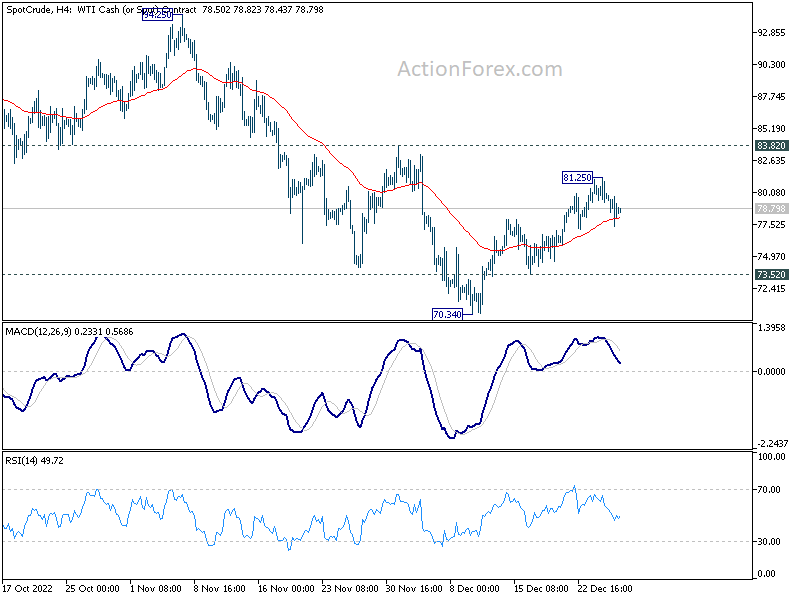
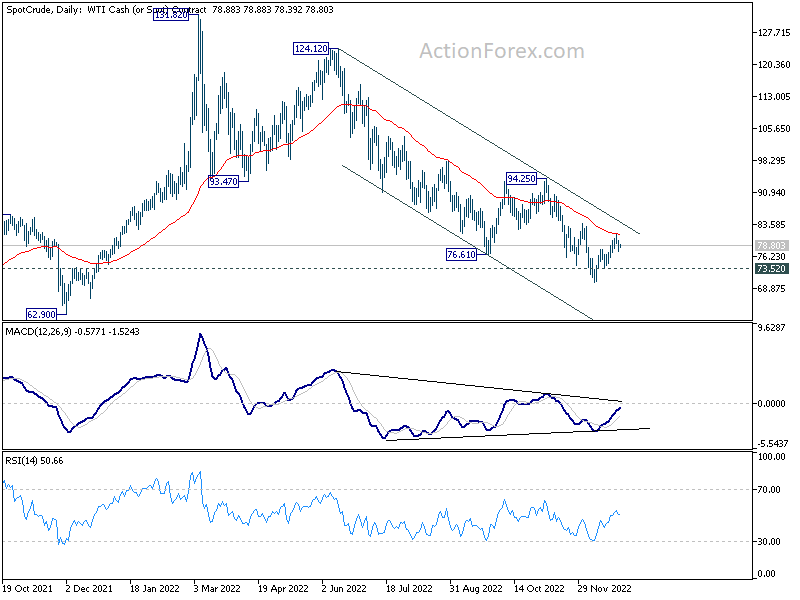
WTI crude oil's rebound from 70.34 stalled after hitting 55 day EMA. It's also kept well inside the medium term falling channel from 124.12. While bullish convergence condition is seen in daily MACD, bearishness is maintained with recent development. Further decline from current level, followed by break of 73.52 support should confirm that the corrective rebound has completed in a three wave structure. Larger down trend should then be ready to resume through 70.34 low, towards next support level at 62.90.
NASDAQ closed at new 2022 low, but a turnaround soon?
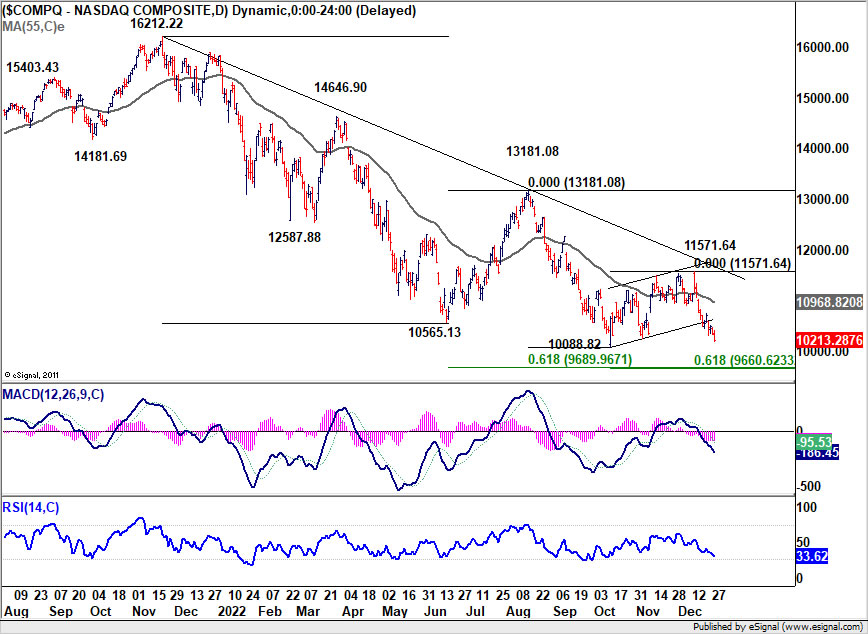
NASDAQ closed at new 2022 low at 10213.28 overnight as investor sentiment turned sour in thin holiday trading. Technically, it's still staying above intraday low at 10088.82, but a break of that level should be seen soon, probably 10000 handle too.
Technically, the key level lies in 9660/89 cluster projection level (61.8% projection of 16212.22 to 10565.13 from 13181.08 at 9689.96, 61.8% projection of 13181.08 to 10088.82 from 11571.64 at 9660.62). Strong support from this cluster level in January could set up the markets for a trend reversal attempt in the first half of 2023. But sustained break there would set up down trend extension for the upcoming period.
We'll soon find out whether a turn in the market is around the corner.
Looking ahead
Eurozone M3 money supply and US jobless claims will be released today.
AUD/USD Daily Report
Daily Pivots: (S1) 0.6706; (P) 0.6753; (R1) 0.6788; More...
AUD/USD is staying in range of 0.6628/6892 and intraday bias remains neutral first. On the downside, sustained break of 38.2% retracement of 0.6169 to 0.6892 at 0.6616 will indicate rejection by 0.66871 fibonacci level. Deeper fall should then be seen to 61.8% retracement at 0.6445. On the upside, break of 0.6892 will resume the rally from 0.6169.
In the bigger picture, it's still unsure if price actions from 0.6169 medium term bottom are developing into a corrective pattern or trend reversal. Rejection by 38.2% retracement of 0.8006 to 0.6169 at 0.6871 will maintain medium term bearishness for another fall through 0.6169 at a later stage. However, firm break of 0.6871, and sustained trading above 55 week EMA (now at 0.6896) will raise the chance of the start of a bullish up trend.
Economic Indicators Update
| GMT | Ccy | Events | Actual | Forecast | Previous | Revised |
|---|---|---|---|---|---|---|
| 09:00 | EUR | Eurozone M3 Money Supply Y/Y Nov | 5.00% | 5.10% | ||
| 13:30 | USD | Initial Jobless Claims (Dec 23) | 225K | 216K | ||
| 15:30 | USD | Natural Gas Storage | -198B | -87B | ||
| 16:00 | USD | Crude Oil Inventories | -1.2M | -5.9M |
NASDAQ closed at new 2022 low, but a turnaround soon?
NASDAQ closed at new 2022 low at 10213.28 overnight as investor sentiment turned sour in thin holiday trading. Technically, it's still staying above intraday low at 10088.82, but a break of that level should be seen soon, probably 10000 handle too.
Technically, the key level lies in 9660/89 cluster projection level (61.8% projection of 16212.22 to 10565.13 from 13181.08 at 9689.96, 61.8% projection of 13181.08 to 10088.82 from 11571.64 at 9660.62). Strong support from this cluster level in January could set up the markets for a trend reversal attempt in the first half of 2023. But sustained break there would set up down trend extension for the upcoming period.
We'll soon find out whether a turn in the market is around the corner.
Elliott Wave Projects Further Downside in DAX
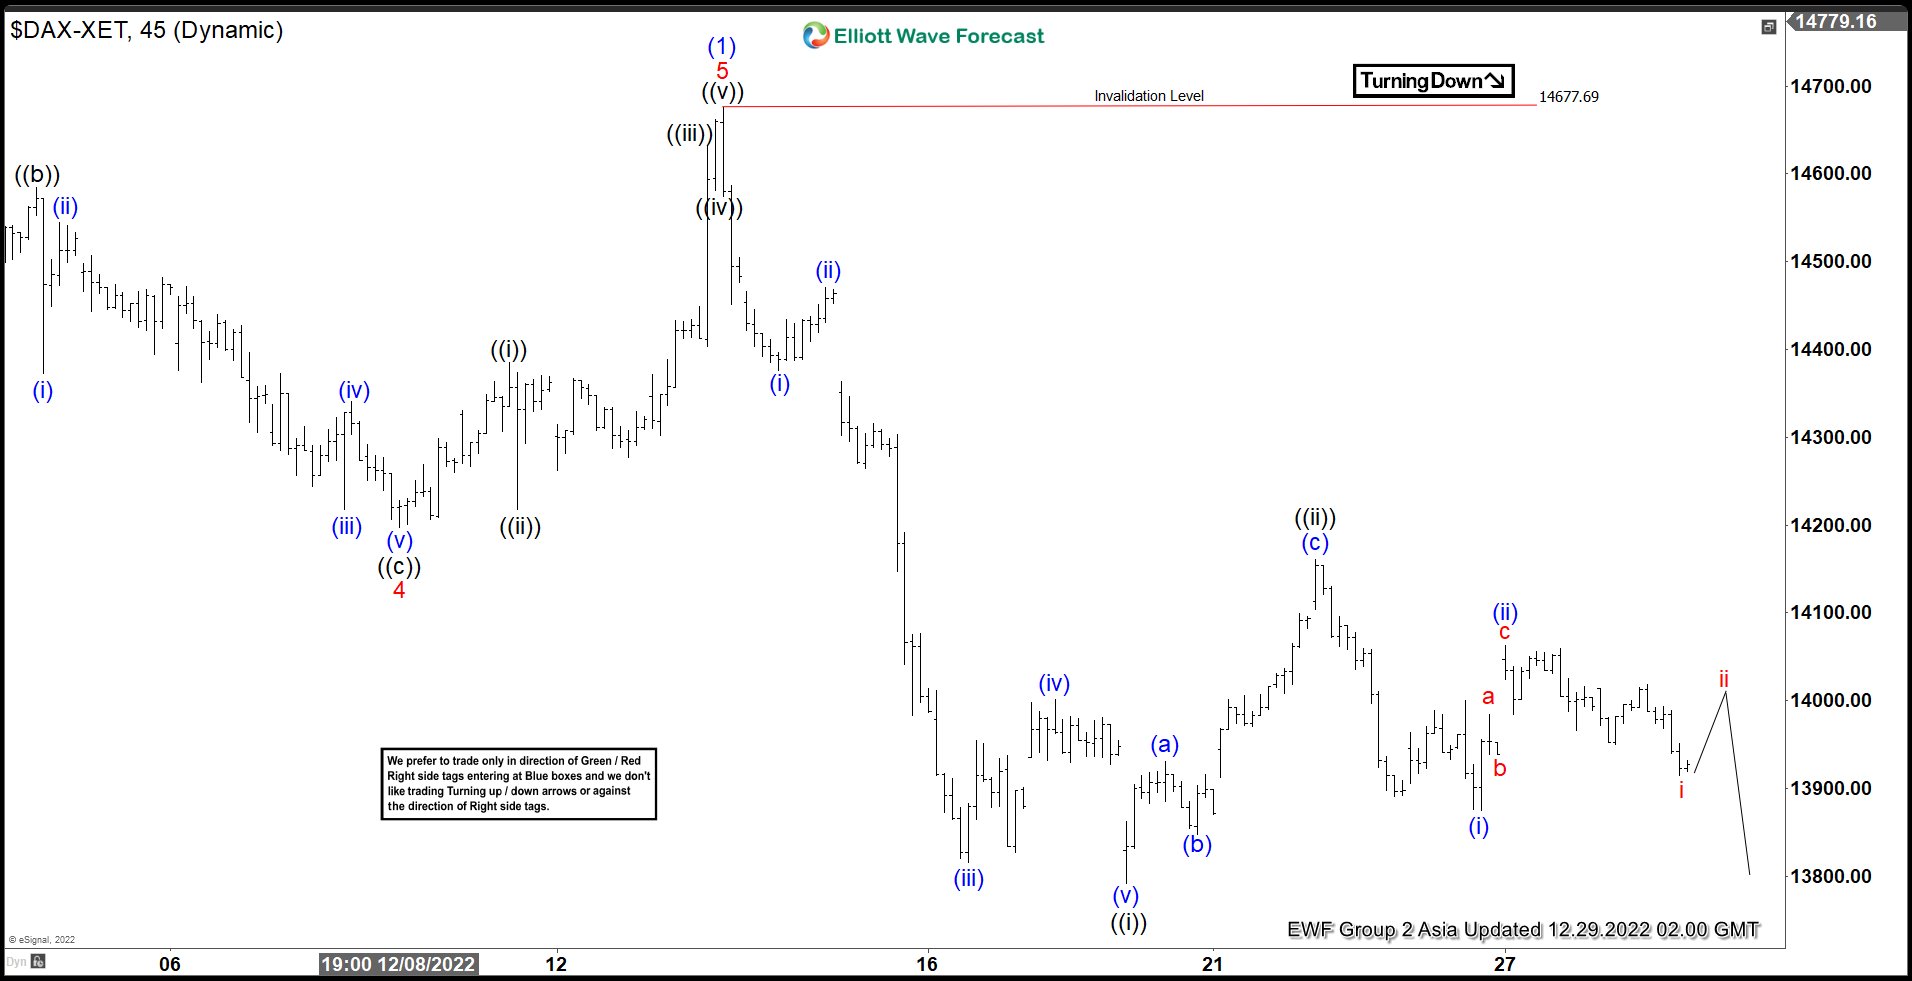
Short term, Elliott wave view in DAX suggests cycle from 9.28.2022 low has ended with wave (1) at 14677.69 as an impulse. The Index is currently correcting cycle from 9.28.2022 low within wave (2). Internal subdivision of wave (2) is unfolding as a zigzag Elliott Wave structure. Down from wave (1), wave (i) ended at 14375.95 and rally in wave (ii) ended at 14470.74. Index then extends lower in wave (iii) towards 13815.24, and rally in wave (iv) ended at 14001.37. Final leg lower wave (v) ended at 13791.52 which completed wave ((i)).
Wave ((ii)) rally has ended at 14160.87 with internal subdivision as a zigzag Elliott Wave structure. Up from wave ((i)), wave (a) ended at 13931.29 and pullback in wave (b) ended at 13848.07. Wave (c) higher ended at 14160.87 which completed wave ((ii)). Index has turned lower in wave ((iii)), but it still needs to break below wave ((i)) at 13791.52 to rule out any double correction. Near term, as far as pivot at 14677.69 high stays intact, expect rally to fail in 3, 7, or 11 swing for further downside. Potential target lower in wave ((iii)) = 100% – 161.8% Fibonacci extension of wave ((i)) at 12744 – 13285.
DAX 45 Minutes Elliott Wave Chart
WTI oil down as China boost fades
Oil prices closed lower overnight as the near term rebound appeared to be fading. The optimism over a surge in demand in China was replaced by concerns over infections in the country, as well as its outbound tourists. A regional councillor in Italy confirmed that half of passengers on China flight to Lombardy were tested COVID positive. US also announced to require travelers from China, including Hong Kong, to show negative Covid-19 test result before flights.
WTI crude oil's rebound from 70.34 stalled after hitting 55 day EMA. It's also kept well inside the medium term falling channel from 124.12. While bullish convergence condition is seen in daily MACD, bearishness is maintained with recent development. Further decline from current level, followed by break of 73.52 support should confirm that the corrective rebound has completed in a three wave structure. Larger down trend should then be ready to resume through 70.34 low, towards next support level at 62.90.
Crude Oil Price Trims Gains, Gold Faces Key Hurdle
Key Highlights
- Crude oil price started a fresh decline from the $81 resistance.
- It broke a key bullish trend line with support near $79.70 on the 4-hours chart.
- Gold price is still struggling to clear the $1,825 resistance zone.
- EUR/USD might attempt a fresh increase towards the 1.0750 level.
Crude Oil Price Technical Analysis
Crude oil price started a fresh decline from the $81 resistance against the US Dollar. The price formed a high near $81.09 before it started a fresh decline.
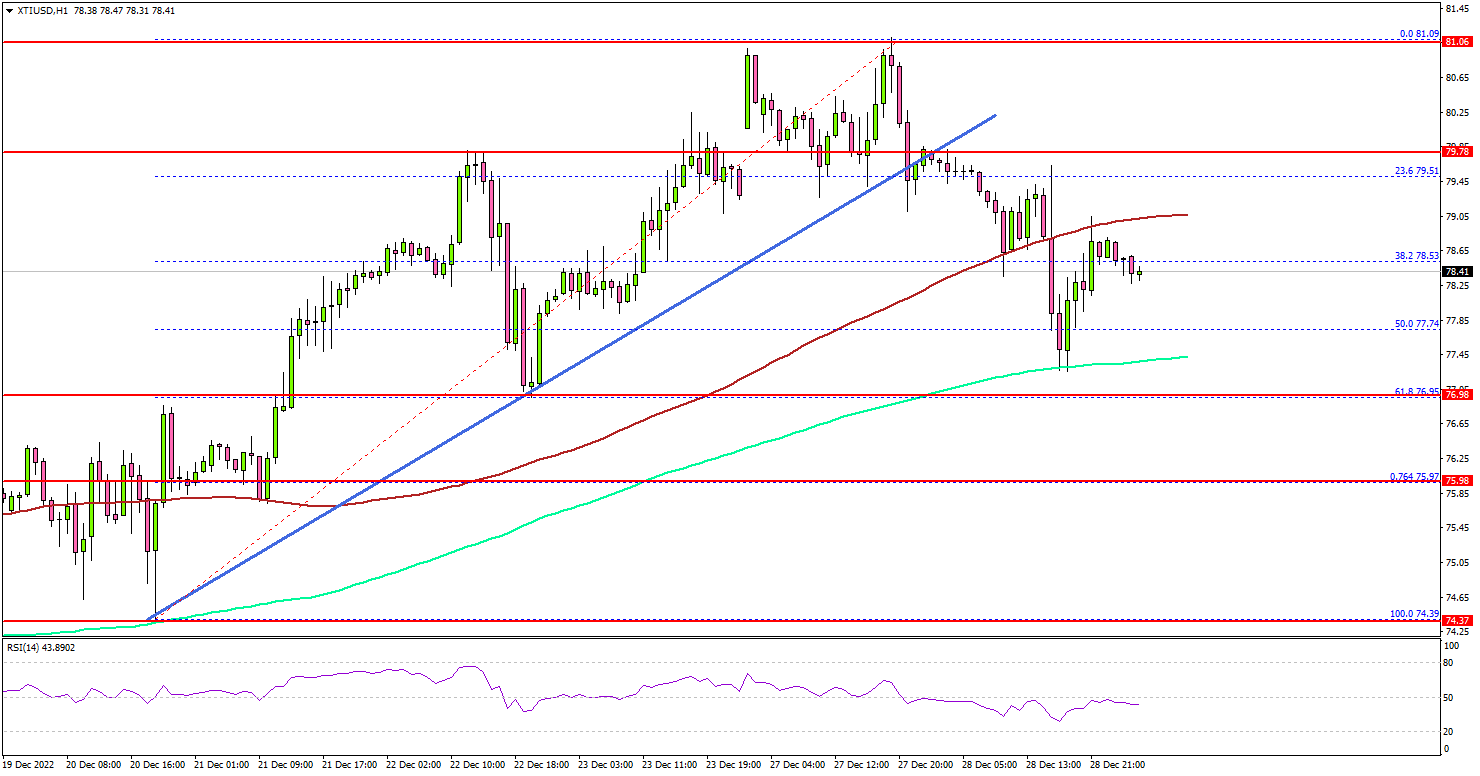
Looking at the 4-hours chart of XTI/USD, there was a break above below a key bullish trend line with support near $79.70. It opened the doors for a move below the $78.80 support zone and the 100 simple moving average (red, 4-hours).
The price even spiked below the 50% Fib retracement level of the upward move from the $74.39 swing low to $81.09 high. Finally, the price tested the 200 simple moving average (green, 4-hours).
An immediate support is now forming near the $77.00 zone and the 61.8% Fib retracement level of the upward move from the $74.39 swing low to $81.09 high.
The next major support sits near the $76.00 level. Any more losses might call for a test of the $74.500 support zone in the coming days.
On the upside, the price might face sellers near the $78.20 zone. The next major resistance is near $78.50 zone and the 100 simple moving average (red, 4-hours), above which the price could test $80 resistance. A clear move above the $80 resistance could open the doors for another steady increase towards $81 or even $82.
Looking at gold price, there was a failed attempt to clear the $1,825 resistance and the price corrected lower.
Economic Releases to Watch Today
- US Initial Jobless Claims - Forecast 213K, versus 216K previous.
USD/JPY: Recovery Shows Initial Signs of Stall
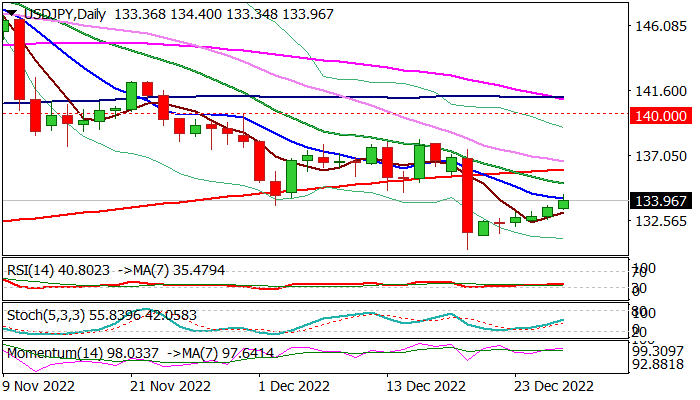
The USDJPY remains at the front foot and rose to one-week high on Wednesday, but bulls face headwinds at 134.40 zone and pulled back after failing to break through barriers provided by daily Tenkan-sen / 50% retracement of 138.17/130.56, which generates initial signal of recovery stall.
Daily studies support the notion as 14-d momentum indicator remains in the negative territory and moving averages are in bearish setup, with triple death-cross (5/200; 10/200 and 20/200 DMA’s) weighing on near-term action.
Daily close below 134.40 zone would add to negative signals and keep the downside vulnerable, but return below 5DMA (133.08) is required to signal that bears are re-taking control.
The pair is on track to end the second straight month with strong losses and monthly indicators are in steep decline, which adds to weakening structure and favors bearish scenario on the larger picture for now, however, bears look for a monthly close below cracked Fibo support at 133.09 (38.2% of 102.59/151.94 ascend) for confirmation.
Res: 134.40; 135.26; 136.11; 136.37.
Sup: 133.47; 133.08; 132.12; 130.56.
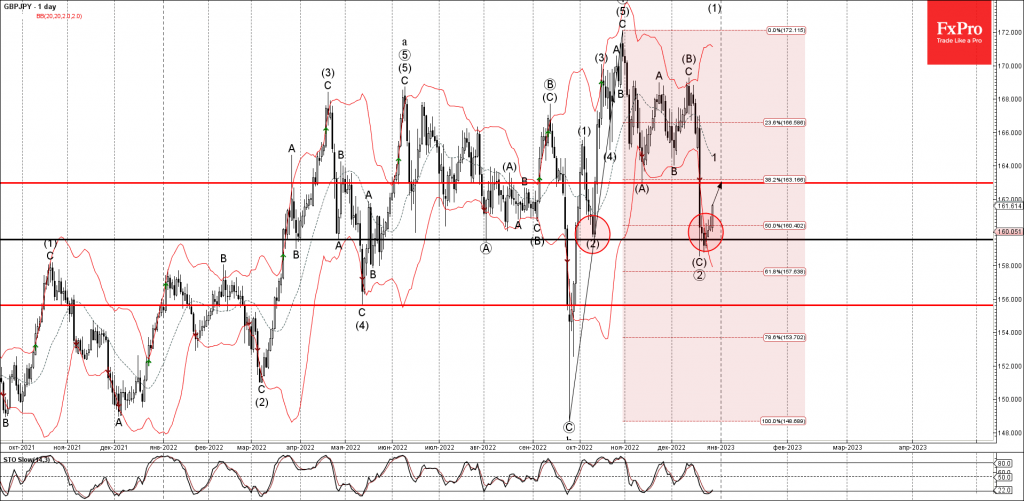
GBPJPY Wave Analysis
- GBPJPY reversed from support level 159.60
- Likely to rise to resistance level 162.95
GBPJPY currency pair recently reversed up from the powerful support level 159.60 (previous monthly low from October), coinciding with the lower daily Bollinger Band.
The upward reversal from the support level 159.60 stopped the previous primary ABC correction from the end of October.
Given the strong yen outflows, GBPJPY can be expected to rise further toward the next resistance level 162.95 (former low of wave (A) and the monthly low from November).