Sample Category Title
GBP/USD Daily Outlook
Daily Pivots: (S1) 1.1985; (P) 1.2049; (R1) 1.2094; More...
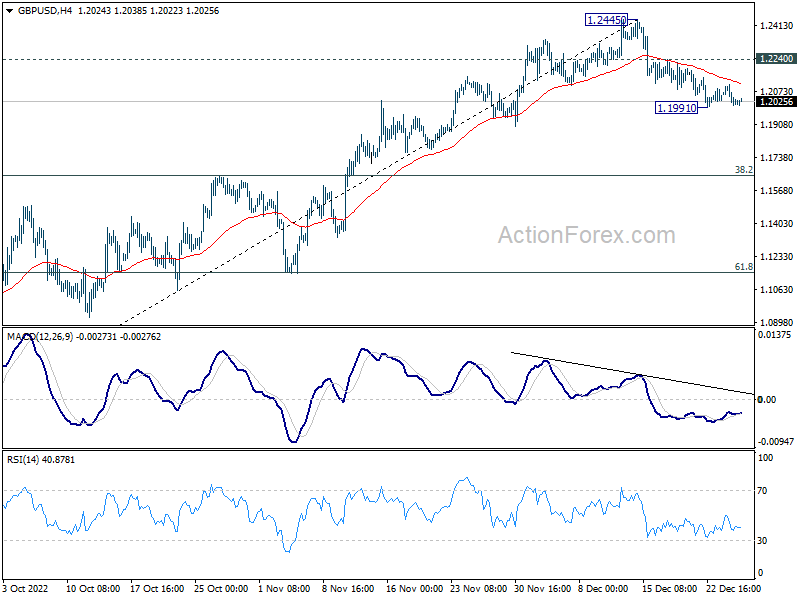
Intraday bias in GBP/USD remains neutral for the moment. On the downside, break of 1.1991 will resume the fall from 1.2445 to 55 day EMA (now at 1.1916). Firm break there will target 38.2% retracement of 1.0351 to 1.2445 at 1.1645. On the upside, break of 1.2240 minor resistance will turn bias back to the upside for retesting 1.2445 instead.
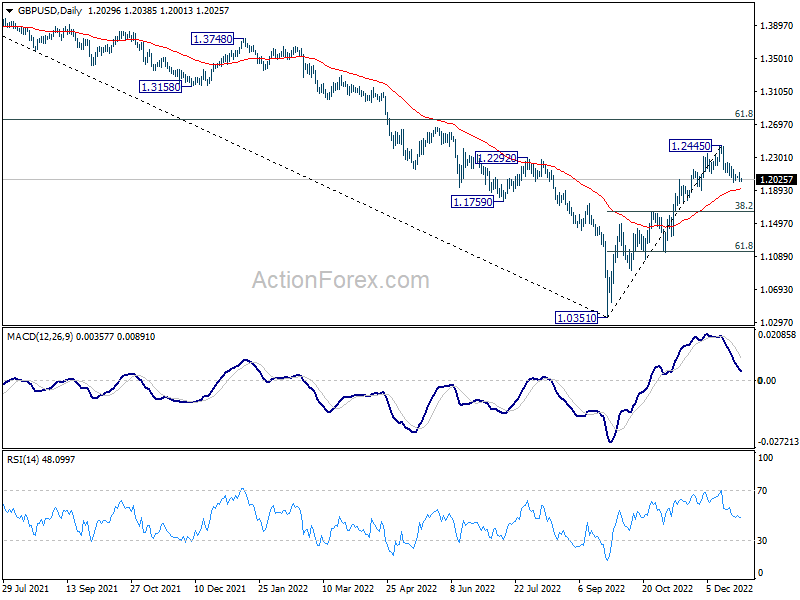
In the bigger picture, rise from 1.0351 medium term bottom is at least correcting whole down trend from 1.4248 (2021 high). Further rise is expected as long as 1.1644 resistance turned support holds. Next target is 61.8% retracement of 1.4248 to 1.0351 at 1.2759. Sustained break there will pave the way back to 1.4248. This will remain the favored case as long as 55 day EMA (now at 1.1916) holds.
USD/CHF Daily Outlook
Daily Pivots: (S1) 0.9265; (P) 0.9298; (R1) 0.9327; More...
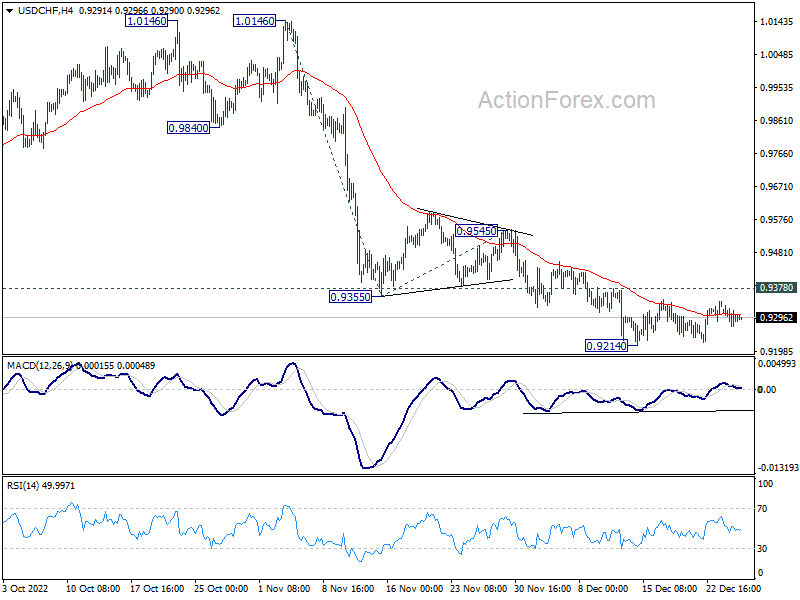
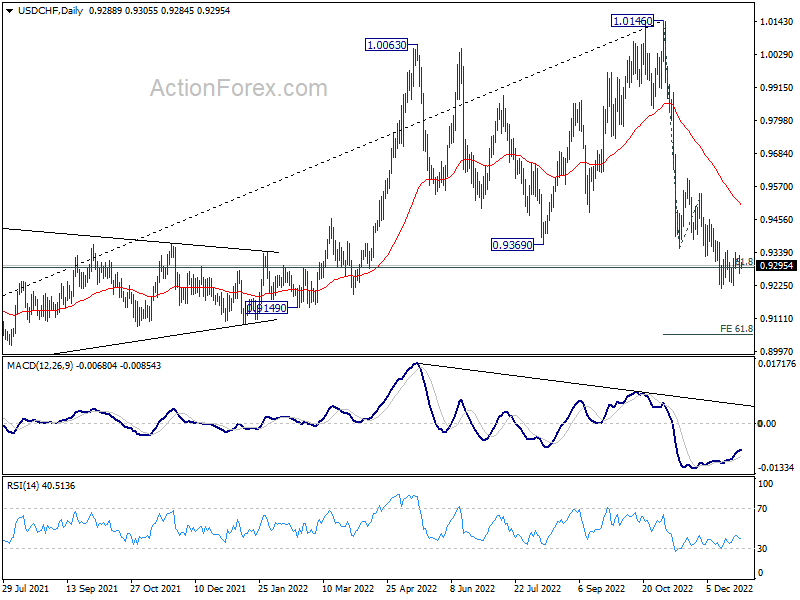
Range trading continues in USD/CHF and outlook is unchanged. Intraday bias stays on the downside, and further decline is in favor with 0.9378 resistance intact. On the downside, break of 0.9214 will resume the fall and target 61.8% projection of 1.0146 to 0.9355 from 0.9545 at 0.9056. However, break of 0.9378 resistance will indicate short term bottoming and turn bias back to the upside for 0.9545 resistance instead.
In the bigger picture, rise from 0.8756 (2021 low) has completed at 1.0146, well ahead of 1.0342 long term resistance (2016 high). Based on current downside momentum, fall from 1.0146 might be a medium term down trend itself. Sustained break of 61.8% retracement of 0.8756 to 1.0146 at 0.9287 will pave the way to 0.8756. In any case, risk will stay on the downside as long as 0.9545 resistance holds.
USD/JPY Daily Outlook
Daily Pivots: (S1) 132.90; (P) 133.25; (R1) 133.86; More...
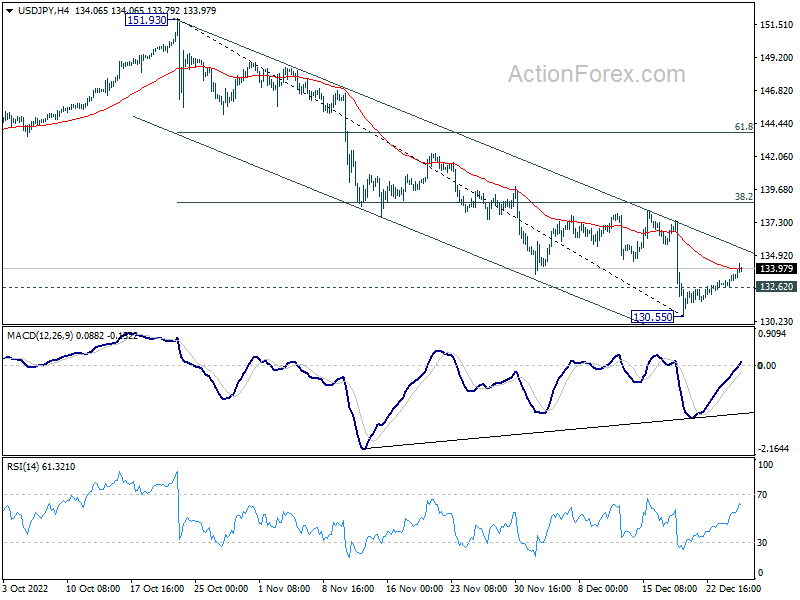
A short term bottom should be formed at 130.55 in USD/JPY, on bullish convergence condition in 4 hour MACD. Intraday bias is back on the upside. Further rise should be seen back to 38.2% retracement of 151.93 to 130.55 at 138.71 first. On the downside, however, break of 132.62 minor support will bring retest of 130.55 instead.
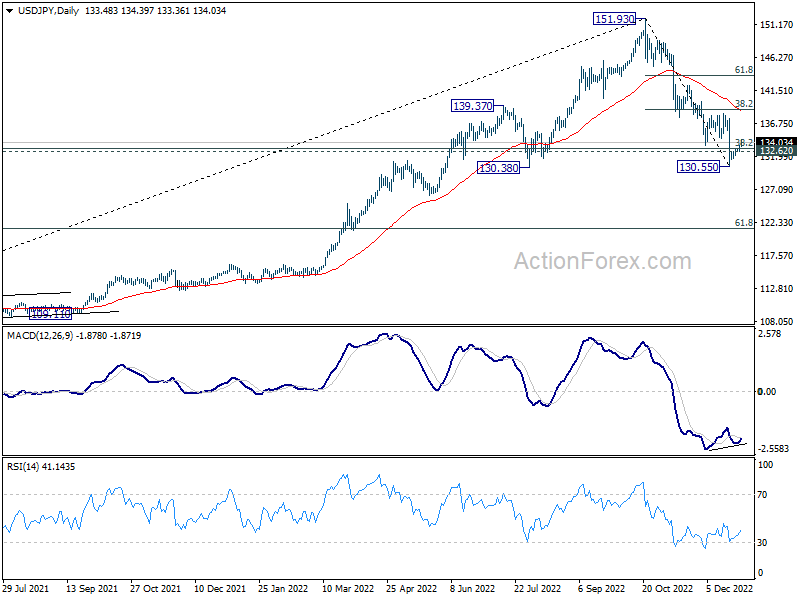
In the bigger picture, price actions from 151.93 medium term could be just a corrective pattern to up trend from 102.58 (2021 low). Strong support from 38.2% retracement of 102.58 to 151.93 at 133.07 and 55 week EMA (now at 131.76) will set the range for such corrective pattern. However, sustained break of 55 week EMA will pave the way to 61.8% retracement at 121.43.
AUD/USD Daily Report
Daily Pivots: (S1) 0.6712; (P) 0.6744; (R1) 0.6766; More...
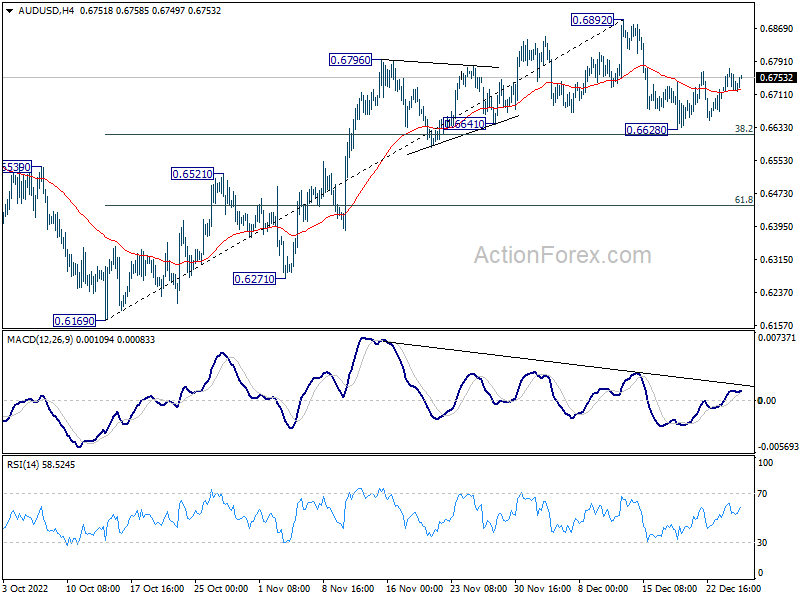
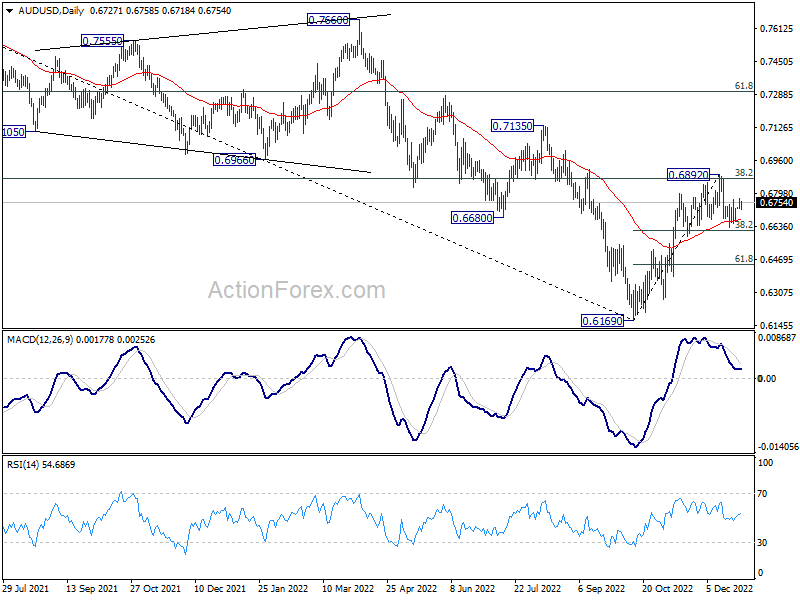
Intraday bias in AUD/USD stays neutral at this point. On the downside, sustained break of 38.2% retracement of 0.6169 to 0.6892 at 0.6616 will indicate rejection by 0.66871 fibonacci level. Deeper fall should then be seen to 61.8% retracement at 0.6445. On the upside, break of 0.6892 will resume the rally from 0.6169.
In the bigger picture, it's still unsure if price actions from 0.6169 medium term bottom are developing into a corrective pattern or trend reversal. Rejection by 38.2% retracement of 0.8006 to 0.6169 at 0.6871 will maintain medium term bearishness for another fall through 0.6169 at a later stage. However, firm break of 0.6871, and sustained trading above 55 week EMA (now at 0.6900) will raise the chance of the start of a bullish up trend.
USD/CAD Daily Outlook
Daily Pivots: (S1) 1.3466; (P) 1.3542; (R1) 1.3599; More....
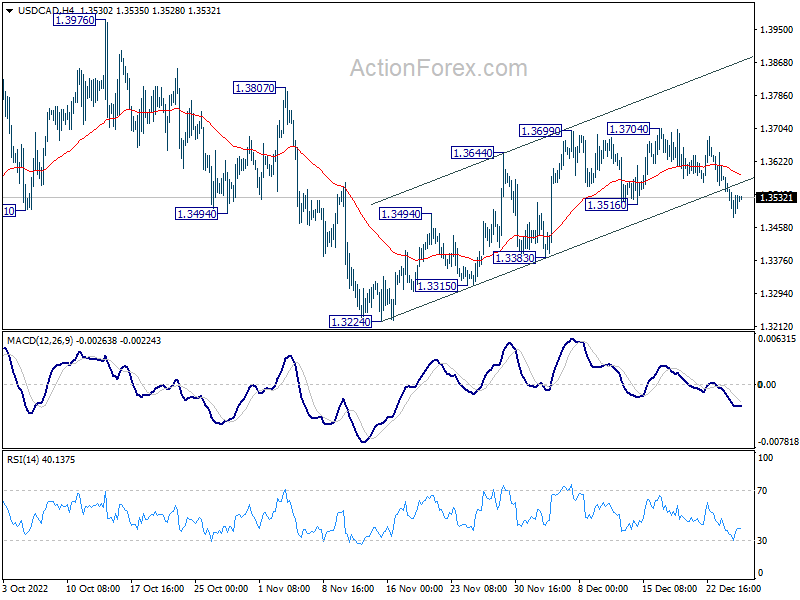
Intraday bias in USD/CAD remains mildly on the downside. Corrective recovery from 1.3224 might have finished at 1.3704 already. Deeper fall would be seen to 1.3383 support first. Break there will target 1.3222/3 key support zone again. On the upside, break of 1.3704 will resume the rebound towards 1.3976 high instead.
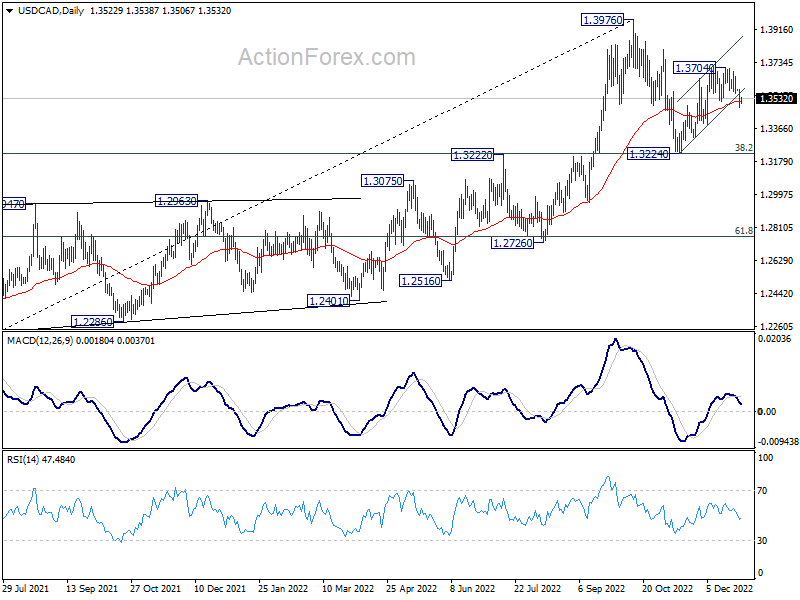
In the bigger picture, as long as 1.3222 cluster support (38.2% retracement of 1.2005 to 1.3976 at 1.3223) holds, larger up trend from 1.2005 (2021 low) is still expected to resume through 1.3976 high at a later stage. However, firm break of 1.3222/3 will indicate that the trend might have reversed. Deeper fall would be seen to next cluster support at 1.2726 (61.8% retracement at 1.2758).
EUR/CHF Daily Outlook
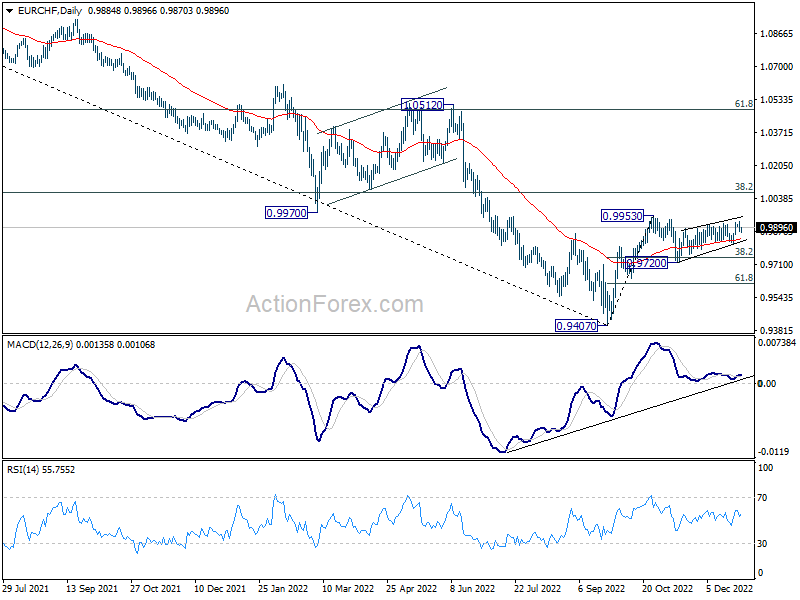
Daily Pivots: (S1) 0.9868; (P) 0.9896; (R1) 0.9917; More....
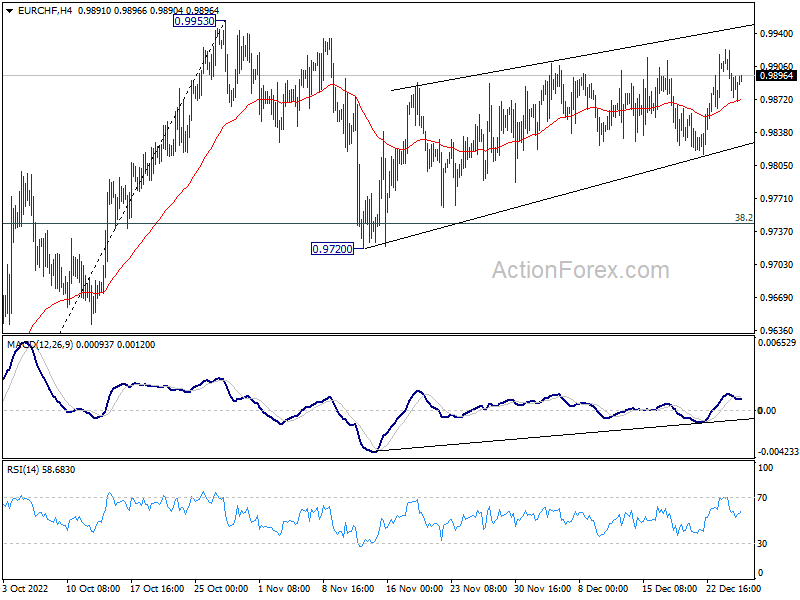
EUR/CHF's consolidation from 0.9953 is still in progress and intraday bias stays neutral. On the upside, firm break of 0.9953 resistance will resume larger rally from 0.9407 to 1.0072 fibonacci level. However, break of 0.9720 will extend the decline from 0.9953 to 61.8% retracement of 0.8407 to 0.9953 at 0.9616.
In the bigger picture, as long as 38.2% retracement of 1.1149 to 0.9407 at 1.0072 holds, price actions from 0.9407 medium term bottom will be treated as a corrective pattern. That is, long term down trend would resume through this low at a later stage. Nevertheless, firm break of 1.0072 will also have 55 week EMA (now at 1.0053) taken out. That would be an initial sign of long term bullish reversal.
EUR/GBP Daily Outlook
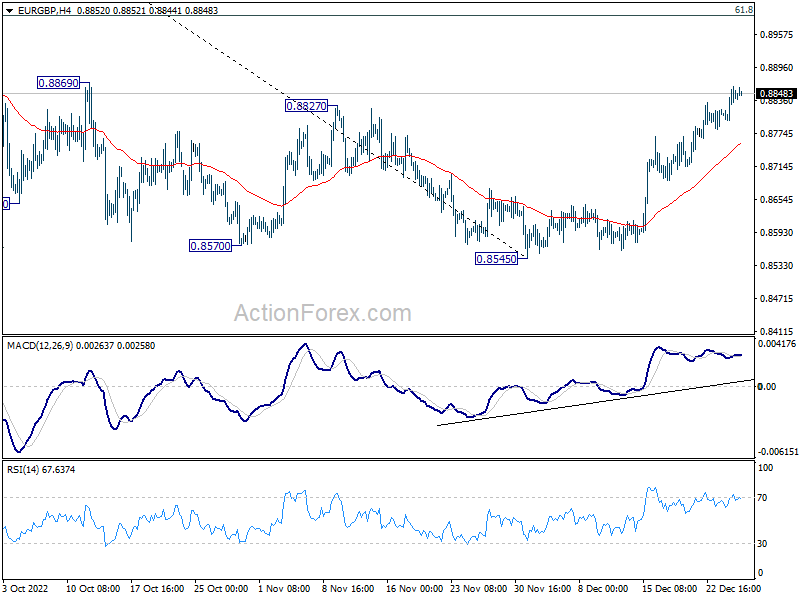
Daily Pivots: (S1) 0.8808; (P) 0.8835; (R1) 0.8870; More...
Intraday bias in EUR/GBP remains on the upside at this point. Fall from 0.9267 might have completed at 0.8545 already. Further rally would be seen to 61.8% retracement of 0.9276 to 0.8545 at 0.8997 and possibly above. For now, this will remain the favored case as long as 4 hour 55 EMA (now at 0.8759) holds.
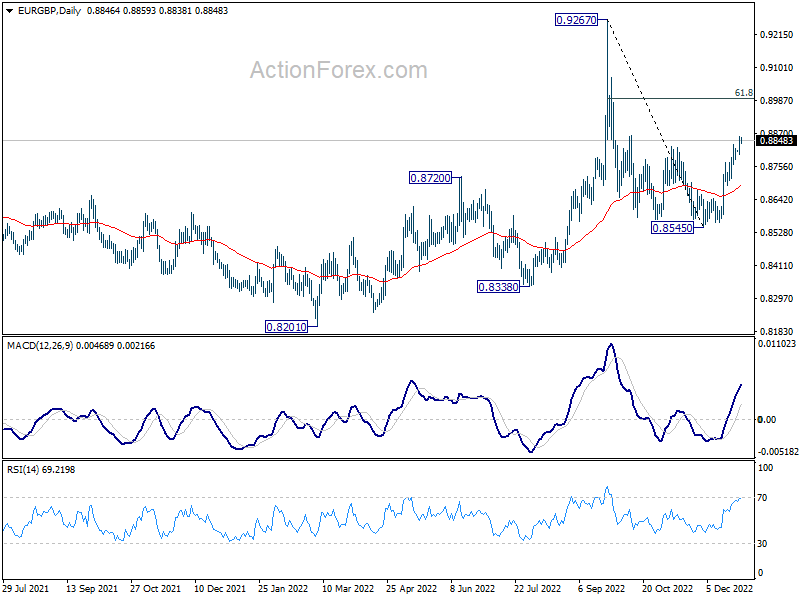
In the bigger picture, fall from 0.9267 is seen as a down leg inside long term range pattern. Deeper fall could be seen towards 0.8201/8338 support zone. But strong support should be seen there to bring reversal. Nevertheless, firm break of 0.8827 resistance will turn favor to the case that such decline is merely a correction in the up trend from 0.8201. That is, further rally would be seen at a later stage through 0.9267.
EUR/AUD Daily Outlook
Daily Pivots: (S1) 1.5750; (P) 1.5785; (R1) 1.5832; More...
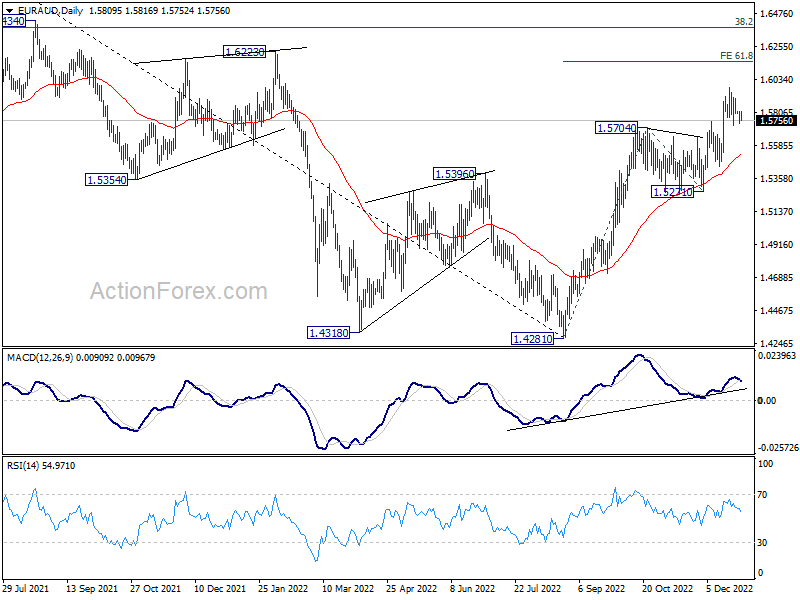
EUR/AUD is still bounded in consolidation from 1.5976 and intraday bias stays neutral. Further rally will remain in favor as long as 1.5441 support holds. Break of 1.5976 will resume larger rise from 1.4281 to 61.8% projection of 1.4281 to 1.5704 from 1.5271 at 1.6150.
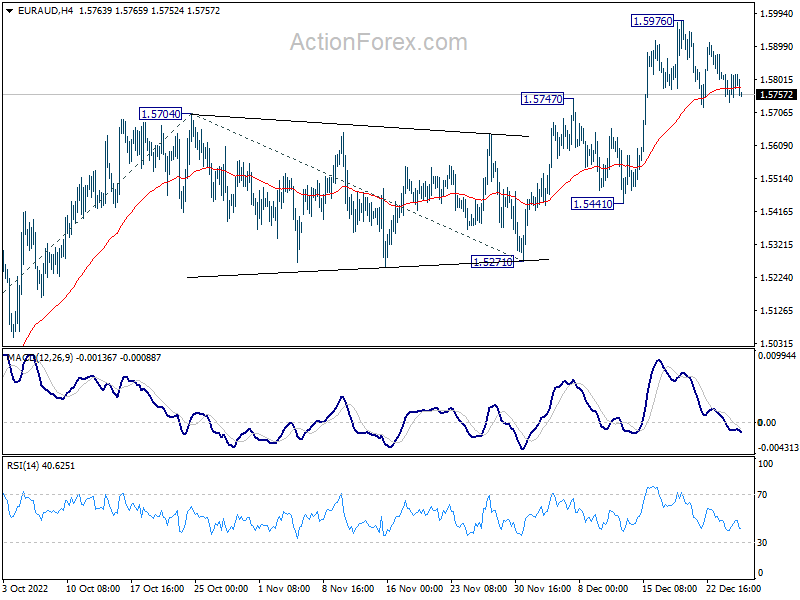
In the bigger picture, strong support from 55 day and 55 week EMA affirms underlying bullishness. As long as 1.5271 support holds, rise from 1.4281 medium term bottom is expected to continue to 1.6434 key resistance next. Decisive break there should confirm medium term bullish trend reversal.
GBP/JPY Daily Outlook
Daily Pivots: (S1) 160.22; (P) 160.58; (R1) 160.97; More...
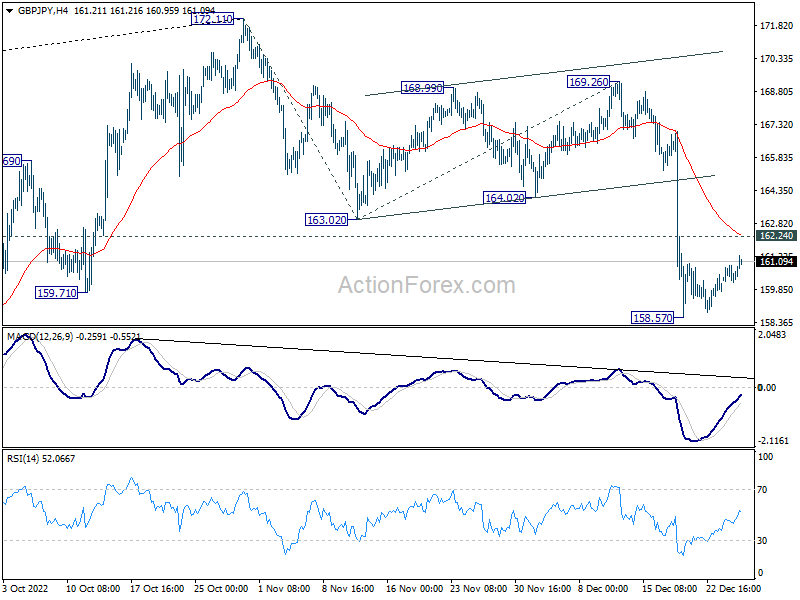
Intraday bias in GBP/JPY remains neutral and outlook is unchanged. Further decline is expected as long as 162.24. Break of 158.57 will target 161.8% projection of 172.11 to 163.02 from 169.26 at 154.55 next. However, break of 162.24 will turn bias to the upside for stronger rebound.
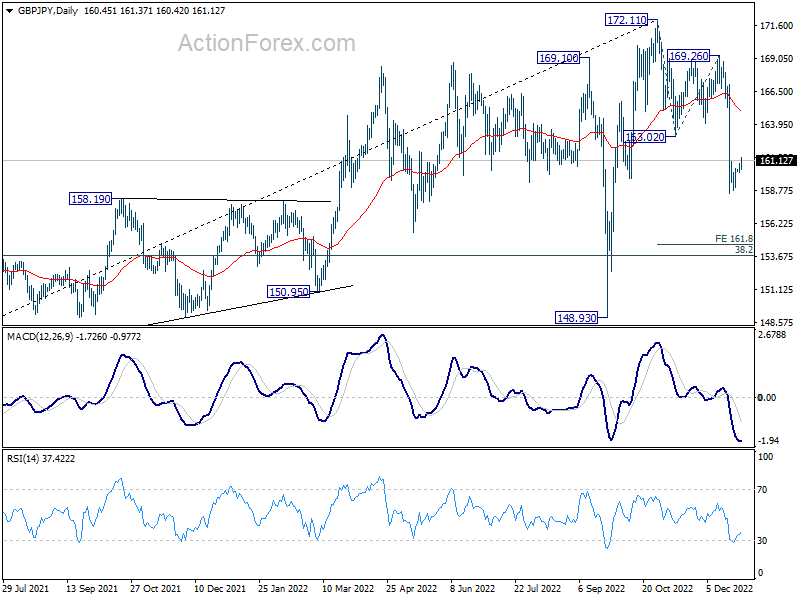
In the bigger picture, sustained break of 55 week EMA (now at 161.26) will confirm medium term topping at 172.11, on bearish divergence condition in weekly MACD. Fall from 172.11 should be correcting whole up trend from 123.94 (2020 low). Deeper decline should be seen to 38.2% retracement of 123.94 to 172.11 at 153.70 and possibly below. This will now remain the favored case as long as 55 day EMA (now at 166.11) holds.
Technical Outlook and Review
USD/JPY:
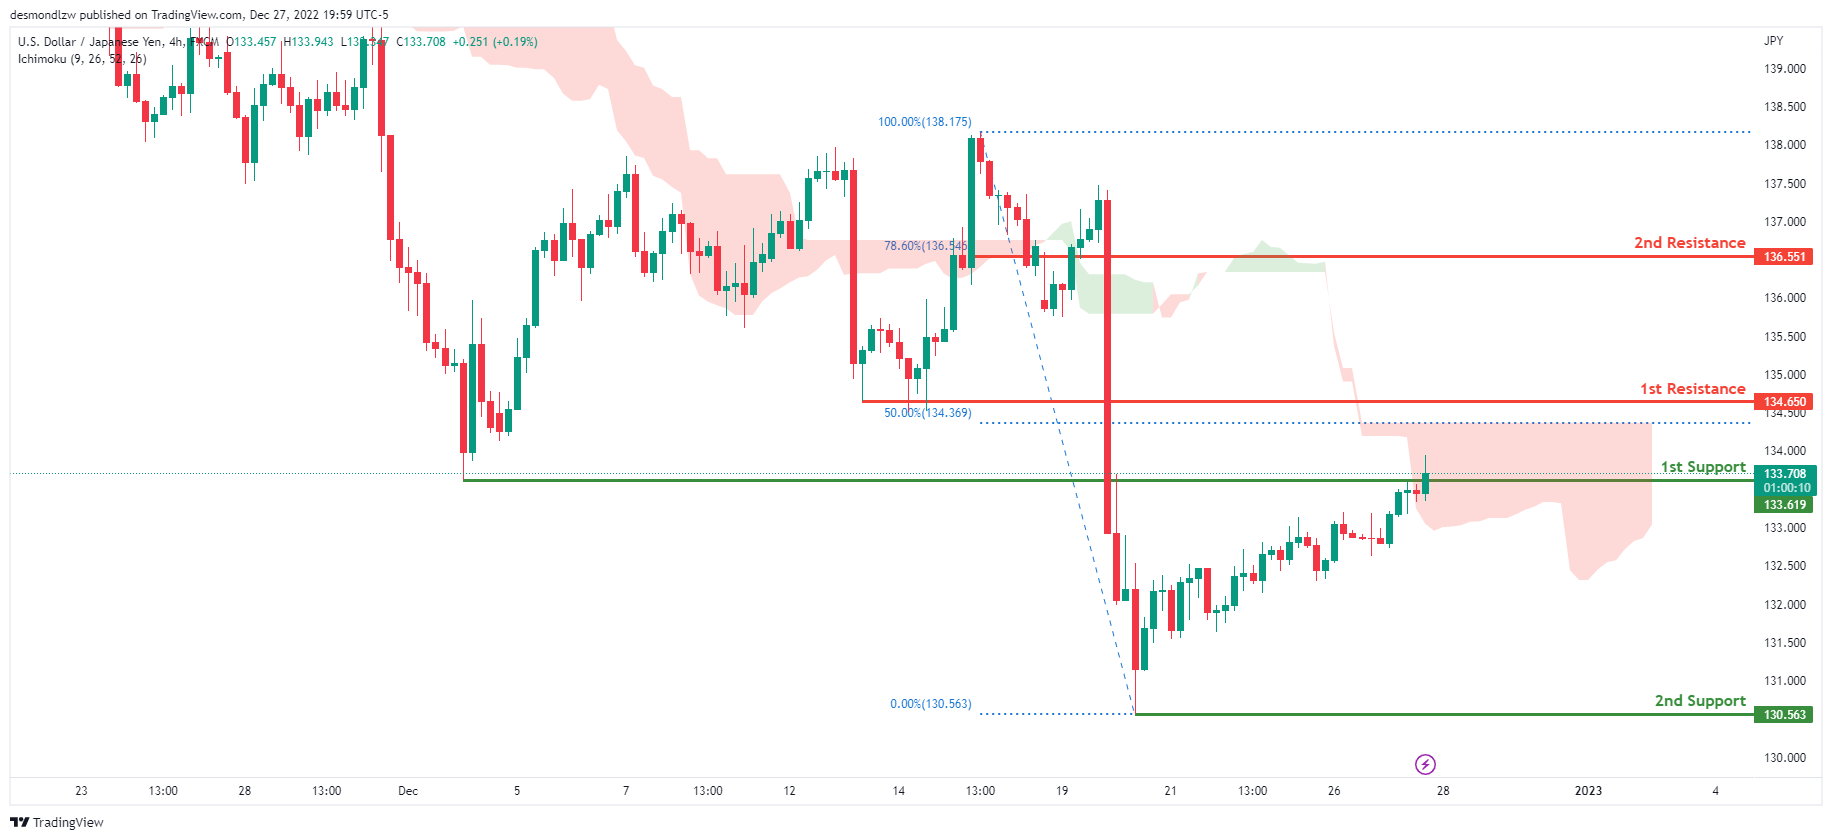
Looking at the H4 chart, my overall bias for USDJPY is bearish due to the current price being below the Ichimoku cloud, indicating a bearish market. If this bearish momentum continues, expect price to possibly break the 1st support at 133.619, where the previous swing low is located, before heading towards the 2nd support at 130.563, where the previous swing low is. In an alternate scenario, price could possibly head back up towards the 1st resistance level at 134.650 where the 50% Fibonacci line is.
Areas of consideration:
- H4 time frame, 1st resistance at 134.650
- H4 time frame, 1st support at 133.619
- H4 time frame, 2nd support at 130.563
DXY:
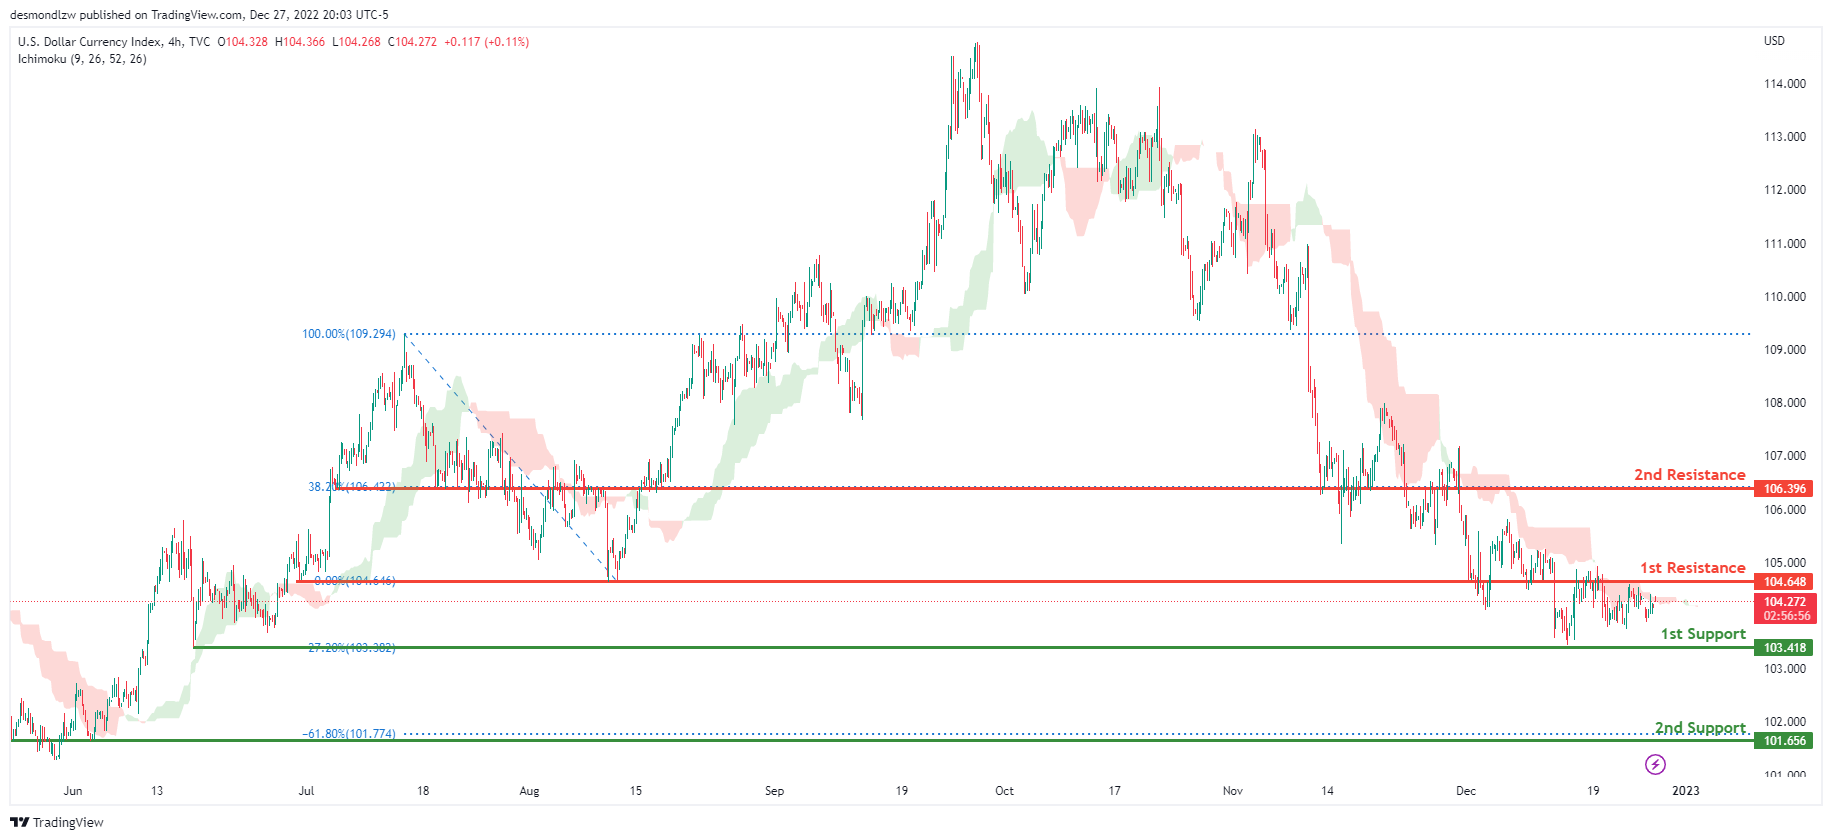
On the H4 chart, the overall bias for DXY is bearish. To add confluence to this, the price is below the Ichimoku cloud which indicates a bearish market. If this bearish momentum continues, expect the price to possibly break the 1st support line at 103.418, where the -27.2% Fibonacci expansion line is before heading towards the 2nd support at 101.656, where the -61.8% Fibonacci expansion line is. In an alternative scenario, price could head back up and break the 1st resistance line resistance at 104.648, where the previous swing low is before heading towards the 2nd resistance at 106.396, where the 38.2% Fibonacci line is.
Areas of consideration:
- H4 time frame, 1st resistance at 104.648
- H4 time frame, 1st support at 103.418
- H4 time frame, 2nd support at 101.656
EUR/USD:
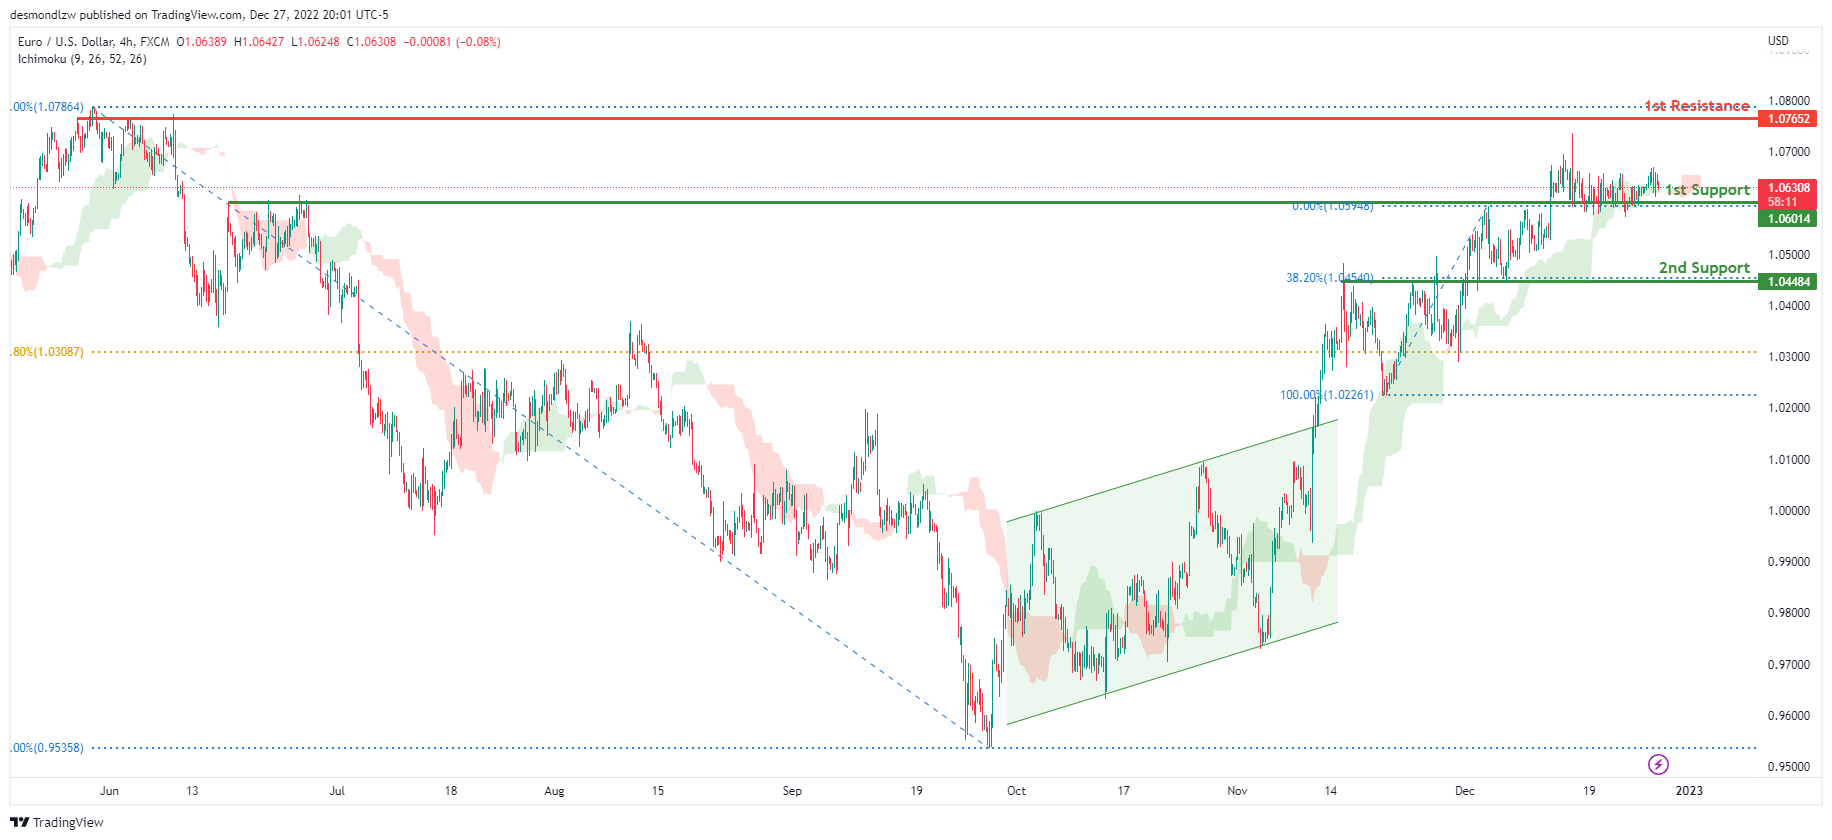
Looking at the H4 chart, my overall bias for EURUSD is bullish due to the current price being above the Ichimoku cloud, indicating a bullish market. To add confluence to this bias, price has also broken above the ascending bullish channel. If this bullish momentum continues, expect the price to possibly head towards the 1st resistance at 1.07652, where the previous swing high is. In an alternate scenario, price could possibly head back down to break the 1st support level at 1.06014, where the previous swing high and 78.6% Fibonacci line are located before heading towards the 2nd support at 1.04484, where the 38.2% Fibonacci line is.
Areas of consideration :
- H4 1st resistance at 1.07652
- H4 1st support at 1.06014
- H4 2nd support at 1.04484
GBP/USD:
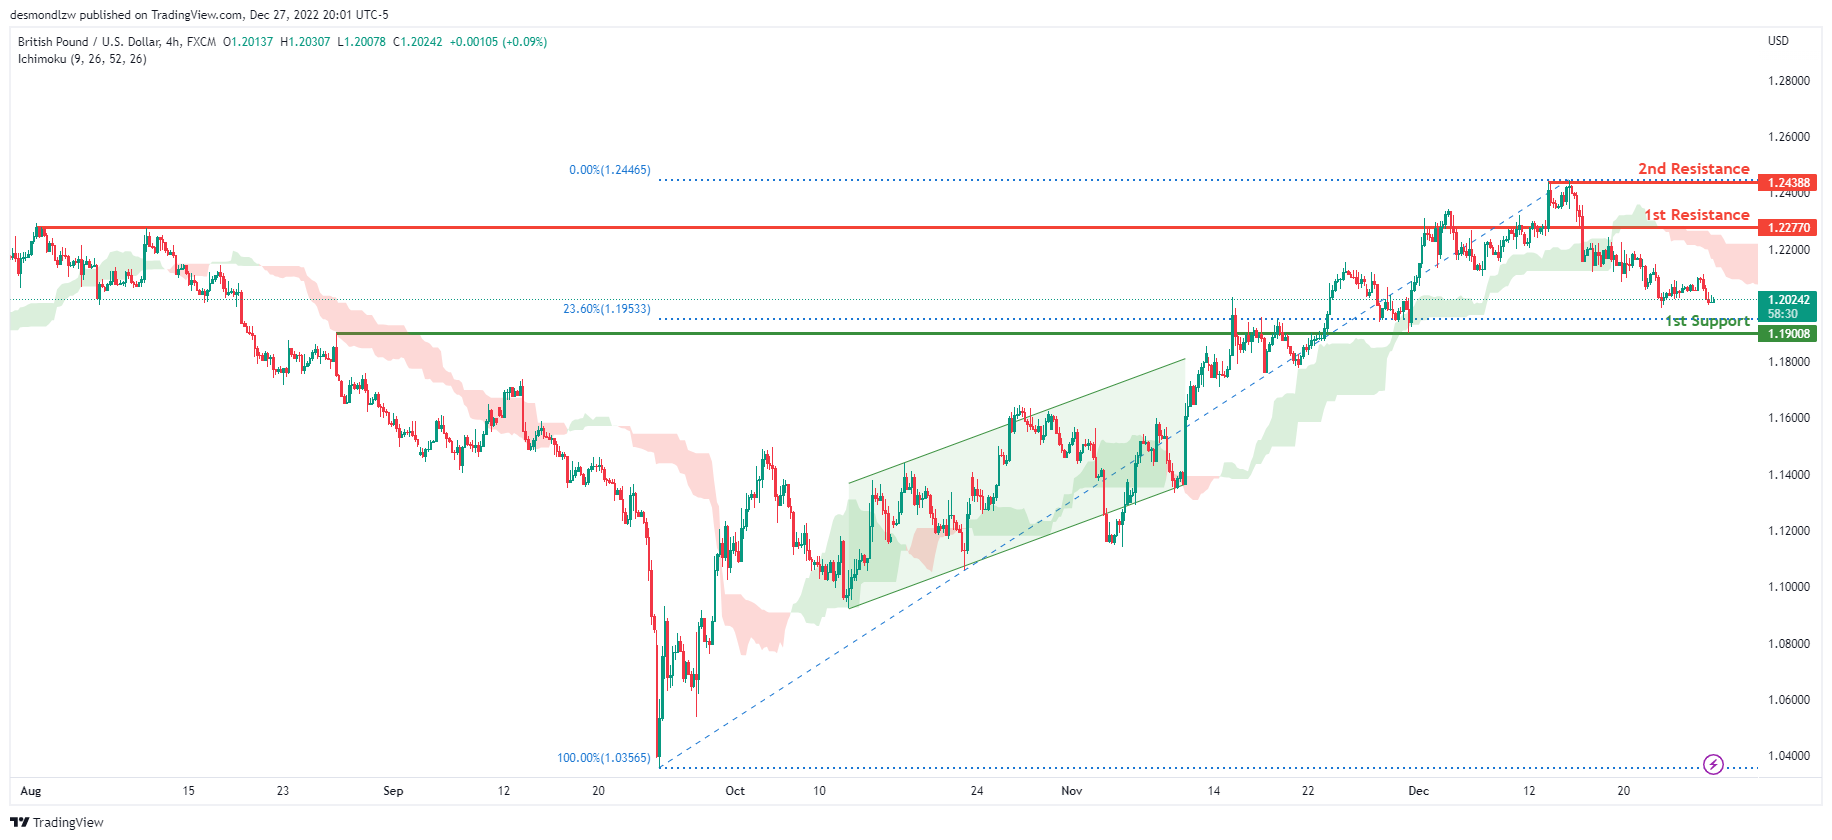
Looking at the H4 chart, my overall bias for GBPUSD is bearish due to the current price being below the Ichimoku cloud, indicating a bearish market. If this bearish momentum continues, expect price to possibly continue heading towards the 1st support at 1.19008, where the 23.6% Fibonacci line is. In an alternate scenario, price could possibly head back up to retest the 1st resistance level at 1.22770, where the previous swing high is.
Areas of consideration:
- H4 1st resistance at 1.22770
- H4 1st support at 1.19008
USD/CHF:
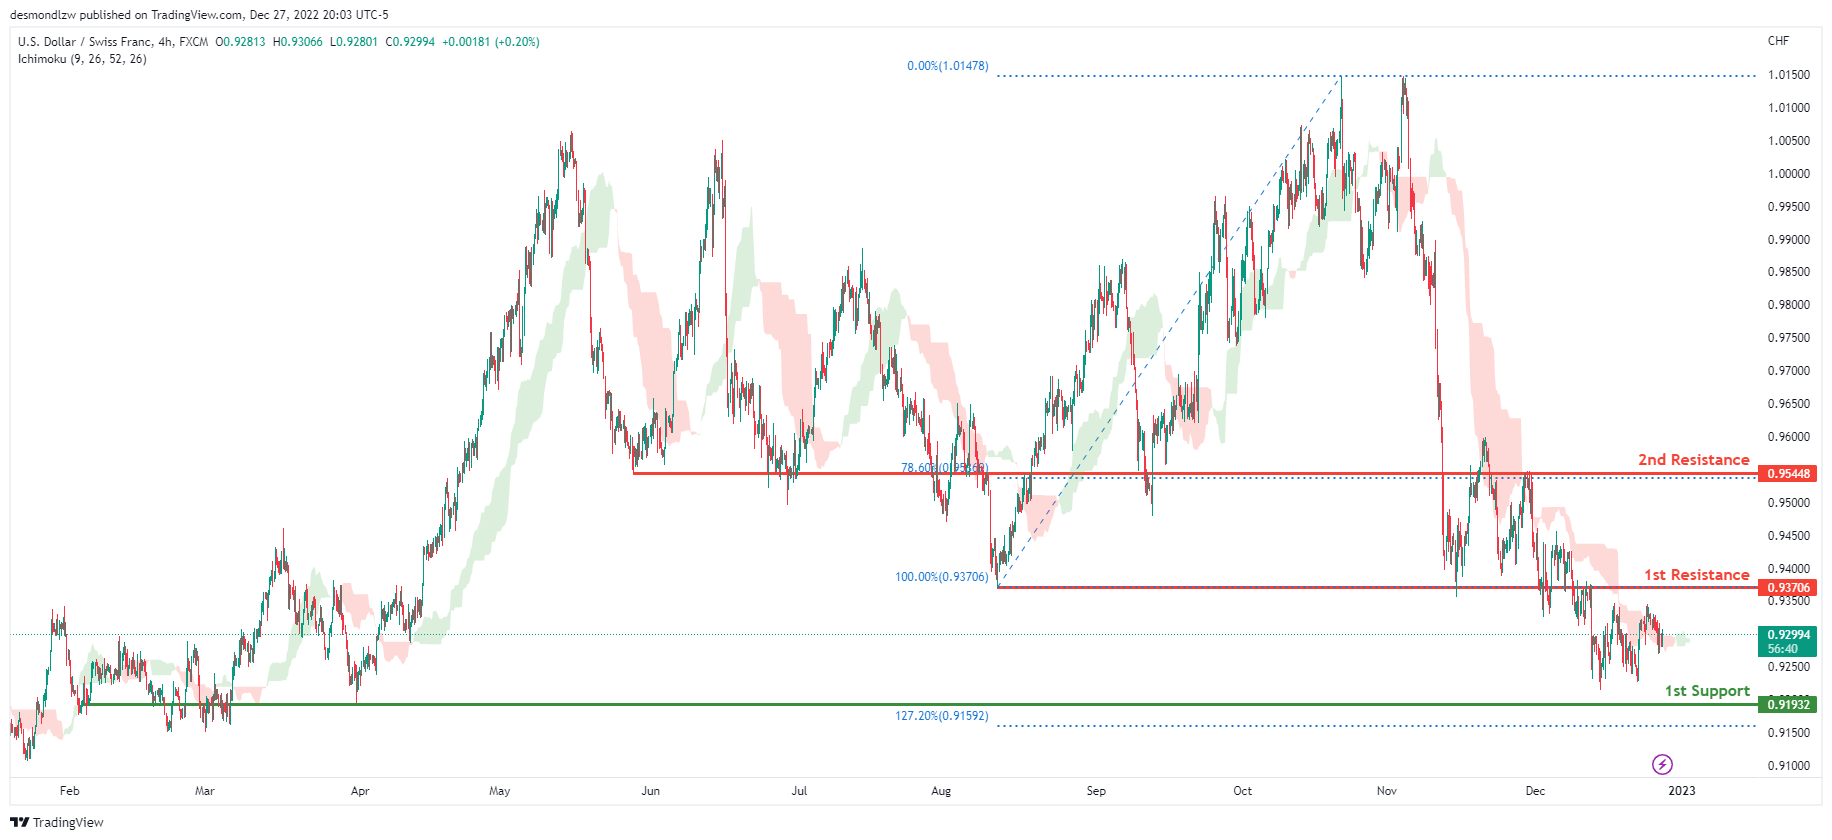
The overall bias for USDCHF on the H4 chart is bearish. In addition, the price is crossing below the Ichimoku cloud, indicating a bearish market. If the current bearish trend continues, expect the price to head back down towards the 1st support line at 0.91932, where the previous swing low and 12.72% Fibonacci extension line is . In an alternative scenario, price could possibly head up towards the 1st resistance at 0.93706, where the previous swing low is .
Areas of consideration
- H4 1st support at 0.91932
- H4 1st resistance at 0.93706
XAU/USD (GOLD):
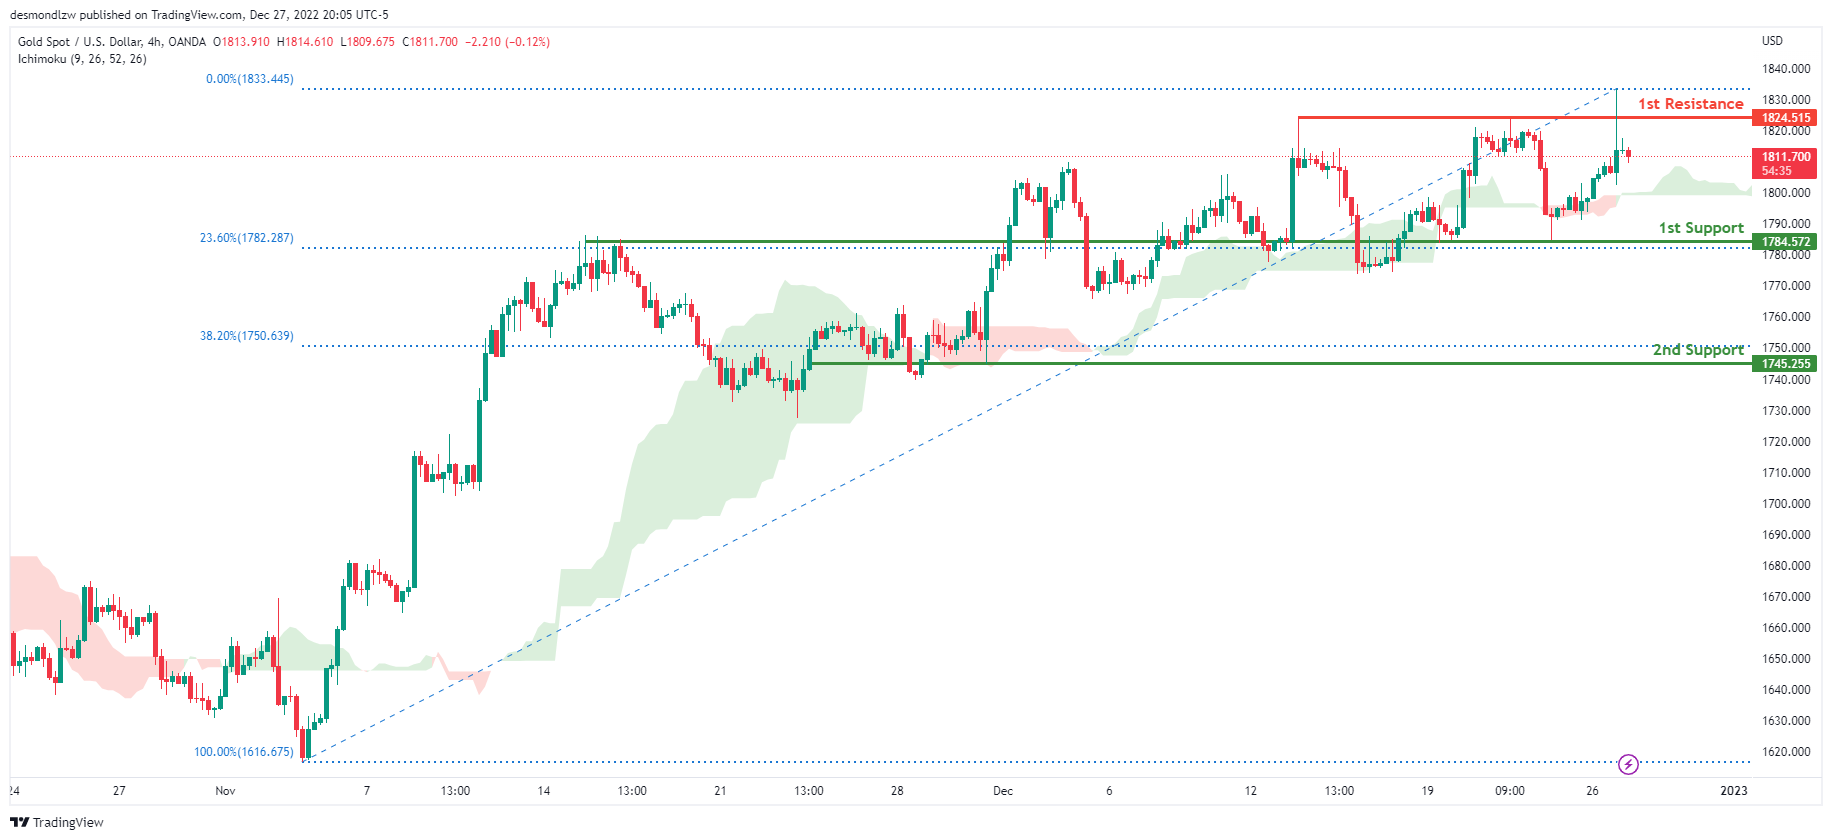
Looking at the H4 chart, my overall bias for XAUUSD is bullish due to the current price crossing above the Ichimoku cloud, indicating a bullish market. If this bullish momentum continues, expect the price to continue heading towards the 1st resistance at 1824.515 where the recent high is. In an alternative scenario, price could possibly head back down to break the 1st support at 1784.572, where the previous high is before heading towards the 2nd support at 1745.255, where the 38.2% Fibonacci line is.
Areas of consideration:
- H4 time frame, 1st resistance at 1824.515
- H4 time frame, 1st support at 1784.572
- H4 time frame, 2nd support at 1745.255
AUD/USD:
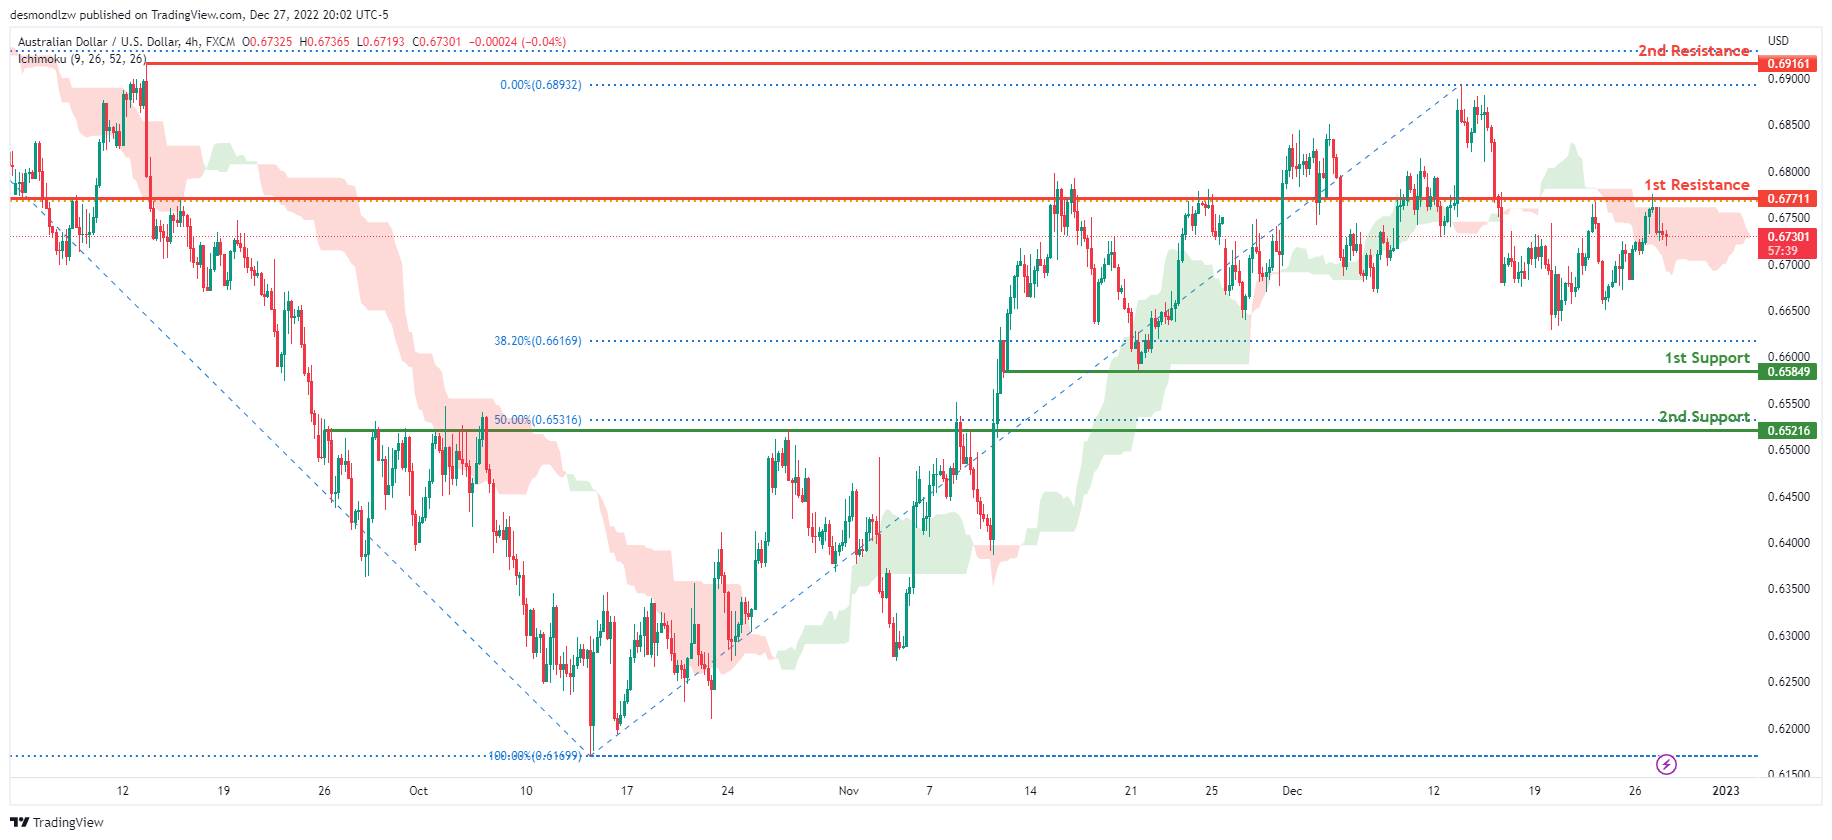
Looking at the H4 chart, my overall bias for AUDUSD is bearish due to the current price crossing below the Ichimoku cloud, indicating a bearish market. If this bearish momentum continues, expect the price to continue heading towards the 1st support at 0.65849, where the 78.6% Fibonacci line is. In an alternative scenario, price could possibly head back up towards the 1st resistance at 0.67711, where the 61.8% Fibonacci line is.
Areas of consideration
- H4, 1st resistance at 0.67711
- H4, 1st support at 0.65849
NZD/USD:
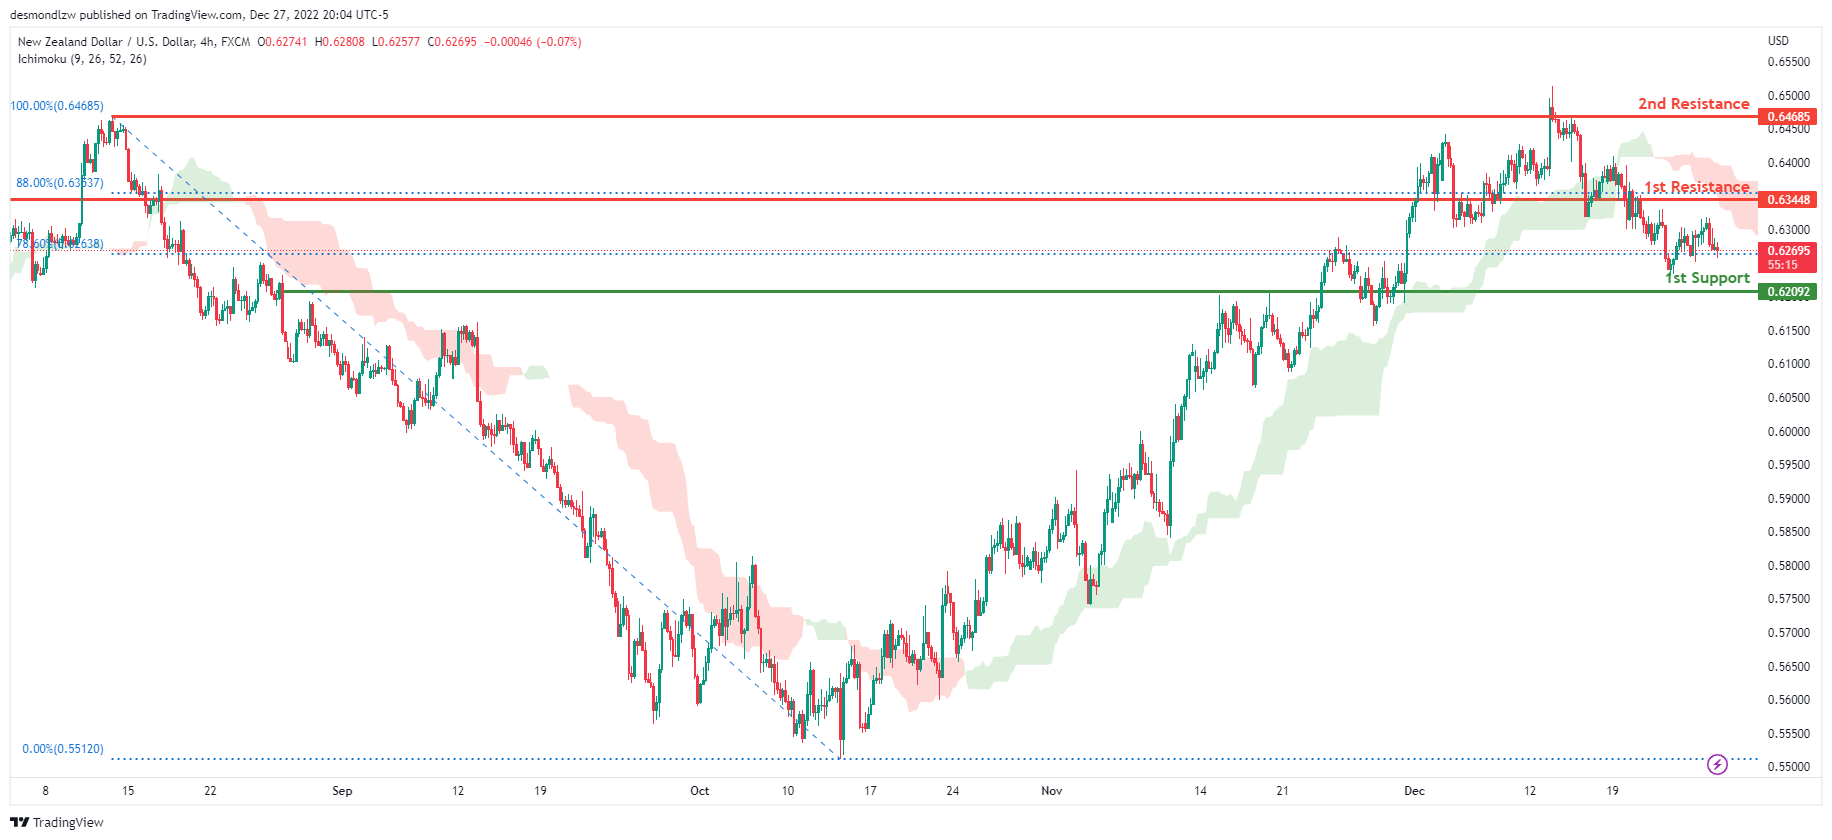
Looking at the H4 chart, my overall bias for NZDUSD is bearish due to the current price being below the Ichimoku cloud, indicating a bearish market. If this bearish momentum continues, expect price to possibly continue heading towards the 1st support at 0.62092, where the 78.6% Fibonacci line is. In an alternate scenario, price could possibly head back up towards the 1st resistance level at 0.63448, where the 88% Fibonacci line is.
Areas of consideration:
- H4 time frame, 1st resistance at 0.63448
- H4 time frame, 1st support at 0.62092
USD/CAD:
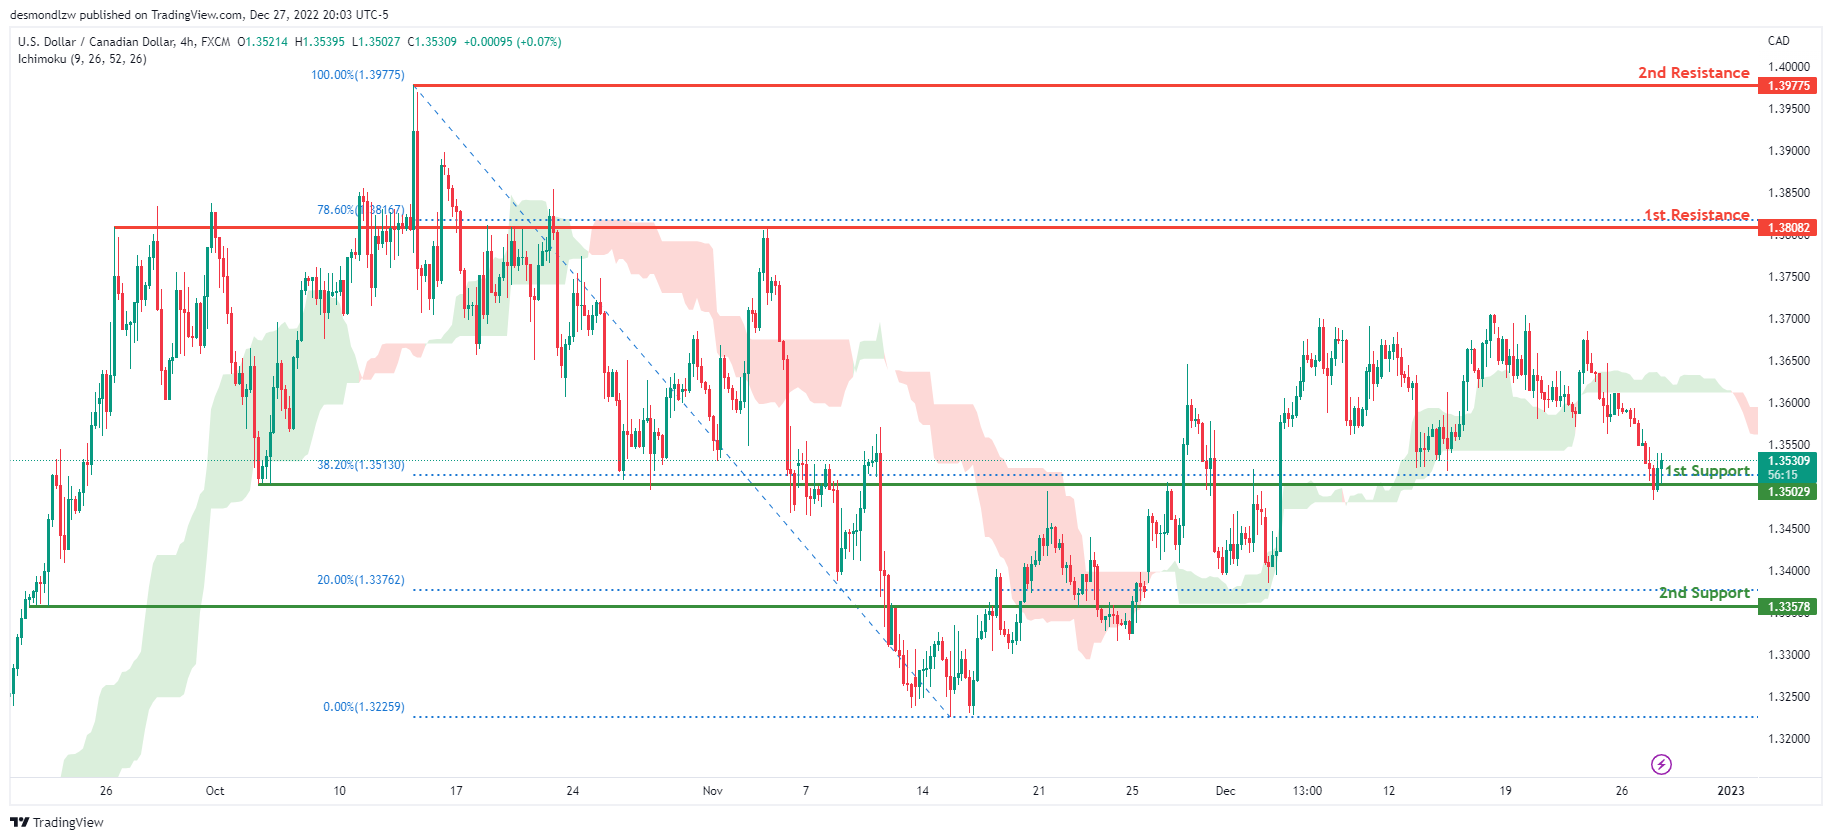
On the H4 chart, the overall bias for USDCAD is bearish. To add confluence to this, the price is below the Ichimoku cloud which indicates a bearish market. If this bearish momentum continues, expect the price to possibly break the 1st support at 1.35029, where the 38.2% Fibonacci line is, before heading towards the 2nd support at 1.33578, where the 20% Fibonacci line is. In an alternative scenario, price could head towards 1st resistance line at 1.38082, where the 78.6% Fibonacci line is.
Areas of consideration:
- H4 time frame, 1st resistance at 1.38082
- H4 time frame, 2nd resistance at 1.39775
- H4 time frame, 1st support at 1.35029
- H4 time frame, 2nd support at 1.33578
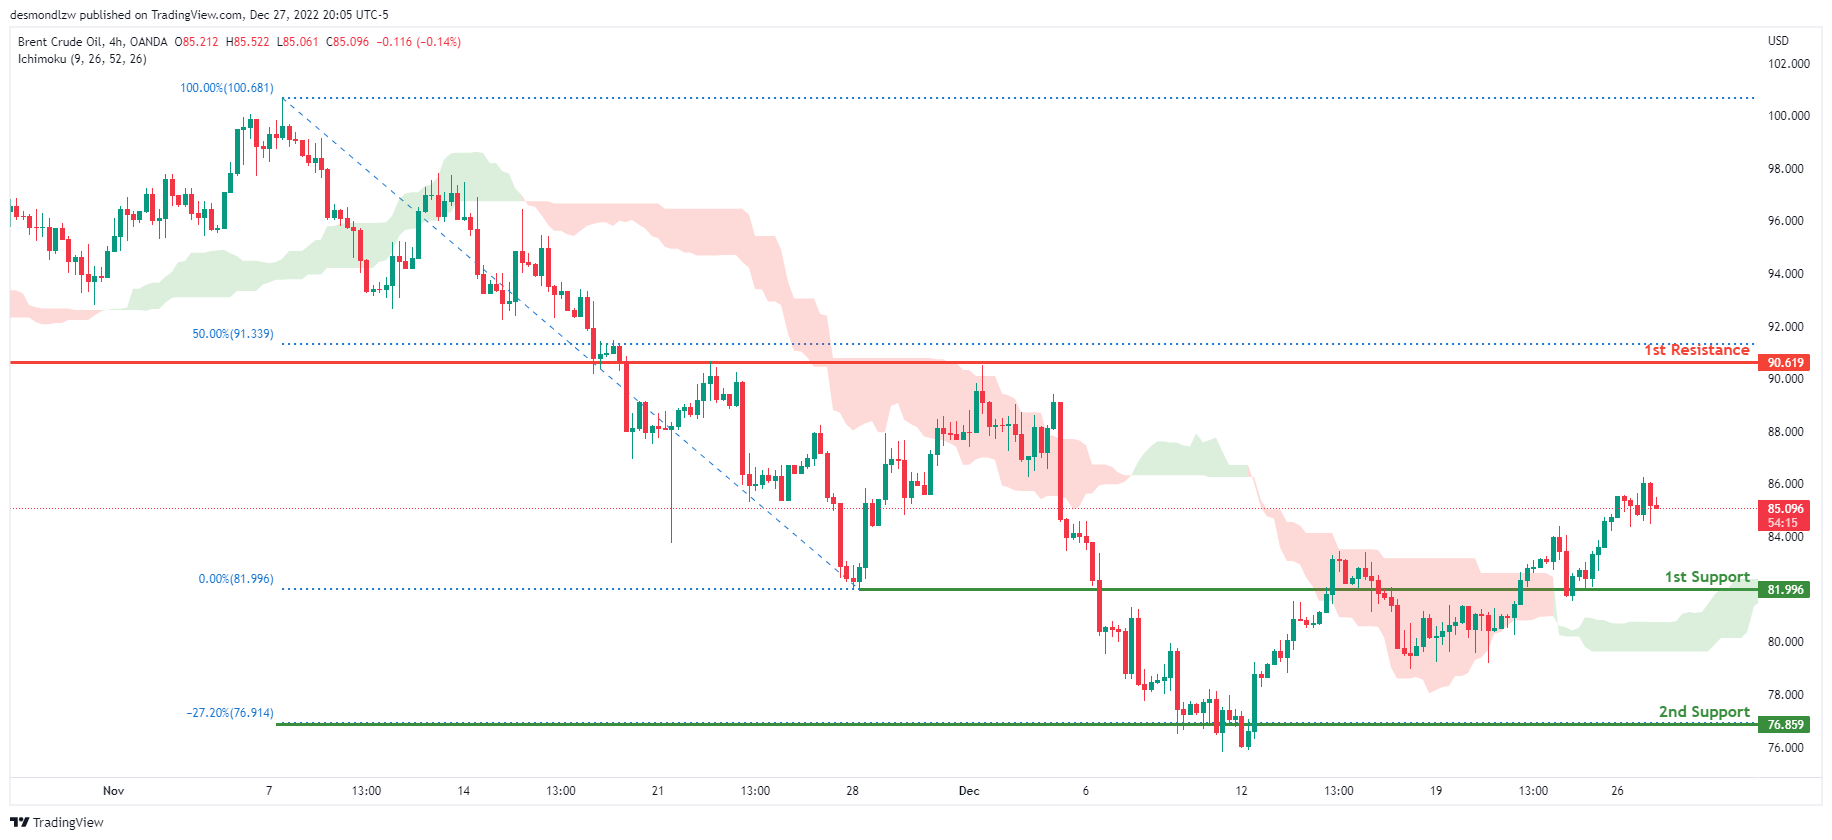
OIL:
Looking at the H4 chart, my overall bias for BCOUSD is bullish due to the current price being above the Ichimoku cloud, indicating a bullish market. If this bullish momentum continues, expect the price to possibly head towards the 1st resistance at 90.619, where the 50% Fibonacci line is. In an alternate scenario, price could possibly head back down to retest the 1st support level at 81.996, where the previous low is located.
Areas of consideration:
- H4 time frame, 1st resistance at 90.619
- H4 time frame, 1st support at 81.996
Dow Jones Industrial Average:
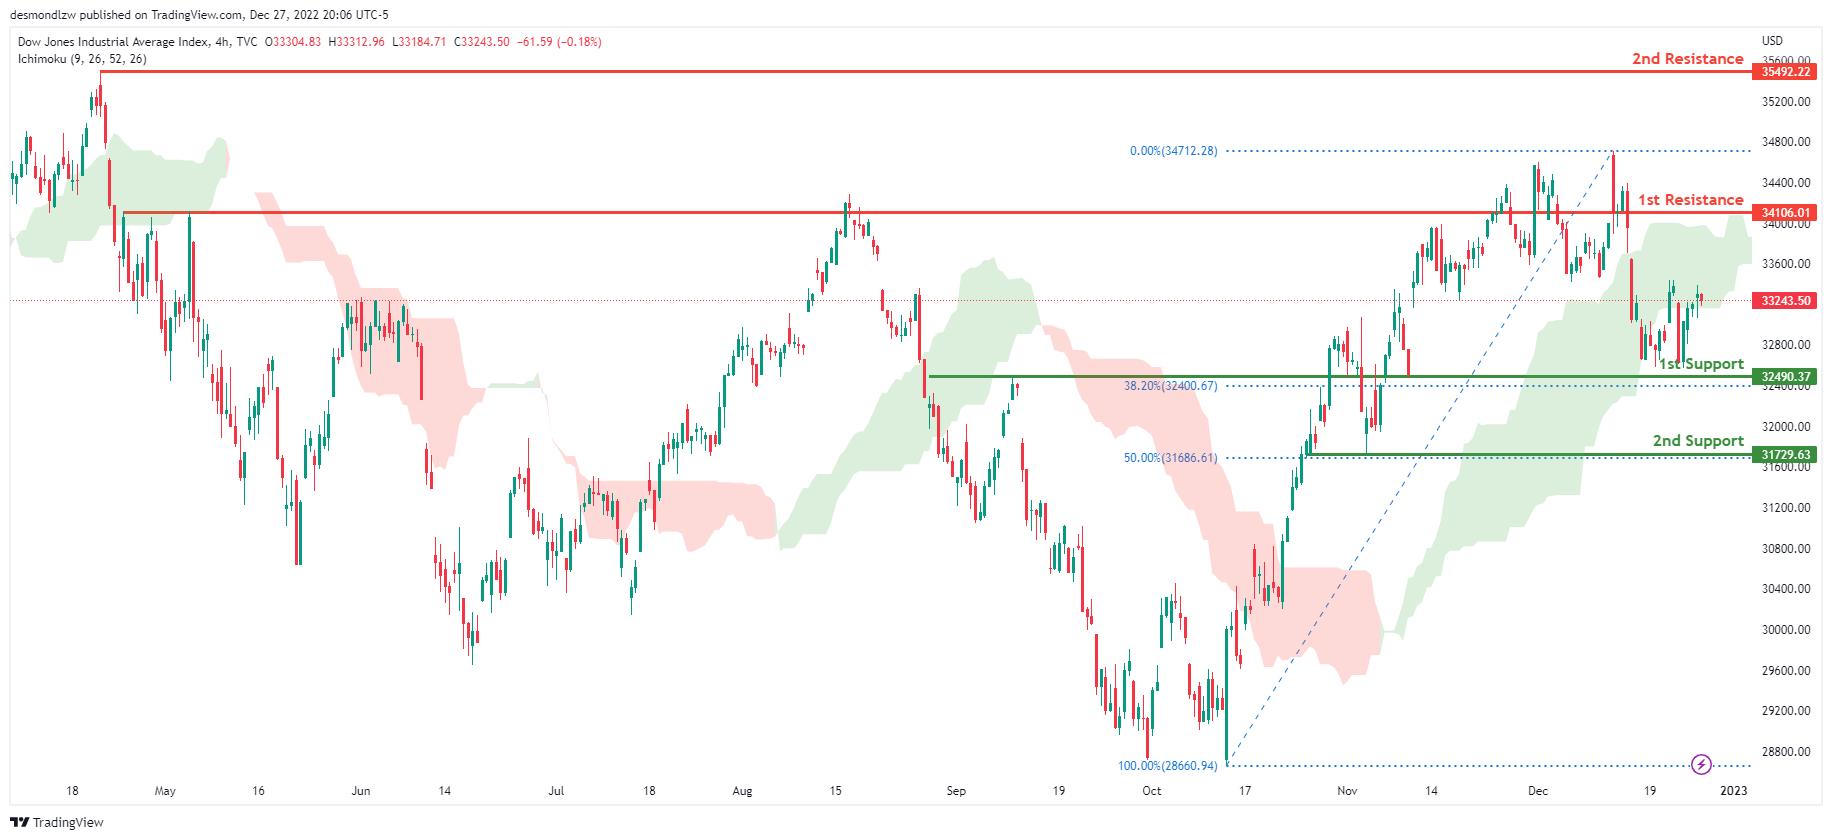
On the H4 chart, the overall bias for DJI is bearish. To add confluence to this, the price is crossing below the Ichimoku cloud which indicates a bearish market. If this bearish momentum continues, expect the price to head back down towards the 1st support at 32490.37, where the 61.8% Fibonacci line is. In an alternative scenario, price could possibly break the 1st resistance line at 34106.01, where the previous swing high is before heading towards the 2nd resistance line at 35492.22, where the previous swing high is.
Areas of consideration:
- H4 time frame, 1st support at 32490.37
- H4 time frame, 1st Resistance at 34106.01
- H4 time frame, 2nd Resistance at 35492.22
DAX:
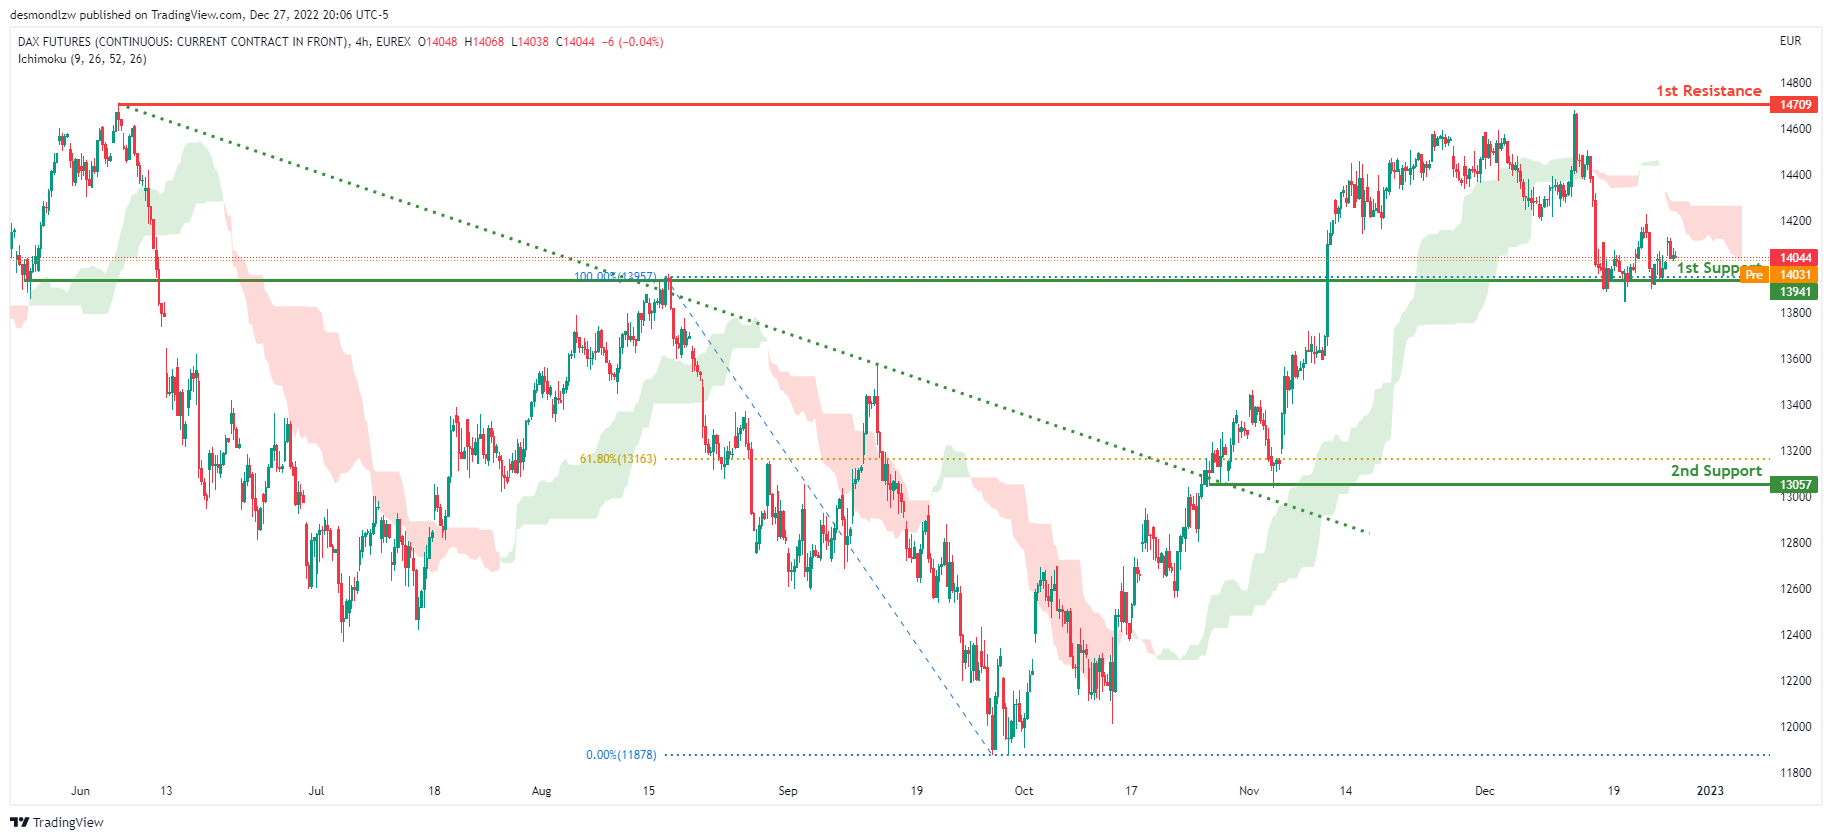
Looking at the H4 chart, my overall bias for DAX is bearish due to the current price being below the Ichimoku cloud, indicating a bearish market. If this bearish momentum continues, expect price to break the 1st support at 13941 where the previous swing high is before heading towards the 2nd support at 13057, where the 61.8% Fibonacci line is. In an alternative scenario, price could possibly head back up to retest the 1st resistance at 14709, where the previous swing high is.
Areas of consideration:
- H4 time frame, 1st resistance is at 14709
- H4 time frame, 1st support is at 13941
- H4 time frame, 2nd support is at 13057
ETHUSD:
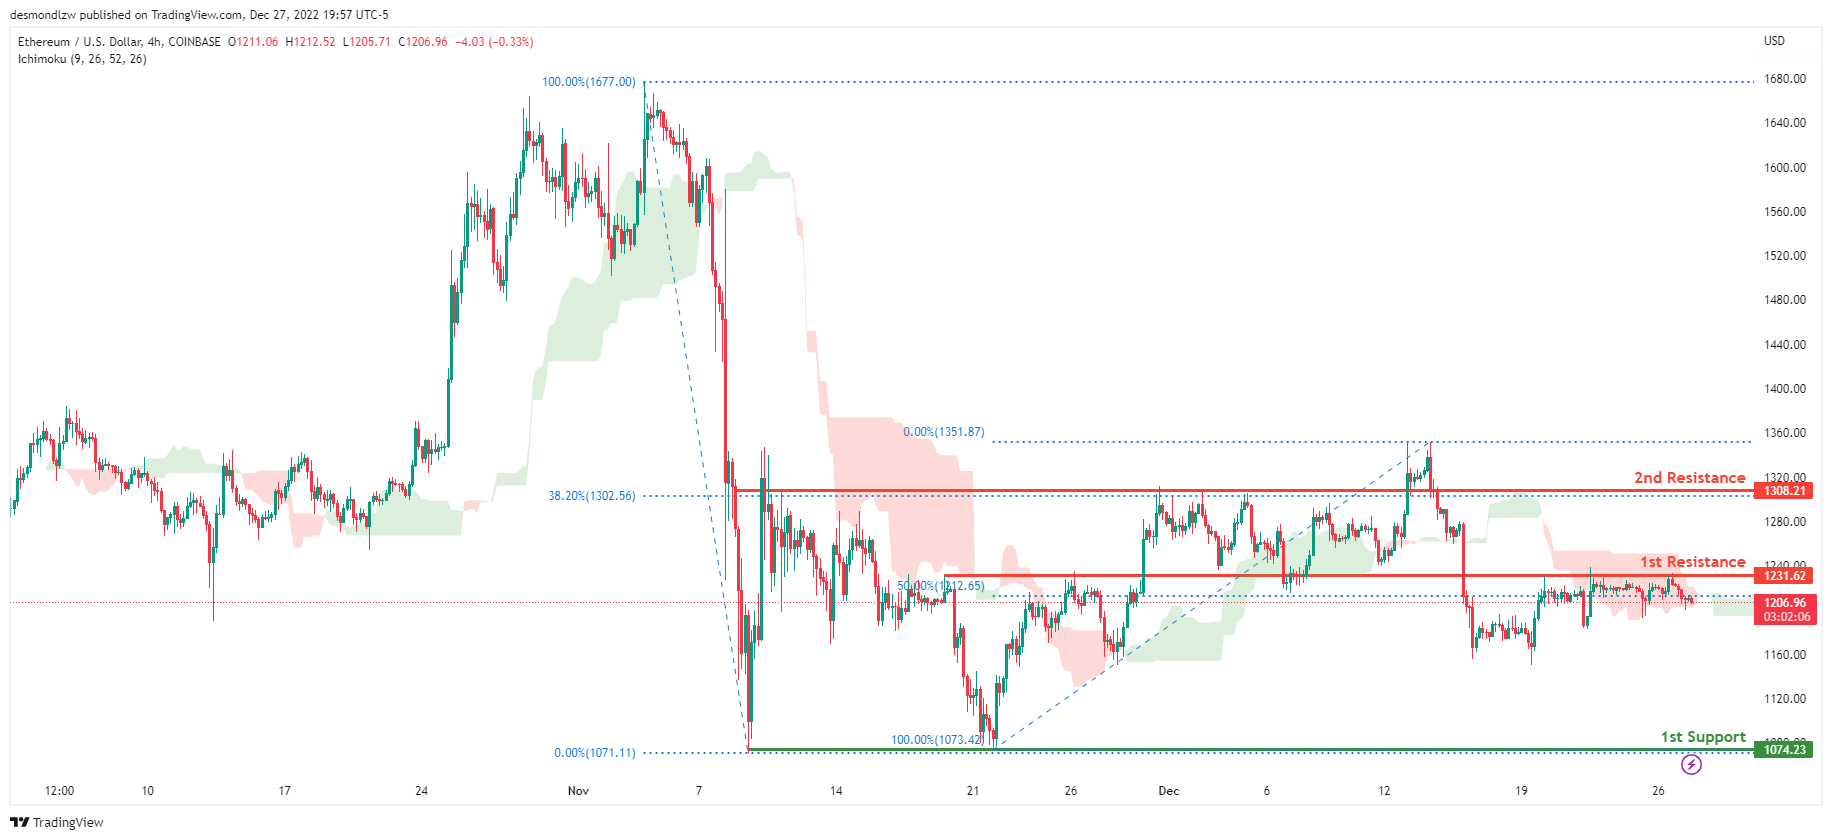
Looking at the H4 chart, my overall bias for ETHUSD is bearish due to the current price crossing below the Ichimoku cloud, indicating a bearish market. If this bearish momentum continues, expect price to head towards the 1st support at 1074.23, where the previous swing low is. In an alternative scenario, price could head back up to break the 1st resistance at 1231.62, where the 50% Fibonacci line is, before heading towards the 2nd resistance at 1308.21, where the 38.2% Fibonacci line is.
Areas of consideration:
- H4 time frame, 1st resistance of 1231.62
- H4 time frame, 2nd resistance of 1308.21
- H4 time frame, 1st support at 1074.23
BTCUSD:
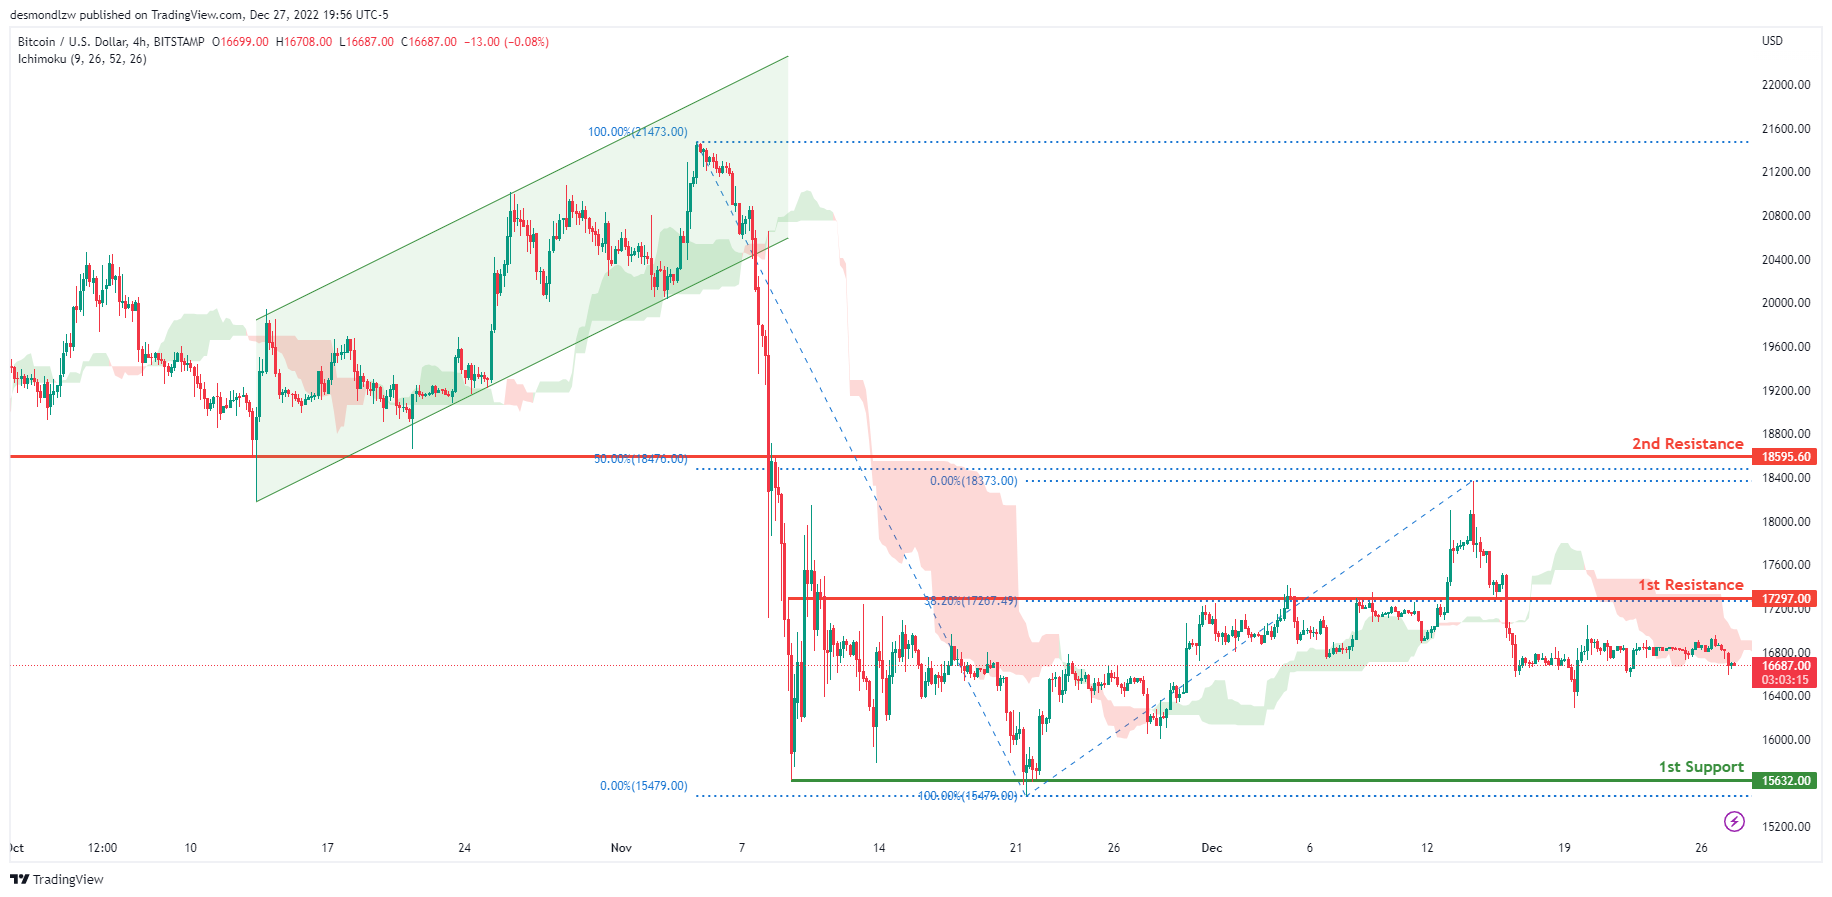
Looking at the H4 chart, my overall bias for BTCUSD is bearish due to the current price crossing below the Ichimoku cloud, indicating a bearish market. If this bearish momentum continues, expect price to possibly continue heading towards the 1st support at 15632.00, where the previous swing low is. In an alternative scenario, price could possibly head up towards the 1st resistance at 17297.00, where the 38.2% Fibonacci line is.
Areas of consideration:
- H4 time frame, 1st resistance 17297.00
- H4 time frame, 1st support at 15632.00
S&P 500:
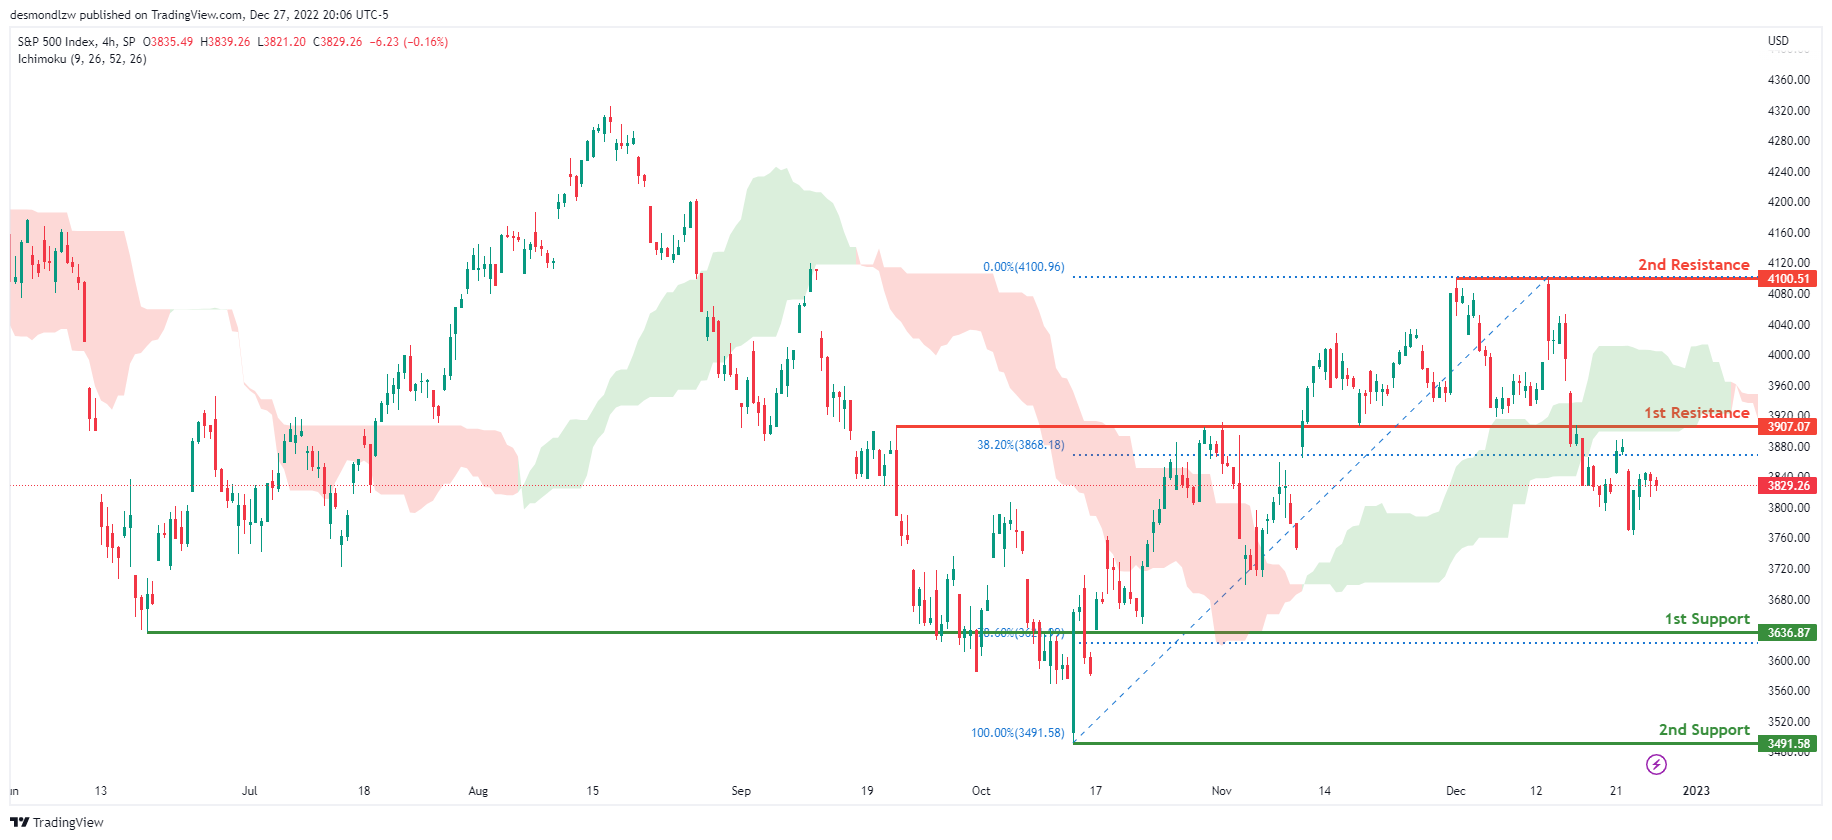
Looking at the H4 chart, my overall bias for S&P500 is bearish due to the current price being below the Ichimoku cloud, indicating a bearish market. If this bearish momentum continues, expect the price to continue heading towards the 1st support at 3636.87, where the 78.6% Fibonacci line is. In an alternative scenario, price could possibly head back up to retest the 1st resistance at 3907.07, where the 38.2% Fibonacci line is.
Areas of consideration:
- H4 time frame, 1st support at 3636.87
- H4 time frame, 1st resistance at 3907.07