

Sample Category Title
EUR/JPY Daily Outlook
Daily Pivots: (S1) 141.34; (P) 141.80; (R1) 142.47; More....
A short term bottom should be formed in EUR/JPY at 138.79 with current rebound. Intraday bias is back on the upside for 55 day EMA (now at 143.37). Sustained break there will argue that whole correction from 148.38 has completed with three waves down to 138.79. Further rise should then be seen back to 146.71/148.38 resistance zone. On the downside, below 141.12 will bring retest of 138.79 instead.
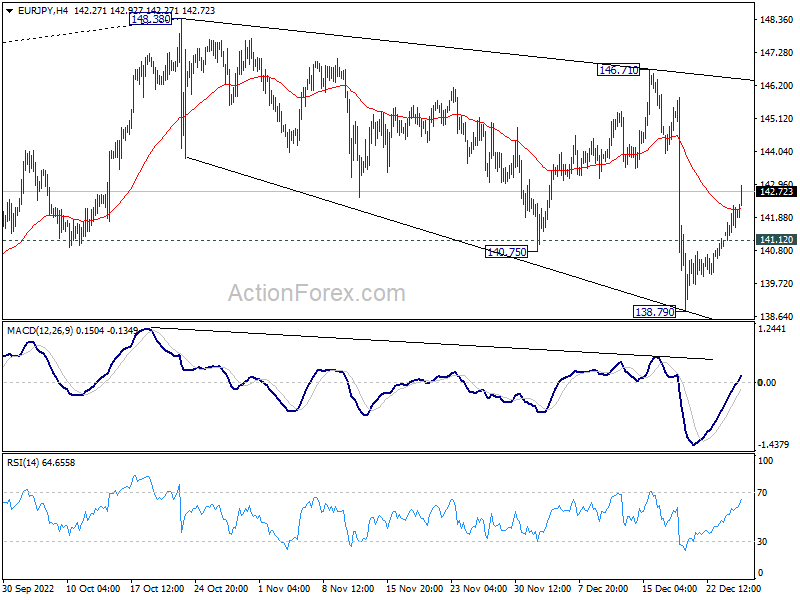
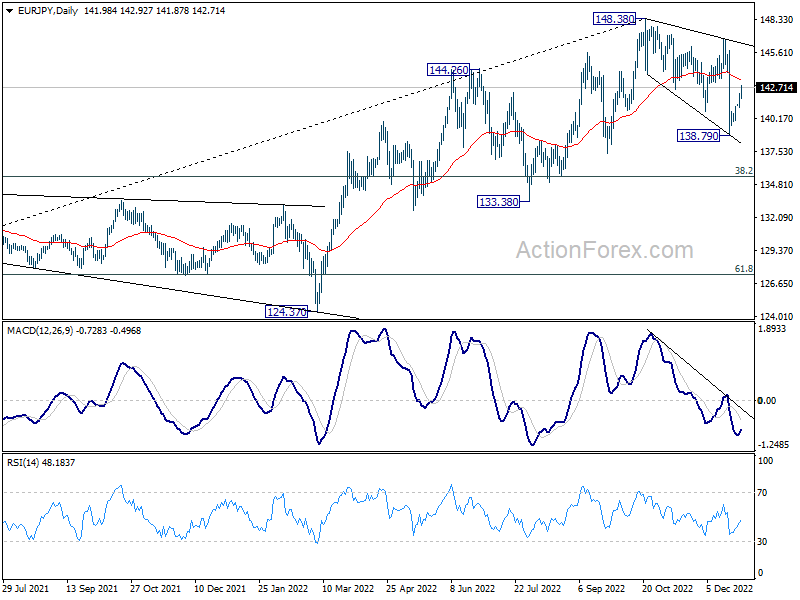
In the bigger picture, as long as 55 week EMA (now at 138.54) holds, larger up trend from 114.42 (2020 low) is still in progress for 149.76 long term resistance. However, firm break of 55 week EMA will bring deeper fall to 38.2% retracement of 114.42 to 148.38 at 135.40 before completing the correction from 148.38.
Yen Down Further as US Yields Surged, Dollar Mixed
Yen is under some persistent selling pressure since yesterday, following rebound in US benchmark yields. Aussie and Canadian Dollars are the stronger ones on commodity and oil prices, but Kiwi is lagging far behind. Euro is the stronger European majors while Sterling and Swiss Franc are on the softer side. Dollar is mixed for now and struggles to find a clear-cut direction.
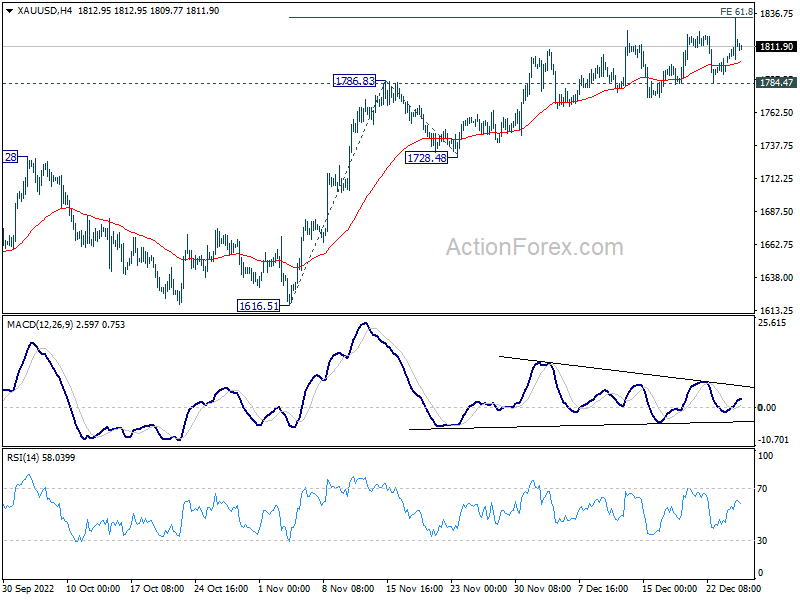
Technically, Gold edged higher to 1833.42 but upside momentum has been very unconvincing, as seen in bearish divergence condition in 4 hour MACD. Immediate focus is now on 61.8% projection of 1616.51 to 1786.83 fro 1728.48 at 1833.73. Decisive break there should prompt upside acceleration towards 100% projection at 1898.80 next. However, break of 1784.42 will suggest rejection by 1833.73, and bring deeper pull back towards 1728.48 support. Gold's next move would be a signal to confirm Dollar's.
In Asia, at the time of writing, Nikkei is down -0.54%. Hong Kong HSI is up 1.52%. China Shanghai SSE is down -0.25%. Singapore Strait Times is down -0.04%. Japan 10-year JGB yield is down -0.0077 at 0.461. Overnight, DOW rose 0.11%. S&P 500 dropped -0.40%. NASDAQ dropped -1.38%. 10-year yield rose 0.109 to 3.860.
BoJ Opinions: Expansion of 10-yr yield fluctuations enhances sustainability of YCC
In the Summary of Opinions at BoJ's December 19-20 meeting, several members noted that Japan is currently in a "critical phase" in achieving 2% inflation target. One noted that "signs of a virtuous cycle have started to be seen" between wages and prices". This is "evidenced by the overall high levels of corporate profits and moves to increase wages amid tight labor market conditions."
But "price stability is not considered to have been achieved". Thus, it's appropriate for BoJ to continue with the Quantitative and Qualitative Monetary Easing (QQE) with Yield Curve Control for as long as necessary, to "firmly support the economy and realize a favorable environment for firms to raise wages.
Many members noted the "deterioration in the functioning of bond markets", and "distortion in the price formation of 10-year bonds". Expansion of the range of 10-year JGB yield fluctuation will address the deterioration and distortion. But it's "not intended to change the direction of monetary easing". The expansion will "contribute to enhancing the sustainability of yield curve control".
Japan industrial production down -0.1% mom in Nov, output weakening
Japan industrial production declined -0.1% mom in November, better than expectation of -0.2% mom. But that's still the third straight month of contraction, followed -3.2% mom in October and -1.7% mom in September.
Looking at some details, general machinery output was down -7.9%, production machinery was down -5.7% while auto products was down -0.8%.
The Ministry of Economy, Trade and Industry downgraded the assessment of industrial production to "weakening". It expects output to rebound by 2.8% in December, then decrease -0.6% in January.
US 10-year yield rebounds with USD/JPY
US 10-year yield rose notably overnight, ending up 0.109 at 3.860. The rally was believed to be triggered by news that China is further exiting pandemic restrictions and travel controls. The move was seen, on the one hand, as a boost to the global economy. On the other hand, Japan, India, Italy and South Korea all said they would be imposing tighter COVID-testing requirements on tourists from China, with concerns on the lack of transparency on infections and variants in the country.
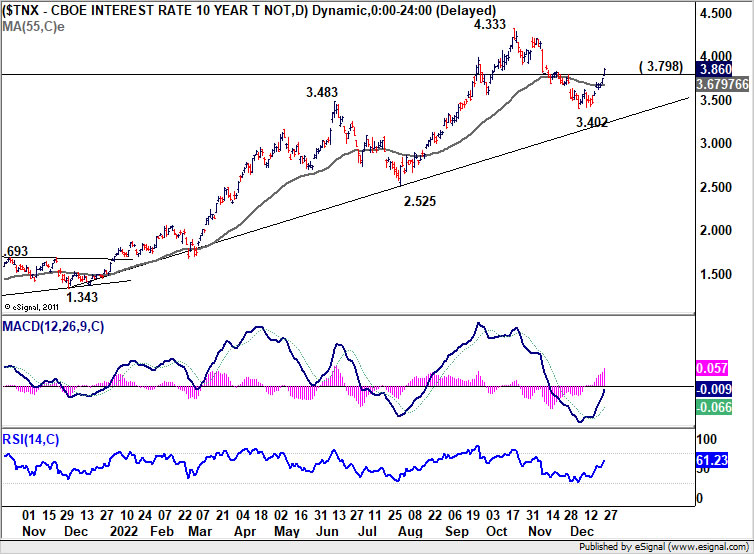
Anyways, 10-year yield's break of 3.798 resistance argues that the slightly deeper than expected corrective fall from 4.333 has completed at 3.402. The range of the corrective pattern should be set between 3.4/4.3. Further rally is now in favor for the near term. But break of 4.333 is not envisaged until further developments.
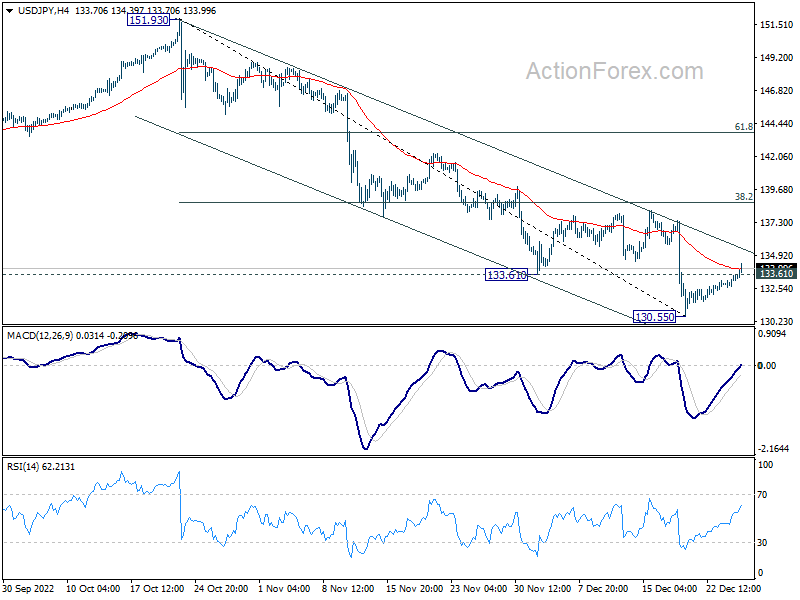
USD/JPY's break of 133.61 support should confirm short term bottoming at 130.55, on bullish convergence condition in 4 hour MACD. With a little help from the rebound in yields, USD/JPY would rise further towards 38.2% retracement of 151.93 to 130.55 at 138.71.
Looking ahead
Swiss Credit Suisse economic expectations and US pending home sales will be released today.
EUR/JPY Daily Outlook
Daily Pivots: (S1) 141.34; (P) 141.80; (R1) 142.47; More....
A short term bottom should be formed in EUR/JPY at 138.79 with current rebound. Intraday bias is back on the upside for 55 day EMA (now at 143.37). Sustained break there will argue that whole correction from 148.38 has completed with three waves down to 138.79. Further rise should then be seen back to 146.71/148.38 resistance zone. On the downside, below 141.12 will bring retest of 138.79 instead.
In the bigger picture, as long as 55 week EMA (now at 138.54) holds, larger up trend from 114.42 (2020 low) is still in progress for 149.76 long term resistance. However, firm break of 55 week EMA will bring deeper fall to 38.2% retracement of 114.42 to 148.38 at 135.40 before completing the correction from 148.38.
Economic Indicators Update
| GMT | Ccy | Events | Actual | Forecast | Previous | Revised |
|---|---|---|---|---|---|---|
| 23:50 | JPY | BoJ Summary of Opinions | ||||
| 23:50 | JPY | Industrial Production M/M Nov P | -0.10% | -0.20% | -3.20% | |
| 09:00 | CHF | Credit Suisse Economic Expectations Dec | -57.5 | |||
| 15:00 | USD | Pending Home Sales M/M Nov | -1.20% | -4.60% |
US 10-year yield rebounds with USD/JPY
US 10-year yield rose notably overnight, ending up 0.109 at 3.860. The rally was believed to be triggered by news that China is further exiting pandemic restrictions and travel controls. The move was seen, on the one hand, as a boost to the global economy. On the other hand, Japan, India, Italy and South Korea all said they would be imposing tighter COVID-testing requirements on tourists from China, with concerns on the lack of transparency on infections and variants in the country.
Anyways, 10-year yield's break of 3.798 resistance argues that the slightly deeper than expected corrective fall from 4.333 has completed at 3.402. The range of the corrective pattern should be set between 3.4/4.3. Further rally is now in favor for the near term. But break of 4.333 is not envisaged until further developments.
USD/JPY's break of 133.61 support should confirm short term bottoming at 130.55, on bullish convergence condition in 4 hour MACD. With a little help from the rebound in yields, USD/JPY would rise further towards 38.2% retracement of 151.93 to 130.55 at 138.71.
USD/CAD Breaks Key Support, Risk of More Downsides
Key Highlights
- USD/CAD started a fresh decline from the 1.3685 zone.
- It traded below a key bullish trend line with support at 1.3585 on the 4-hours chart.
- EUR/USD could rise above the 1.0650 and 1.0680 resistance levels.
- Gold price spiked above the $1,825 resistance zone.
USD/CAD Technical Analysis
The US Dollar climbed above the 1.3500 resistance against the Canadian Dollar. USD/CAD even broke the 1.3620 level before the bears appeared.
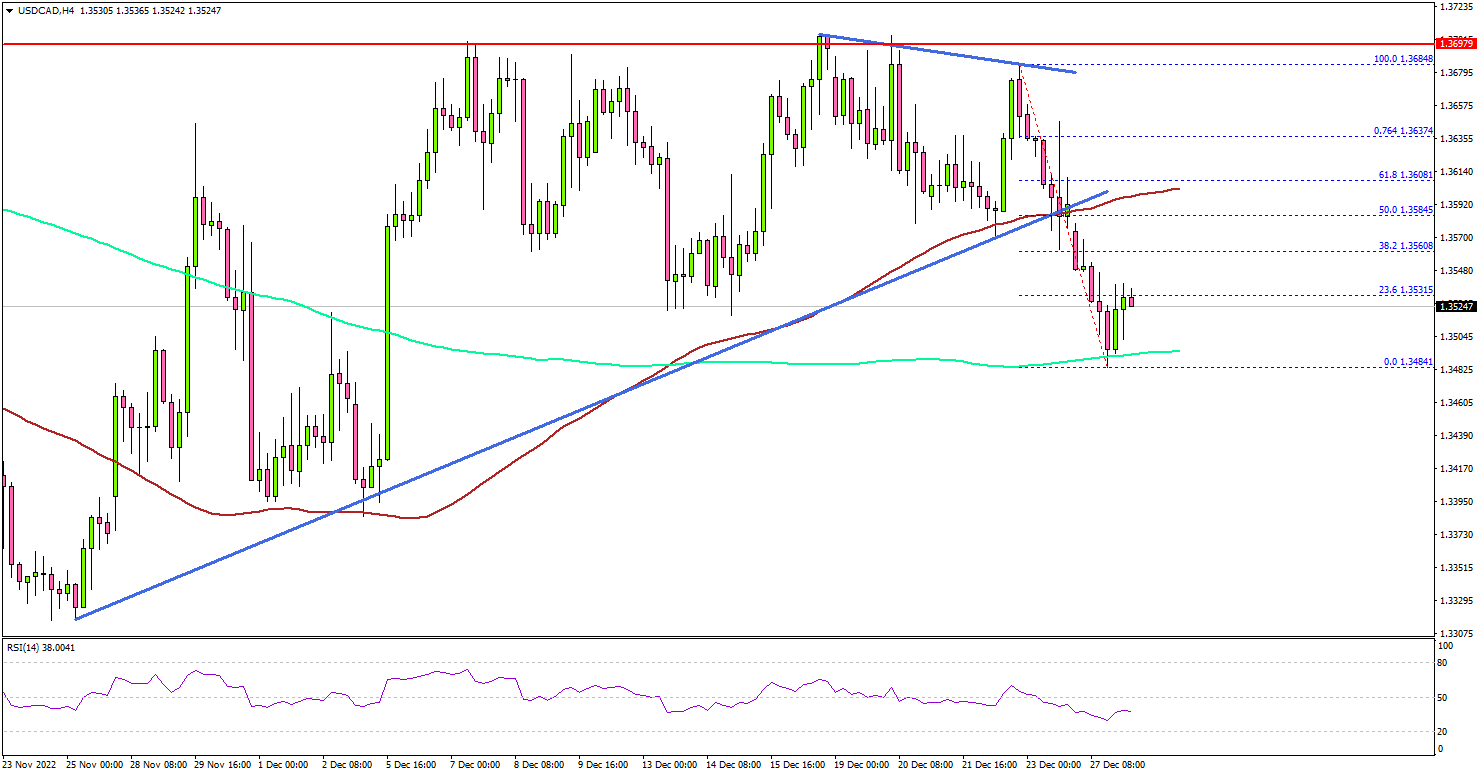
Looking at the 4-hours chart, the pair traded as high as 1.3705 before it started a fresh decline. There was a clear move below the 1.3650 support zone. Besides, the pair traded below a key bullish trend line with support at 1.3585.
The pair even settled below the 1.3550 level and the 100 simple moving average (red, 4-hours). It traded as low as 1.3484 and tested the 200 simple moving average (green, 4-hours).
On the downside, there is a key support at 1.3500. A downside break below the 1.3500 zone might spark a major decline. The next major support sits near the 1.3420 level. Any more losses might open the doors for a move towards the 1.3350 support zone.
On the upside, an initial resistance is near the 1.3560 level. The next major resistance may perhaps be near 1.3585. A clear move above the 1.3585 resistance might start a steady increase.
In the stated case, USD/CAD may perhaps rise towards the 1.3680 level. Any more gains could lead the pair towards the 1.3800 resistance zone in the coming days.
Looking at gold price, there was a spike above the $1,825 resistance zone, but the price failed to settle above the stated resistance zone.
Economic Releases
- US Pending Home Sales for Nov 2022 (MoM) - Forecast +0.6%, versus -4.6% previous.
BoJ Opinions: Expansion of 10-yr yield fluctuations enhances sustainability of YCC
In the Summary of Opinions at BoJ's December 19-20 meeting, several members noted that Japan is currently in a "critical phase" in achieving 2% inflation target. One noted that "signs of a virtuous cycle have started to be seen" between wages and prices". This is "evidenced by the overall high levels of corporate profits and moves to increase wages amid tight labor market conditions."
But "price stability is not considered to have been achieved". Thus, it's appropriate for BoJ to continue with the Quantitative and Qualitative Monetary Easing (QQE) with Yield Curve Control for as long as necessary, to "firmly support the economy and realize a favorable environment for firms to raise wages.
Many members noted the "deterioration in the functioning of bond markets", and "distortion in the price formation of 10-year bonds". Expansion of the range of 10-year JGB yield fluctuation will address the deterioration and distortion. But it's "not intended to change the direction of monetary easing". The expansion will "contribute to enhancing the sustainability of yield curve control".
Japan industrial production down -0.1% mom in Nov, output weakening
Japan industrial production declined -0.1% mom in November, better than expectation of -0.2% mom. But that's still the third straight month of contraction, followed -3.2% mom in October and -1.7% mom in September.
Looking at some details, general machinery output was down -7.9%, production machinery was down -5.7% while auto products was down -0.8%.
The Ministry of Economy, Trade and Industry downgraded the assessment of industrial production to "weakening". It expects output to rebound by 2.8% in December, then decrease -0.6% in January.
Trade Idea: What’s Next for Yen Crosses?
AUDJPY
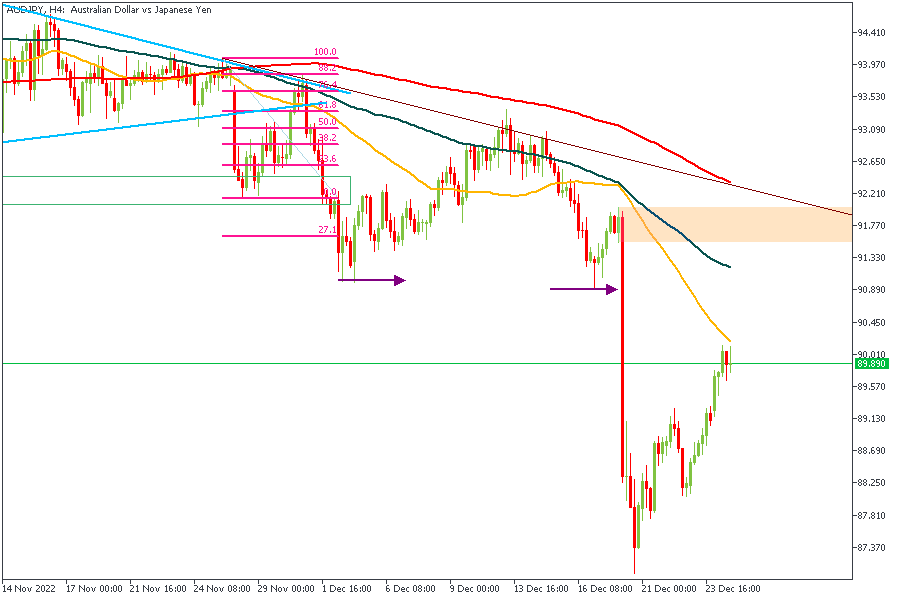
The trend in the scenario above is clearly bearish. We have also had a recent break of structure at the marked horizontal arrows, which means we can expect price to react from the supply zone that broke the structure. Coincidentally, the supply zone and the 200-SMA are perfectly aligned around the same area.
CADJPY
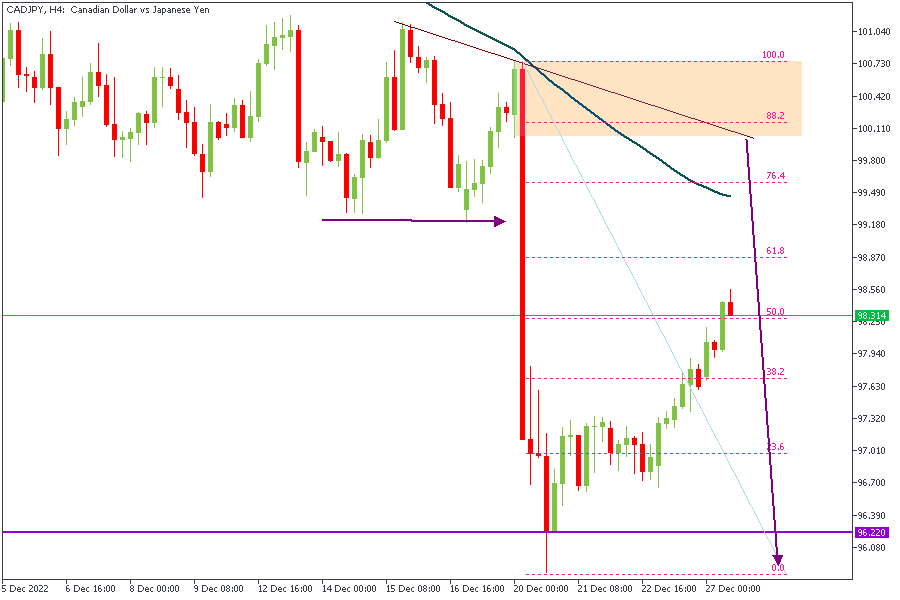
After the bearish break of structure, we see price steadily angling towards the supply zone for a retest. The zone of interest also has the 100-SMA and the Fibonacci retracement levels as added confluence.
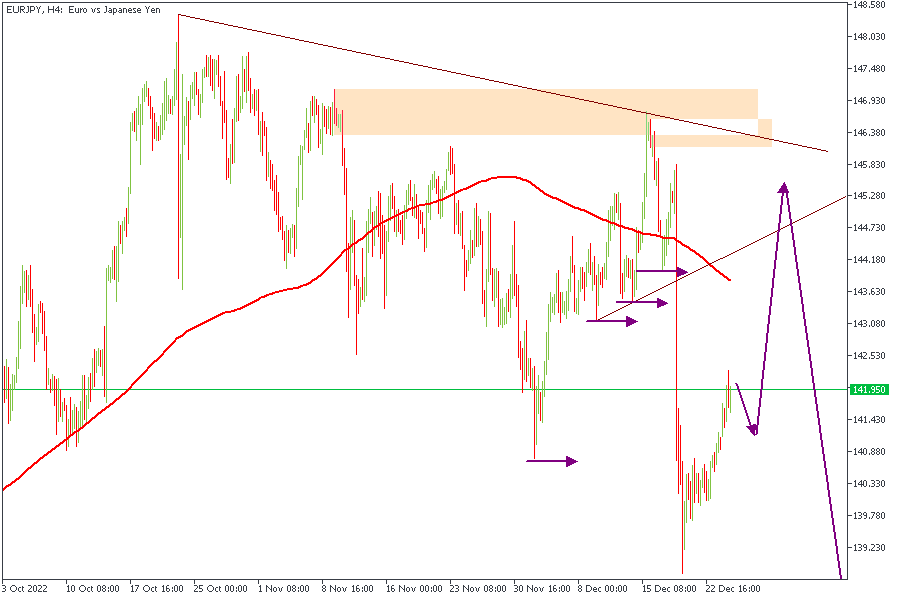
EURJPY
EURJPY can be seen to have successfully broken out of the wedge pattern with an accompanying break of structure. As a result, price is expected to retest the supply zone that created the break of structure. This means my bias here is also bearish.
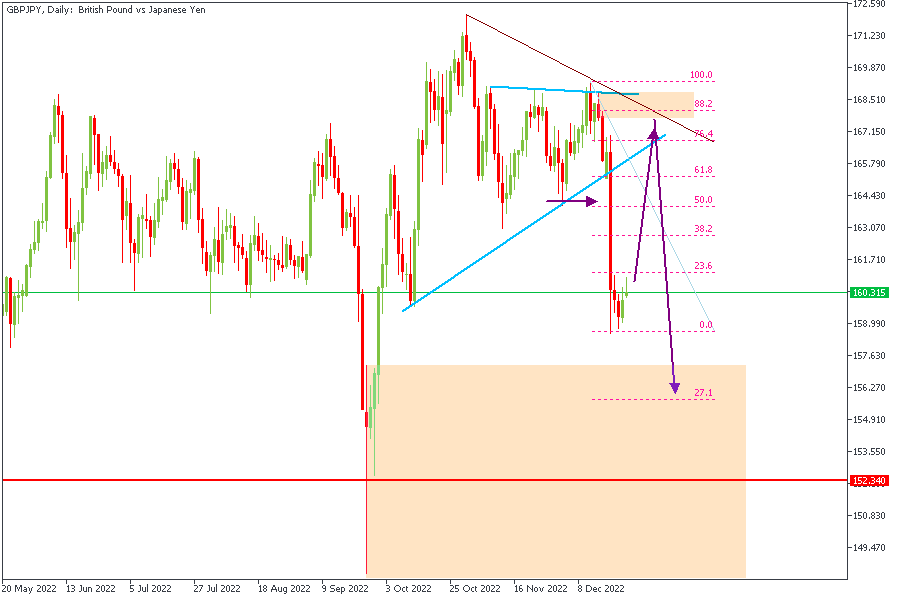
GBPJPY
After the initial breakout from the wedge pattern - and break of structure - we see price gliding slowly higher towards the 75% Fibonacci retracement level. The highlighted zone is expected to react away from the supply zone. There is also the notable presence of a trendline resistance around that zone confirming the likelihood of a bearish continuation from the marked spot.
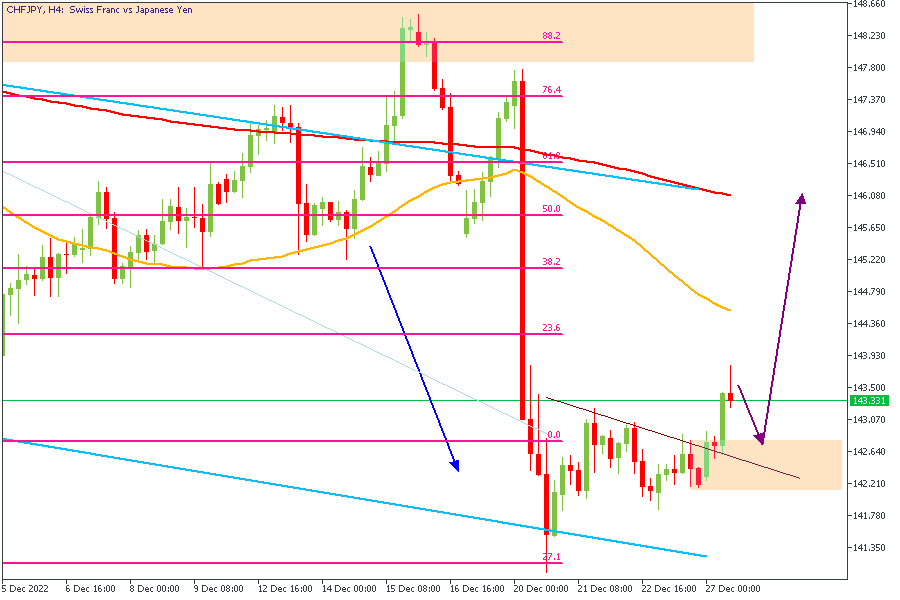
CHFJPY
Overall bias on CHFJPY is bearish, however, there's been a bullish break of structure serving as a confirmation of the market's intention to retest the marked supply area before dropping further.
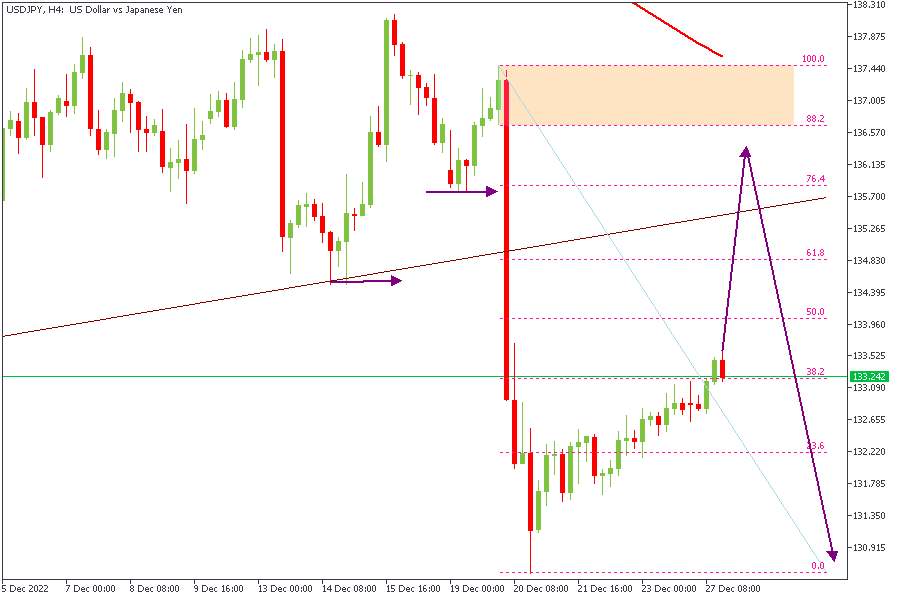
USDJPY
Price in this scenario is clearly in search of a reliable zone it could actually get to react from. Already the sluggish price action is an indication that momentum is low, therefore, price would be looking for an order-filled region to capture liquidity. The highlighted supply zone is my preferred area of entry though.
CONCLUSION
The views above are solely based on Technical Analysis techniques using my personal Smart Money approach. Hence, it is important to understand that the trading of CFDs comes at risk; if not properly managed, you may lose all of your trading capital. To avoid costly mistakes while you look to trade these opportunities, be sure to do your own due diligence and manage your risk appropriately.
Trade Idea: Gold Breakdown
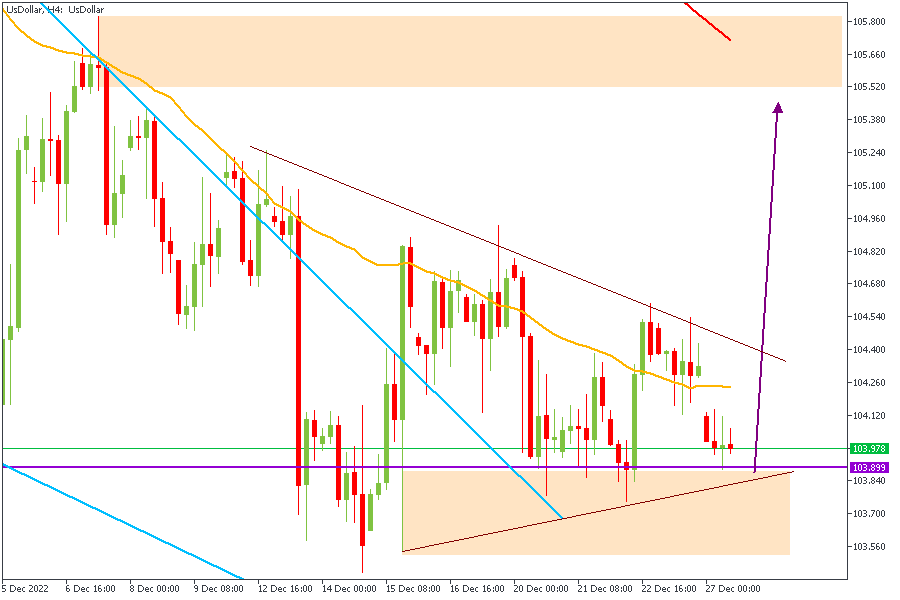
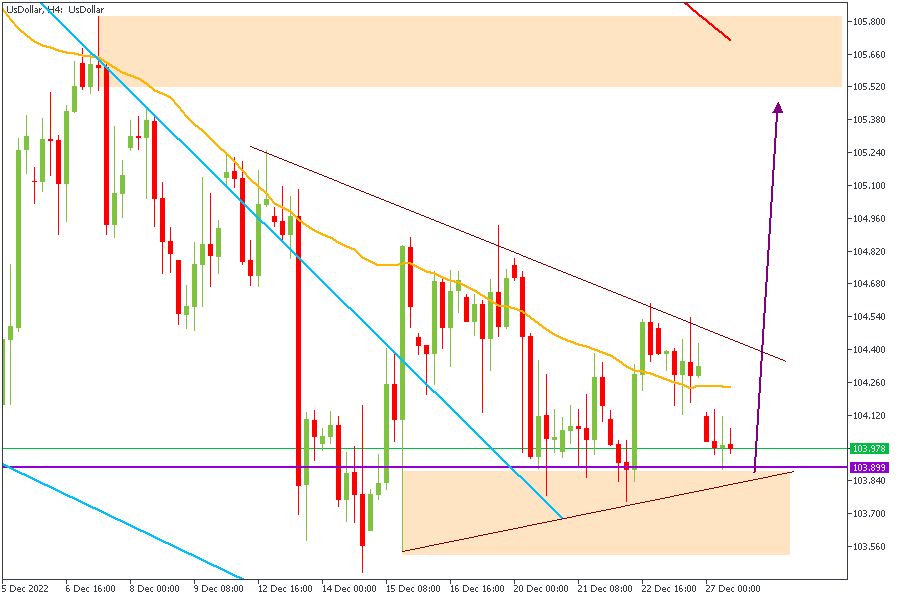
The US Dollar has been remarkably sluggish for the past few weeks despite being within a distinct Demand zone. My expectation of a springing rebound off the demand zone has not exactly played out yet, however, the zone remains unbroken. The formation of a wedge pattern right on top of the demand zone also serves as an additional reason to hold on to my bullish bias in the meantime.
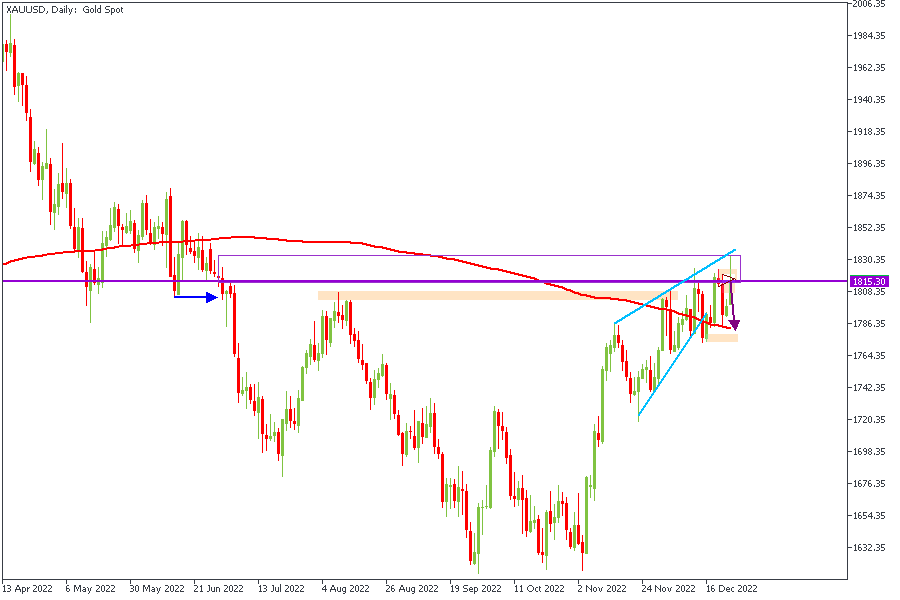
Daily Timeframe
On the Daily timeframe, Gold seems to be driving hard within the wedge as it retests the supply zone from the previous break of structure. At the moment, my overall bias is still bearish based on the DXY correlation. Let's see the lower timeframe though.
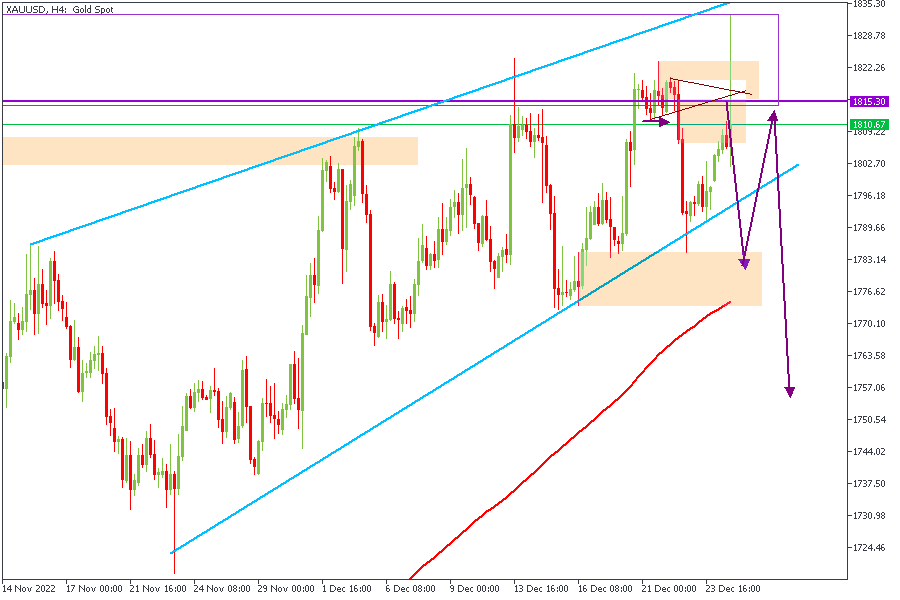
4-Hour Timeframe
This chart gives us a clearer view of what we saw earlier on the Daily timeframe. Here however there is an interesting scenario of an induced 'false breakout'. The bias remains bearish, however, a break and retest of the wedge pattern would be a safer entry. Can the H1 timeframe possibly provide more insight? Let's see.
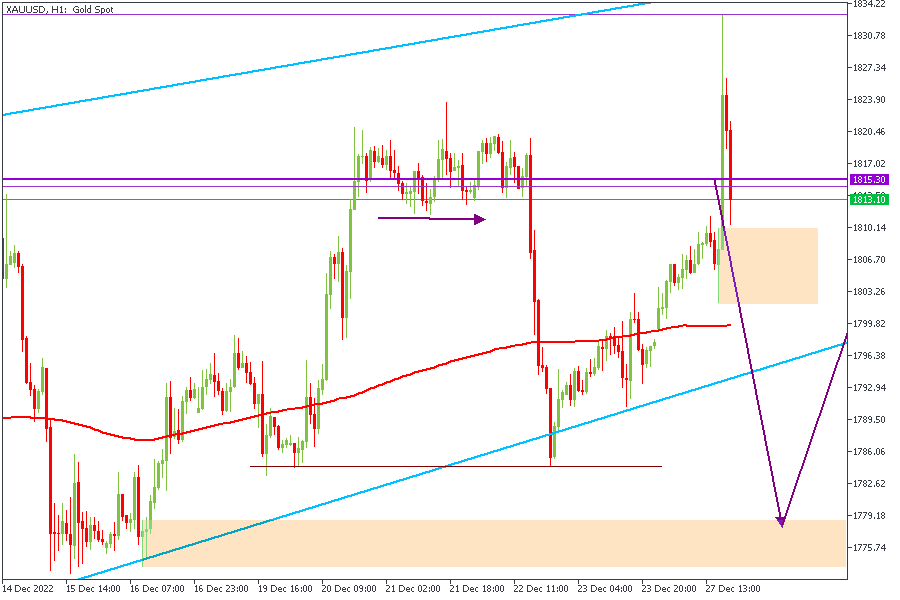
1-Hour Timeframe
Here on the 1-hour timeframe we see a classic AMD schematic (Accumulation, Manipulation, Distribution - AMD), where the highlighted area serves as the supply zone, I would personally be watching out for. This would be my initial entry pending the break of the wedge pattern on the H4.
CONCLUSION
It is important to understand that the trading of CFDs comes at risk; if not properly managed, you may lose all of your trading capital. To avoid costly mistakes while you look to trade these opportunities, be sure to do your own due diligence and manage your risk appropriately.
Trade Idea: Major Pairs
Hello, my beautiful readers. This week, we continue our critically detailed look at the markets in hopes of getting profitable trading opportunities. As usual, I'll be starting with the DXY (US Dollar Index) since it holds considerable sway over the Major currency pairs.
As we can see from the attached image above, DXY seems to be gathering momentum to enable it to break out of the wedge pattern and recover its bullish momentum. This means that the US Dollar is expected to get stronger if this analysis is adhered to.
GBPUSD
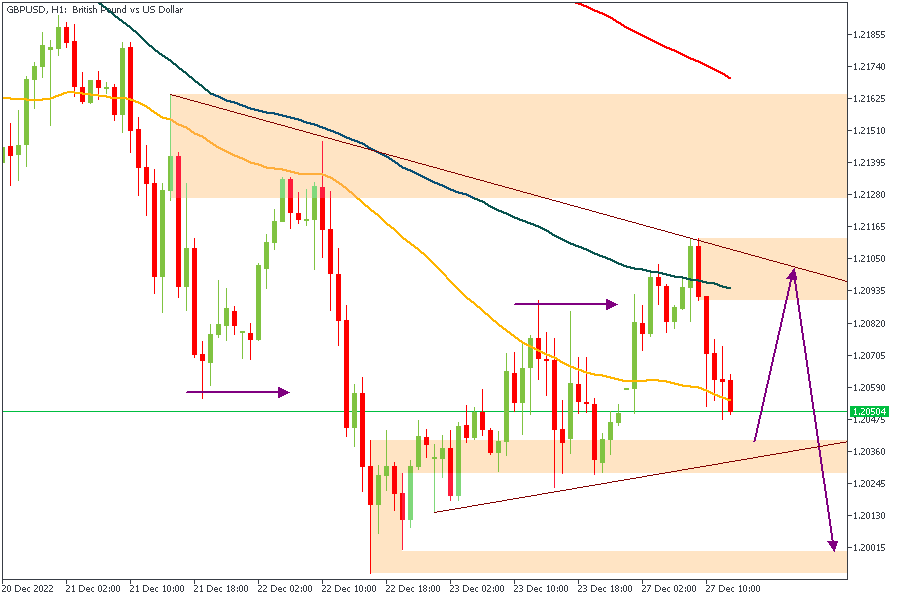
GBPUSD is also currently merry-ing within the wedge, but with a recent break of the previous high at the marked horizontal arrow. Coupling this with our expectation of a stronger Dollar means we should be seeing some bearish price action on GBPUSD in a short while.
EURUSD
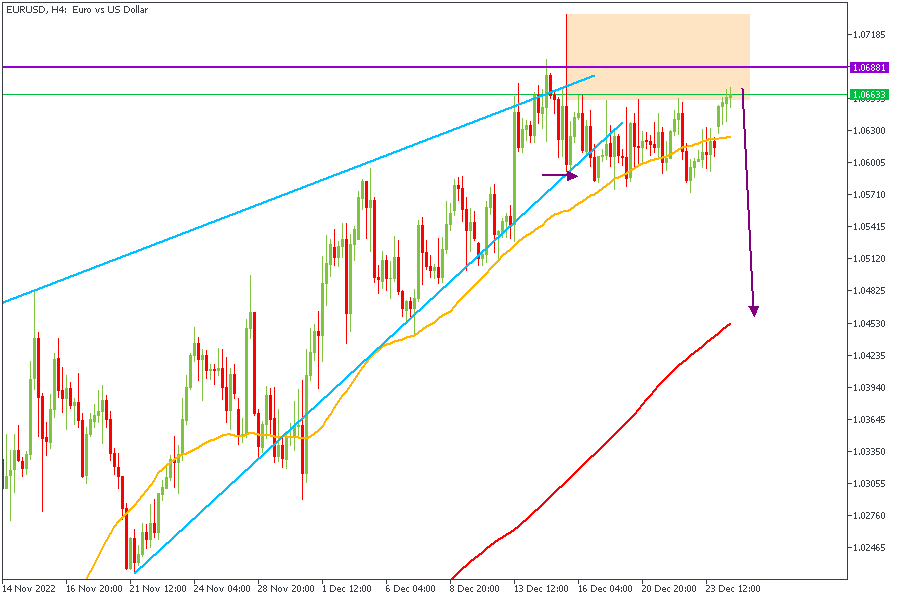
EURUSD on the other hand presents an interesting challenge. The market structure appears to be completely nonsensical, but the direction is still discernible to trained eyes. The marked horizontal arrow is the previous break of lows that occurred after the initial price rejection from the Daily supply zone as indicated by the horizontal purple line. As a result, I am expecting price to react from the highlighted area in continuation of the bearish structure and rejection from the supply zone.
AUDUSD
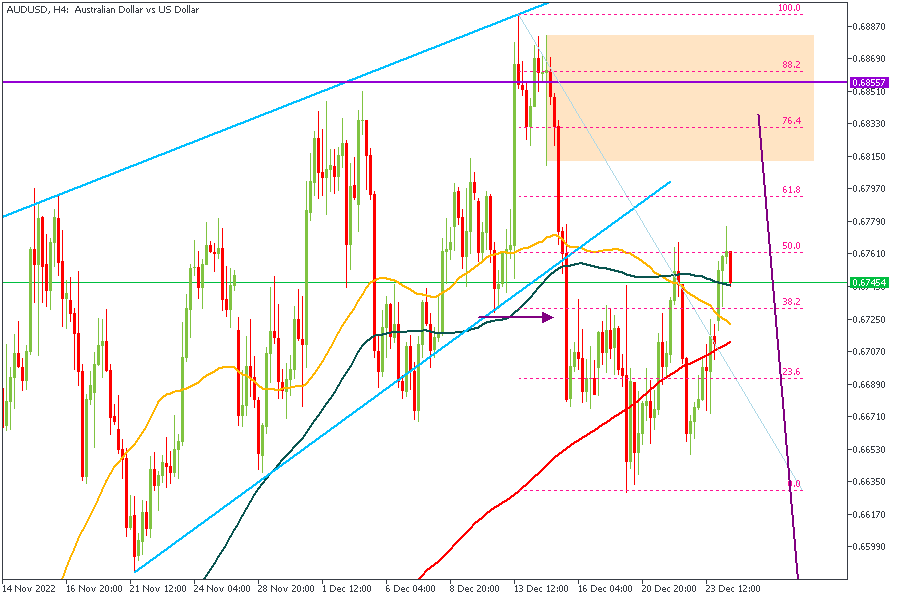
Here we see a previous break out of the wedge, as well as a break of market structure. This means we can expect a textbook break-and-retest to play out here. The highlighted zone serves as my expected Point-of-Interest for a SELL entry.
NZDUSD
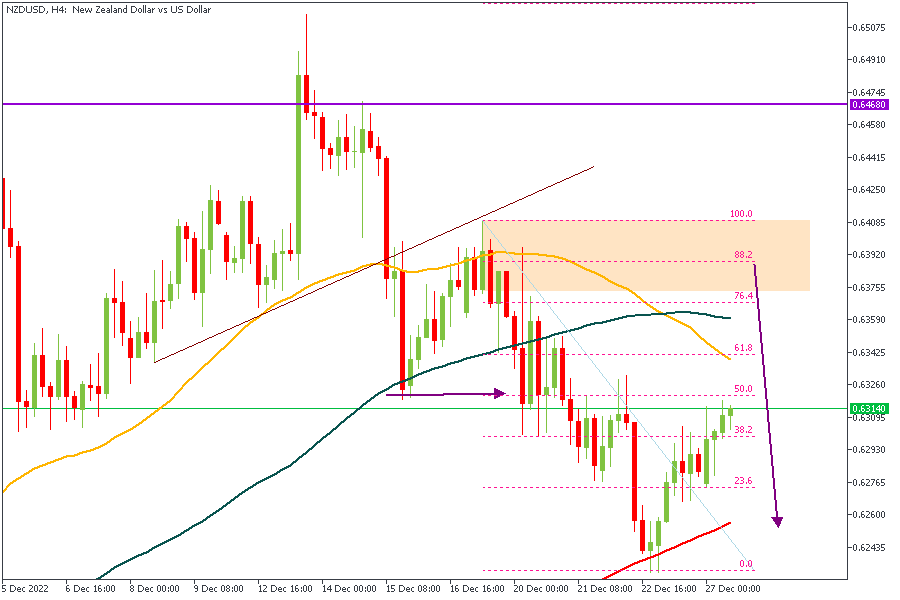
Considering the 'death cross' on the chart above, having a bearish bias seems like a good idea. However, NZDUSD has provided us with further confirmations; we see the bearish break of structure at the marked horizontal arrow, and the Fibonacci retracement level around the vicinity of the 100-SMA on the 4-Hour timeframe. I will be waiting patiently for price to raid my zone before taking a Sell trigger.
CONCLUSION
It is important to understand that with the current festivities around the world, market volumes are naturally going to be on the low, so you should be careful to consider this in your trading. Also, the trading of CFDs comes at risk; if not properly managed, you may lose all of your trading capital. To avoid costly mistakes while you look to trade these opportunities, be sure to do your own due diligence and manage your risk appropriately.
NASDAQ Reacting Lower From Elliott Wave Equal Legs Area
In this technical blog, we will look at the past performance of the 1-hour Elliott Wave Charts of NASDAQ ticker symbol: $NQ_F. In which, the decline from 13 December 2022 high ended 5 waves in an impulse sequence and showed a lower low sequence in a lower time frame charts. Therefore, we knew that the structure in NASDAQ is incomplete to the downside & should see more weakness. So, we advised members to sell the bounces in 3, 7, or 11 swings at the extreme areas. We will explain the structure & forecast below:
NASDAQ 1-Hour Elliott Wave Chart
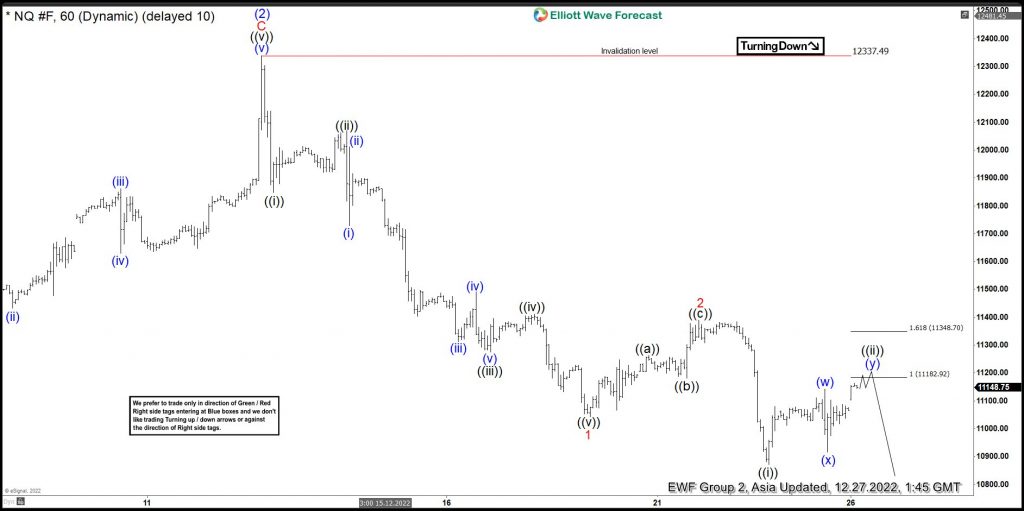
Above is the 1hr Elliott wave Chart from the 12/27/2022 Asia update. In which, the decline from 13 December unfolded in an impulse sequence & showed a lower sequence where the index made a short-term bounce in wave ((ii)). The internals of that bounce unfolded as an Elliott wave double correction where wave (w) ended at $11143 high. Then a decline to $10916 low ended wave (x) pullback and started the (y) leg higher towards $11182- $11348 equal legs area from where sellers were expected to appear looking for more downside or for a 3 wave reaction lower at least.
NASDAQ Latest 1-Hour Elliott Wave Chart
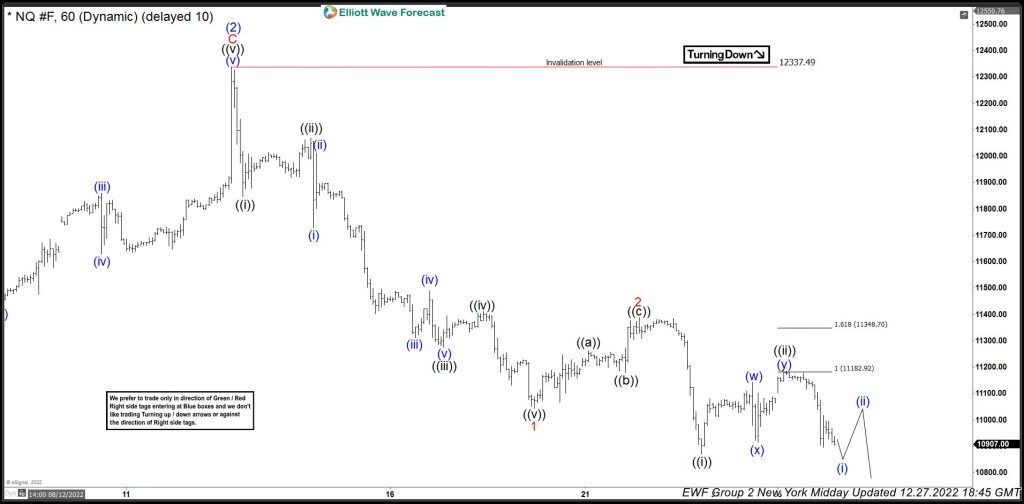
This is the Latest 1hr view from the 12/27/2022 Midday update. In which the index is showing a strong reaction lower taking place from the equal legs area allowing shorts to get into a risk-free position shortly after taking the position.