Sample Category Title
XAG/USD: We Expect the Bullish Trend to Continue
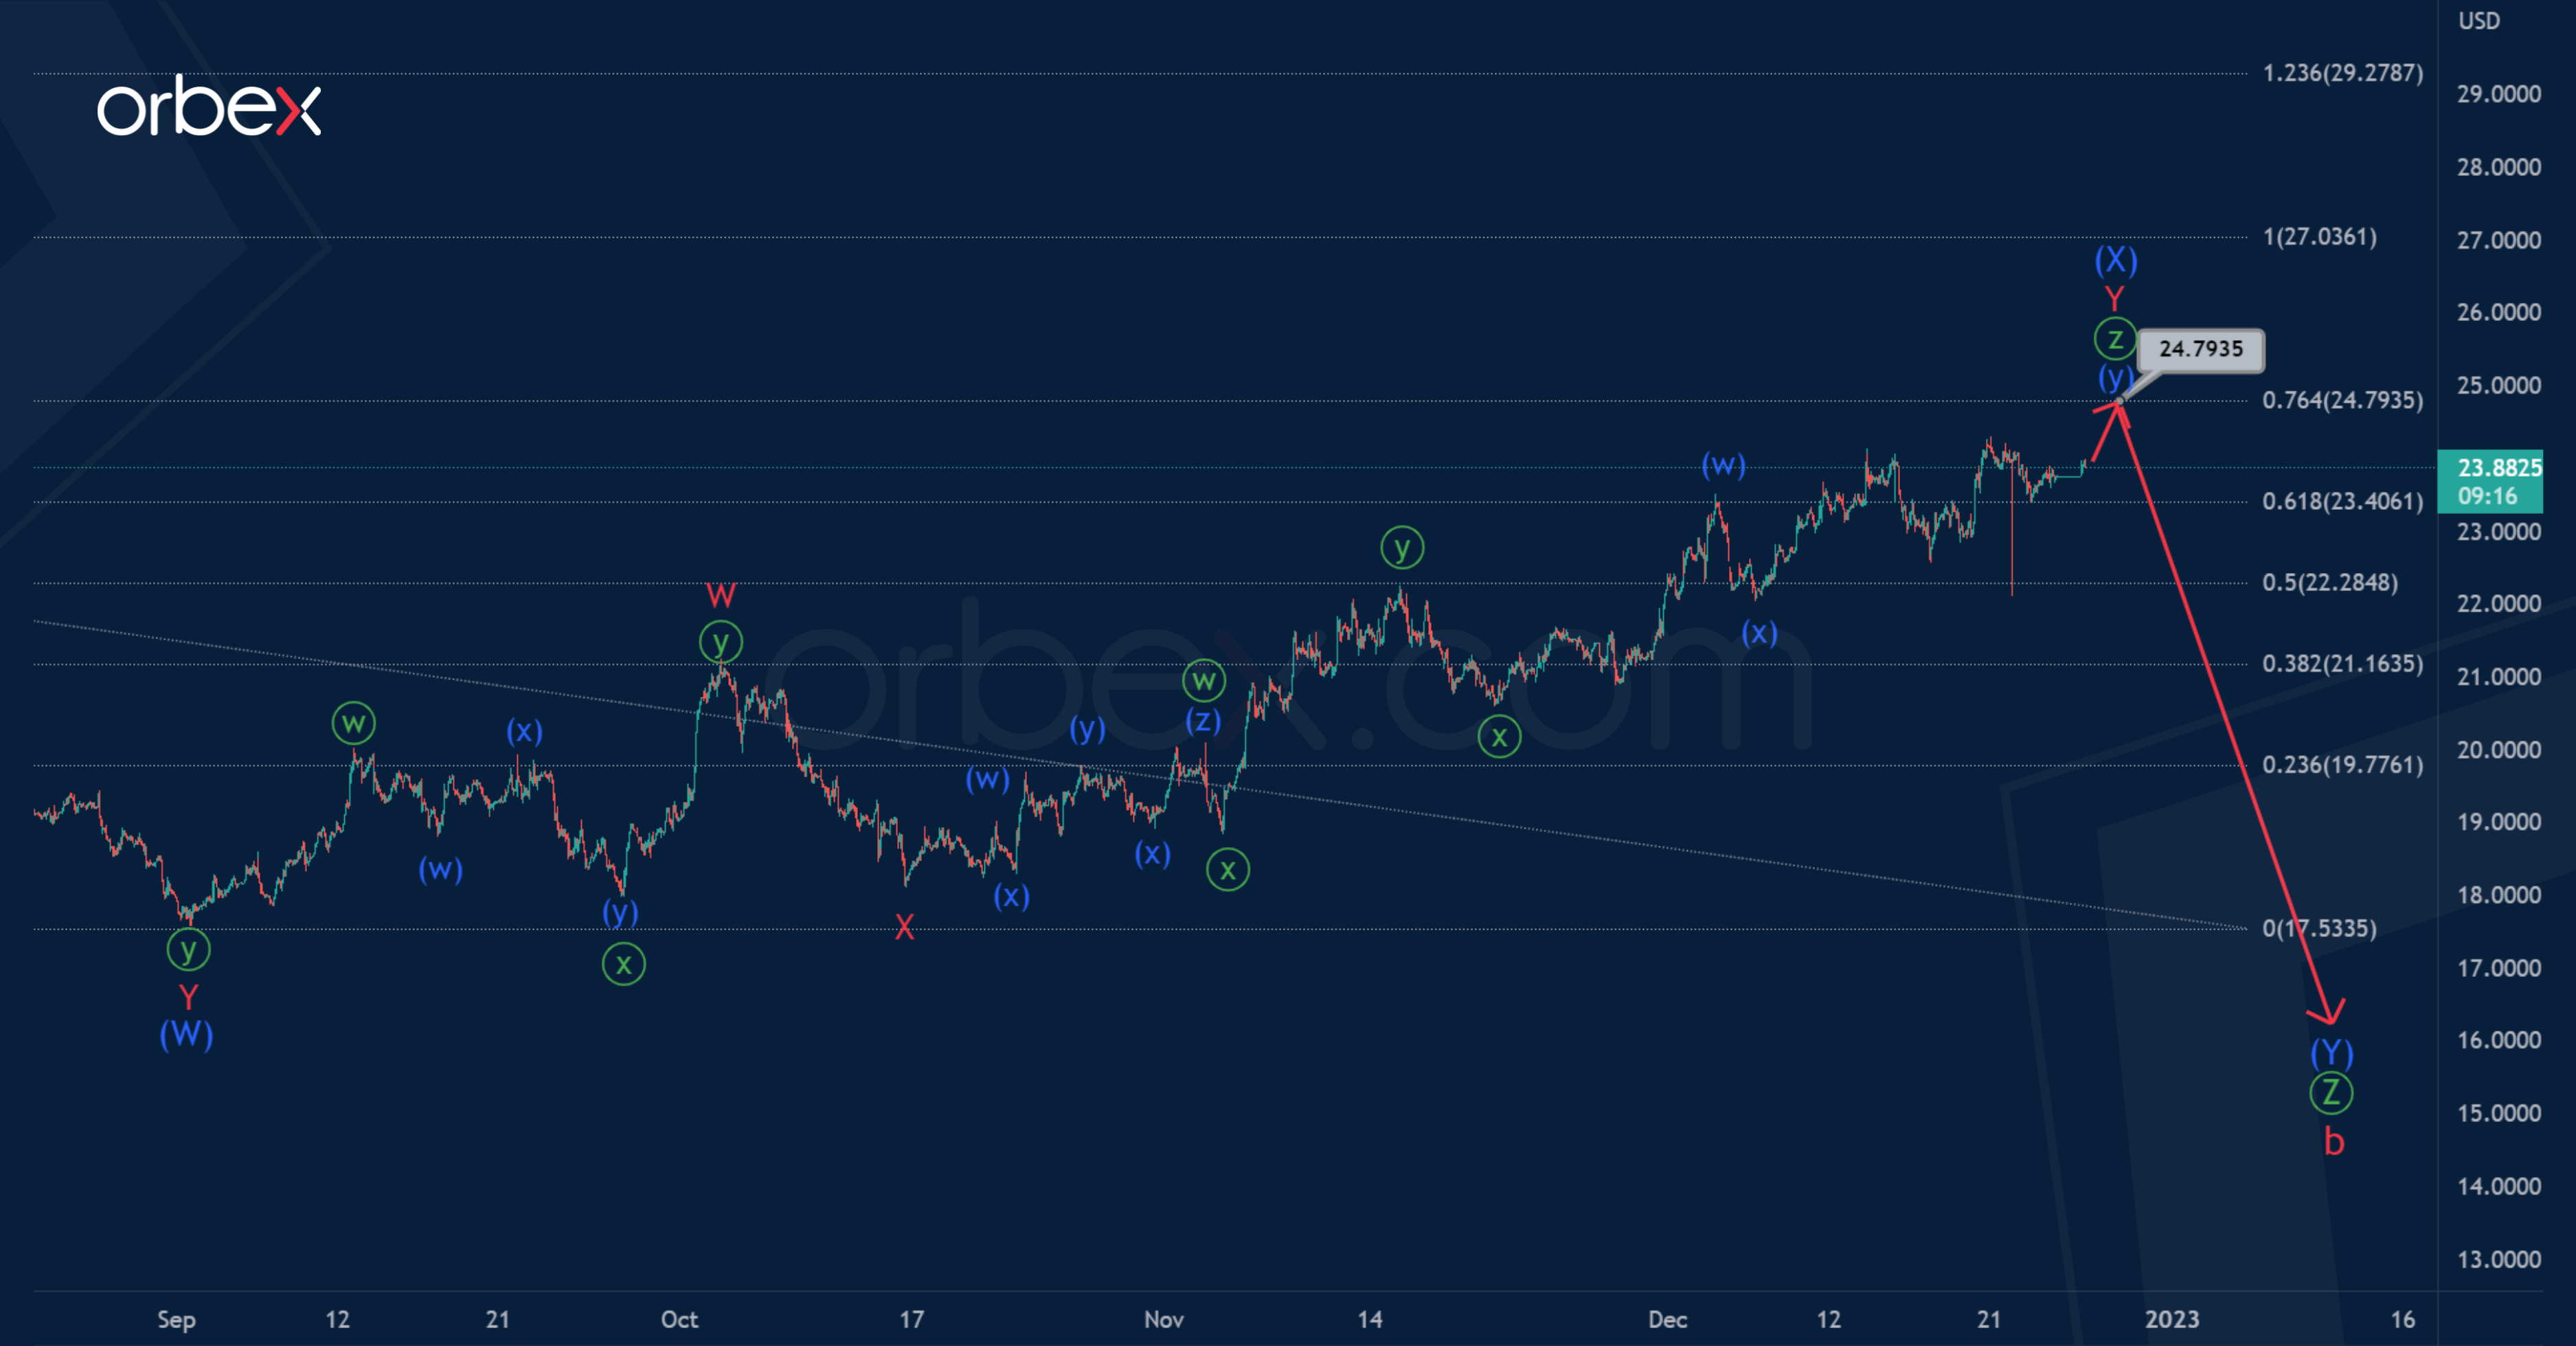
XAGUSD suggests the development of the corrective wave b, which is part of the global zigzag. Correction b most likely takes the form of a triple zigzag Ⓦ-Ⓧ-Ⓨ-Ⓧ-Ⓩ. The first four primary waves are completed, and the last wave is still under construction.
It is assumed that the primary wave Ⓩ will be a double zigzag of the intermediate degree (W)-(X)-(Y). After the end of the actionary wave (W), the price began an upward movement in the intervening wave (X). Like the wave (W), the intervening wave (X) may end in the form of a minor double zigzag W-X-Y.
The end of the bullish trend is expected near 24.793. At that level, wave (X) will be at 76.4% of wave (W).
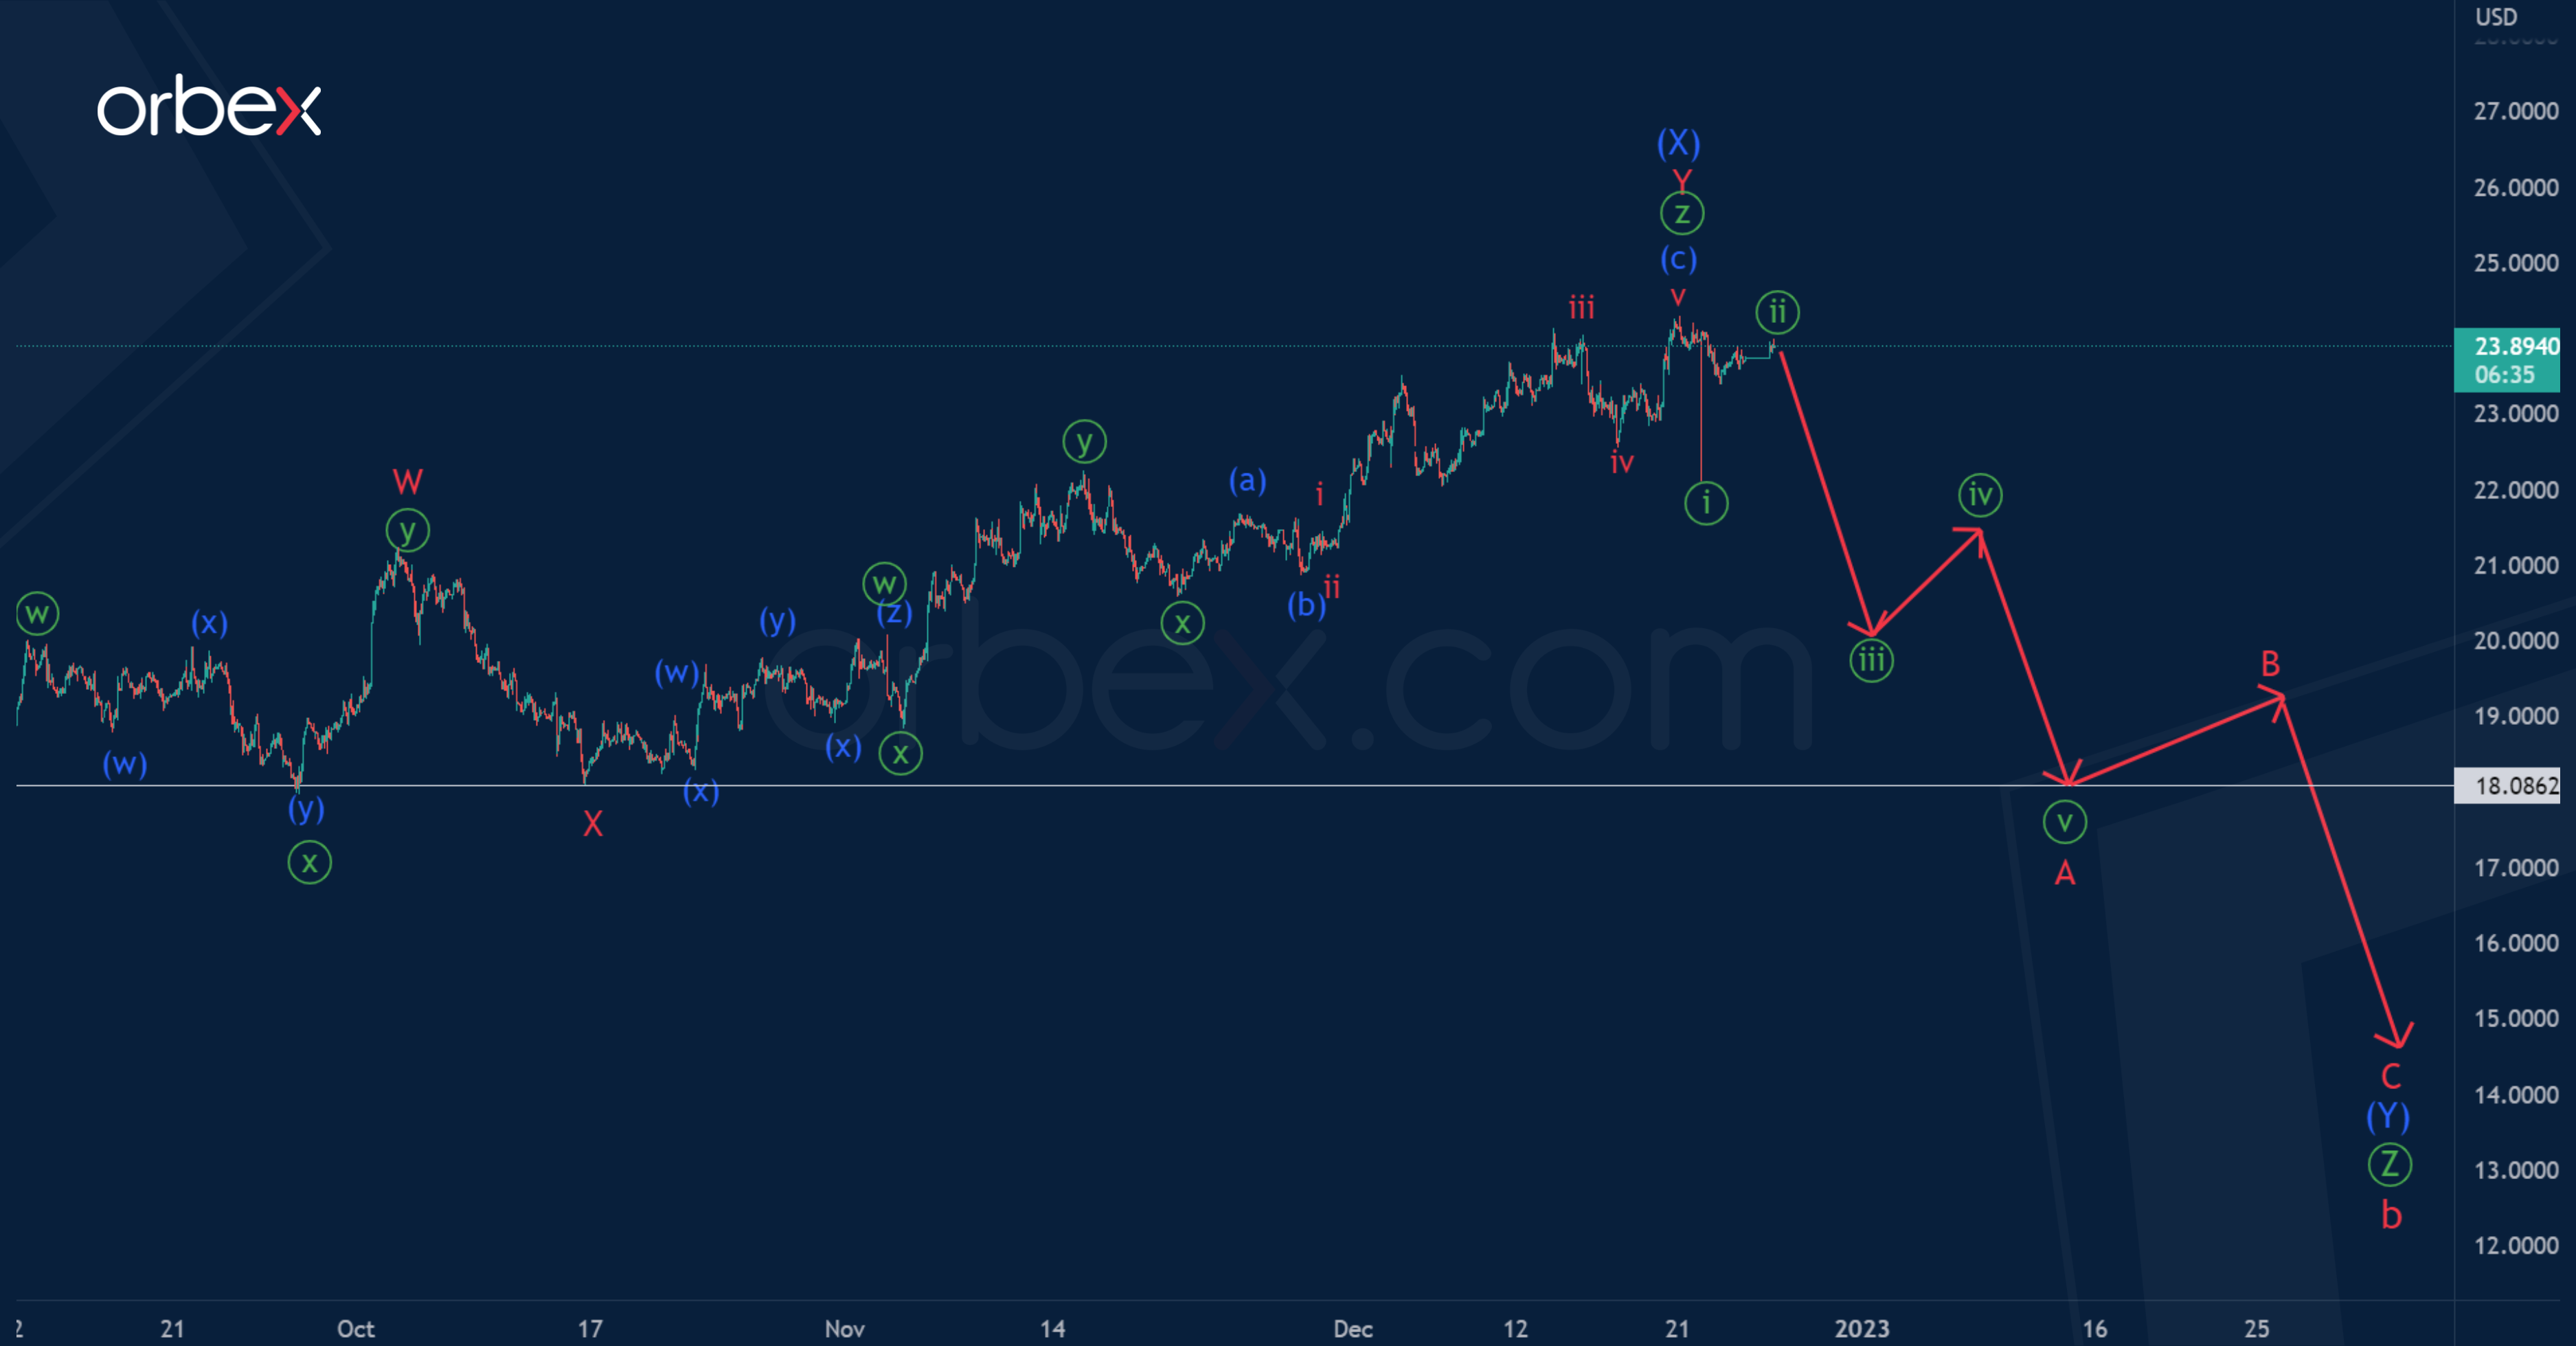
Alternatively, the XAGUSD pair has completed the construction of an ascending intervening wave (X) of the intermediate degree. It has the shape of a double zigzag W-X-Y.
Thus, in the next coming trading days, we can expect a fall in XAGUSD and the formation of a bearish actionary wave (Y). Perhaps this wave will have a standard zigzag shape A-B-C, as shown in the chart.
The first target, where the bears are aimed, is located at the previous low of 18.086, which was marked by the minor intervening wave X.
DAX 40 Under Pressure
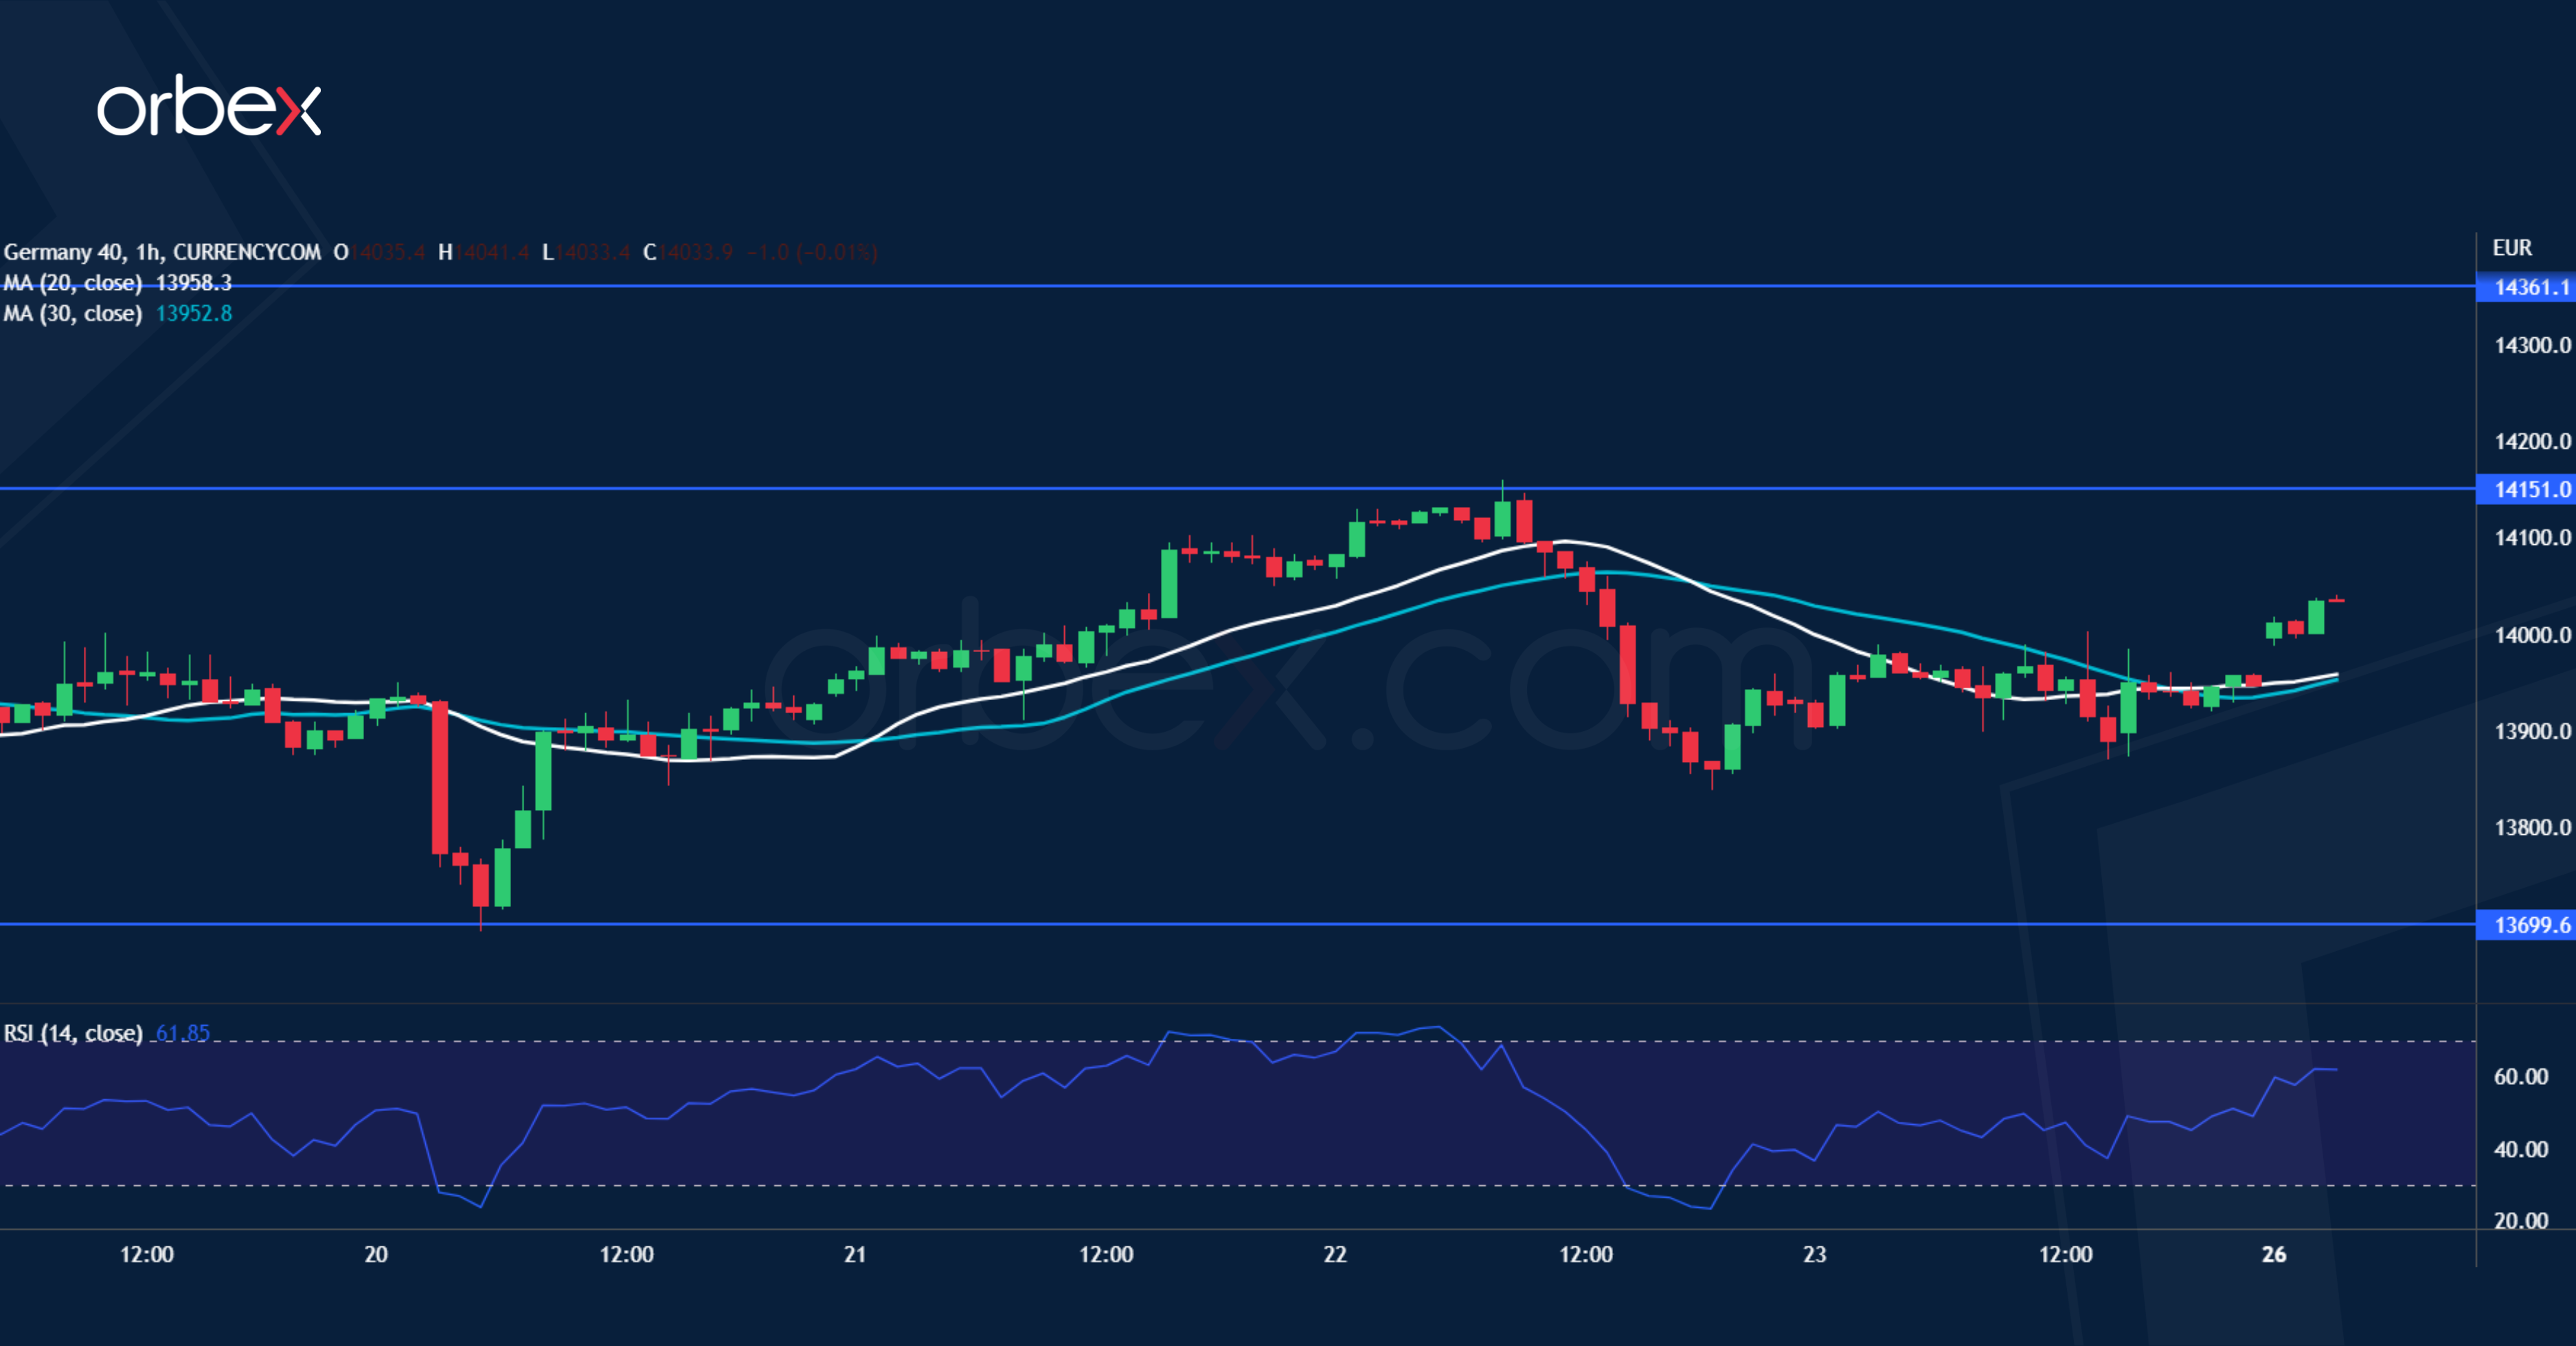
The Dax 40 steadied as US PCE and durable goods showed a slowdown in November. On the daily chart, after the index hit June’s high of 14650 - a boundary between bearish continuation and bullish reversal, a bearish MA cross indicates souring sentiment. The sell-off below 14300 has put the bulls on the defensive. While the RSI’s oversold condition has attracted bargain hunters, they may be wary of taking big positions during a week of thin liquidity. 14150 is resistance and 13700 support from the mid-November extension.
AUD/USD Bounces off Key Floor
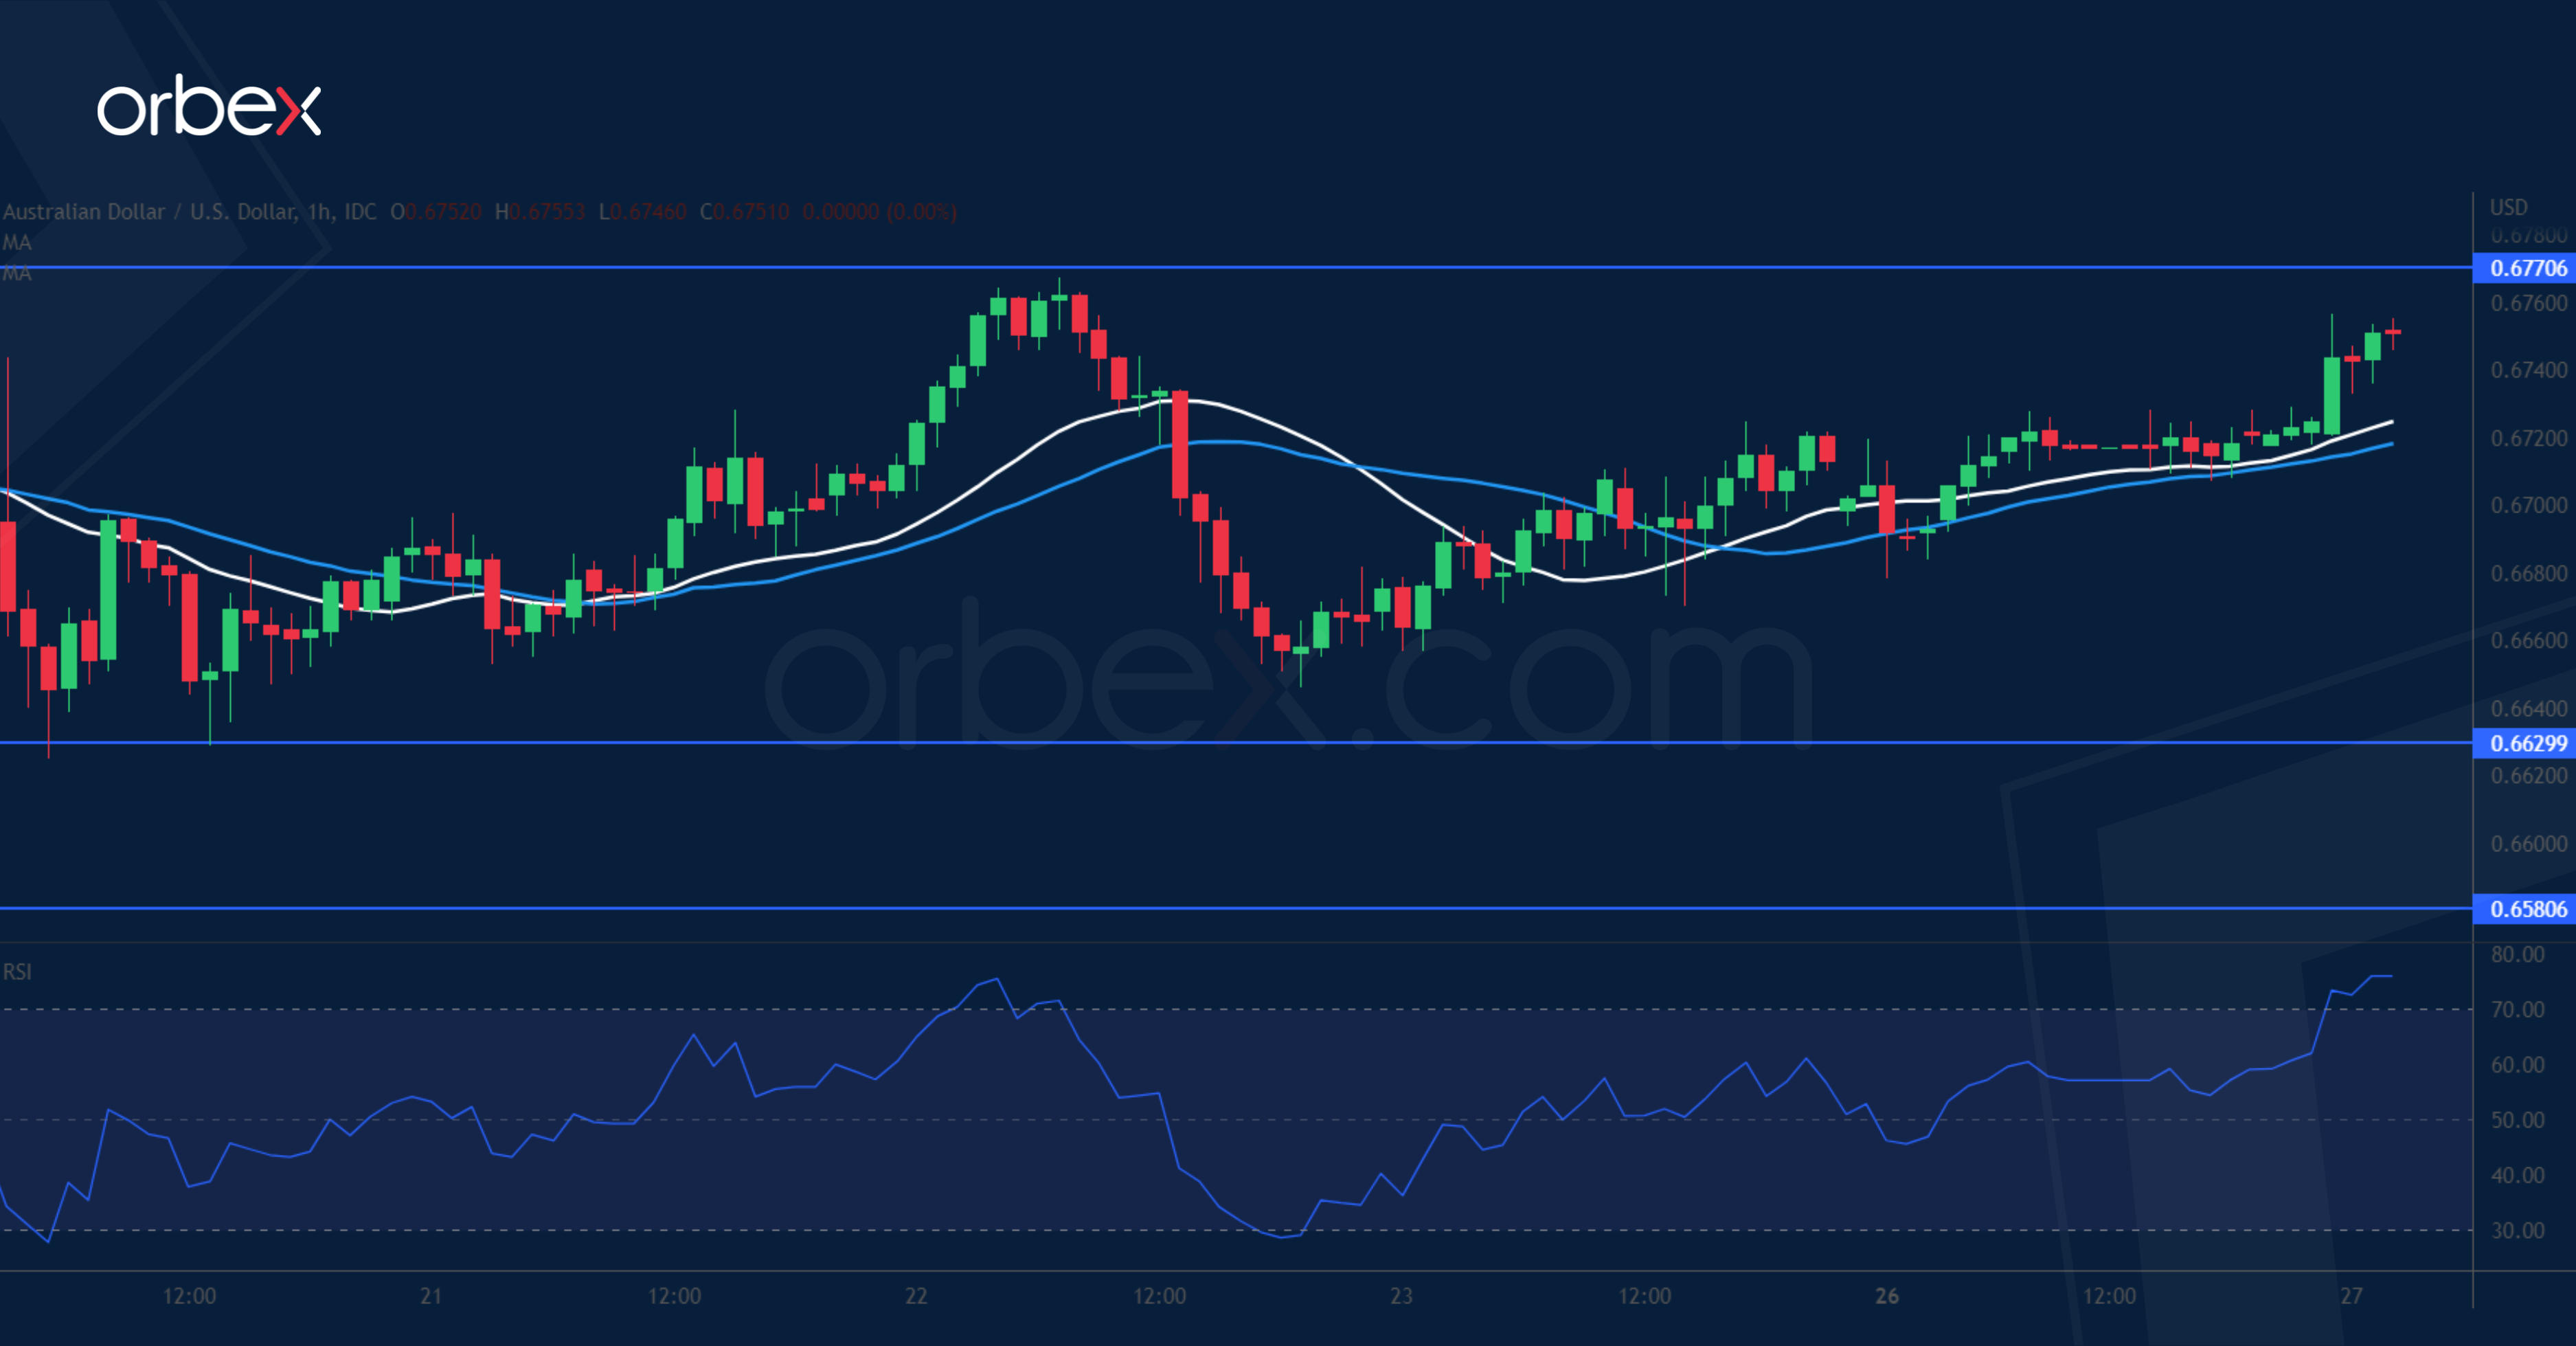
The Australian dollar recovers over a rebound in risk appetite. Stiff selling at September’s high of 0.6880 had put a dent to the market’s recovery mood. Short-term traders have taken some chips off the table after an initial fall below 0.6770 which has become a fresh resistance. The current bounce off 0.6630 will need to clear offers ahead before it could gain a solid foothold, then the previous high of 0.6880 would be next. A bearish breakout might put the aussie at the risk of a bearish continuation in the medium-term.
USD/CAD Seeks Support
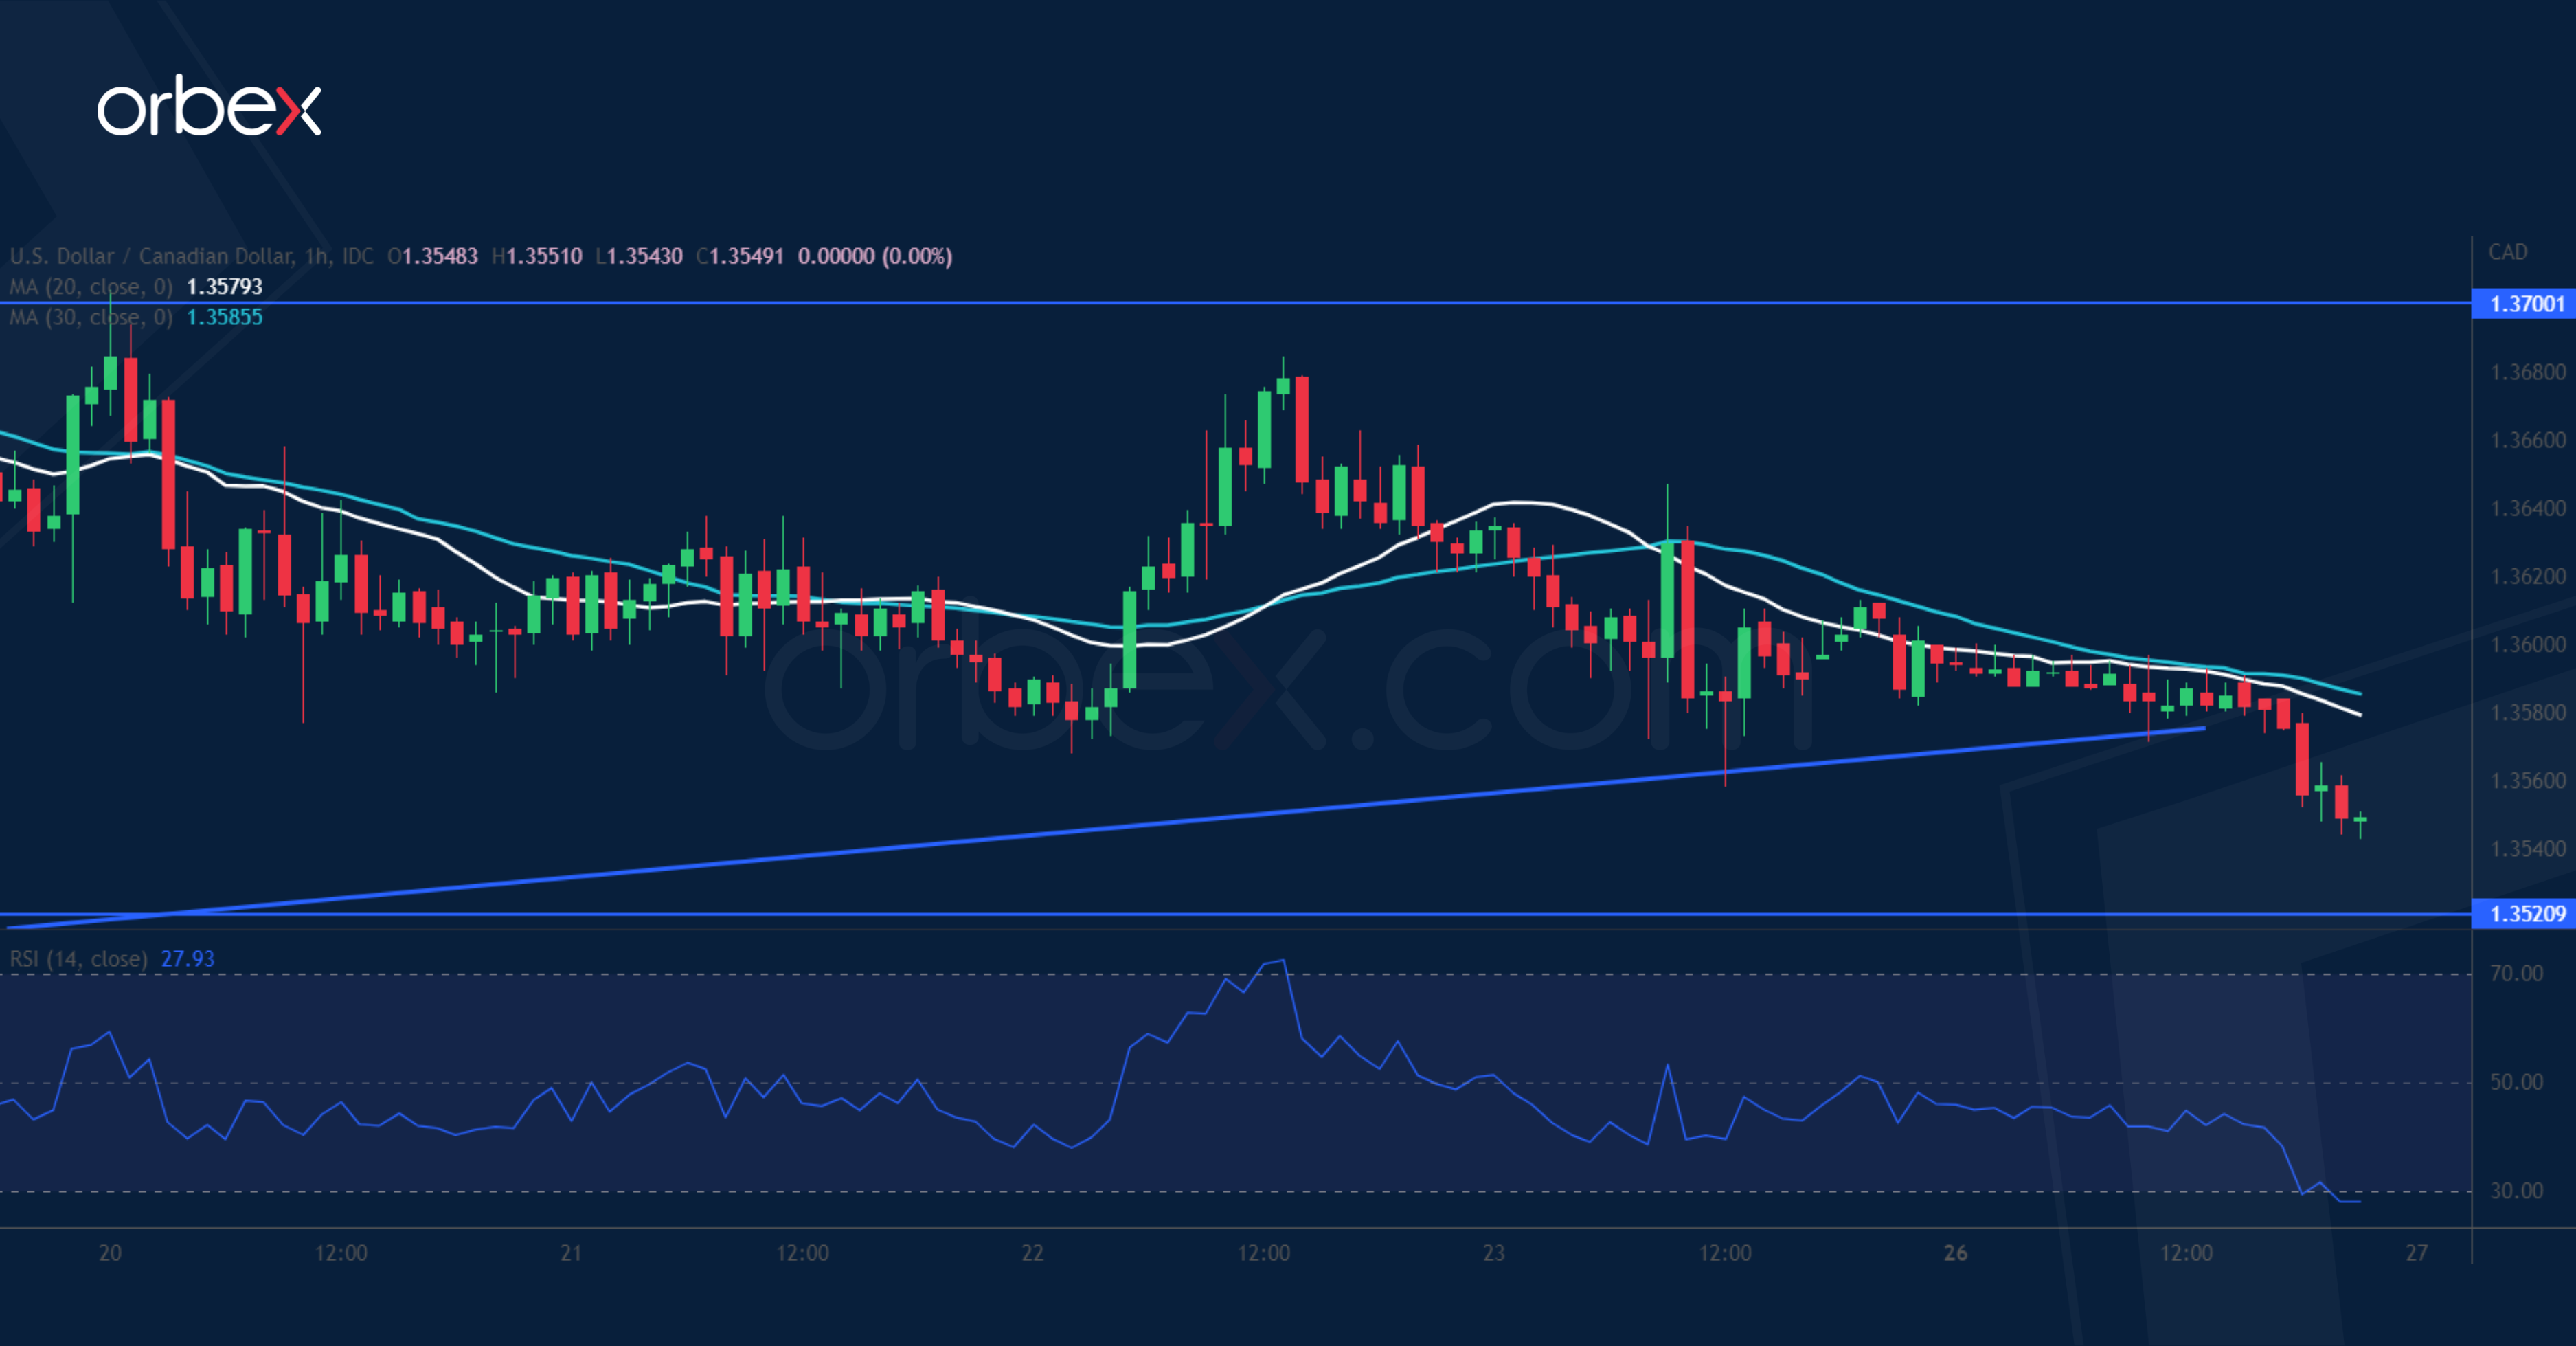
The Canadian dollar edged higher after its economy grew by 0.1% in October. The US counterpart had recovered along a rising trendline from mid-November but hit resistance in the supply zone between 1.3700 and last month’s high of 1.3800. A drop below the trendline has weighed on short-term sentiment, making 1.3520 the key support where a breach could cause a correction to 1.3400. The bulls will need to reclaim 1.3700 before the uptrend could regain traction in the medium-term.
Slow Week
It has been quite a quiet start to the week with many major markets still closed for Xmas holiday, but no one saw Santa coming this year, have you?
On the contrary, the Bank of Japan led drama across the global financial markets reminded that the year will certainly not end on a positive footage, even though the last trading week of the year is expected to be marked by a ‘Santa rally’.
A few encouraging news, however, could give a minor boost to equity markets.
First, released last Friday, the US PCE data, the Federal Reserve’s (Fed) favourite gauge of inflation fell to 5.5% in November, the core PCE slipped below 5% to 4.7%. Still more than twice the 2% policy target, but on the right path after all the tightening drama of 2022.
The latter gave a very small boost to US equities before Xmas, but it really didn’t help the S&P500 to reverse weekly losses. The index closed the week 0.20% lower than where it started. It is now below the major 38.2% Fibonacci retracement, meaning that we are now in the bearish consolidation zone and could expect a further and possibly a sustainable selloff below 3796, which is the 50% retracement level.
Second, the Chinese reopening continues, with news that the country will scrap Covid quarantines and lower Covid to a lower-threat disease. The news help the Chinese stocks gain at the start of the week. Yet, there is reportedly around 250 million new cases since the reopening, which will likely throw a shadow on the reopening glow.
But crude oil is up by around 15% since the December dip, and the Chinese reopening news could give a helping hand to oil bulls for an extension of the rally to the $88pb level.
GBP/JPY Daily Outlook
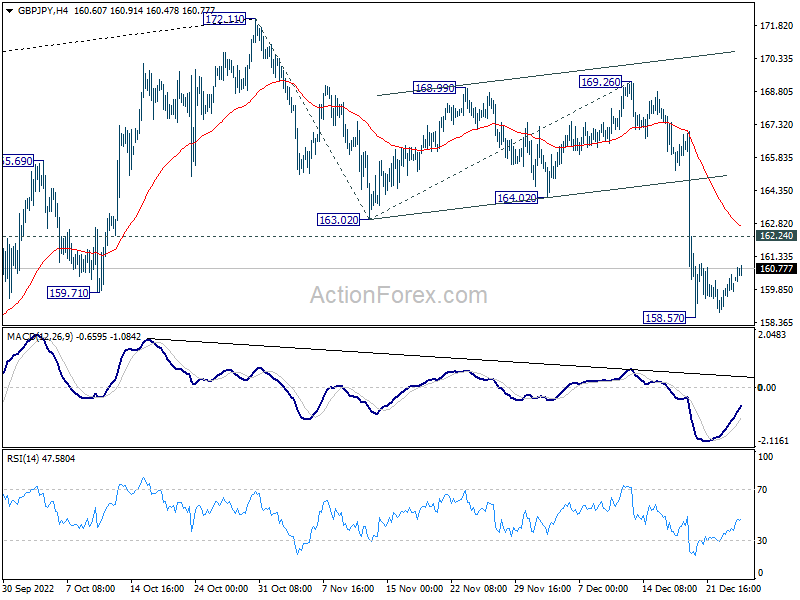
Daily Pivots: (S1) 159.65; (P) 160.37; (R1) 161.10; More...
Intraday bias in GBP/JPY stays neutral at this point. Further decline is expected as long as 162.24. Break of 158.57 will target 161.8% projection of 172.11 to 163.02 from 169.26 at 154.55 next. However, break of 162.24 will turn bias to the upside for stronger rebound.
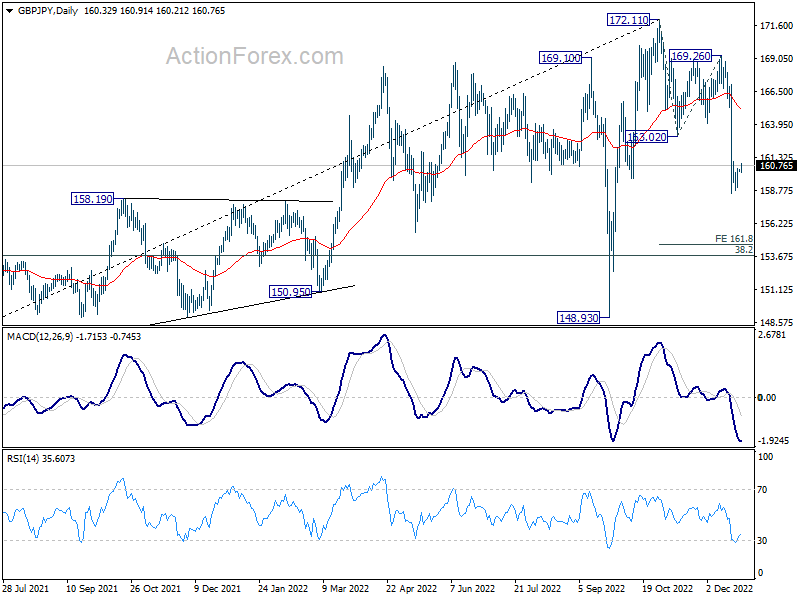
In the bigger picture, sustained break of 55 week EMA (now at 161.26) will confirm medium term topping at 172.11, on bearish divergence condition in weekly MACD. Fall from 172.11 should be correcting whole up trend from 123.94 (2020 low). Deeper decline should be seen to 38.2% retracement of 123.94 to 172.11 at 153.70 and possibly below. This will now remain the favored case as long as 55 day EMA (now at 166.11) holds.
EUR/JPY Daily Outlook
Daily Pivots: (S1) 140.58; (P) 141.12; (R1) 141.89; More....
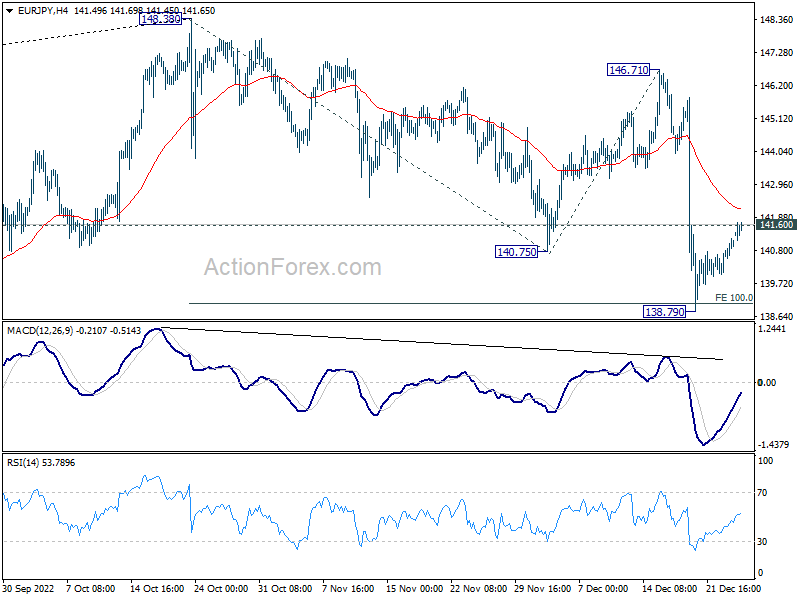
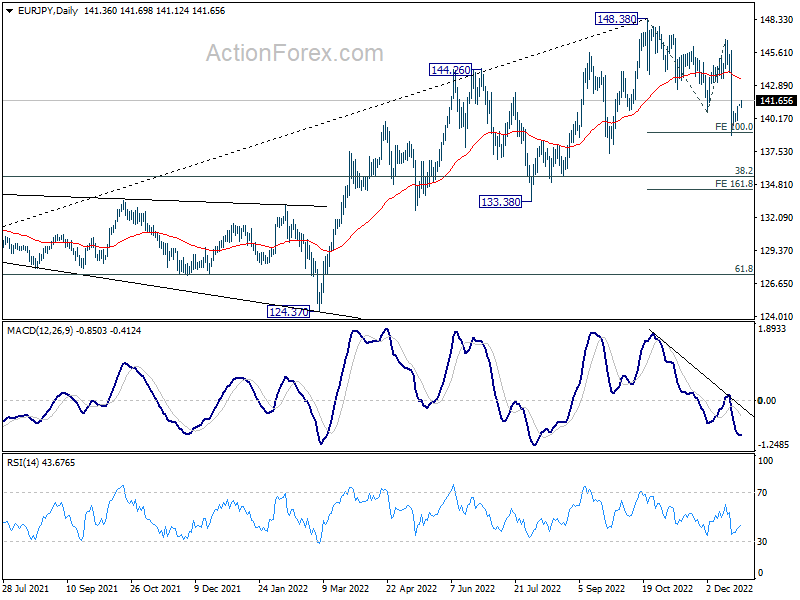
Intraday bias in EUR/JPY remains neutral with focus on 141.60 minor resistance. Firm break there will bring stronger rebound to 55 day EMA (now at 143.38). On the downside, break of 138.79 will resume the decline from 148.38 to 161.8% projection of 148.38 to 140.75 from 146.71 at 134.36.


In the bigger picture, as long as 55 week EMA (now at 138.54) holds, larger up trend from 114.42 (2020 low) is still in progress for 149.76 long term resistance. However, firm break of 55 week EMA will bring deeper fall to 38.2% retracement of 114.42 to 148.38 at 135.40 before completing the correction from 148.38.
EUR/GBP Daily Outlook
Daily Pivots: (S1) 0.8796; (P) 0.8806; (R1) 0.8823; More...
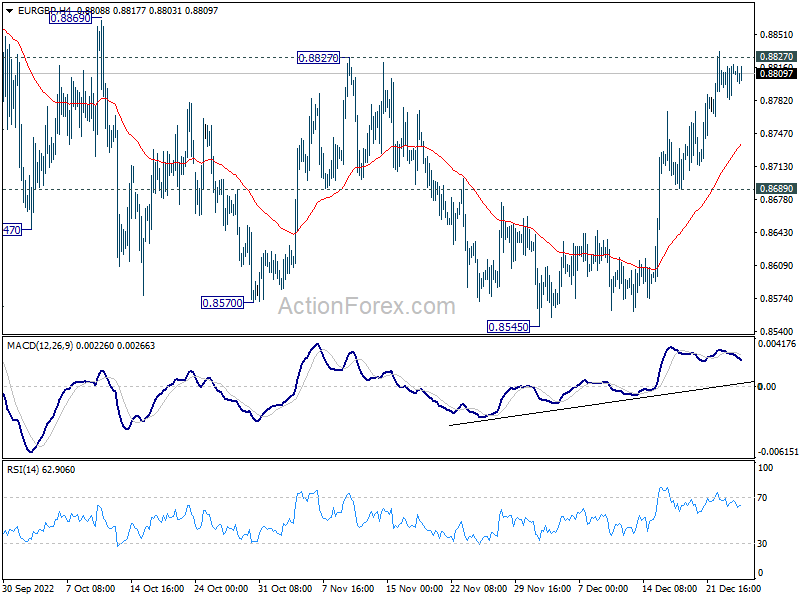
Intraday bias in EUR/GBP is turned neutral with 4 hour MACD crossed below signal line. On the upside, decisive break of 08827 resistance will argue that whole decline from 0.9267 has completed and turn near term outlook bullish. On the downside, break of 0.8689 minor support will bring retest of 0.8545 low, and retain near term bearishness.
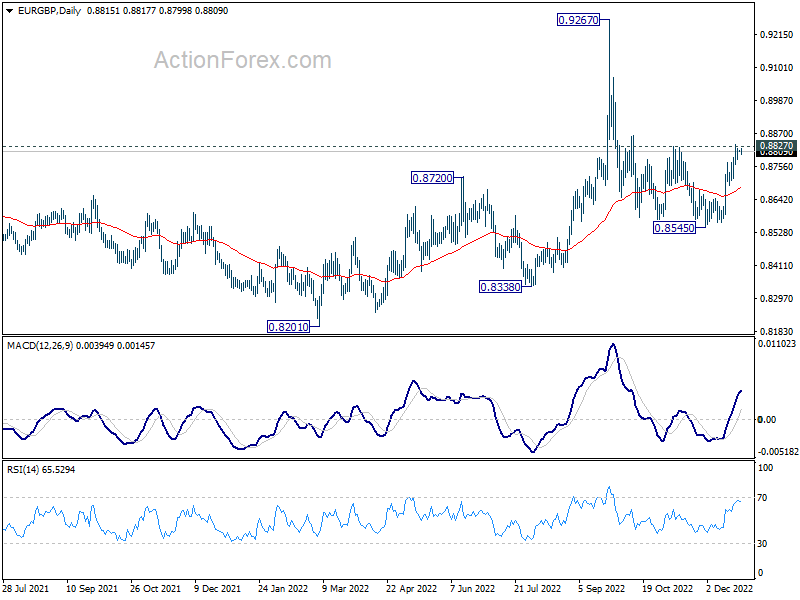
In the bigger picture, fall from 0.9267 is seen as a down leg inside long term range pattern. Deeper fall could be seen towards 0.8201/8338 support zone. But strong support should be seen there to bring reversal. Nevertheless, firm break of 0.8827 resistance will turn favor to the case that such decline is merely a correction in the up trend from 0.8201. That is, further rally would be seen at a later stage through 0.9267.
EUR/AUD Daily Outlook
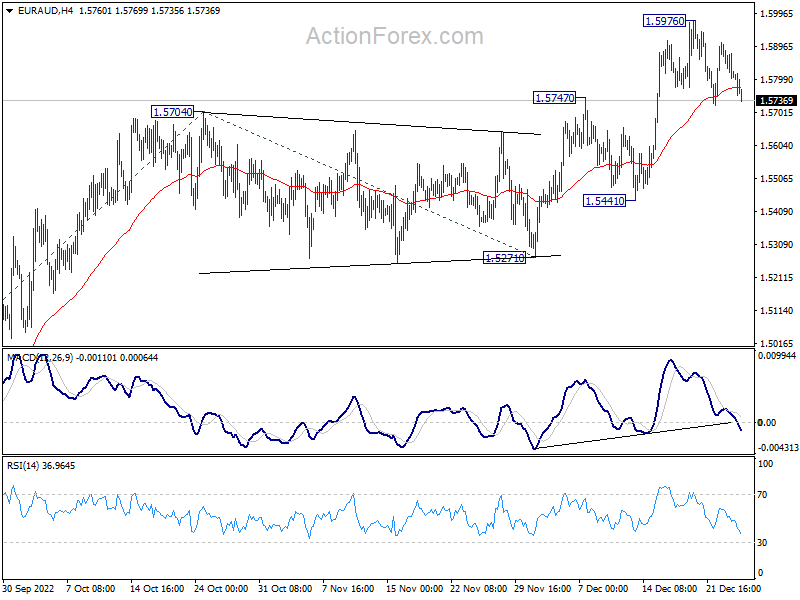
Daily Pivots: (S1) 1.5776; (P) 1.5829; (R1) 1.5865; More...
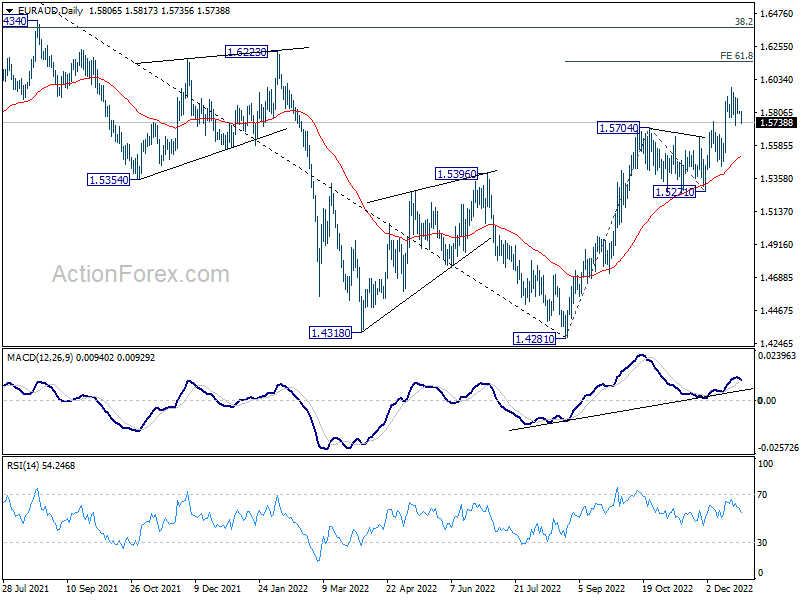
Intraday bias in EUR/AUD stays neutral as consolidation form 1.5976 is extending. Further rally will remain in favor as long as 1.5441 support holds. Break of 1.5976 will resume larger rise from 1.4281 to 61.8% projection of 1.4281 to 1.5704 from 1.5271 at 1.6150.
In the bigger picture, strong support from 55 day and 55 week EMA affirms underlying bullishness. As long as 1.5271 support holds, rise from 1.4281 medium term bottom is expected to continue to 1.6434 key resistance next. Decisive break there should confirm medium term bullish trend reversal.
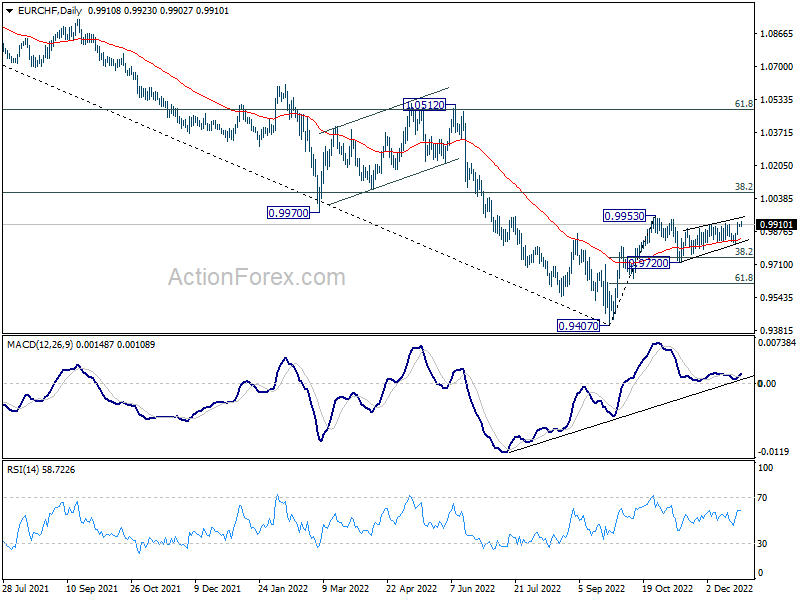
EUR/CHF Daily Outlook
Daily Pivots: (S1) 0.9899; (P) 0.9912; (R1) 0.9926; More....
Intraday bias in EUR/CHF remains neutral as consolidation from 0.9953 is still extending. On the upside, firm break of 0.9953 resistance will resume larger rally from 0.9407 to 1.0072 fibonacci level. However, break of 0.9720 will extend the decline from 0.9953 to 61.8% retracement of 0.8407 to 0.9953 at 0.9616.
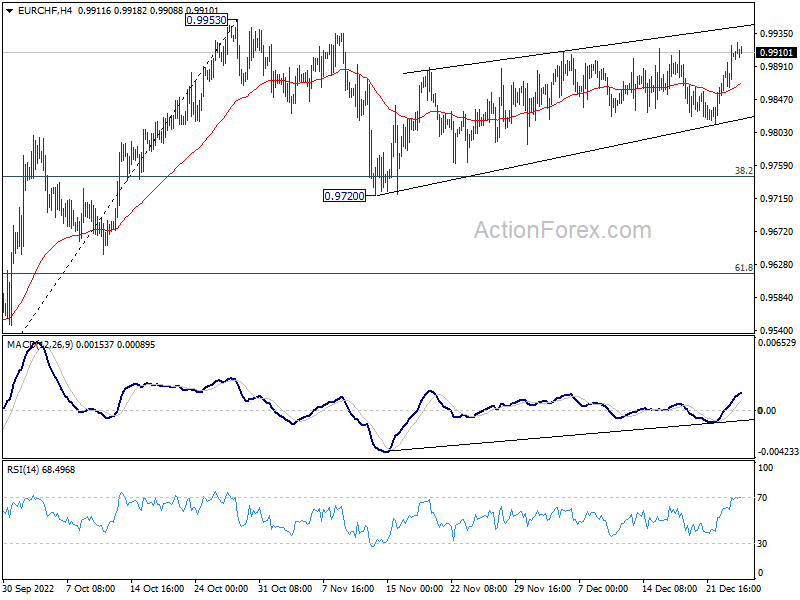
In the bigger picture, as long as 38.2% retracement of 1.1149 to 0.9407 at 1.0072 holds, price actions from 0.9407 medium term bottom will be treated as a corrective pattern. That is, long term down trend would resume through this low at a later stage. Nevertheless, firm break of 1.0072 will also have 55 week EMA (now at 1.0053) taken out. That would be an initial sign of long term bullish reversal.