

Sample Category Title
EUR/USD Could Correct Lower, Oil Price Eyes More Upsides
Key Highlights
- EUR/USD started a short-term downside correction from the 1.0735 zone.
- It traded below a key bullish trend line with support at 1.0605 on the 4-hours chart.
- GBP/USD corrected lower below the 1.2200 support zone.
- Oil price is eyeing an upside break above the $80 resistance zone.
EUR/USD Technical Analysis
The Euro started a decent increase above the 1.0500 level against the US Dollar. EUR/USD even climbed above the 1.0650 level before the bears appeared.
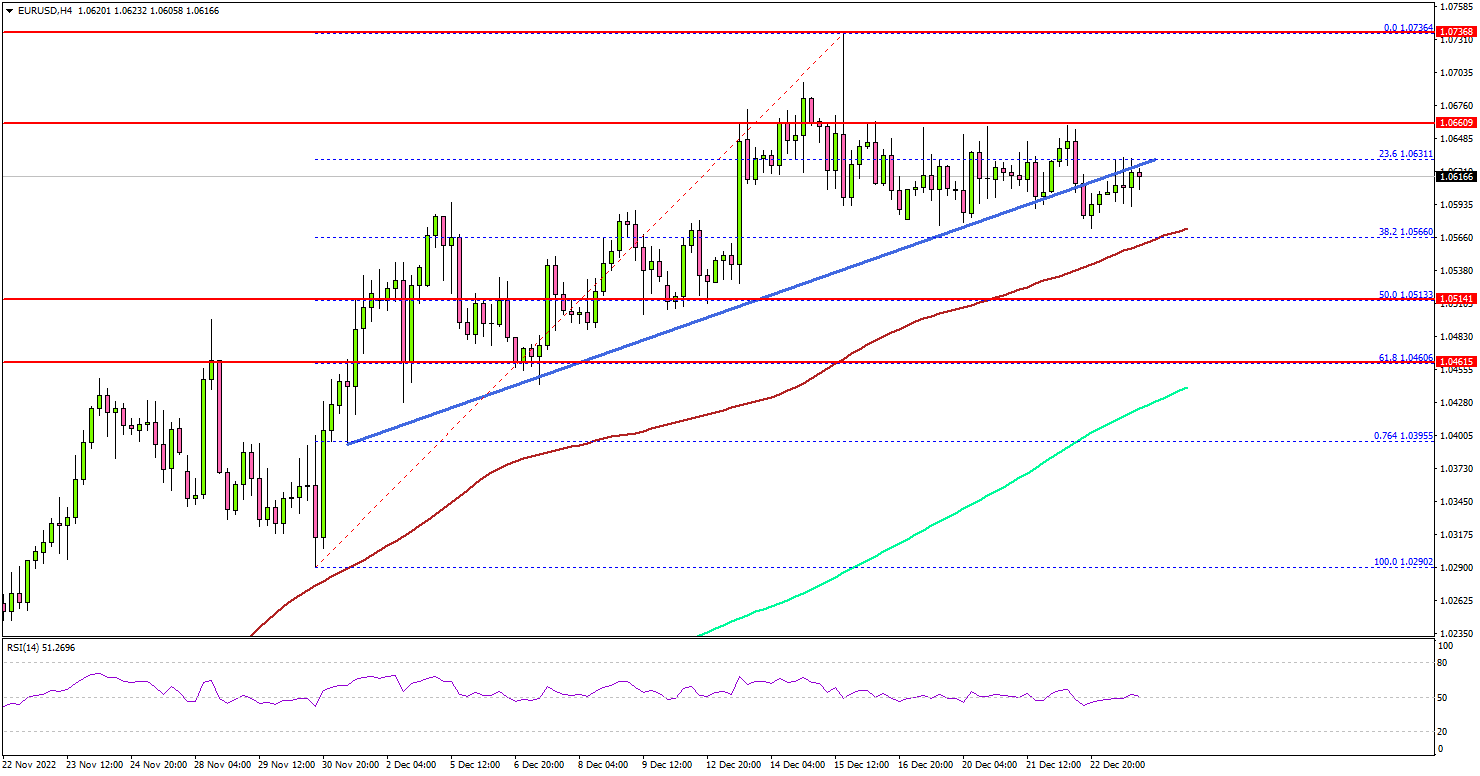
Looking at the 4-hours chart, the pair traded as high as 1.0736 before there was a downside correction. There was a minor decline below the 1.0650 support. There was also a break below a key bullish trend line with support at 1.0605 on the same chart.
The pair traded below the 23.6% Fib retracement level of the upward move from the 1.0290 swing low to 1.0736 high. It is now consolidating near the 1.0600 zone.
On the downside, there is a decent support forming near the 1.0570 zone and the 100 simple moving average (red, 4-hours). The next major support is near the 1.0520 zone or the 50% Fib retracement level of the upward move from the 1.0290 swing low to 1.0736 high.
A downside break below the 1.0520 zone might send the pair towards the 1.0450 level. Any more losses might open the doors for a move towards the 1.0400 support zone.
On the upside, an initial resistance is near the 1.0630 level. The next major resistance may perhaps be near 1.0650. A clear move above the 1.0650 resistance might start a steady increase.
In the stated case, EUR/USD may perhaps rise towards the 1.0700 level. Any more gains could lead the pair towards the 1.0750 resistance zone or the 1.0800 level.
Looking at crude oil price, the bulls seem to be in control and there are chances of more upsides abov the $80.00 resistance zone.
Economic Releases
- US Housing Price Index for Oct 2022 (MoM) - Forecast +0.8%, versus +0.1% previous.
- US Wholesale Inventories for Nov 2022 (preliminary) – Forecast +0.7%, versus +0.5% previous.
Summary 12/26 – 12/30
Monday, Dec 26, 2022
| GMT | Ccy | Events | Consensus | Previous |
|---|---|---|---|---|
| 23:50 | JPY | Corporate Service Price Index Y/Y Nov | 1.70% | 1.80% |
| 23:30 | JPY | Unemployment Rate Nov | 2.60% | 2.60% |
| 23:50 | JPY | Retail Trade Y/Y Nov | 3.80% | 4.40% |
| GMT | Ccy | Events | |
|---|---|---|---|
| 23:50 | JPY | Corporate Service Price Index Y/Y Nov | |
| Forecast: 1.70% | Previous: 1.80% | ||
| 23:30 | JPY | Unemployment Rate Nov | |
| Forecast: 2.60% | Previous: 2.60% | ||
| 23:50 | JPY | Retail Trade Y/Y Nov | |
| Forecast: 3.80% | Previous: 4.40% | ||
Tuesday, Dec 27, 2022
| GMT | Ccy | Events | Consensus | Previous |
|---|---|---|---|---|
| 05:00 | JPY | Housing Starts Y/Y Nov | 1.30% | -1.80% |
| 13:30 | USD | Goods Trade Balance (USD) Nov P | -96.9B | -99.0B |
| 13:30 | USD | Wholesale Inventories Nov P | 0.40% | 0.50% |
| 14:00 | USD | S&P/CS Composite-20 HPI Y/Y Oct | 8.00% | 10.40% |
| 14:00 | USD | Housing Price Index M/M Oct | -0.60% | 0.10% |
| 23:50 | JPY | BoJ Summary of Opinions | ||
| 23:50 | JPY | Industrial Production M/M Nov P | -0.20% | -3.20% |
| GMT | Ccy | Events | |
|---|---|---|---|
| 05:00 | JPY | Housing Starts Y/Y Nov | |
| Forecast: 1.30% | Previous: -1.80% | ||
| 13:30 | USD | Goods Trade Balance (USD) Nov P | |
| Forecast: -96.9B | Previous: -99.0B | ||
| 13:30 | USD | Wholesale Inventories Nov P | |
| Forecast: 0.40% | Previous: 0.50% | ||
| 14:00 | USD | S&P/CS Composite-20 HPI Y/Y Oct | |
| Forecast: 8.00% | Previous: 10.40% | ||
| 14:00 | USD | Housing Price Index M/M Oct | |
| Forecast: -0.60% | Previous: 0.10% | ||
| 23:50 | JPY | BoJ Summary of Opinions | |
| Forecast: | Previous: | ||
| 23:50 | JPY | Industrial Production M/M Nov P | |
| Forecast: -0.20% | Previous: -3.20% | ||
Wednesday, Dec 28, 2022
| GMT | Ccy | Events | Consensus | Previous |
|---|---|---|---|---|
| 09:00 | CHF | Credit Suisse Economic Expectations Dec | -57.5 | |
| 15:00 | USD | Pending Home Sales M/M Nov | -1.20% | -4.60% |
| GMT | Ccy | Events | |
|---|---|---|---|
| 09:00 | CHF | Credit Suisse Economic Expectations Dec | |
| Forecast: | Previous: -57.5 | ||
| 15:00 | USD | Pending Home Sales M/M Nov | |
| Forecast: -1.20% | Previous: -4.60% | ||
Thursday, Dec 29, 2022
| GMT | Ccy | Events | Consensus | Previous |
|---|---|---|---|---|
| 09:00 | EUR | Eurozone M3 Money Supply Y/Y Nov | 5.00% | 5.10% |
| 13:30 | USD | Initial Jobless Claims (Dec 23) | 225K | 216K |
| 15:30 | USD | Natural Gas Storage | -87B | |
| 16:00 | USD | Crude Oil Inventories | -5.9M |
| GMT | Ccy | Events | |
|---|---|---|---|
| 09:00 | EUR | Eurozone M3 Money Supply Y/Y Nov | |
| Forecast: 5.00% | Previous: 5.10% | ||
| 13:30 | USD | Initial Jobless Claims (Dec 23) | |
| Forecast: 225K | Previous: 216K | ||
| 15:30 | USD | Natural Gas Storage | |
| Forecast: | Previous: -87B | ||
| 16:00 | USD | Crude Oil Inventories | |
| Forecast: | Previous: -5.9M | ||
Friday, Dec 30, 2022
| GMT | Ccy | Events | Consensus | Previous |
|---|---|---|---|---|
| 08:00 | CHF | KOF Leading Indicator Dec | 90.9 | 89.5 |
| 14:45 | USD | Chicago PMI Dec | 41.2 | 37.2 |
| GMT | Ccy | Events | |
|---|---|---|---|
| 08:00 | CHF | KOF Leading Indicator Dec | |
| Forecast: 90.9 | Previous: 89.5 | ||
| 14:45 | USD | Chicago PMI Dec | |
| Forecast: 41.2 | Previous: 37.2 | ||
The Weekly Bottom Line: Results of Inflation Fight Will Show Next Year
U.S. Highlights
- The Bank of Japan surprised markets by tweaking its yield curve control policy. The move propped up the Yen and sent equities lower, with smaller reverberations following across global markets.
- Core PCE inflation eased to 4.7% year-on-year (y/y) in November from 5% in October, coming in only a hair above the market consensus forecast. Meanwhile, total PCE inflation cooled to 5.5% from 6.1% in the month prior.
- Existing home sales fell 7.7% month-over-month (m/m) in November, extending their losing streak to ten months. Activity has now fallen to levels last seen during the housing crash. Housing starts fell 0.5% (m/m) in November.
Canadian Highlights
- A trio of key Canadian economic data releases this week meant there was no settling down for long winter’s naps for economists.
- Overall, the data points to slower growth to end the year, but that inflation has a long way to go before the Bank of Canada is comfortable with it.
- Even so, as we outlined in Dollars & Sense, we expect the Bank of Canada to pause on rate hikes ahead of the Fed, due to the Canadian economy’s heightened sensitivity to higher rates.
U.S. - Results of Inflation Fight Will Show Next Year
2022 is winding down, but as the economic developments of this week show, it is not going quietly into the night. Across the Pacific, in a surprise move, the Bank of Japan (BOJ) adjusted its yield curve control policy by allowing the 10-year government bond yield to rise as high as 0.5% from a previous cap of 0.25%. The change propped up the Yen and sent equities lower, with smaller reverberations following across global markets. While the BOJ didn’t tie the move to inflation, it comes at the time when Japan’s core inflation has hit a 40-year high. In the face of rising price growth though, any signal of a ‘pivot’ from the last major central bank that has been sticking with ultra-loose monetary policy is worth closely watching.
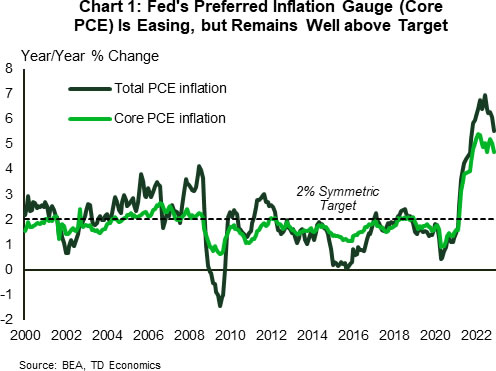
Here at home, total PCE inflation slowed to 5.5% (y/y) in November from 6.1% the month prior. Meanwhile, the Fed’s preferred inflation gauge, core PCE, eased to 4.7% from 5% in the month prior. Of note, the three-month annualized pace of core PCE (3.6%) dropped below the Fed policy rate (4.5%). This restrictive monetary setting will continue to test the resilience of the American consumer. Speaking of the latter, real spending growth slowed in November, holding flat from the month prior. This as decent growth in services (0.3% m/m) roughly evened out with a more pronounced decline in goods spending (-0.6% m/m).
Circling back to inflation, the PCE report’s key message is that while moving in the right direction it is still well above target (Chart 1). With the Fed’s recent signaling in mind, we anticipate it will lift the policy rate by another 50 basis points (bps) in the first quarter of 2023 to 5%, before taking a long pause to assess the impact.
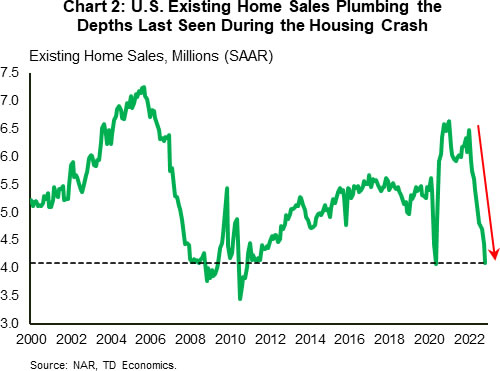
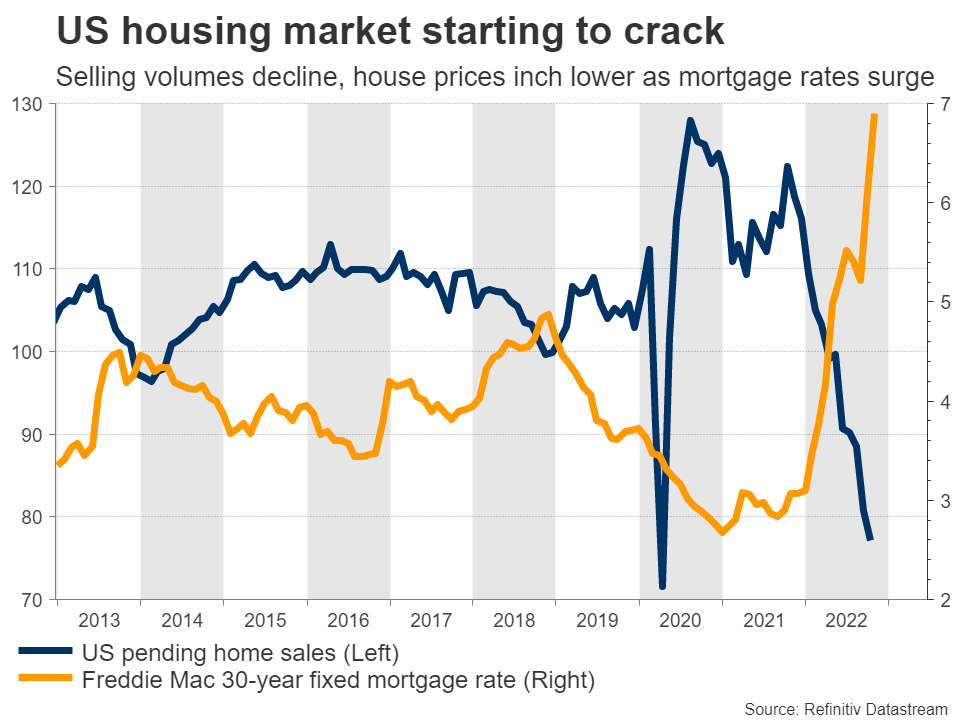
Monetary policy changes tend to work with a lag, but interest-sensitive areas of the economy such as housing, where the impact is more immediate, continue to show considerable bruising. Existing home sales fell a sharp 7.7% in November, extending their losing streak to ten months. Resale activity is now plumbing the depths last seen during the housing crash (Chart 2). In this vein, it is no wonder that builders continue to ease off the accelerator, with housing starts declining for the third consecutive month in November (-0.5% m/m). A sharp pullback in multifamily permits (-16.4% m/m) suggests that the weakness in homebuilding may be spilling over to this (so far) resilient sector.
Mortgage rates have fallen roughly 70 bps over the last few weeks, which suggests that some near-term improvement in home sales could be in the cards. Ultimately though, even with the latest easing in mortgage rates to 6.3%, housing affordability remains strained, which means that a sustained turnaround in activity is still some ways away. We believe that the housing weakness will continue over the next several quarters, with home prices (already in retreat) falling roughly 10% peak-to-trough. Among other things, this view is based on expectations for a softening in labor market conditions, with the unemployment rate projected to rise 1.5 percentage points ahead. While we don’t anticipate an outright contraction in economic output next year, with U.S. growth projected to be cut roughly in half to 0.9%, the margin for error is indeed thin. All told, 2023 will bring forth not only the benefits but also the costs of the Fed’s aggressive hiking cycle.
Canada – Bah, Humbug! to 2022
After a such a turbulent year for financial markets (chart on page 1), it is understandable that many investors may be saying bah, humbug! to festive celebrations. Russia's war in Ukraine and the fastest increase in bond yields in a generation have taken a toll on markets and the economy. The S&P TSX fared better than other global bourses, thanks to its weighting towards energy producers. The last time Canadian equity markets were down to this extent was in 2018 – when the Bank of Canada and the Fed were last in rate hike mode.
No settling down for a long winter's nap yet either with a trio of key economic data releases over the past week. Overall, the data paint a picture of stubbornly high inflation and consumer purchasing power getting pinched.
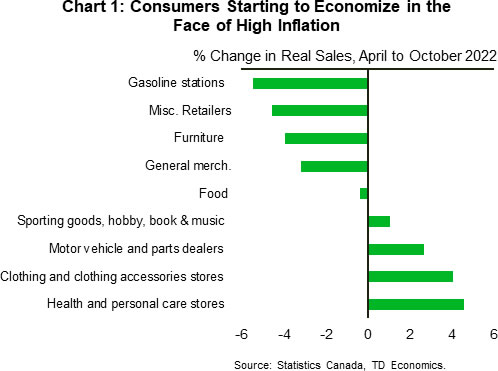
The headline for October retail sales seemed impressive on the surface – a 1.4% month-on-month increase. However, that was entirely due to higher prices, with real sales flat. Looking at sales by category, it is clear consumers have started to cut back on some of the areas that have seen the biggest price increases – notably on gasoline (Chart 1). Sales volumes are also weakening for furniture and appliances, in line with the cooling in the housing market.
Statistics Canada's advance estimate for retail sales in November also pointed to a 0.5% m/m decline. The fourth quarter is shaping up to be quite modest for consumer spending, but to remain positive, boosted by stronger sales of motor vehicles, which had been restrained earlier in the year by shortages.
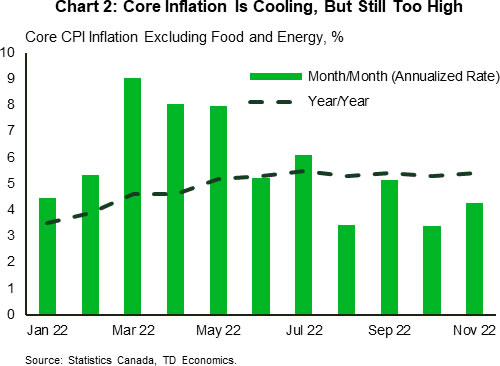
Inflation continues to be the most closely watched economic indicator, and it only tiptoed in the right direction in November thanks to lower gasoline prices. Headline inflation was still very high at 6.8% y/y, and one measure of core inflation – excluding food and energy – is proving quite persistently above the Bank of Canada's target, at 5.4% y/y in November. As shown in Chart 2, the monthly changes have been running below 5% on an annualized basis over the past four months, but at 4.3% in November is still running well above the 2% pace the Bank of Canada aims for. Still, this is consistent with our recent forecast, which projected inflation to cool gradually.
Our forecast also called for fourth quarter growth of just shy of 1%. October's monthly GDP by industry data, the last release of the week, saw a modest 0.1% m/m increase, and the flash estimate is pointing to another 0.1% m/m improvement in November. This puts Q4 growth at about 1%, very slightly above our forecast.
Looking ahead, 2023 is expected to be a challenging year for the Canadian economy. We expect the Bank of Canada to pause on rate hikes ahead of the Fed (see Dollars & Sense). Canadian household's high indebtedness means that rate hikes weigh more heavily here, and the impact of higher rates is only beginning to be felt by household borrowers
Weekly Economic & Financial Commentary: Mixed Data to End 2022
Summary
United States: Naughty & Nice: Mixed Data to End 2022
- This week's data showed that the U.S. economy is ending the year on a mixed note. The housing market generally showed further signs of deterioration in November, and data on durable goods orders were generally weaker than expected, when backward revisions to previously released data are taken into account. That said, data on consumer confidence shows that consumers are less downbeat at present than they were a few months ago.
- Next week: S&P Case-Shiller Home Price Index (12/27), ISM Manufacturing (1/4), Nonfarm Payrolls (1/6)
International: Bank of Japan Tweaks Its Accommodative Monetary Policy Stance
- In a surprise move, the Bank of Japan (BoJ) tweaked its yield curve control policy at its December monetary policy meeting, widening the tolerance band for its 10-year Japanese government bond (JGB) yield to +/- 50 bps, around a 0% target. The BoJ emphasized that the change in policy was not a form of monetary tightening, but was designed to enhance the sustainability of its current monetary policy. While the policy tweak has added uncertainty to the BoJ outlook, we continue to lean toward BoJ policymakers making no further policy adjustments through the end of 2023.
- Next week: Japan Retail Sales/Industrial Output (12/27, 12/28), Swiss KOF Leading Indicator (12/30), China PMIs (12/31)
Credit Market Insights: Not All Rate Hikes Are Created Equally
- How quickly rate hikes are transmitted through the economy depends not only on how high policy rates are lifted, but also structural elements of an economy. Generally, a higher level of household debt, higher interest servicing costs, as well as a larger proportion of variable rate mortgages to fixed rate mortgages tends to indicate more sensitivity to rate hikes.
Topic of the Week: Population Growth Picks Up Slightly in 2022
- One negative knock-on effect of the pandemic was a considerable slowdown in population growth. Fortunately, the trend appears to be reversing somewhat. According to the Census Bureau, U.S. population growth picked up 0.4% between July 2021 and July 2022, still slow by historical standards, but an improvement from the record-low 0.2% rate from the year-earlier period.
Week Ahead – Happy Holidays!
US
Thin trading conditions could persist as much of Wall Street will be taking off this week. While trading volumes might be lower it will be a week filled with lots of economic readings. There will be no earnings and no Fed speak.
On Monday, US markets will be closed to observe the Christmas holiday. Tuesday contains several economic releases that are expected to show the economy is weakening. Wholesale inventories in November are expected to increase at a slower pace, both the October readings for the FHFA house price index and S&P Corelogic Case-Shiller releases will show the housing market continues to weaken. The Dallas Fed Manufacturing Activity report could show business activity remains depressed. On Wednesday, the December Richmond Fed Manufacturing index is expected to continue its downtrend, while November pending home sales weaken. Thursday contains both weekly initial jobless claims and the MNI Chicago PMI reading that might show a rebound.
EU
There are no releases out of Germany. Spain will release retail sales and CPI.
UK
Strike action continues to dominate UK headlines over the festive period. On Friday, the Nationwide House Price Survey should show the housing market is in bad shape.
Russia
There are a host of events from Russia next week. With the Ukraine war and Western sanctions draining the Russian economy, the CPI and GDP releases will be of particular interest. Russia will also release industrial production and unemployment.
South Africa
Money supply and trade data will be released.
China
The focus will remain on China’s reopening and over how this COVID surge tests their health systems. In addition to China’s reopening, traders will pay close attention to how much further China’s PMIs drop into contraction territory. A significant drop with these upcoming economic readings will bolster the case for the PBOC to cut rates next quarter.
India
India will release the November fiscal deficit data and the eight core industries overall growth rate.
Australia & New Zealand
It is expected to be a quiet week for both Australia and New Zealand.
Japan
The Bank of Japan stole the show last week, as it widened the yield curve from 25 to 50 basis point and sent the yen soaring. The move was completely unexpected as the markets hadn’t anticipated any major policy moves before Governor Kuroda ends his term in April. The BoJ will release the Summary of Opinions from the meeting during the week, which will give investors the opportunity to read the details of the dramatic meeting. Japan will also release unemployment and retail sales and industrial production.
Singapore
On Friday, the release of Singapore’s money supply data will be released.
Markets
Energy
Energy traders will pay close attention to the arctic blast that could impact US refineries. Crude flows could see significant disruptions as Lyondell Houston Refinery and Exxon Beaumont reportedly are having issues.
A close eye will be kept on Russia now that they have signaled they could cut oil output by 5-7%. Lower production from Russia and if US supplies go offline, oil could continue to rise.
Gold
Gold hovers around the $1800 as Wall Street becomes more confident that disinflation trends will continue. Another round of economic data is painting a picture that consumers and businesses are weakening and that should help keep pricing pressures coming down. The economy is still recession bound and if inflation continues to cool, gold demand should improve in the New Year.
Cryptos
Bitcoin looks like it might be finding a home between the $16,000 and $17,000 zone. The Crypto industry has been rather constructive over Core Scientific’s bankruptcy, but investors still remain stuck in wait-and-see mode to see if any other major collapses occur.
Monday, Dec. 26
Economic Events:
- BOJ Governor Kuroda speaks at the Keidanren Councillors meeting.
- Christmas Day holidays are observed in the US and Europe (no stock or bond trading).
Tuesday, Dec. 27
Economic Data/Events:
- China industrial profits
- Japan unemployment, retail sales
- Mexico international reserves
- US wholesale inventories
- Norway retail sales
- Finland confidence
- UK markets closed
Wednesday, Dec. 28
Economic Data/Events:
- Japan industrial production
- Mexico unemployment
- Russia industrial production, unemployment
- Switzerland Credit Suisse survey expectations
- Sweden trade, household lending
- BOJ Summary of Opinions
Thursday, Dec. 29
Economic Data/Events:
- US initial jobless claims
- Hong Kong trade
- Thailand trade
- South Korea industrial production
- Spain retail sales
- Finland house prices
- ECB publishes Economic Bulletin.
- US Census Bureau releases annual projection of the nation’s population.
- Italian PM Meloni expected to speak
- Bank of Portugal releases data on banking system
Friday, Dec. 30
Economic Data/Events:
- US bond market closes early at 2pm EST
- Russia CPI, GDP
- Spain CPI
- Spain inflation preliminary
- Portugal inflation preliminary
Canada and U.S. Labour Market Reports to Kick off the New Year
Forward Guidance will be on vacation next week, Happy Holidays!
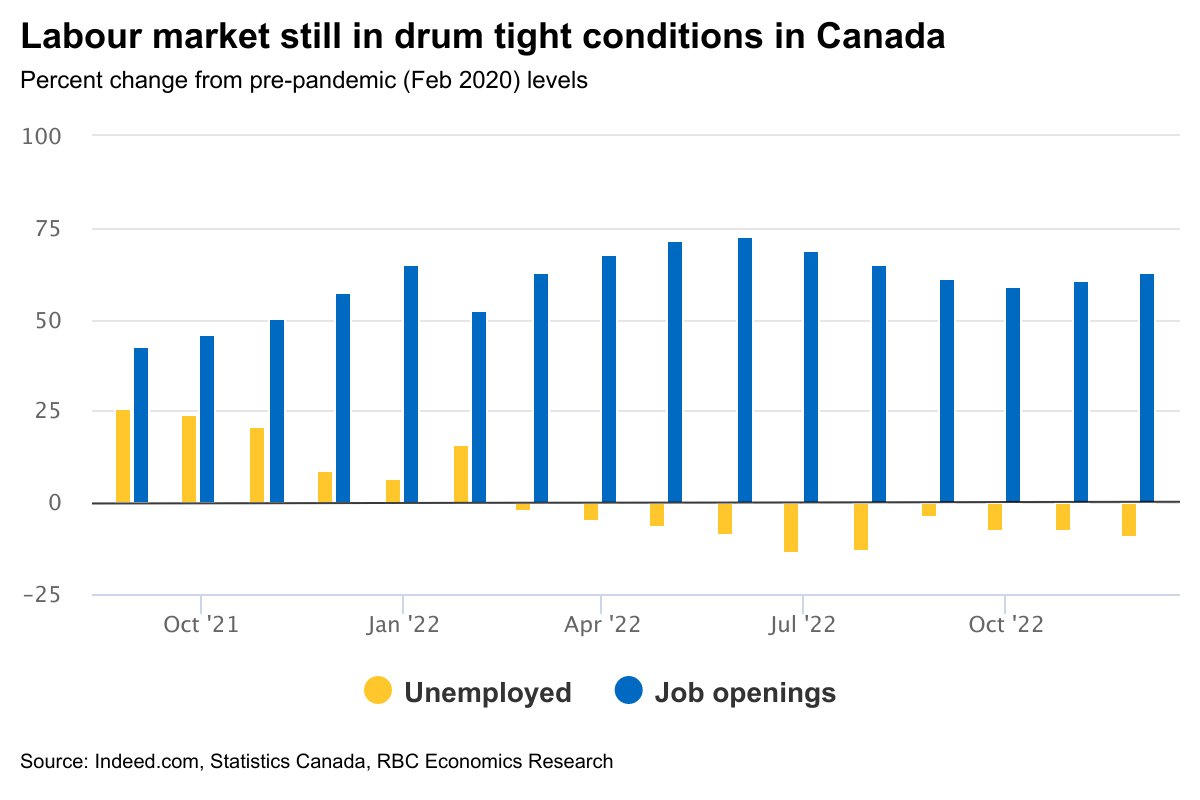
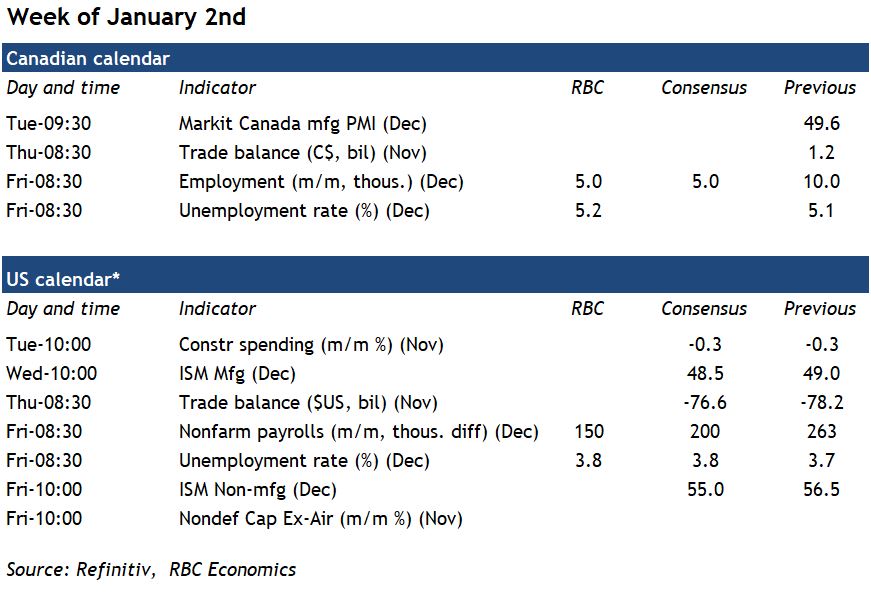
A quiet Christmas holiday week will have few economic data releases in North America. But the first week of 2023 will kick off with December labour market reports for the U.S. and Canada. Labour shortages are still a bigger issue than a lack of hiring demand in both economies – job openings continue to run well-above pre-pandemic levels and unemployment rates are still very low. Still, there have been early signs of softening in the outlook and we look for the Canadian unemployment rate to tick up to 5.2% on a soft 5k increase in employment. Employment growth in Canada has been volatile, but essentially flat on average over the last 6 months with declines over the summer offset by gains in October and November. The unemployment rate has ticked up from the record low (dating back to at least 1976) 4.9% earlier in the summer but is still well-below pre-pandemic levels. As a result of tight labour market conditions, wage growth has been accelerating. Average hourly earnings growth from a year ago ticked up to 5.6% in November. But we continue to expect inflation and the lagged impact of the aggressive interest rate hikes of 2022 to cut into household purchasing power and slow hiring demand in the New Year.
Job growth has been more resilient in the United States – and we look for another 150k positions to be added in December. But, there too, the pace of improvement has been slowing and the unemployment rate has ticked up from summer lows. There is still substantial momentum near-term in labour markets with the level of job openings still very high. But hiring demand will slow in 2023 as higher interest rates begin to slow the economy down more significantly.
Week ahead data watch
The Canadian international trade surplus likely narrowed in November. A 3% pull-back in oil prices will lower the energy trade balance and a stronger Canadian dollar will lower the prices of both exports and imports in Canadian dollar terms. Imports of equipment (a key indicator of domestic business investment) will be watched closely after a sharp decline in October.
Week Ahead – Markets Quiet Down for Holidays, Liquidity in Control
A quiet week lies ahead for FX markets as the year draws to a close. The spotlight will fall on the Bank of Japan’s summary of opinions, which will add some color around the recent decision to raise the yield ceiling that propelled the yen higher. More broadly, liquidity will be in short supply, making sharp market moves possible without any news catalyst.
BoJ boosts yen
In a surprise move, the Bank of Japan adjusted its yield curve control strategy this week, widening the range in which long-dated Japanese yields are allowed to trade. Governor Kuroda downplayed the action as simply ‘fine-tuning’ of policy to ensure smooth functioning in the nation’s bond market, stressing it wasn’t really tightening.
But market participants didn’t see it that way. With inflation firing up and the government preparing to roll out a $200bn stimulus package, investors saw this move as laying the groundwork for proper rate increases next year.
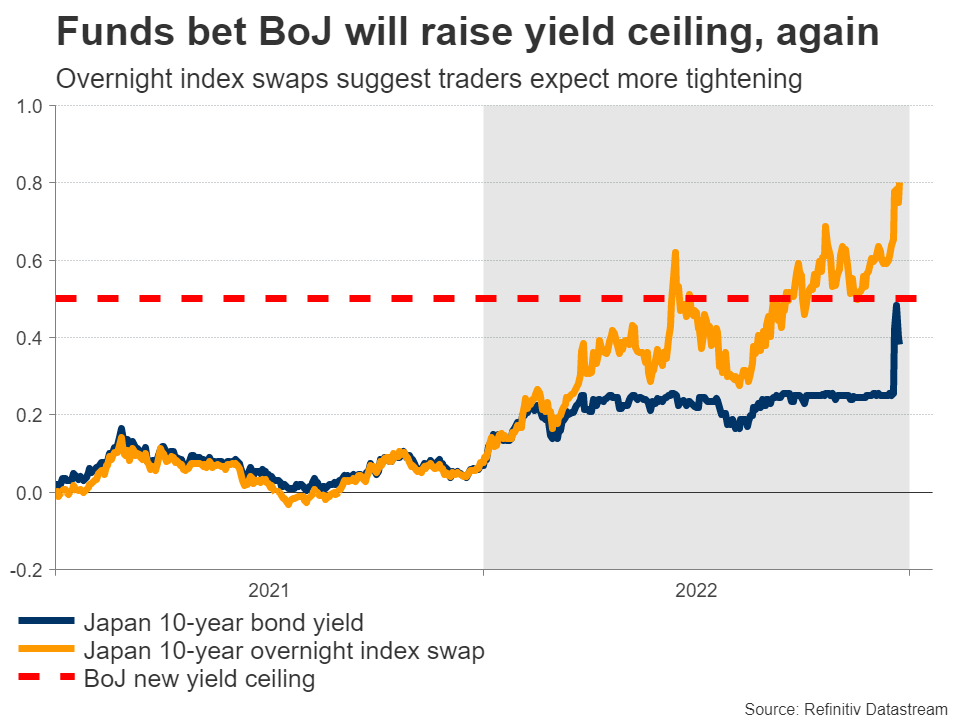
Markets now expect the BoJ to exit negative rates by April, pricing in a 15bps rate hike that would bring rates back above zero. That’s when a new BoJ Governor will take over, so traders are essentially betting that the change in leadership will usher in a new era of monetary tightening in Japan.
In this respect, the summary of opinions from the BoJ’s December meeting will be closely watched on Wednesday. This release is similar to the meeting minutes. It contains less detail, but it’s released much sooner, elevating its importance. Traders will look for any hints around future policy tweaks - was this really a one-off move like Kuroda suggests or the first step in a process?
As for the yen, the tide has started to turn, setting the stage for a comeback next year. Most of the forces that ravaged the currency this year - interest rate differentials, a trade shock arising from soaring energy prices, and a lack of tourism - are fading away.
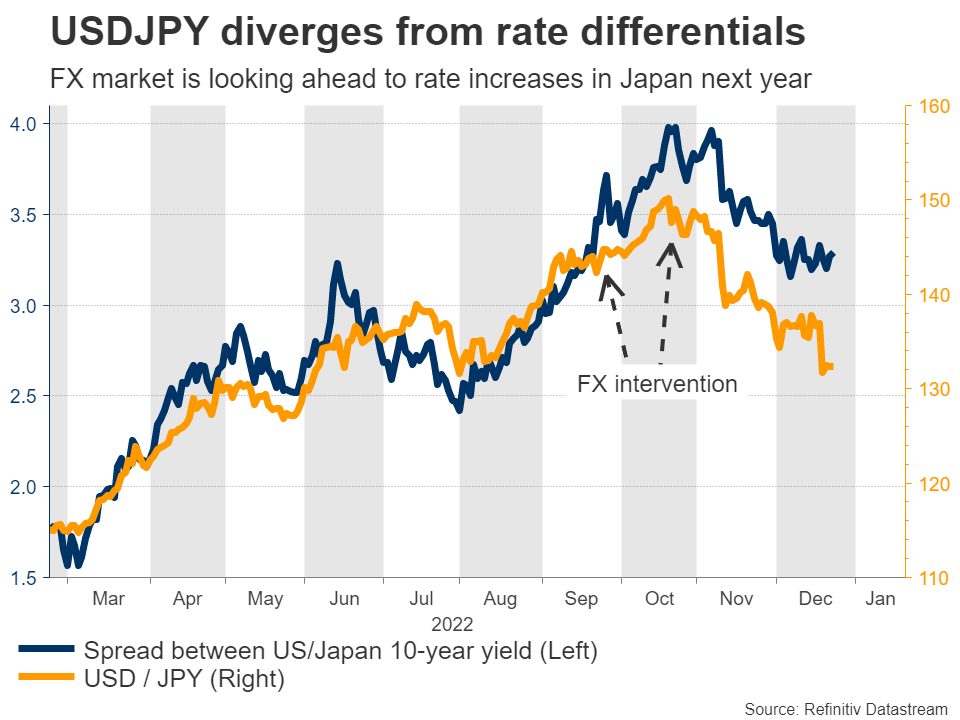
Tourists are allowed back on the island, while oil prices have declined to trade almost unchanged for the year. Most importantly, the BoJ might be tightening next year as foreign central banks stop their own tightening cycles, which alongside recessionary concerns might help compress yield differentials back in the yen’s favor.
The biggest undecided variables are who will replace Kuroda as BoJ Governor and how much wages will rise when the labor negotiations conclude. Both events are scheduled for the spring, so the next few months will be critical for the yen.
Second-tier US data
Over in America, Monday is a public holiday, so markets will remain closed. The rest of the week is relatively calm, with the only noteworthy data releases being Wednesday’s pending home sales and a variety of regional business surveys throughout the week, which traders usually overlook.
The main story might be the scarcity of liquidity. With many investors closing their books for the year and many traders away from their desks, liquidity will be thinner than usual. This means that markets can move sharply without any news, and that any actual headlines could have a much greater impact. As such, any moves in the coming week might be more ‘noise’ than ‘signal’.
Could the Famous “Five-Day” Rule Reveal the Market Direction for the New Trading Year?
The start of each trading year is usually tricky for market participants as they leave behind the festive period. The hype about the new year is not enough to keep the spirit high, but there is an unofficial market rule that makes the first few market sessions purposeful. The famous “five-day” rule states that the yearly performance of the US 500 cash index would be positive if the return on the first five trading days of the year is positive. There have been a few studies on this rule and certain famous investors appear to adopt it in their overall strategy. However, there seems not to be sufficient fundamental or technical justification for this rule. Does it really hold, or do market participants just enjoy endorsing myths that point to a bright future?
We have analysed this rule for six securities: US 500 cash index, GER 40 cash index, EURUSD, GBPUSD, Gold and WTI oil futures. We used daily data since 1992, with a total of 31 trading years examined.
Equities and commodities appear to follow the rule; currency markets ignore it
The rule was made exclusively for the US 500 index, and our findings offer some confirmation. There is a 76% success rate, meaning that in roughly 3 out of 4 years that the index had a positive run in the first five days, it ended the year with a positive return. And the average return in these successful years is an acceptable 21%, as seen in Table 1 below.
The rule appears to be valid for the GER 40 cash index as well, with slightly improved results. A 78% success rate is uncommon when examining historical patterns in financial securities’ performance. Hence the rule seems to hold for equity markets. Like the US 500 index, the average yearly performance of GER 40 on successful years is a sizable 23%.
Overall, in our sample, regardless of the initial five-days performance, the US 500 index has recorded 22 years with positive return with an average return of 18%. Similarly, the GER 40 index has also seen 22 positive years with an average annual return of 22%.
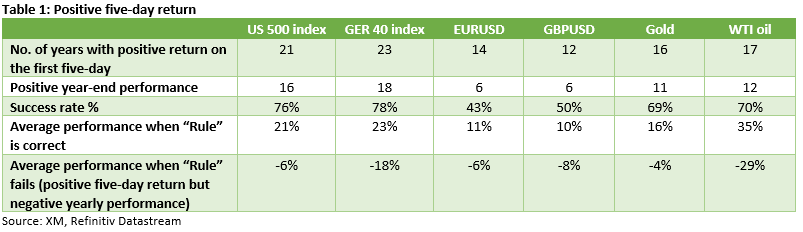
On the other hand, our findings for the currency markets are not optimistic. The EURUSD and GBPUSD pairs show a 40-50% success rate. Therefore, the rule seems not to extend to mean-reverting instruments.
The results of gold and WTI oil futures hold a surprise. Their respective 69% and 70% success rates are not negligible considering the unique nature of the commodities space. The average performance on years that the “five-day rule” holds is significant, especially for gold, where an impressive 16% return has been recorded.
Maybe the rule holds in reverse? A negative five-day performance points to a negative yearly return?
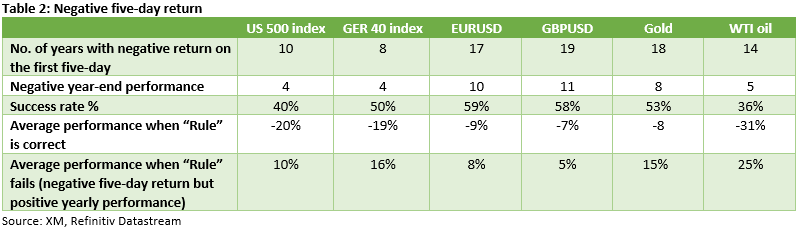
The simple answer is no. The results for the equity and commodities markets are very weak. However, there seems to be some connection regarding the two FX pairs we examined, EURUSD and GBPUSD. In both cases, there is a decent 60% success rate, meaning that if the performance is negative in the first five-days of the year, the year-end performance would be negative.
Technical analysis matters too – Gold especially interesting at this juncture
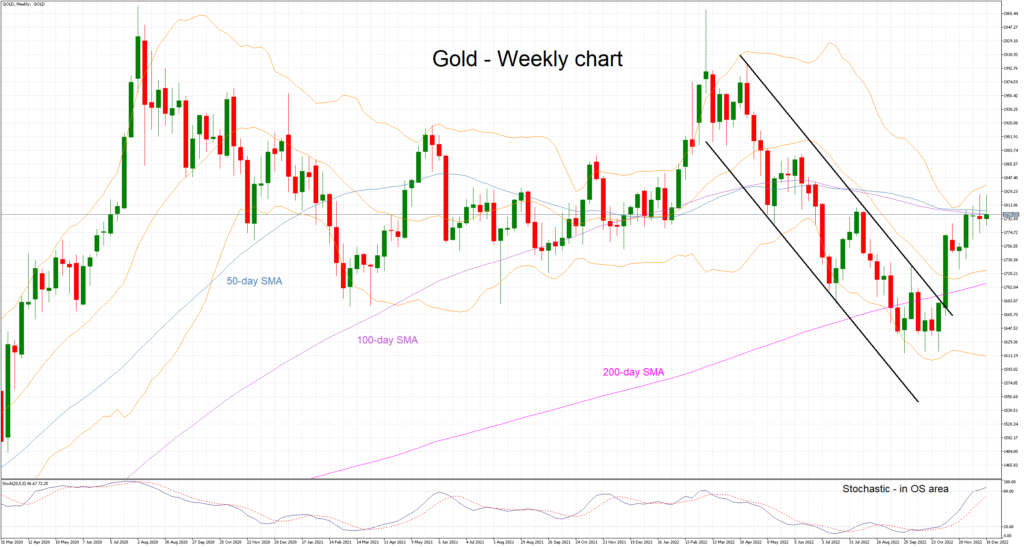
From a long-term perspective, using the weekly chart, gold has been on a downward sloping trend since March 2022. But there is increasing evidence that could worry the bears. The recent jump higher and the convergence of the 50- and 100-day simple moving averages (SMA) have brought the bearish trend into question, especially as the stochastic oscillator is hovering above its overbought territory.
US Dollar 2023 Outlook
Over the last year, the dollar saw an extended period of strength, but turned around in autumn. Although there were many events to influence that trajectory, the main overriding theme has been the Fed. And as we turn our attention to the new year, it appears that will be the main driver going forward, as well. And not just the dollar, as risk sentiment could have some significant fluctuations over the coming months.
What's expected…
There remains a discrepancy between what the market expects the Fed to do, and what the Fed says it will do. Fed officials have repeatedly said that rate hikes will continue. But the market is pricing in a terminal rate of under 5.0%. That implies at most two more hikes in the coming year, a significantly slower pace than what has been happening so far.
The first quarter is the moment of truth, to find out whether the Fed stays true to its implication that rates will be higher than the markets are expecting. The economic situation might be significantly different in the coming months, which could change the Fed's position. It's not that the market thinks the Fed is being dishonest, it's that the market thinks the Fed is being too optimistic about the economy.
Two roads diverged in a yellow wood…
Everyone seems to agree that there will be some kind of slowdown in the US at the start of the next year. The issue is whether it will be severe enough to knock the Fed off its rate trajectory. Or, will the slower economic activity pull inflation down faster than expected. So far, headline inflation has come in below expectations by quite a lot over the last few months. But core inflation has been a little more "sticky".
Slower economic activity would imply less demand for crude, and energy has been one of the leading factors pushing the difference between core and headline CPI. A more mild winter and a diffusion of geopolitical tensions could help reduce inflation faster than anticipated. Combined with an underperforming economy, the Fed could have every reason to not only stop hiking, but to retrace its steps. Less risk outlook and a dovishly inclined Fed could significantly weaken the dollar over time.
The path less taken…
The consensus among economists is that there will be a relatively mild and short recession in the early part of the year, followed by a slow recovery. That considers a Fed keeping rates tight, and aggressively winding off its balance sheet. That represents the scenario that could weaken the dollar initially, but generally remain strong through the year, thanks to higher interest rates.
The divergent opinion is that there won't be a recession at all, and the US will power through on good employment figures and increased government spending. That means inflation could remain elevated, and the Fed might not be as aggressive in raising rates. This scenario implies that the dollar will weaken in the early part of the year and simply continue its trend.
Check back in twelve months to see who was right.