Sample Category Title
USD/CAD Daily Outlook
Daily Pivots: (S1) 1.3560; (P) 1.3599; (R1) 1.3622; More....
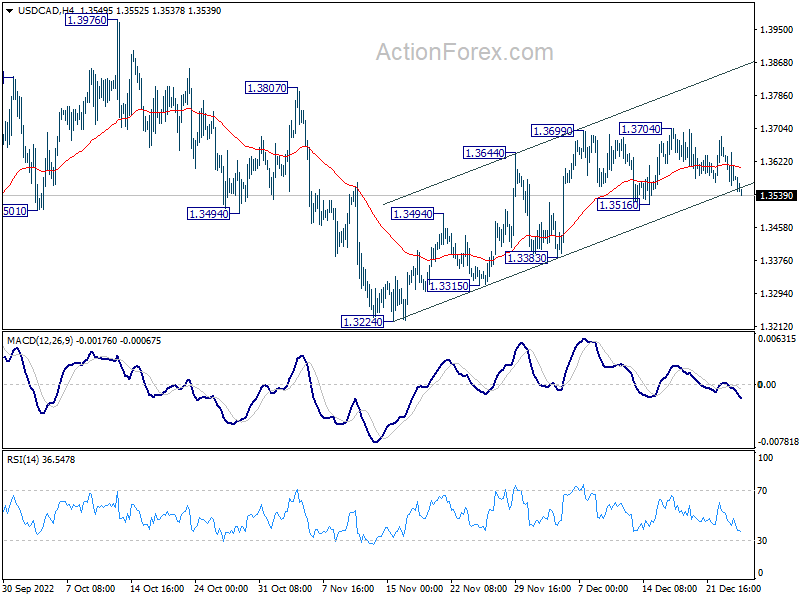
Intraday bias in USD/CAD stays neutral for the moment, and further rally is still in favor as long as 1.3516 support holds. Break of 1.3704 will resume the rebound from 1.3224 to 1.3807 resistance. Break there will bring retest of 1.3976 high. On the downside, however, break of 1.3516 support will suggest that the rebound has completed, and turn bias back to the downside.
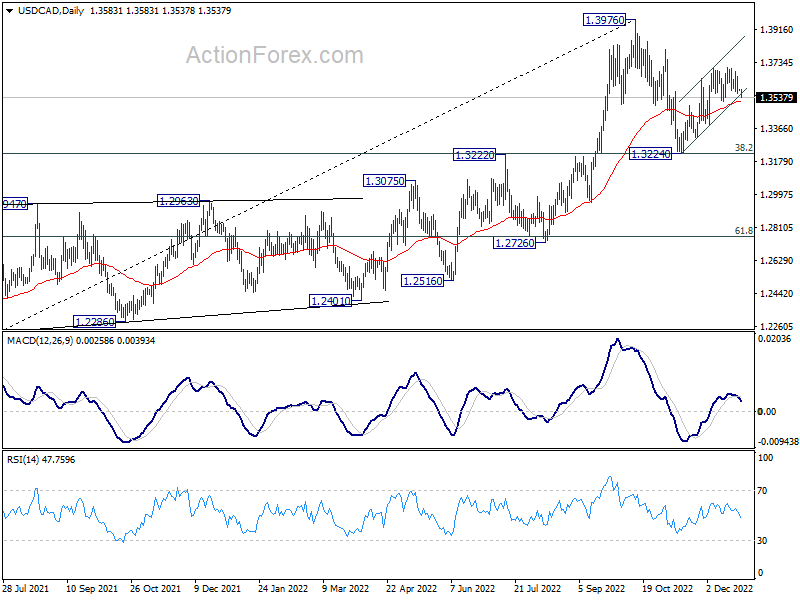
In the bigger picture, as long as 1.3222 cluster support (38.2% retracement of 1.2005 to 1.3976 at 1.3223) holds, larger up trend from 1.2005 (2021 low) is still expected to resume through 1.3976 high at a later stage. However, firm break of 1.3222/3 will indicate that the trend might have reversed. Deeper fall would be seen to next cluster support at 1.2726 (61.8% retracement at 1.2758).
AUD/USD Daily Report
Daily Pivots: (S1) 0.6699; (P) 0.6718; (R1) 0.6747; More...
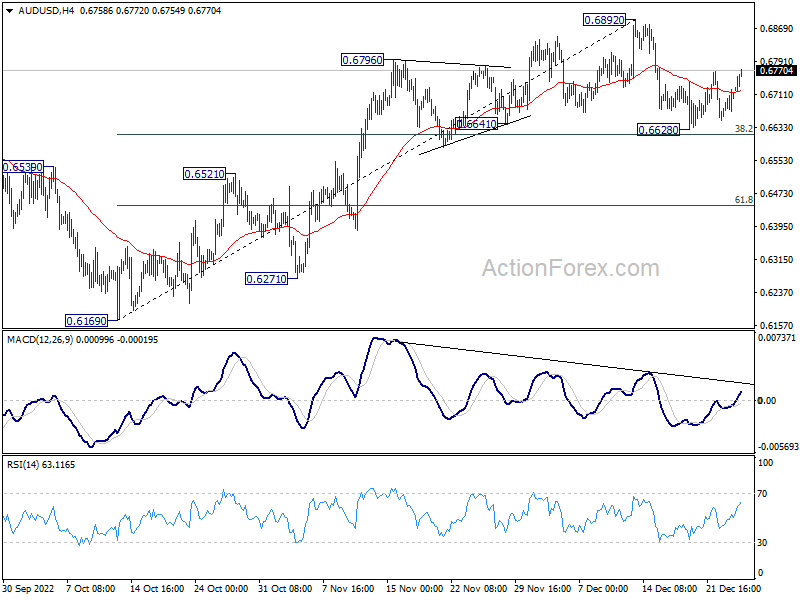
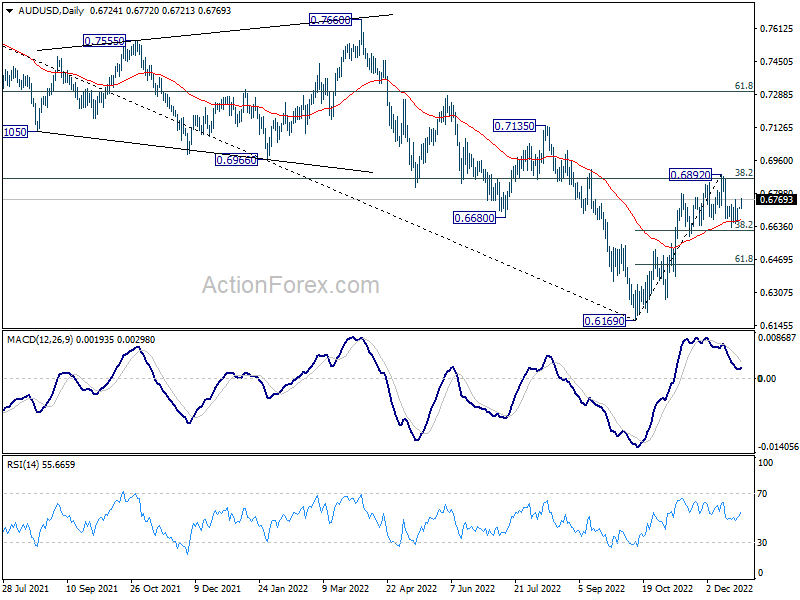
Intraday bias in AUD/USD remains neutral for the moment. On the downside, sustained break of 38.2% retracement of 0.6169 to 0.6892 at 0.6616 will indicate rejection by 0.66871 fibonacci level. Deeper fall should then be seen to 61.8% retracement at 0.6445. On the upside, break of 0.6892 will resume the rally from 0.6169.
In the bigger picture, it's still unsure if price actions from 0.6169 medium term bottom are developing into a corrective pattern or trend reversal. Rejection by 38.2% retracement of 0.8006 to 0.6169 at 0.6871 will maintain medium term bearishness for another fall through 0.6169 at a later stage. However, firm break of 0.6871, and sustained trading above 55 week EMA (now at 0.6900) will raise the chance of the start of a bullish up trend.
USD/JPY Daily Outlook
Daily Pivots: (S1) 132.36; (P) 132.80; (R1) 133.33; More...
Intraday bias in USD/JPY stays neutral at this point. Immediate focus remains on 55 week EMA (now at 131.78). Decisive break there will pave the way to next fibonacci level at 121.43. On the upside, above 133.61 support turned resistance will turn intraday bias back to the upside for 138.16 resistance.
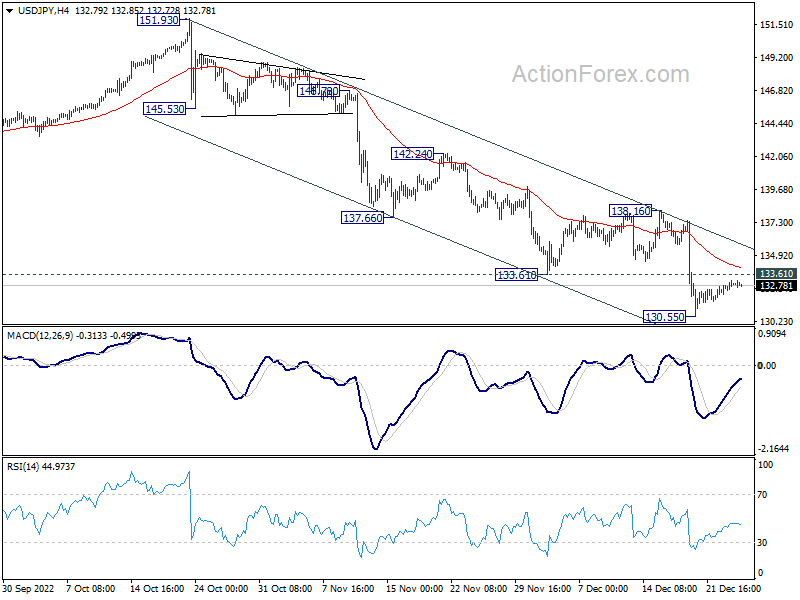
In the bigger picture, price actions from 151.93 medium term could be just a corrective pattern to up trend from 102.58 (2021 low). Strong support from 38.2% retracement of 102.58 to 151.93 at 133.07 and 55 week EMA (now at 131.76) will set the range for such corrective pattern. However, sustained break of 55 week EMA will pave the way to 61.8% retracement at 121.43.
USD/CHF Daily Outlook
Daily Pivots: (S1) 0.9306; (P) 0.9326; (R1) 0.9343; More...
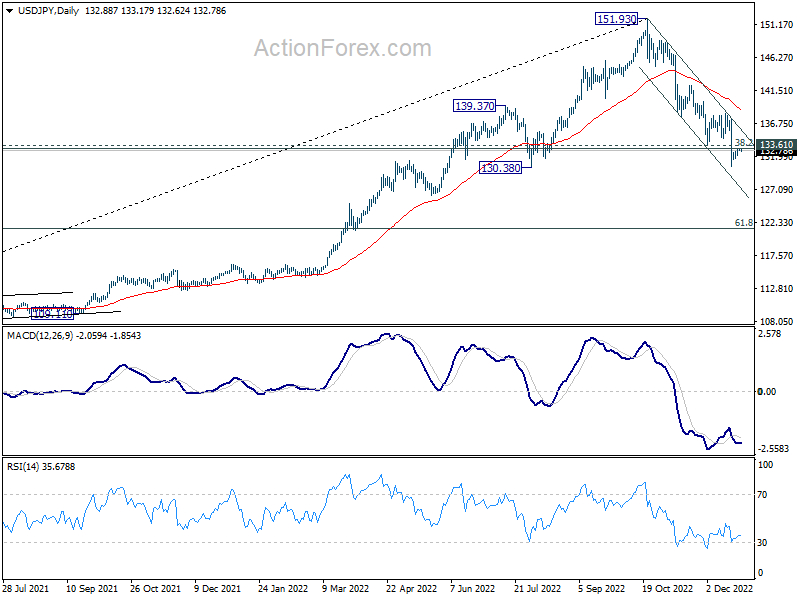
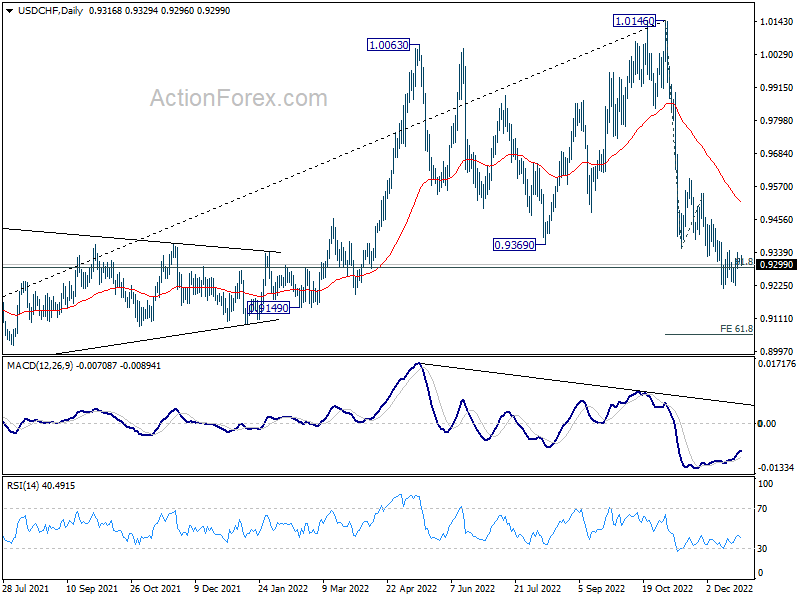
USD/CHF is staying in sideway trading from 0.9214 and intraday bias remains neutral. Further decline is in favor with 0.9378 resistance intact. On the downside, break of 0.9214 will resume the fall and target 61.8% projection of 1.0146 to 0.9355 from 0.9545 at 0.9056. However, break of 0.9378 resistance will indicate short term bottoming and turn bias back to the upside for 0.9545 resistance instead.
In the bigger picture, rise from 0.8756 (2021 low) has completed at 1.0146, well ahead of 1.0342 long term resistance (2016 high). Based on current downside momentum, fall from 1.0146 might be a medium term down trend itself. Sustained break of 61.8% retracement of 0.8756 to 1.0146 at 0.9287 will pave the way to 0.8756. In any case, risk will stay on the downside as long as 0.9545 resistance holds.
GBP/USD Daily Outlook
Daily Pivots: (S1) 1.2053; (P) 1.2068; (R1) 1.2085; More...
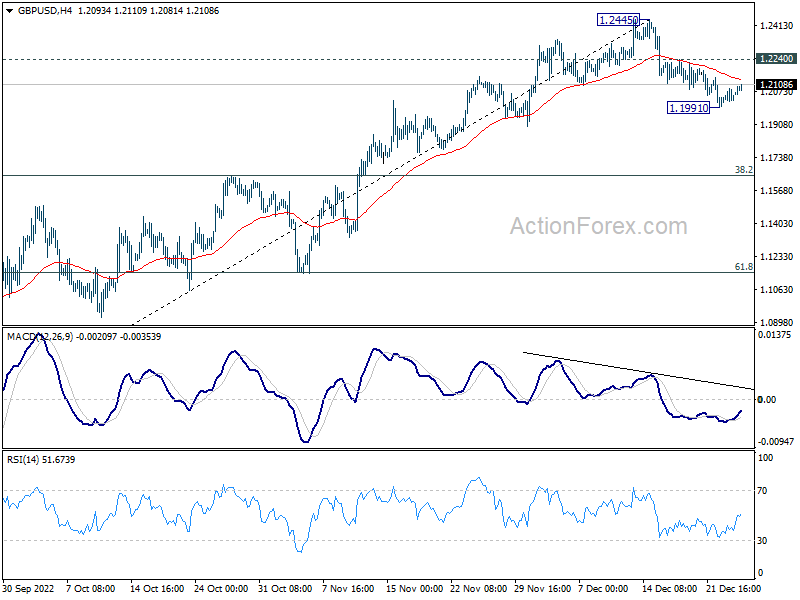
Intraday bias in GBP/USD is turned neutral with current recovery. On the downside, break of 1.1991 will resume the fall from 1.2445 to EMA (now at 1.1915). Firm break there will target 38.2% retracement of 1.0351 to 1.2445 at 1.1645. On the upside, break of 1.2240 minor resistance will turn bias back to the upside for retesting 1.2445 instead.
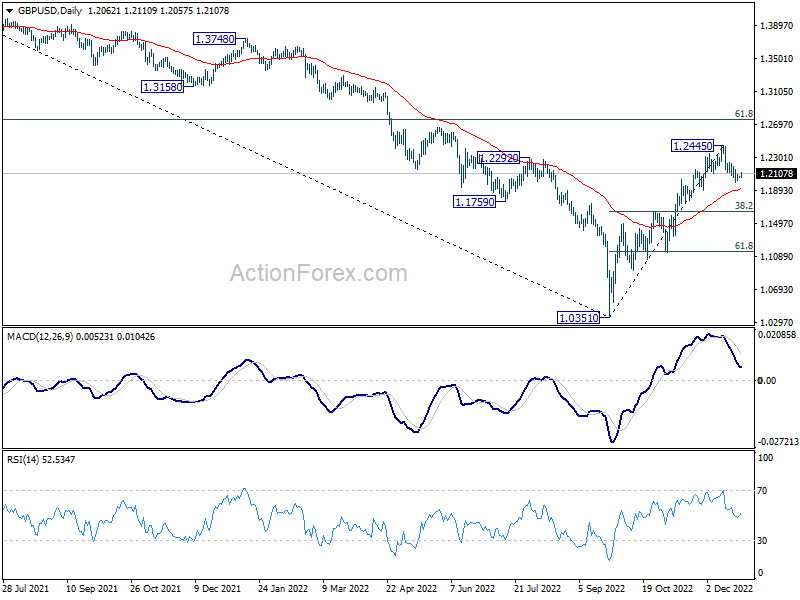
In the bigger picture, rise from 1.0351 medium term bottom is at least correcting whole down trend from 1.4248 (2021 high). Further rise is expected as long as 1.1644 resistance turned support holds. Next target is 61.8% retracement of 1.4248 to 1.0351 at 1.2759. Sustained break there will pave the way back to 1.4248. This will remain the favored case as long as 55 day EMA (now at 1.1915) holds.
EUR/USD Daily Outlook
Daily Pivots: (S1) 1.0615; (P) 1.0628; (R1) 1.0652; More...
EUR/USD recovers after drawing support from 4 hour 55 EMA but stays below 1.0733 resistance. Intraday bias remains neutral for the moment. Further rally is expected as long as 1.0481 resistance turned support holds. Firm break of 61.8% projection of 0.9729 to 1.0481 from 1.0289 at 1.0754 will pave the way to 100% projection at 1.1041. However, firm break of 1.0481 will confirm short term topping and bring deeper fall to 1.0289 support.
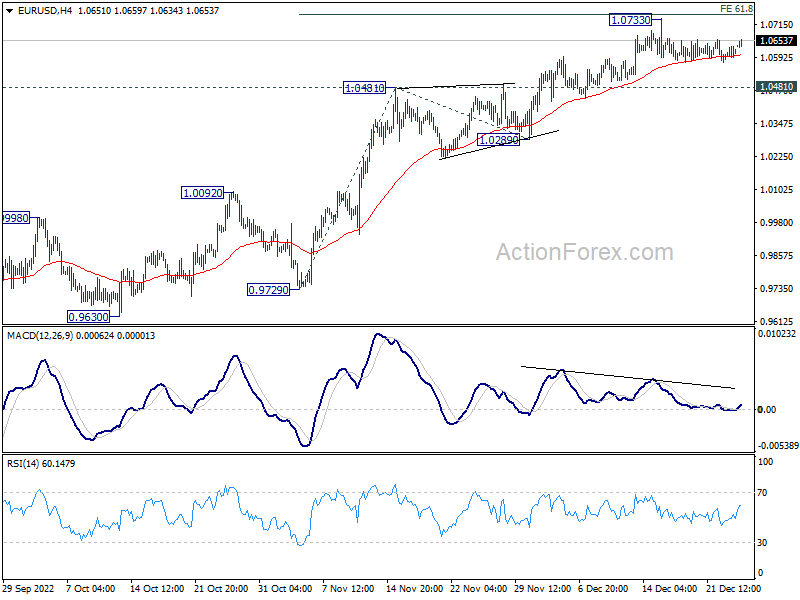
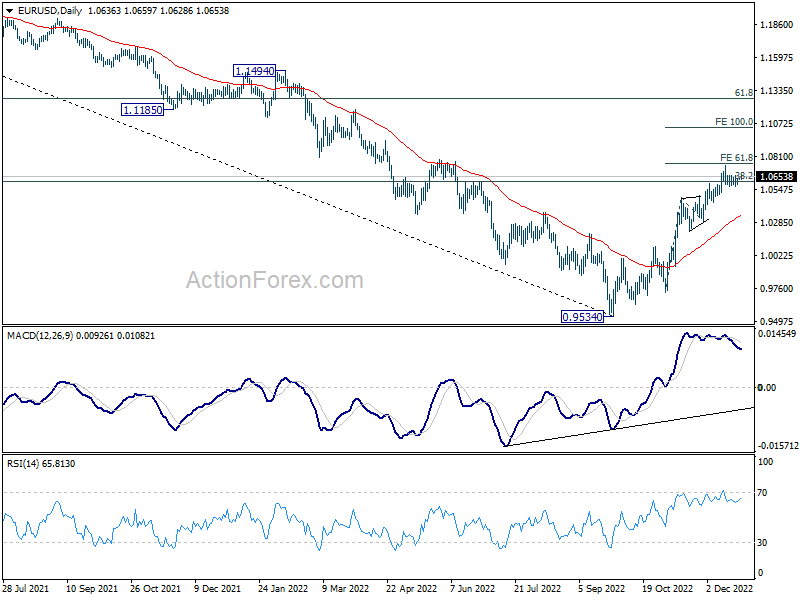
In the bigger picture, focus stays on 38.2% retracement of 1.2348 (2021 high) to 0.9534 at 1.0609. Rejection by 1.0609 will suggest that price actions from 0.9534 medium term bottom are developing into a corrective pattern. Thus, medium bearishness is retained for another fall through 0.9534 at a later stage. However, sustained break of 1.0609 will raise the chance of trend reversal and target 61.8% retracement at 1.1273.
Yen and Dollar Mildly Softer in Subdued Trading
Yen and Dollar are trading mildly lower in quiet trading in Asia, which is not totally back from holiday yet. Australian Dollar is the stronger one, followed by other commodity currencies and Sterling. On the other hand, Euro and Swiss Franc are on the softer side. Market activity will remain generally subdued this week, with many traders away while the economic calendar is extremely light.
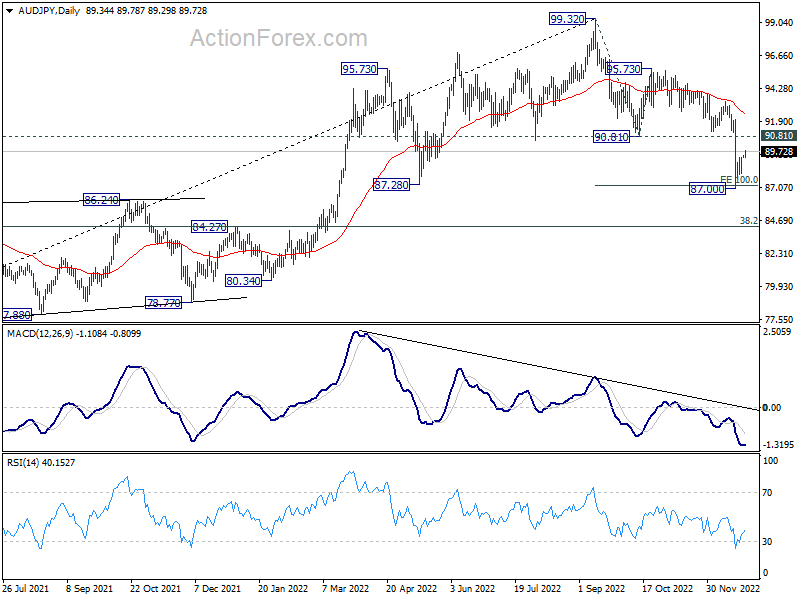
Technically, one development to watch through the new year is whether Yen's weakness will return. For example, AUD/JPY's decline from 99.32 might have completed with three waves down to 87.00. That came after meeting 100% projection of 99.32 to 90.81 from 95.73. Sustained break of 90.81 support turned resistance will open up further rise to 95.73 resistance and above. Let's see.
In Asia, at the time of writing, Nikkei is up 0.29%. Hong Kong is on holiday. China Shanghai SSE is up 0.77%. Singapore Strait Times is up 0.37%. Japan 10-year JGB yield is up 0.0151 at 0.464, heading back towards 0.5% cap.
ECB Knot: We are just at the beginning of the second half
ECB Governing Council member Klaas Knot said in an FT interview that in the five monetary policy meetings from now till July, the central bank would deliver "quite a decent pace of tightening".
"The risk of us doing too little is still the bigger risk," Knot said. "We are just at the beginning of the second half."
By slow the pace from 75bps to 50bps, "we grant ourselves a little bit more time along the way as we tighten into 2023 to evaluate the effects of our tightening," he added.
Knot also said recent economic data indicated that recession in the bloc would be "short and shallow" and the "worst... may already be behind us".
BoJ Kuroda: Japan approaching a critical juncture away from low inflation and growth
BoJ Governor Haruhiko Kuroda said yesterday that widening of the allowed band for 10-year JGB yield was "definitely not a step toward an exit" of ultra loose monetary policy.
"The Bank will aim to achieve the price target in a sustainable and stable manner, accompanied by wage increases, by continuing with monetary easing under yield curve control," he added.
"Labour market conditions in Japan are projected to tighten further, and firms' price- and wage-setting behaviour is also likely to change," Kuroda said. "In this sense, Japan is approaching a critical juncture in breaking out of a prolonged period of low inflation and low growth."
Japan retail sales rose 2.6% yoy in Nov, unemployment rate down to 2.5%
Japan retail sales rose 2.6% yoy in November, below expectation of 3.8% yoy. The growth rate slowed from 4.4% in October and 4.8% in September. Nonetheless, that's still the ninth straight month of expansion.
Released separately, unemployment rate fell from 2.6% to 2.5% in November, better than expectation of 2.6%. The jobs-to-applicants ratio was unchanged from October's 1.35. This gauge of job availability stayed at the highest level since march 2020.
Looking ahead
The economic data is empty in European session. Later in the day, US will release goods trade balance, and house price index.
EUR/USD Daily Outlook
Daily Pivots: (S1) 1.0615; (P) 1.0628; (R1) 1.0652; More...
EUR/USD recovers after drawing support from 4 hour 55 EMA but stays below 1.0733 resistance. Intraday bias remains neutral for the moment. Further rally is expected as long as 1.0481 resistance turned support holds. Firm break of 61.8% projection of 0.9729 to 1.0481 from 1.0289 at 1.0754 will pave the way to 100% projection at 1.1041. However, firm break of 1.0481 will confirm short term topping and bring deeper fall to 1.0289 support.
In the bigger picture, focus stays on 38.2% retracement of 1.2348 (2021 high) to 0.9534 at 1.0609. Rejection by 1.0609 will suggest that price actions from 0.9534 medium term bottom are developing into a corrective pattern. Thus, medium bearishness is retained for another fall through 0.9534 at a later stage. However, sustained break of 1.0609 will raise the chance of trend reversal and target 61.8% retracement at 1.1273.
Economic Indicators Update
| GMT | Ccy | Events | Actual | Forecast | Previous | Revised |
|---|---|---|---|---|---|---|
| 23:30 | JPY | Unemployment Rate Nov | 2.50% | 2.60% | 2.60% | |
| 23:50 | JPY | Retail Trade Y/Y Nov | 2.60% | 3.80% | 4.40% | |
| 05:00 | JPY | Housing Starts Y/Y Nov | -1.40% | 1.30% | -1.80% | |
| 13:30 | USD | Goods Trade Balance (USD) Nov P | -96.9B | -99.0B | ||
| 13:30 | USD | Wholesale Inventories Nov P | 0.40% | 0.50% | ||
| 14:00 | USD | S&P/CS Composite-20 HPI Y/Y Oct | 8.00% | 10.40% | ||
| 14:00 | USD | Housing Price Index M/M Oct | -0.60% | 0.10% |
Platinum (PL) Ready to Rally in 2023
Platinum (PL) continues to trade sideways and the metal is in the process of forming an important low before the next major bullish cycle starts. The Federal Reserve has aggressively hiked rates multiple times, creating a sideways to lower movement in the commodity sectors. There’s however no doubt that the longer term outlook of commodities is bullish. At this stage, there’s enough number of swing to call the daily and monthly correction completed. However, we still need more data and evidence to call the correction completed. In the meantime, we still give a possibility for the metal to extend lower until the market says otherwise. Below is the update of the Elliott Wave chart in Platinum.
Platinum Monthly Elliott Wave Chart
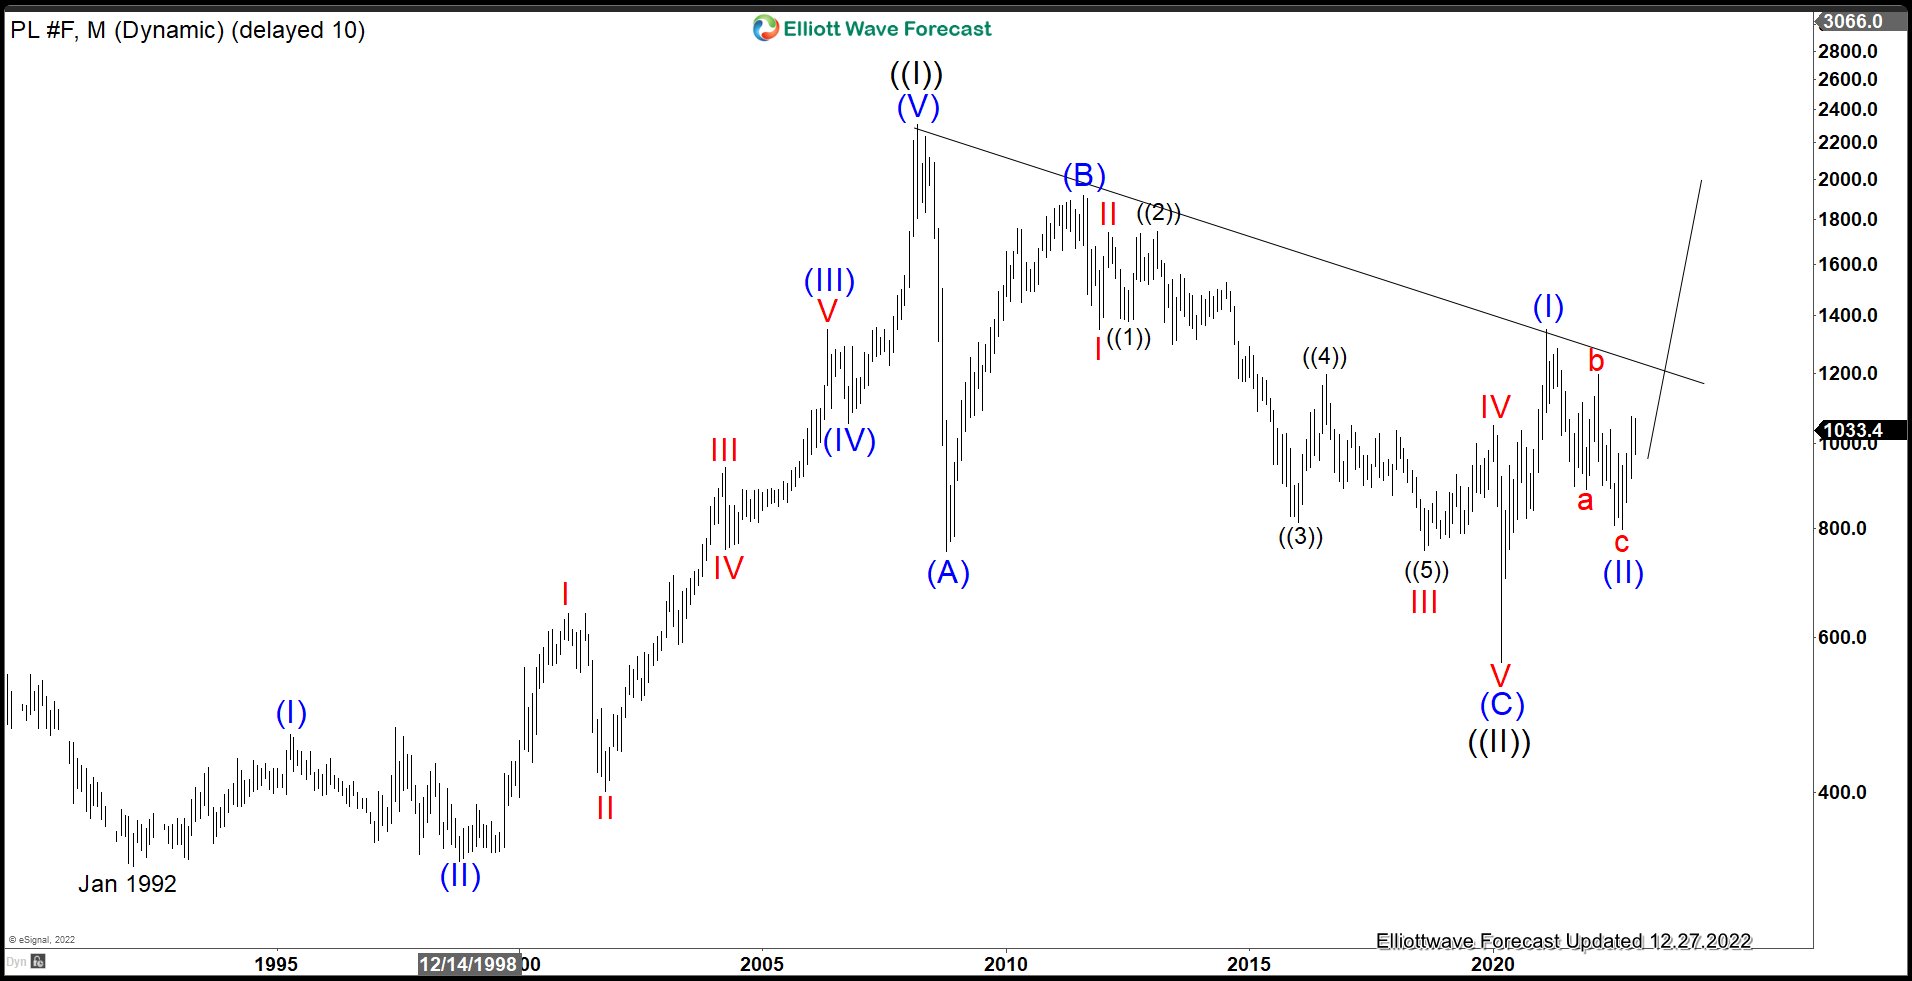
Monthly Elliott Wave Chart of Platinum (PL) above suggests that the metal spent majority of the time in 2022 to correct the rally from March 2020 low. The entire rally from 1992 low ended with wave ((I)) at 2308.8 and pullback in wave ((II)) ended at 562. The metal extends higher in wave ((III)) with internal subdivision as another impulse. Up from wave ((II)), wave (I) ended at 1348.2 and pullback in wave (II) is proposed complete at 796.8. Expect Platinum to extend higher in 2023 as it resumes the next bullish cycle.
Platinum Daily Elliott Wave Chart
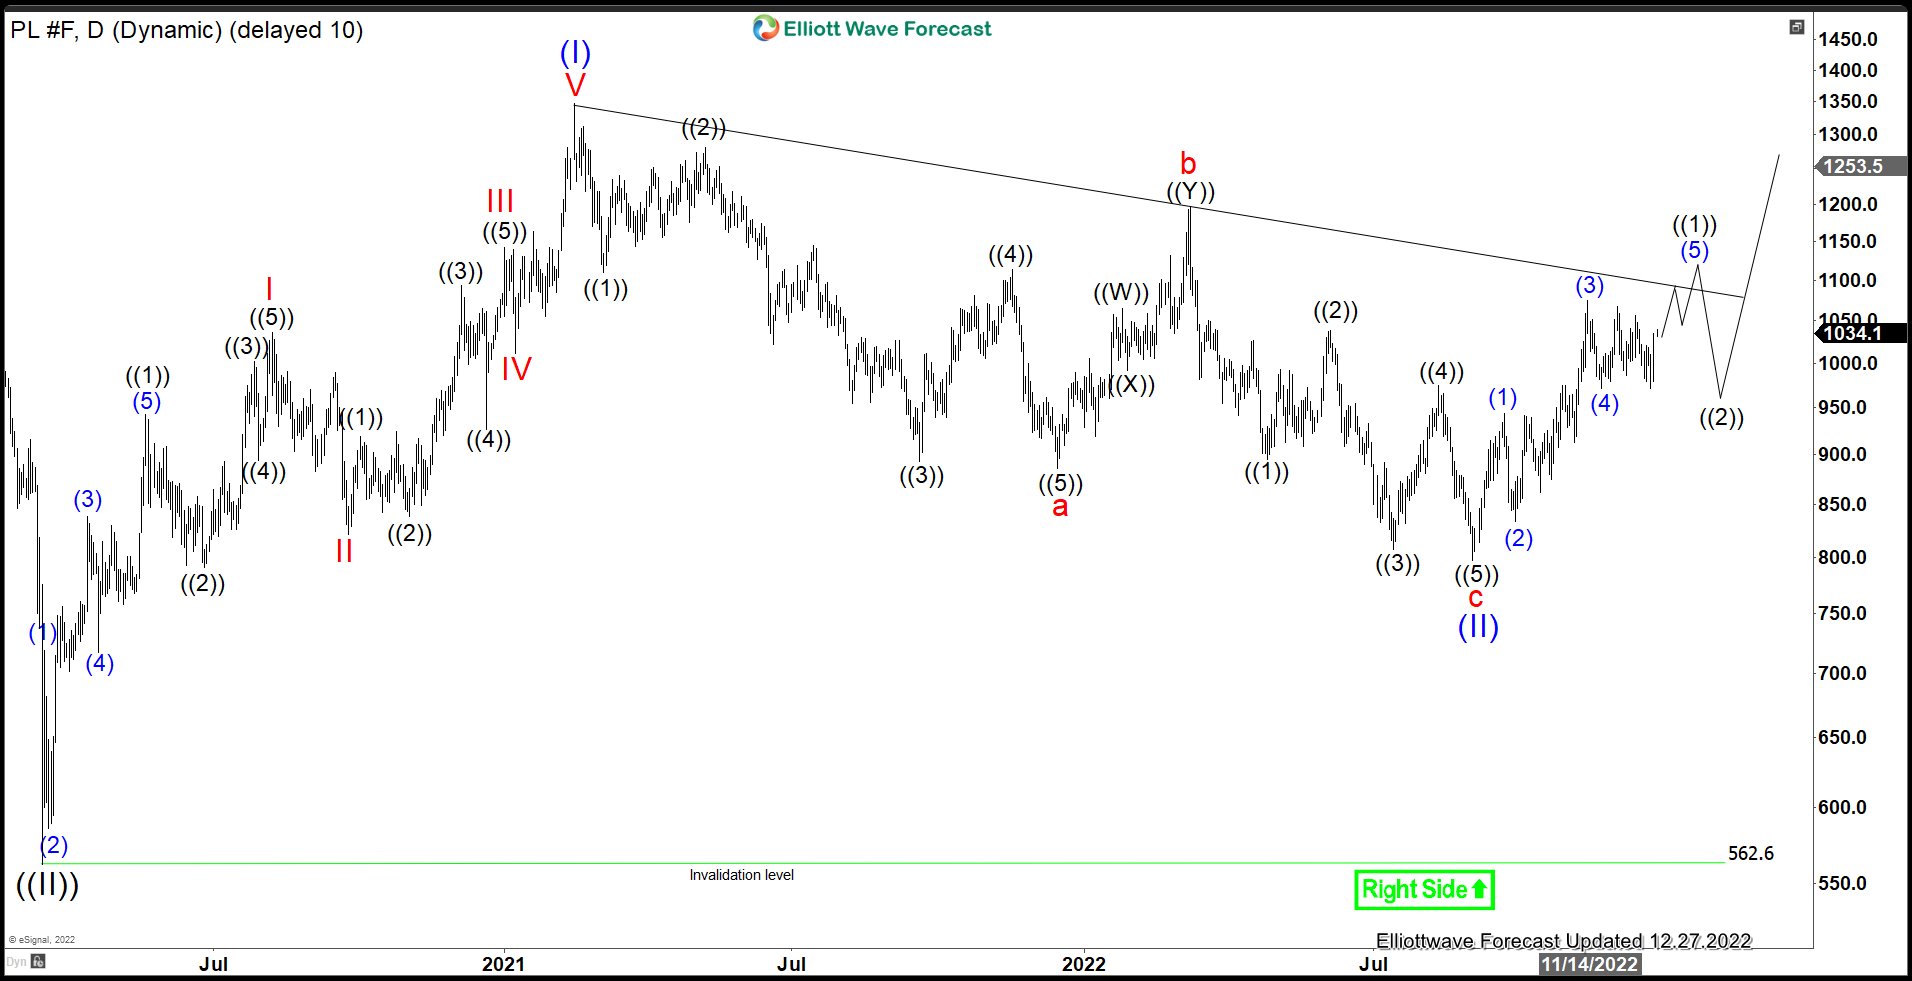
Daily Elliott Wave Chart for Platinum suggests that wave (II) pullback already completed at 796.8. This view will get confirmation when the metal manages to break above previous peak wave (I) at 1348.2. Successful break, if it happens, will also rule out a double correction in the metal. The current stage as we get close to end 2022 sets up for a promising bullish outlook in 2023. We continue to expect further upside as far as it stays above 562.6.
Technical Outlook and Review
USD/JPY:
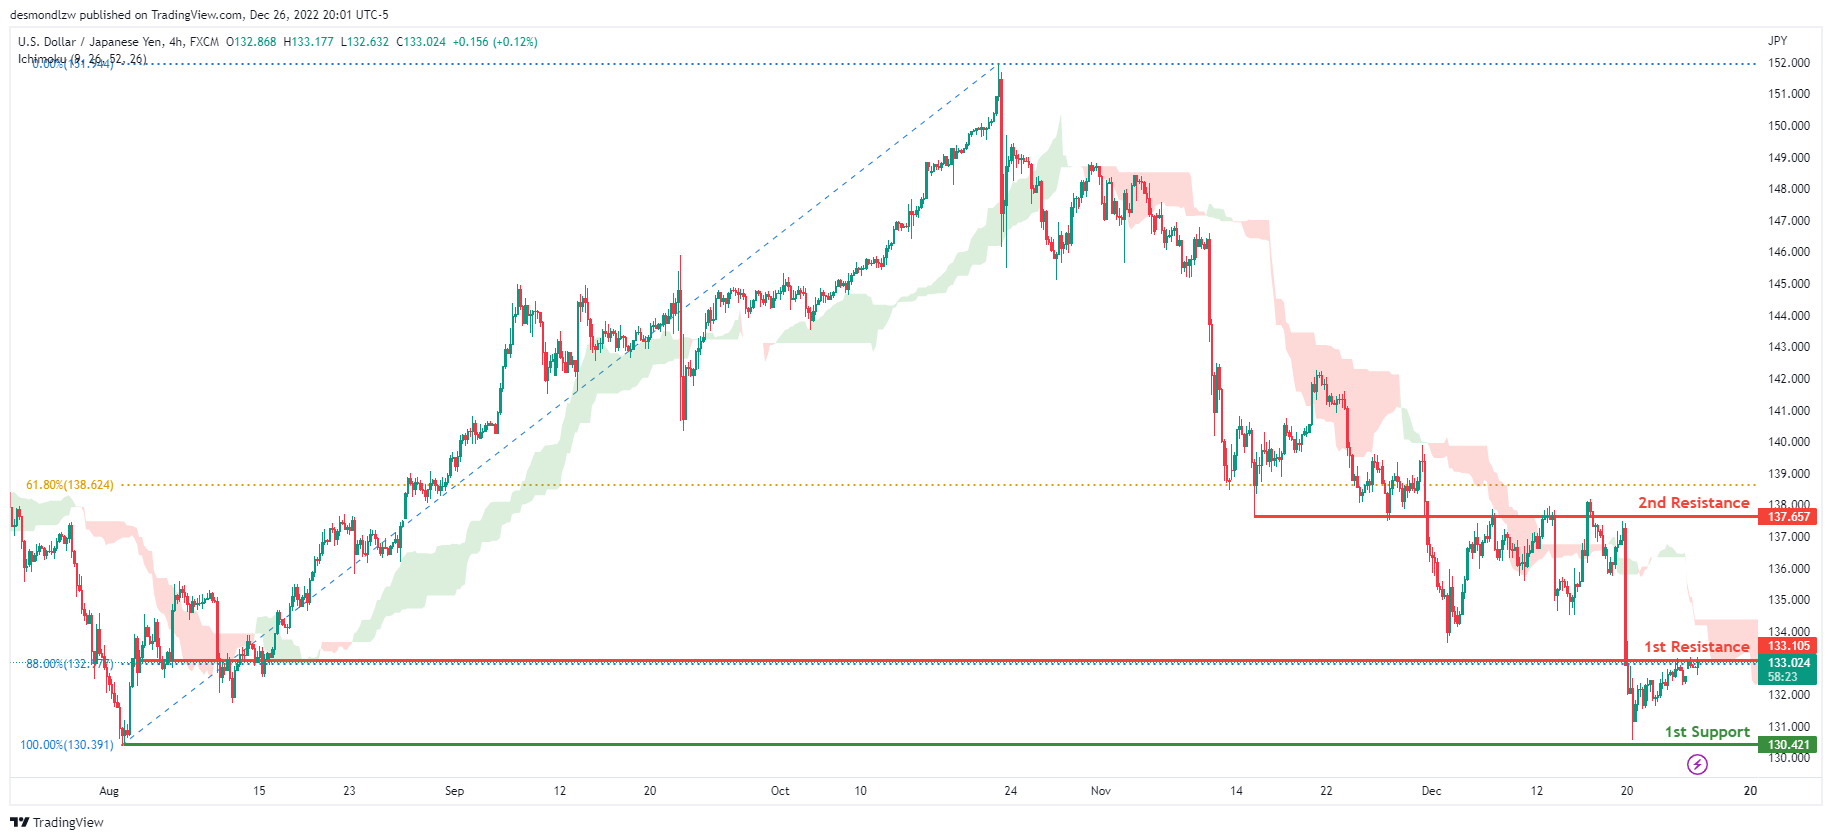
Looking at the H4 chart, my overall bias for USDJPY is bearish due to the current price being below the Ichimoku cloud, indicating a bearish market. If this bearish momentum continues, expect price to possibly head towards the 1st support at 130.421, where the previous swing low is located. In an alternate scenario, price could possibly head back up towards the 1st resistance level at 133.105 where the 88% Fibonacci line is.
Areas of consideration:
- H4 time frame, 1st resistance at 133.105
- H4 time frame, 2nd resistance at 137.657
- H4 time frame, 1st support at 130.421
DXY:
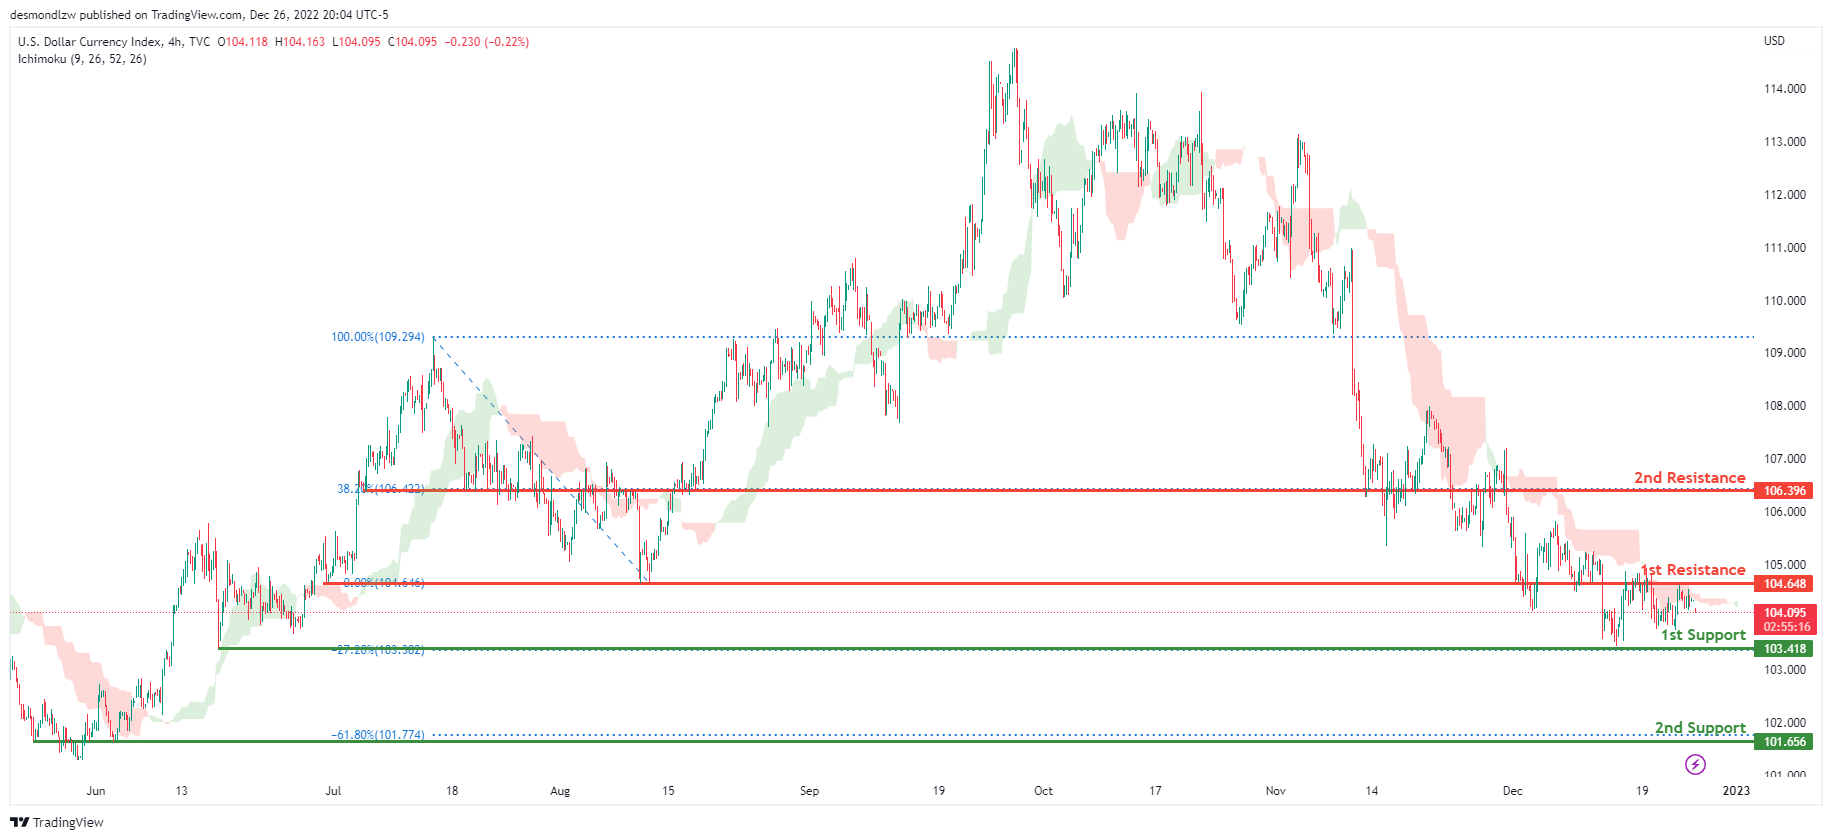
On the H4 chart, the overall bias for DXY is bearish. To add confluence to this, the price is below the Ichimoku cloud which indicates a bearish market. If this bearish momentum continues, expect the price to possibly break the 1st support line at 103.418, where the -27.2% Fibonacci expansion line is before heading towards the 2nd support at 101.656, where the -61.8% Fibonacci expansion line is. In an alternative scenario, price could head back up and break the 1st resistance line resistance at 104.648, where the previous swing low is before heading towards the 2nd resistance at 106.396, where the 38.2% Fibonacci line is.
Areas of consideration:
- H4 time frame, 1st resistance at 104.648
- H4 time frame, 1st support at 103.418
- H4 time frame, 2nd support at 101.656
EUR/USD:
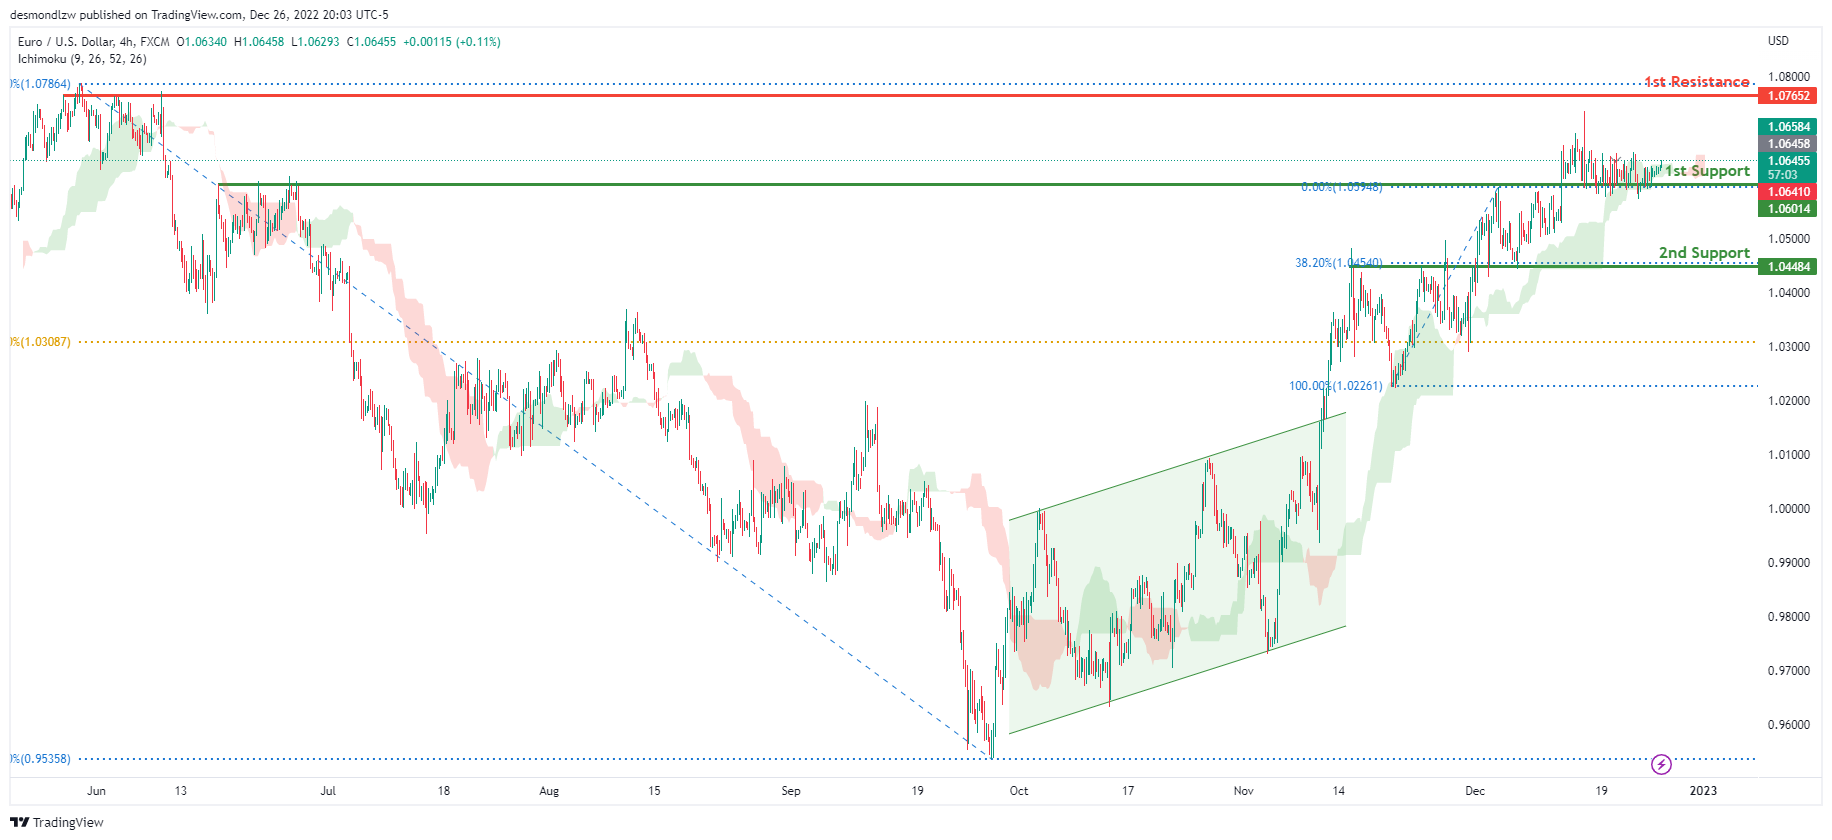
Looking at the H4 chart, my overall bias for EURUSD is bullish due to the current price being above the Ichimoku cloud, indicating a bullish market. To add confluence to this bias, price has also broken above the ascending bullish channel. If this bullish momentum continues, expect the price to possibly head towards the 1st resistance at 1.07652, where the previous swing high is. In an alternate scenario, price could possibly head back down to break the 1st support level at 1.06014, where the previous swing high and 78.6% Fibonacci line are located before heading towards the 2nd support at 1.04484, where the 38.2% Fibonacci line is.
Areas of consideration :
- H4 1st resistance at 1.07652
- H4 1st support at 1.06014
- H4 2nd support at 1.04484
GBP/USD:
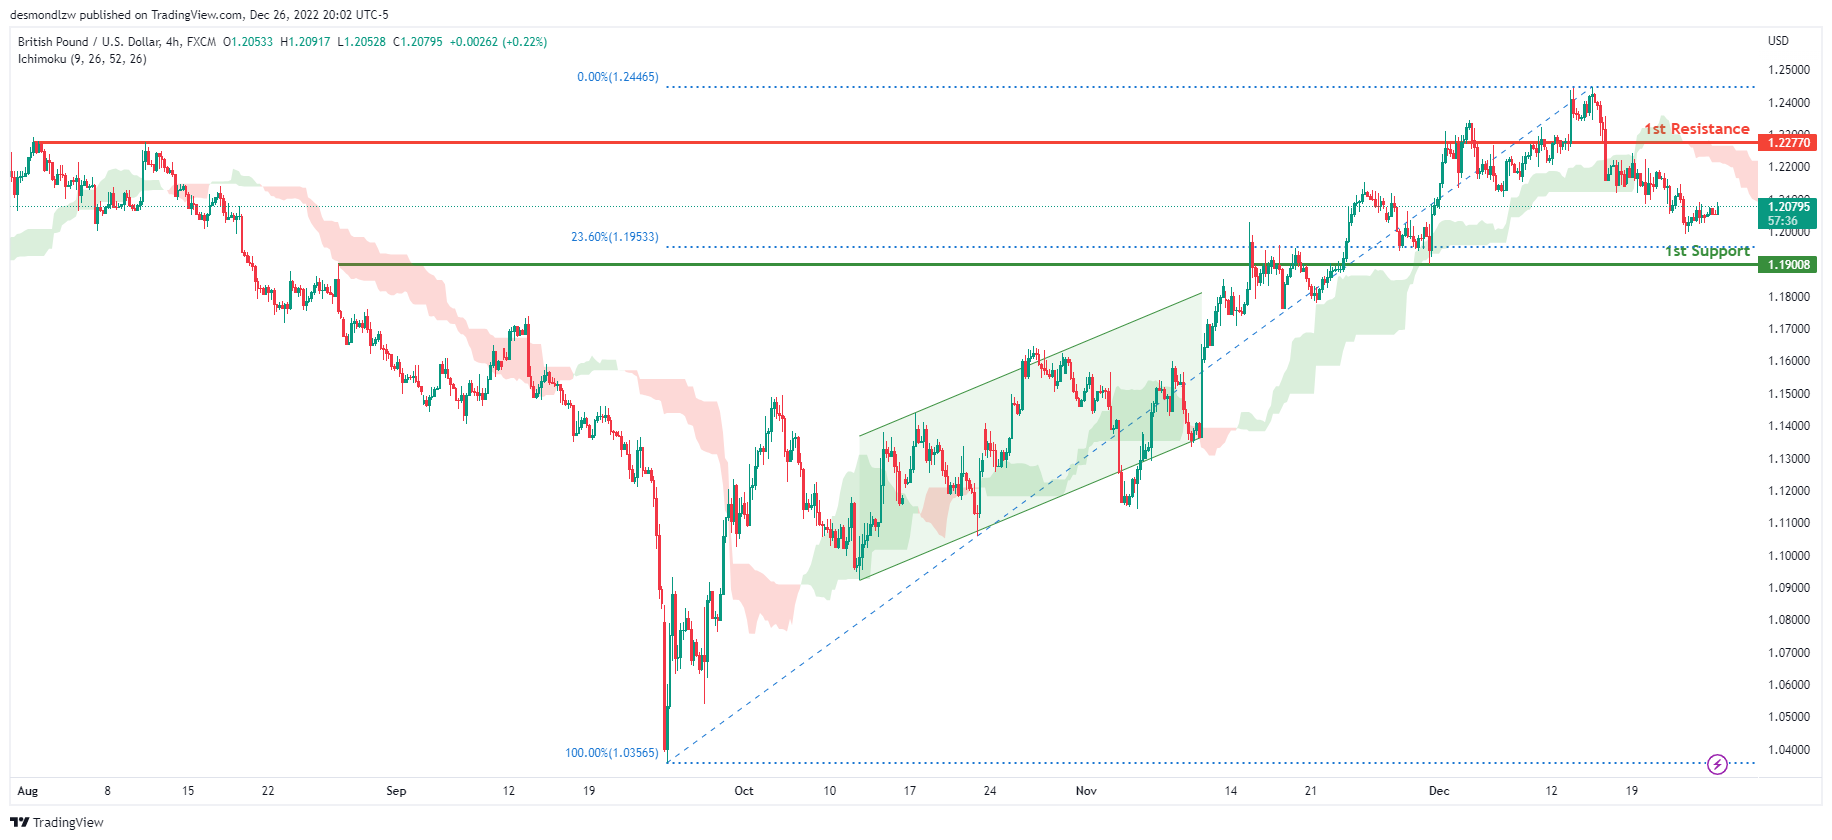
Looking at the H4 chart, my overall bias for GBPUSD is bearish due to the current price being below the Ichimoku cloud, indicating a bearish market. If this bearish momentum continues, expect price to possibly continue heading towards the 1st support at 1.19008, where the 23.6% Fibonacci line is. In an alternate scenario, price could possibly head back up to retest the 1st resistance level at 1.22770, where the previous swing high is.
Areas of consideration:
- H4 1st resistance at 1.22770
- H4 1st support at 1.19008
USD/CHF:
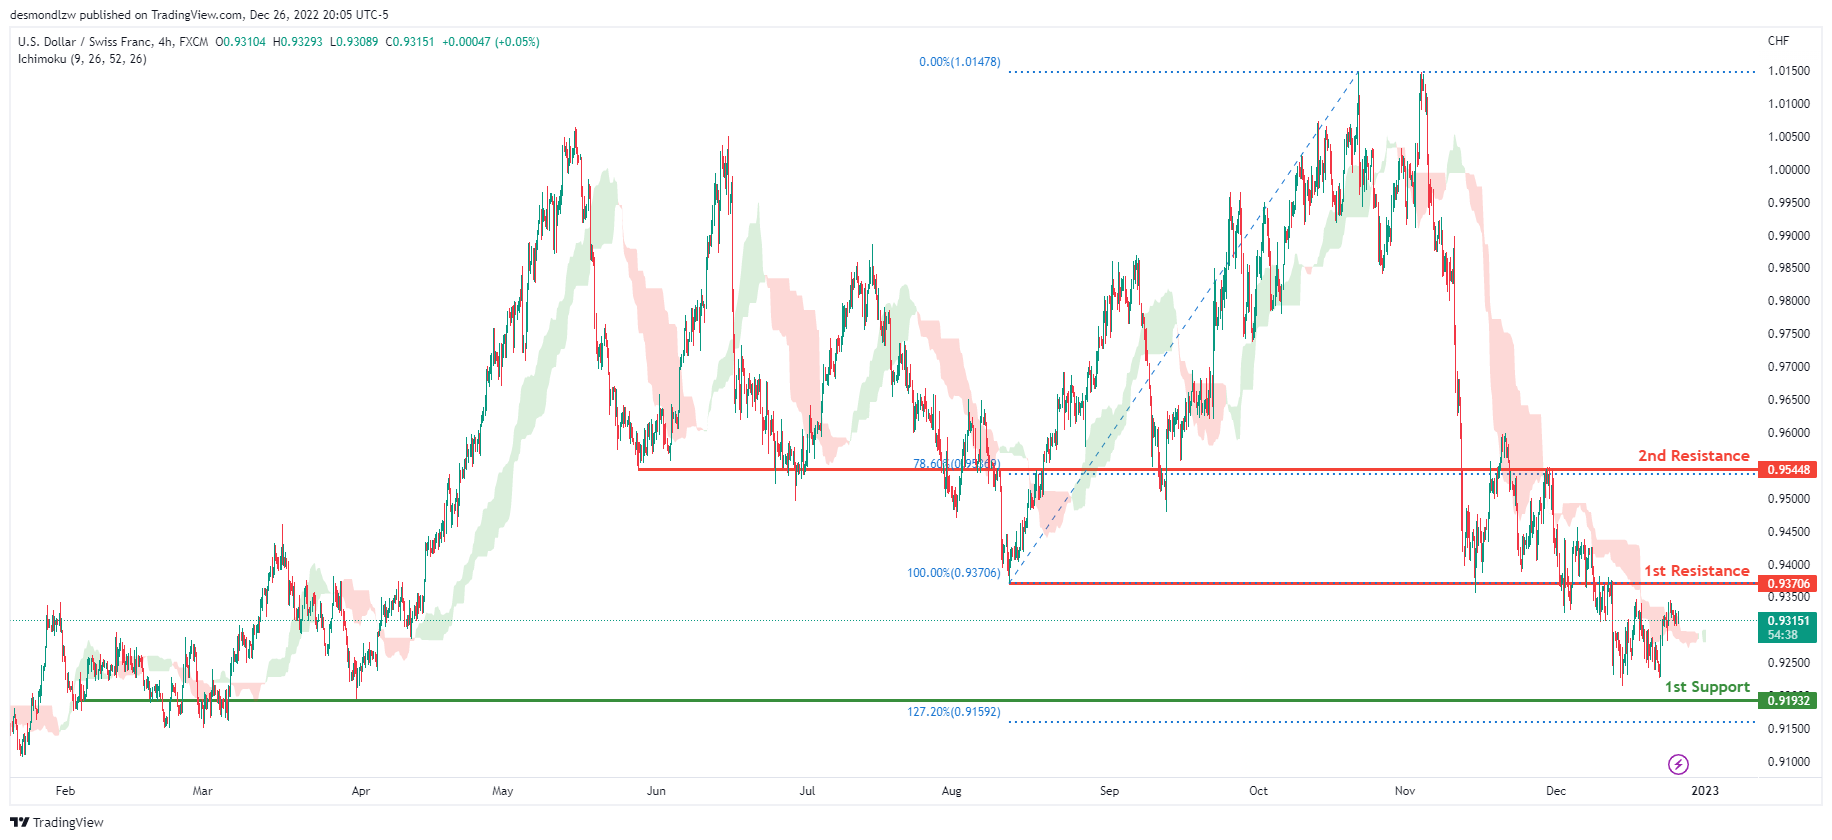
The overall bias for USDCHF on the H4 chart is bearish. In addition, the price is crossing below the Ichimoku cloud, indicating a bearish market. If the current bearish trend continues, expect the price to head back down towards the 1st support line at 0.91932, where the previous swing low and 12.72% Fibonacci extension line is . In an alternative scenario, price could possibly head up towards the 1st resistance at 0.93706, where the previous swing low is .
Areas of consideration
- H4 1st support at 0.91932
- H4 1st resistance at 0.93706
XAU/USD (GOLD):
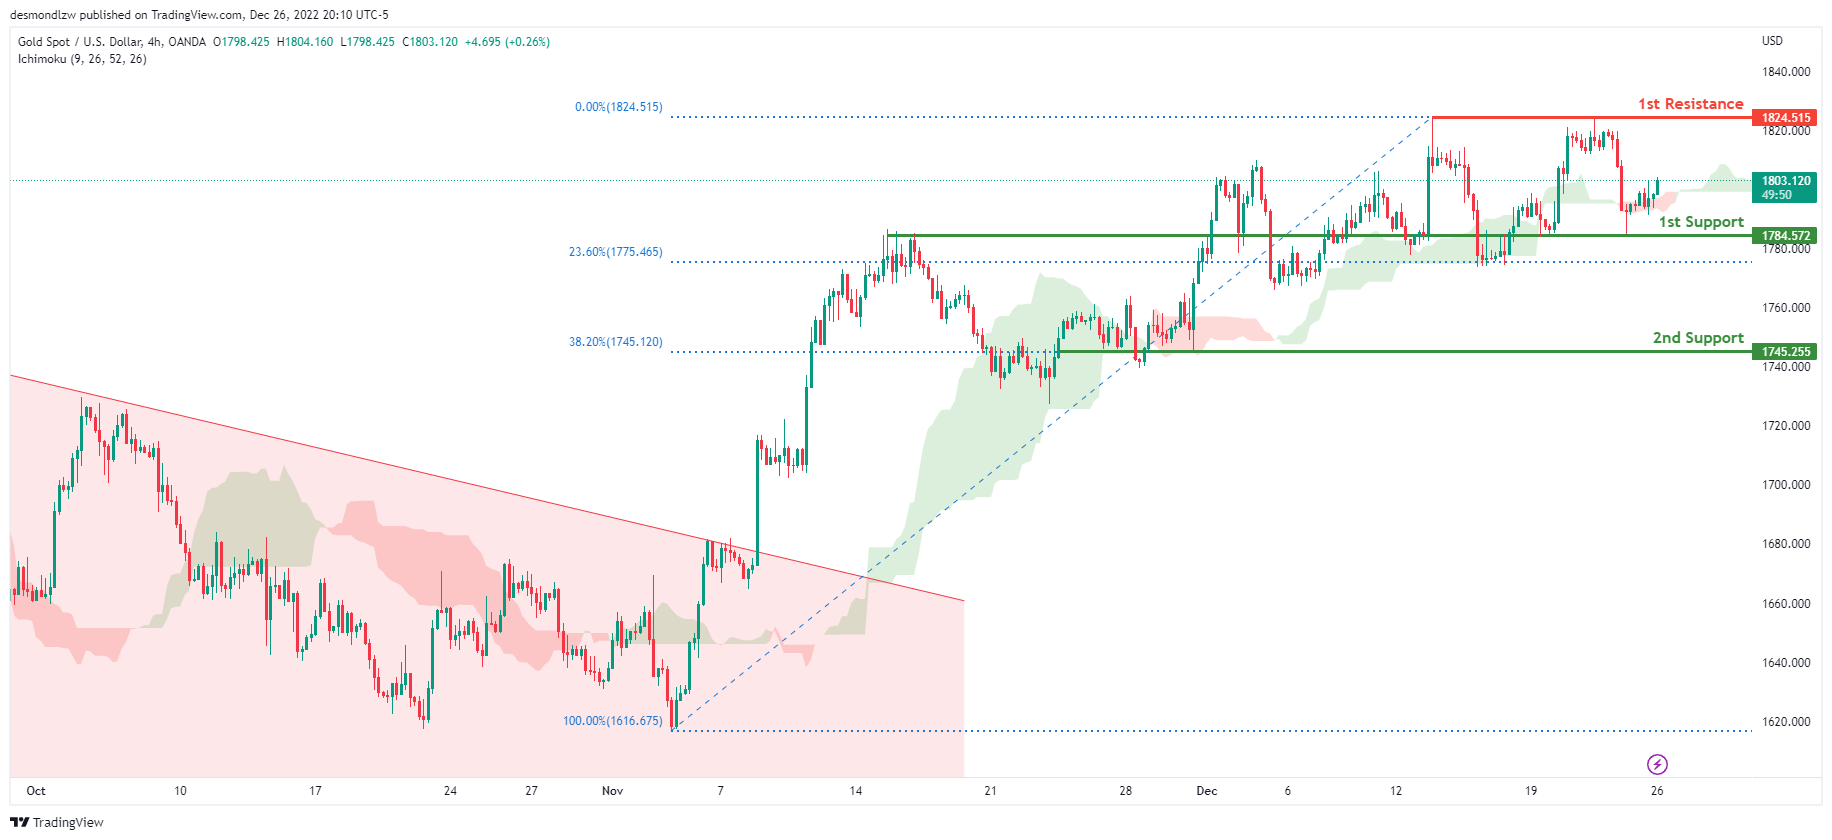
Looking at the H4 chart, my overall bias for XAUUSD is bullish due to the current price crossing above the Ichimoku cloud, indicating a bullish market. If this bullish momentum continues, expect the price to continue heading towards the 1st resistance at 1824.515 where the recent high is. In an alternative scenario, price could possibly head back down to break the 1st support at 1784.572, where the previous high is before heading towards the 2nd support at 1745.255, where the 38.2% Fibonacci line is.
Areas of consideration:
- H4 time frame, 1st resistance at 1824.515
- H4 time frame, 1st support at 1784.572
- H4 time frame, 2nd support at 1745.255
AUD/USD:
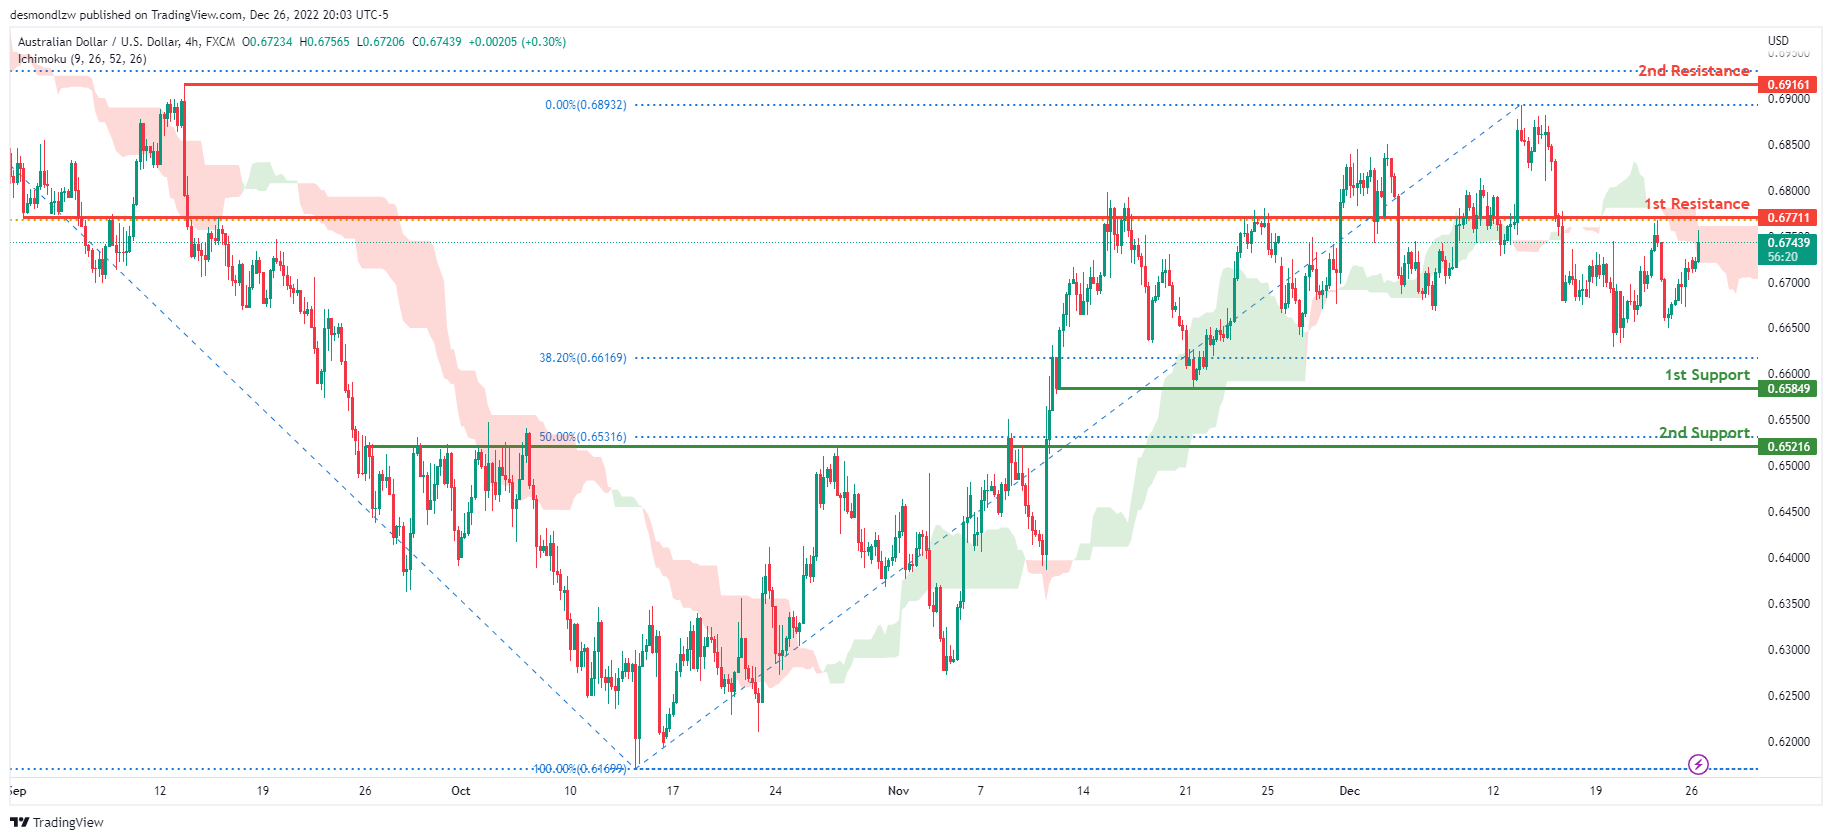
Looking at the H4 chart, my overall bias for AUDUSD is bearish due to the current price crossing below the Ichimoku cloud, indicating a bearish market. If this bearish momentum continues, expect the price to continue heading towards the 1st support at 0.65849, where the 78.6% Fibonacci line is. In an alternative scenario, price could possibly head back up towards the 1st resistance at 0.67711, where the 61.8% Fibonacci line is.
Areas of consideration
- H4, 1st resistance at 0.67711
- H4, 1st support at 0.65849
NZD/USD:
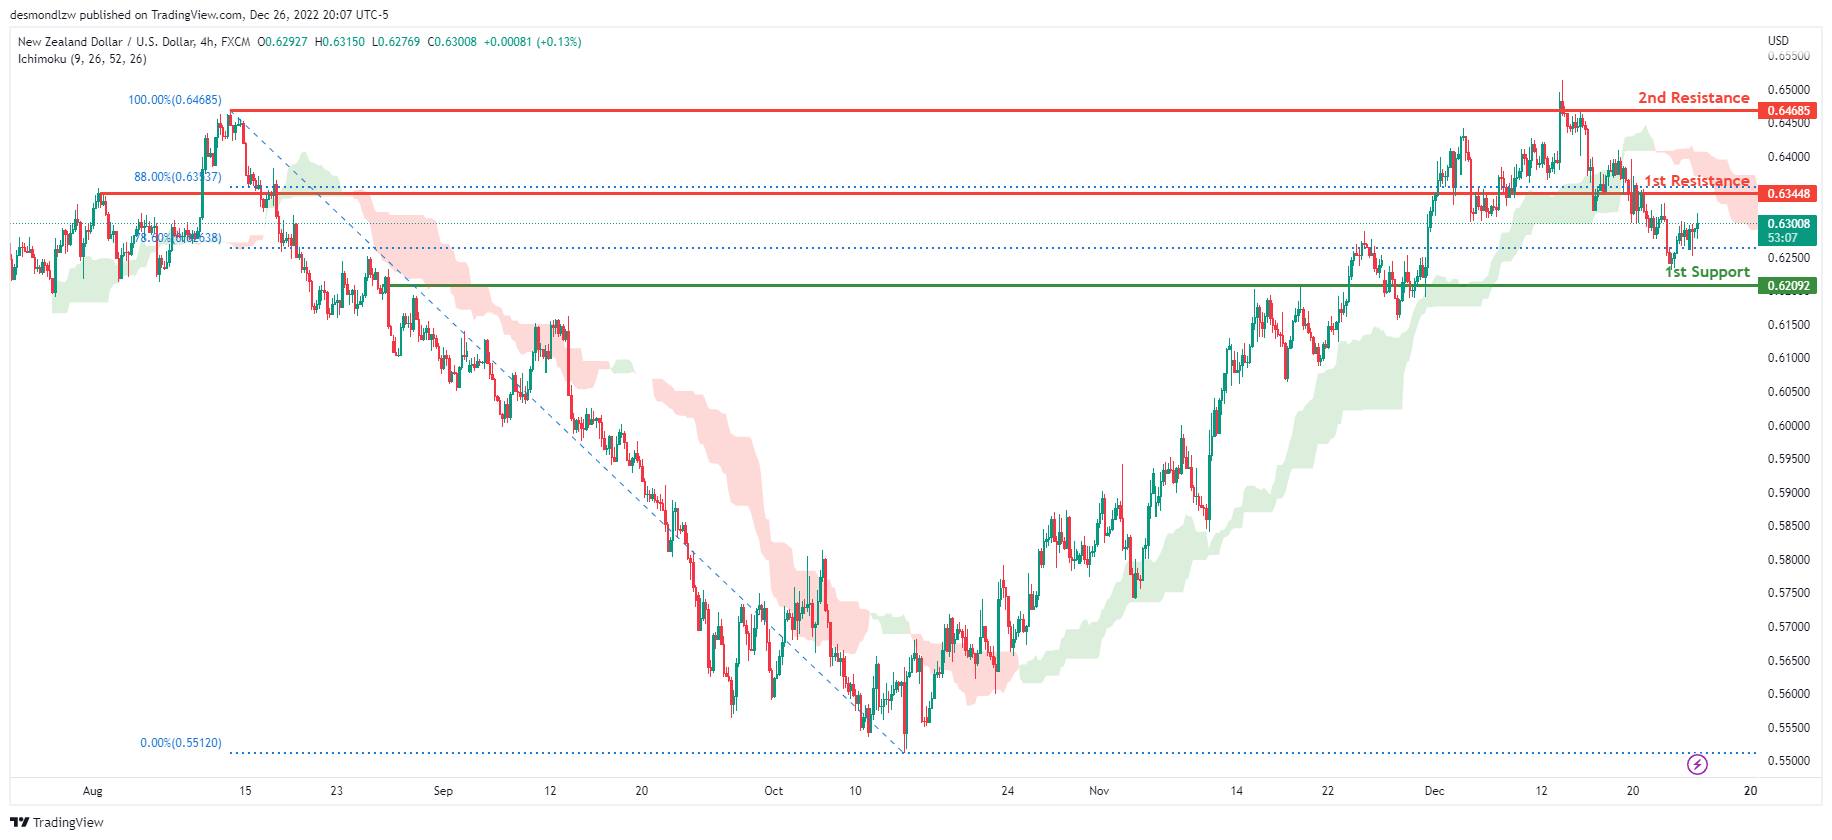
Looking at the H4 chart, my overall bias for NZDUSD is bearish due to the current price being below the Ichimoku cloud, indicating a bearish market. If this bearish momentum continues, expect price to possibly continue heading towards the 1st support at 0.62092, where the 78.6% Fibonacci line is. In an alternate scenario, price could possibly head back up towards the 1st resistance level at 0.63448, where the 88% Fibonacci line is.
Areas of consideration:
- H4 time frame, 1st resistance at 0.63448
- H4 time frame, 1st support at 0.62092
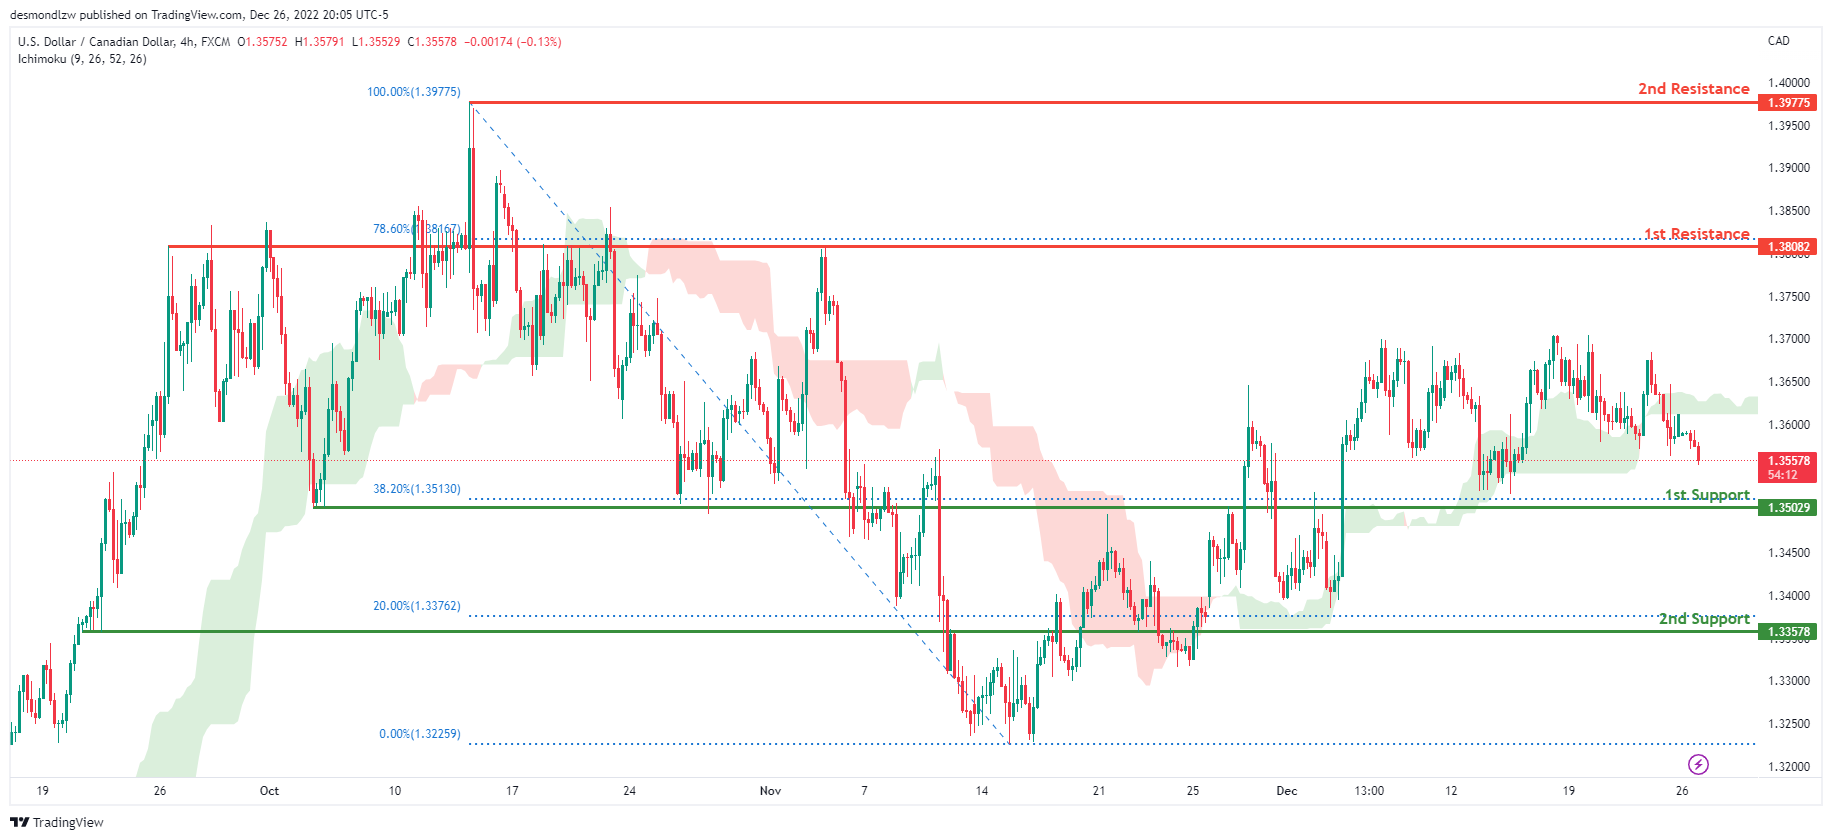
USD/CAD:
On the H4 chart, the overall bias for USDCAD is bearish. To add confluence to this, the price is below the Ichimoku cloud which indicates a bearish market. If this bearish momentum continues, expect the price to head back down to retest the 1st support at 1.35029, where the 38.2% Fibonacci line is. In an alternative scenario, price could head towards 1st resistance line at 1.38082, where the 78.6% Fibonacci line is.
Areas of consideration:
- H4 time frame, 1st resistance at 1.38082
- H4 time frame, 2nd resistance at 1.39775
- H4 time frame, 1st support at 1.35029
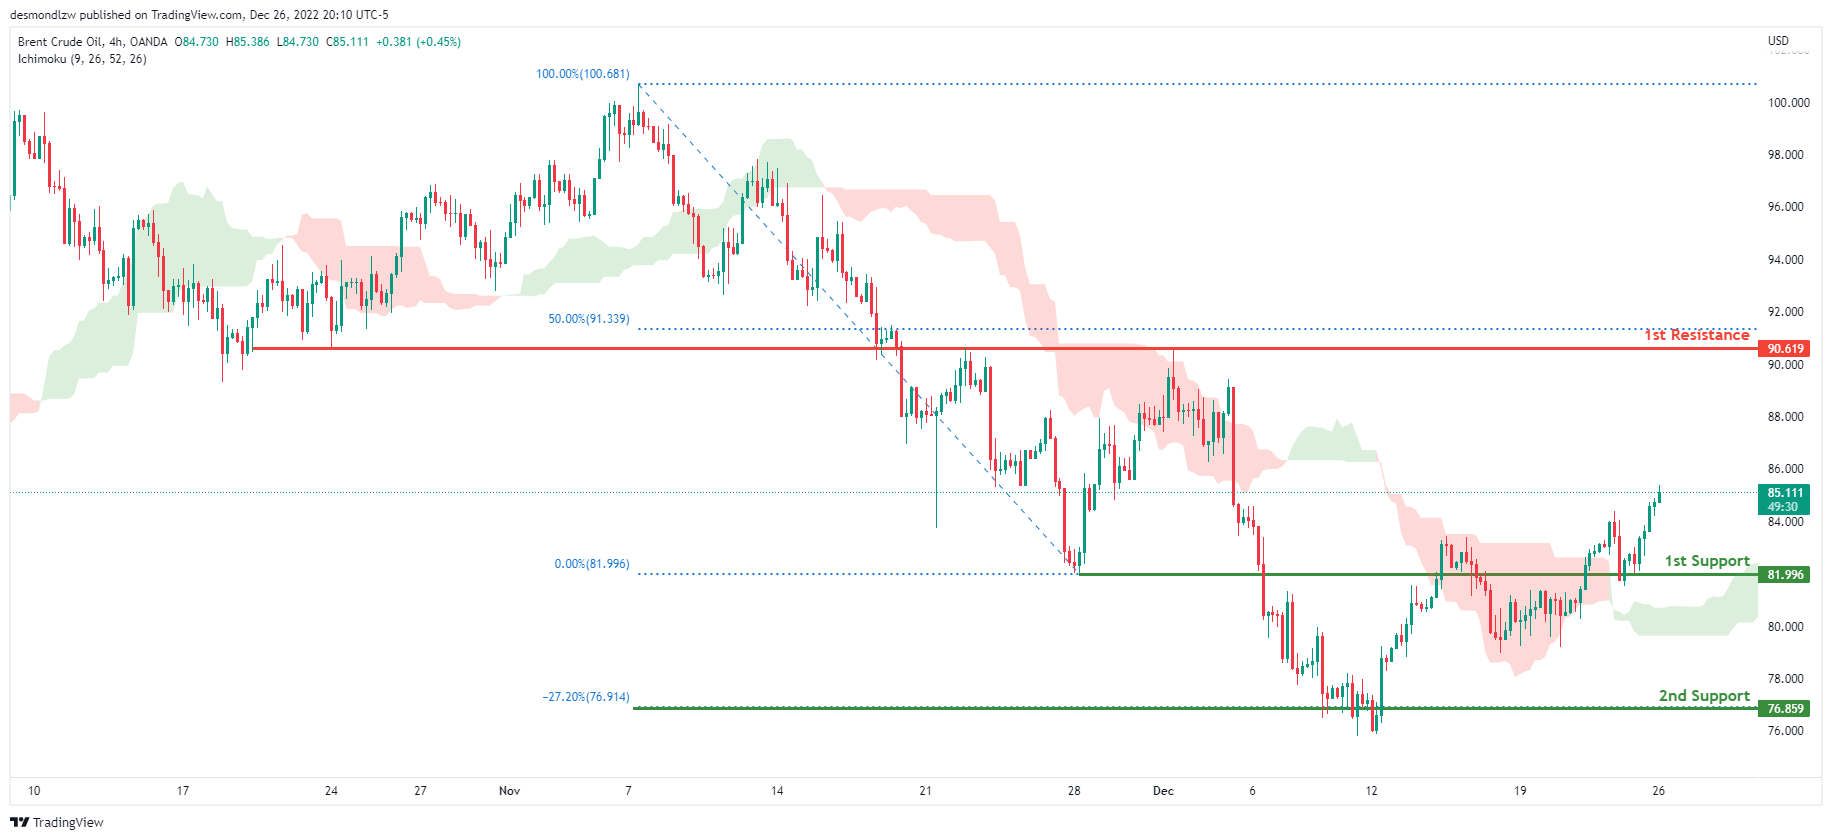
OIL:
Looking at the H4 chart, my overall bias for BCOUSD is bullish due to the current price being above the Ichimoku cloud, indicating a bullish market. If this bullish momentum continues, expect the price to possibly head towards the 1st resistance at 90.619, where the 50% Fibonacci line is. In an alternate scenario, price could possibly head back down to retest the 1st support level at 81.996, where the previous low is located.
Areas of consideration:
- H4 time frame, 1st resistance at 90.619
- H4 time frame, 1st support at 81.996
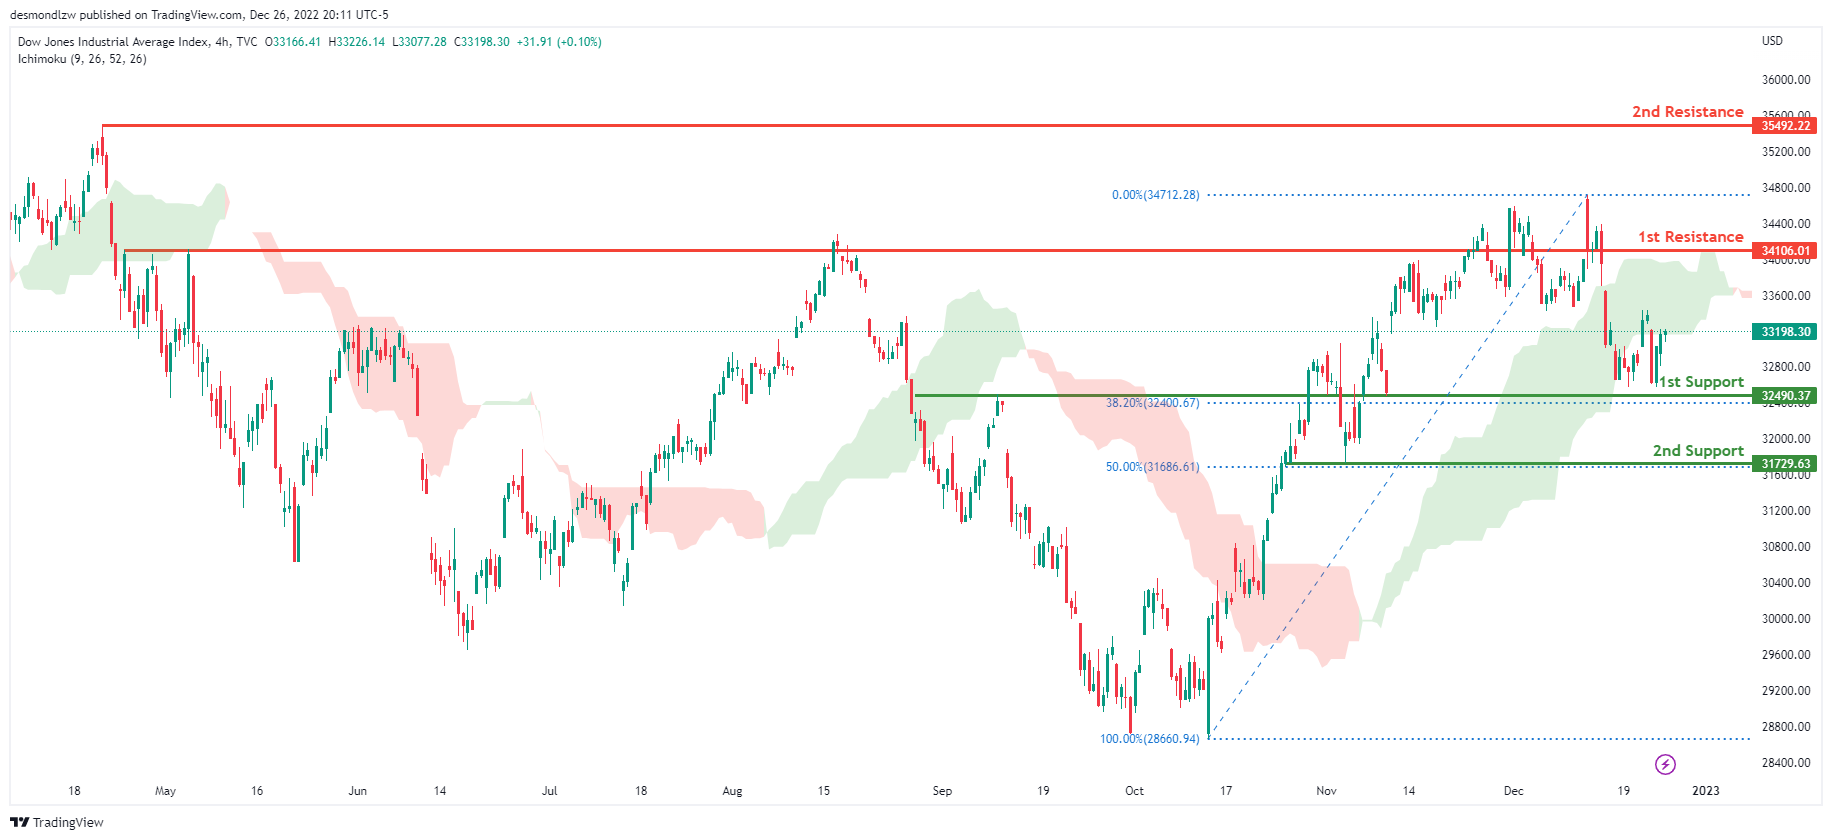
Dow Jones Industrial Average:
On the H4 chart, the overall bias for DJI is bearish. To add confluence to this, the price is crossing below the Ichimoku cloud which indicates a bearish market. If this bearish momentum continues, expect the price to head back down towards the 1st support at 32490.37, where the 61.8% Fibonacci line is. In an alternative scenario, price could possibly break the 1st resistance line at 34106.01, where the previous swing high is before heading towards the 2nd resistance line at 35492.22, where the previous swing high is.
Areas of consideration:
- H4 time frame, 1st support at 32490.37
- H4 time frame, 1st Resistance at 34106.01
- H4 time frame, 2nd Resistance at 35492.22
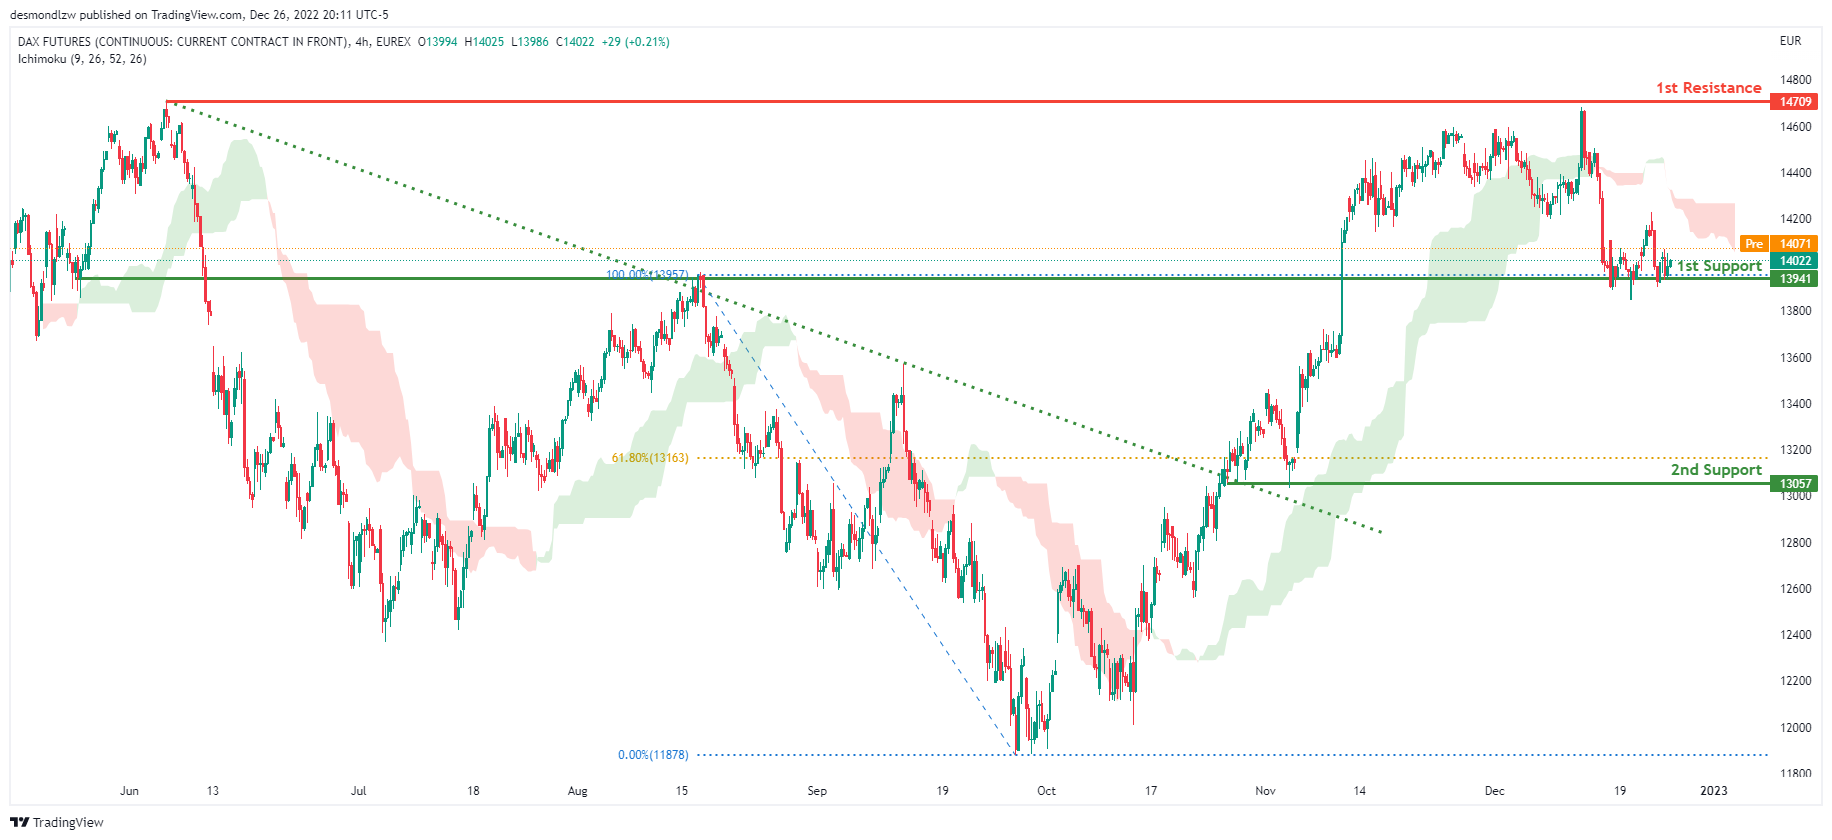
DAX:
Looking at the H4 chart, my overall bias for DAX is bearish due to the current price being below the Ichimoku cloud, indicating a bearish market. If this bearish momentum continues, expect price to break the 1st support at 13941 where the previous swing high is before heading towards the 2nd support at 13057, where the 61.8% Fibonacci line is. In an alternative scenario, price could possibly head back up to retest the 1st resistance at 14709, where the previous swing high is.
Areas of consideration:
- H4 time frame, 1st resistance is at 14709
- H4 time frame, 1st support is at 13941
- H4 time frame, 2nd support is at 13057
ETHUSD:
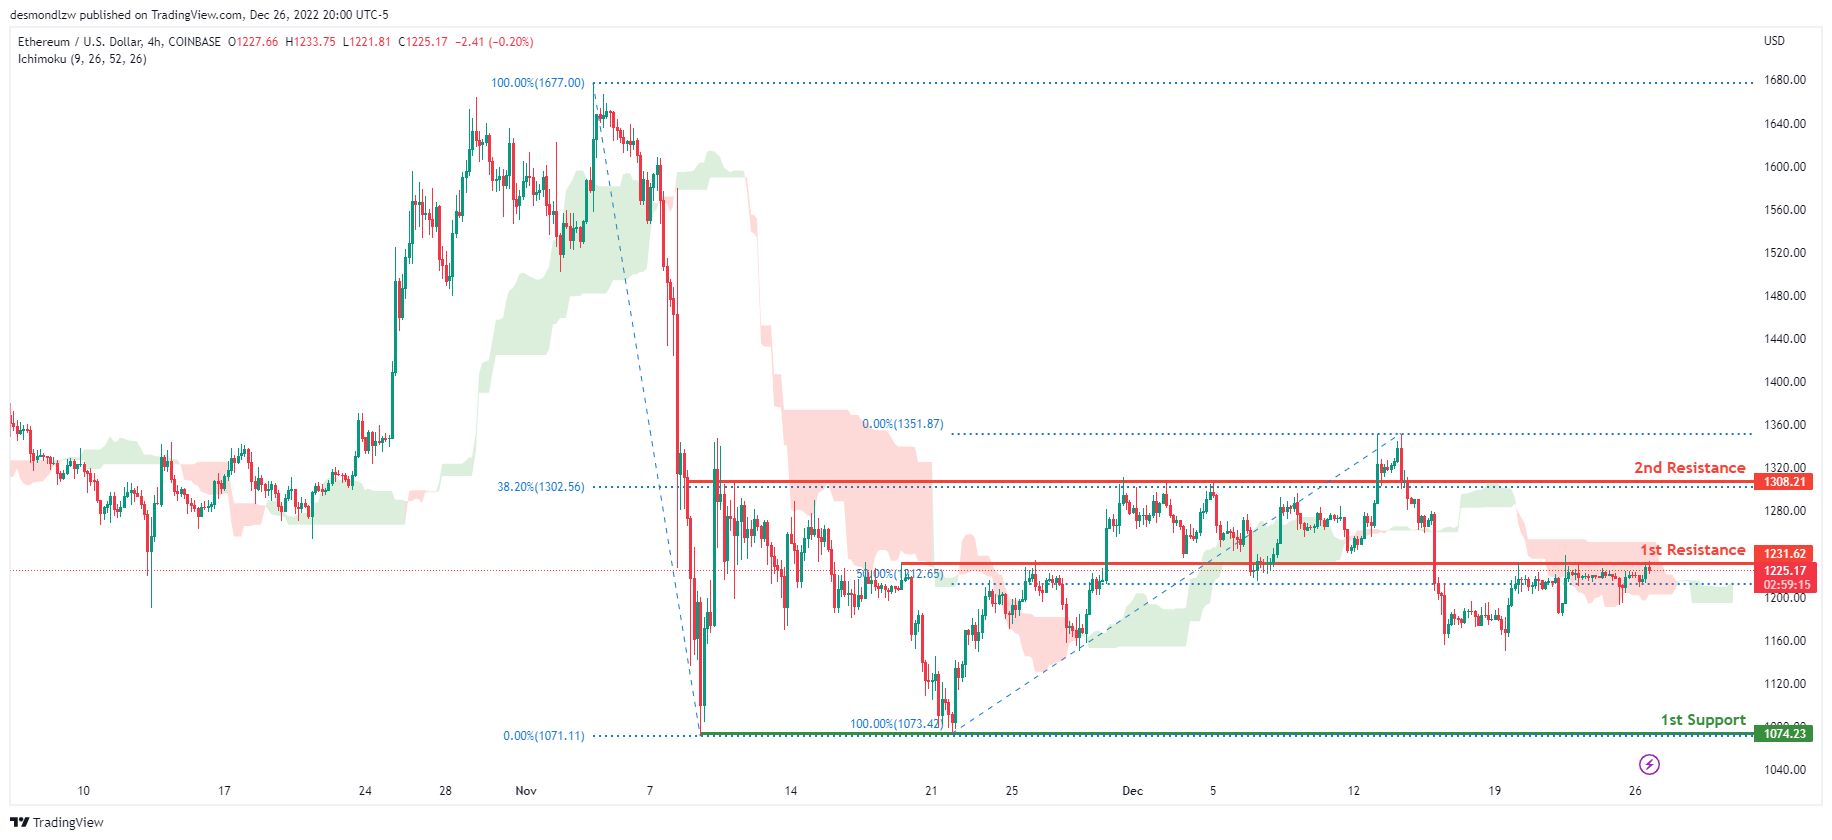
Looking at the H4 chart, my overall bias for ETHUSD is bearish due to the current price crossing below the Ichimoku cloud, indicating a bearish market. If this bearish momentum continues, expect price to head towards the 1st support at 1074.23, where the previous swing low is. In an alternative scenario, price could head back up to break the 1st resistance at 1231.62, where the 50% Fibonacci line is, before heading towards the 2nd resistance at 1308.21, where the 38.2% Fibonacci line is.
Areas of consideration:
- H4 time frame, 1st resistance of 1231.62
- H4 time frame, 2nd resistance of 1308.21
- H4 time frame, 1st support at 1074.23
BTCUSD:
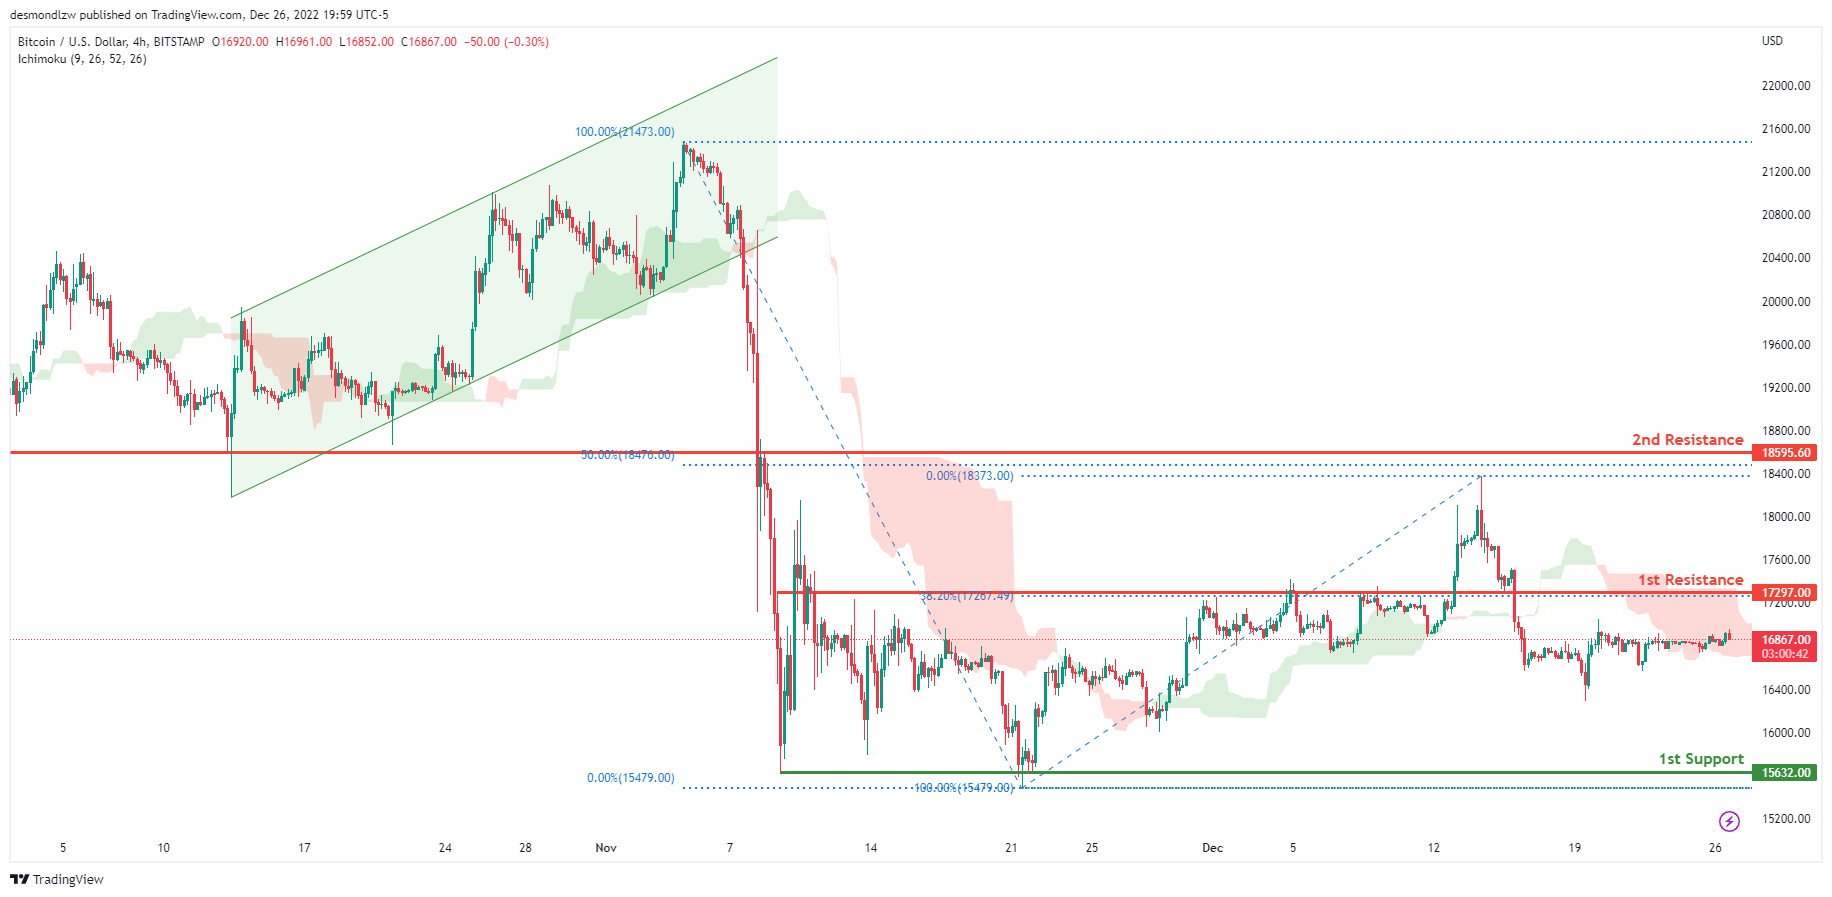
Looking at the H4 chart, my overall bias for BTCUSD is bearish due to the current price crossing below the Ichimoku cloud, indicating a bearish market. If this bearish momentum continues, expect price to possibly continue heading towards the 1st support at 15632.00, where the previous swing low is. In an alternative scenario, price could possibly head up towards the 1st resistance at 17297.00, where the 38.2% Fibonacci line is.
Areas of consideration:
- H4 time frame, 1st resistance 17297.00
- H4 time frame, 1st support at 15632.00
S&P 500:
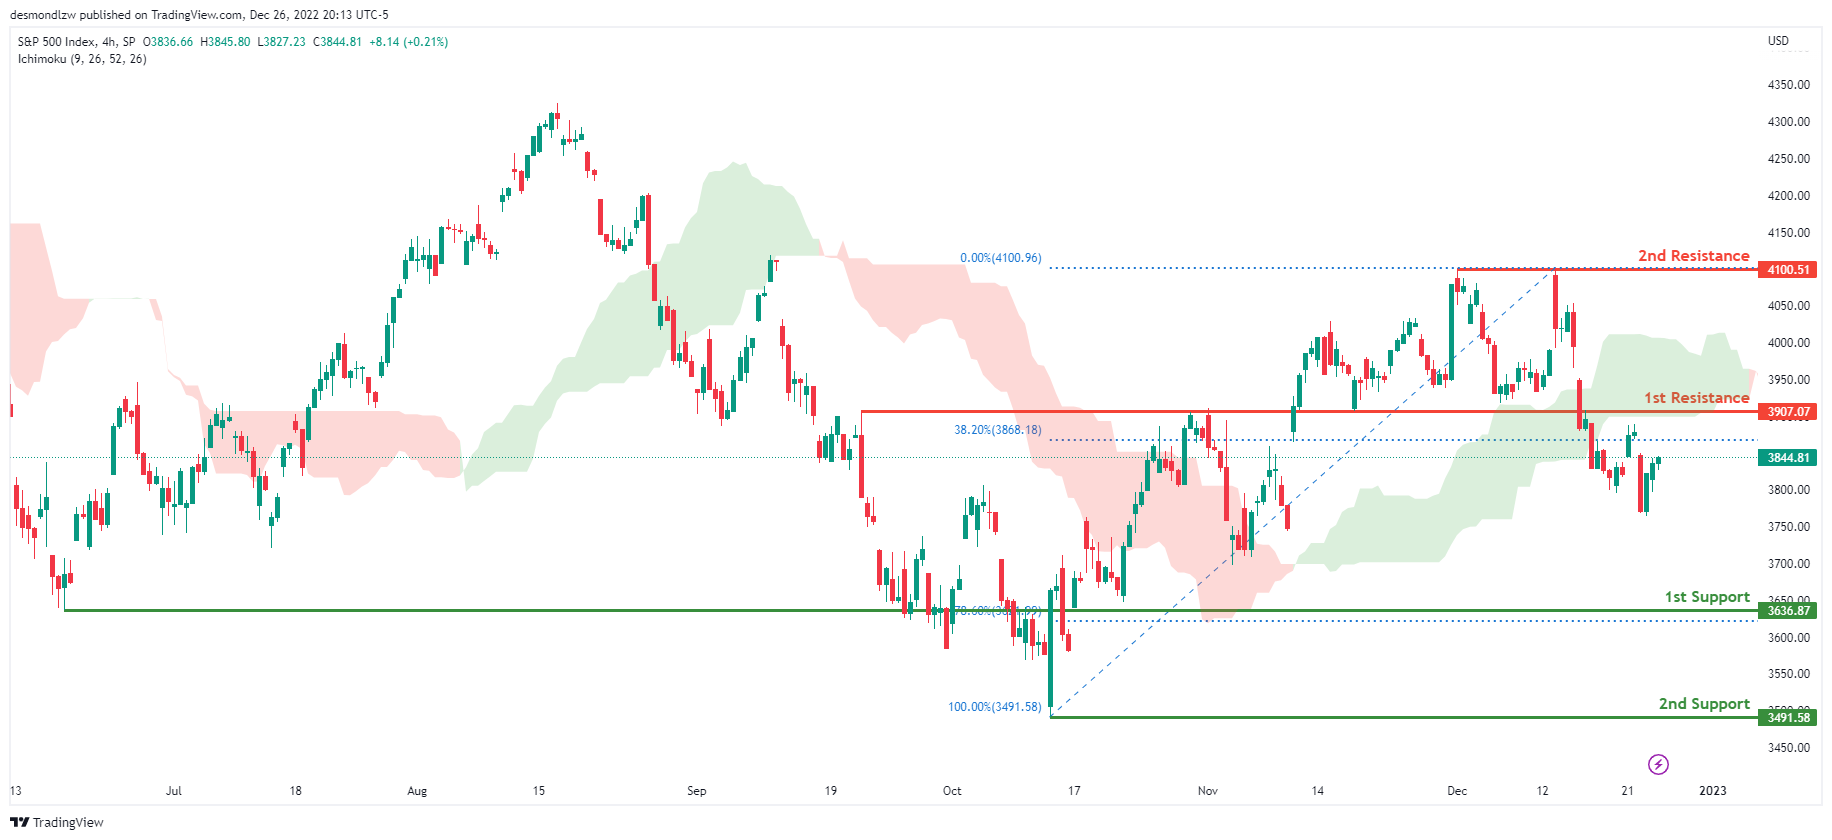
Looking at the H4 chart, my overall bias for S&P500 is bearish due to the current price being below the Ichimoku cloud, indicating a bearish market. If this bearish momentum continues, expect the price to continue heading towards the 1st support at 3636.87, where the 78.6% Fibonacci line is. In an alternative scenario, price could possibly head back up to retest the 1st resistance at 3907.07, where the 38.2% Fibonacci line is.
Areas of consideration:
- H4 time frame, 1st support at 3636.87
- H4 time frame, 1st resistance at 3907.07
Elliott Wave Forecasts Rally in Nasdaq (NQ) to Fail for Further Downside
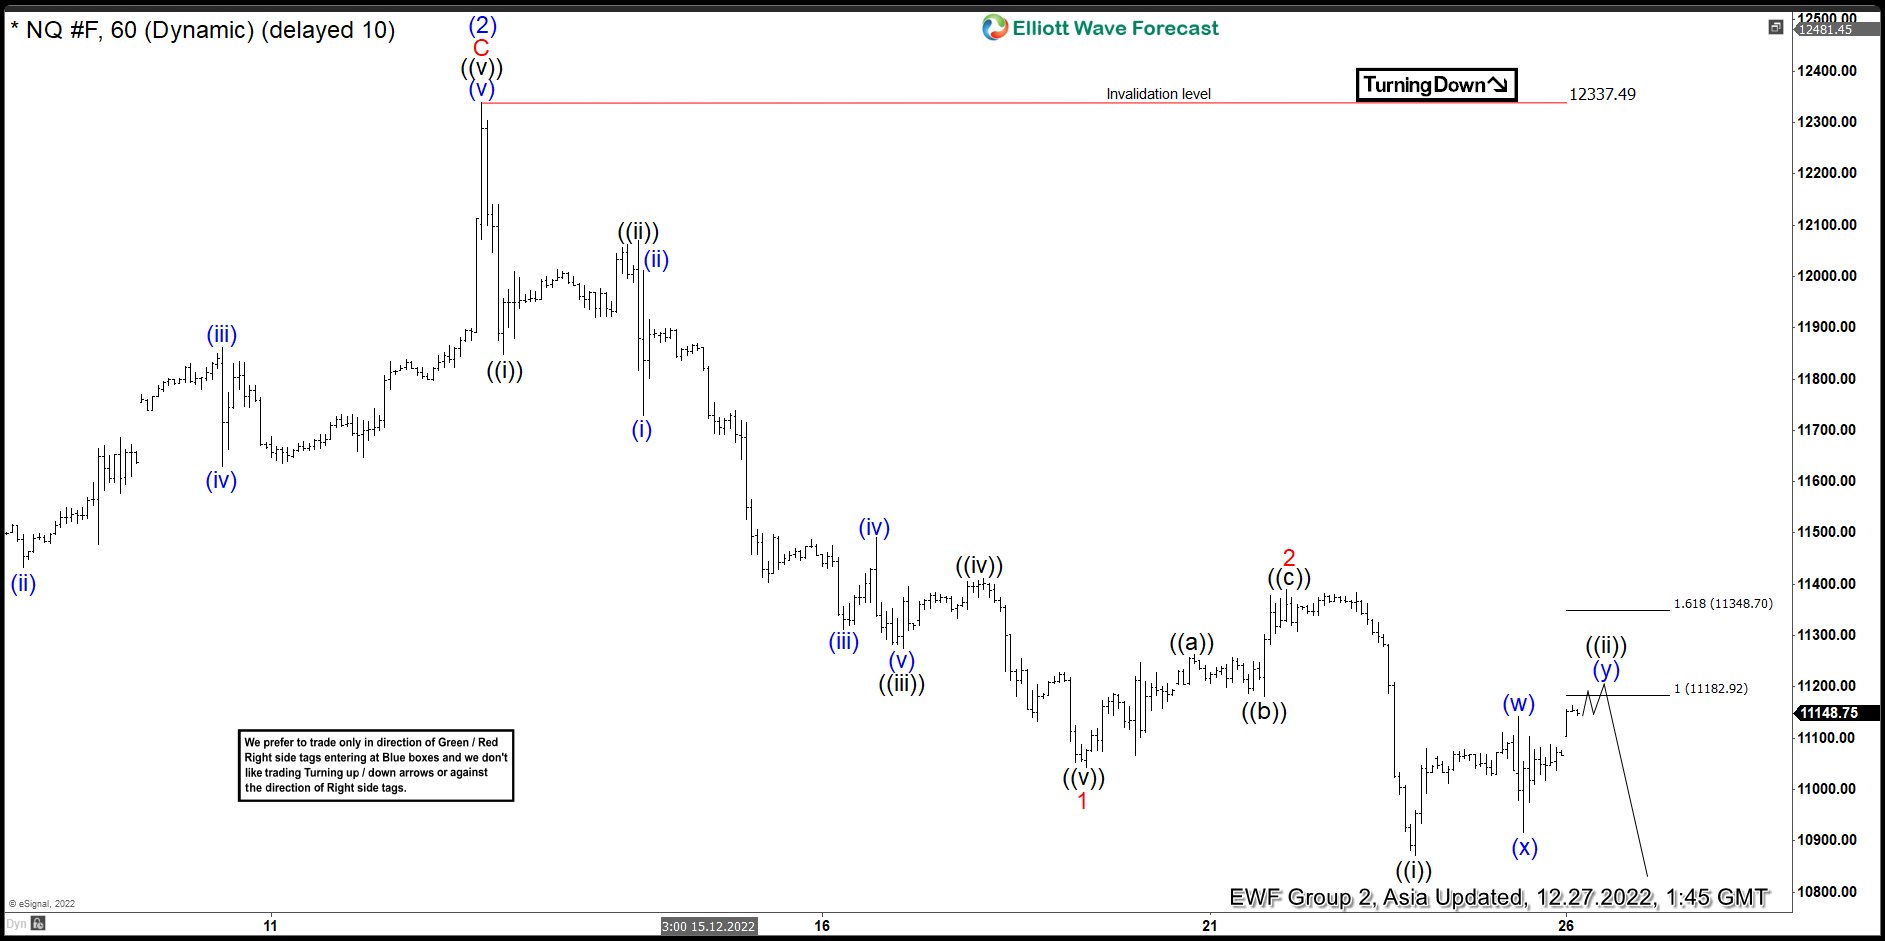
Short term, Elliott wave view in Nasdaq (NQ) suggests that the decline from 8.16.2022 high is unfolding as a 5 waves impulse Elliott Wave structure. Down from 8.16.2022 high, wave (1) ended at 10890.75 and rally in wave (2) ended at 12339. Internal subdivision of wave (2) unfolded as an expanded Flat structure where wave A ended at 11729.75 and pullback in wave B ended at 10484.75. Final leg wave C ended at 12337.49 which completed wave (2). Index then resumes lower from there in wave (3). Down from wave (2), wave ((i)) ended at 11847 and rally in wave ((ii)) ended at 12069.50. Index resumes lower in wave ((iii)) towards 11275, wave ((iv)) ended at 11411, and final leg lower wave ((v)) ended at 11043.50. This completed wave 1 in higher degree.
Wave 2 corrective rally ended at 11389.75 with internal subdivision as a zigzag structure. Up from wave 1, wave ((a)) ended at 11263.75 and pullback in wave ((b)) ended at 11181. Final leg higher wave ((c)) ended at 11389.75 which completed wave 2. The Index resumes lower in wave 3 with internal subdivision as another impulse. Down from wave 2, wave ((i)) ended at 10870.50. As far as rally fails below wave 2 at 11389.75 and more importantly below wave (2) high at 12337.49, expect the Index to extend lower.
Nasdaq 60 Minutes Elliott Wave Chart