Sample Category Title
GBP/USD Reaches Key Support, Bulls Eye Increase
Key Highlights
- GBP/USD corrected lower from the 1.2450 zone.
- It traded below a major bullish trend line with support at 1.2330 on the 4-hours chart.
- EUR/USD corrected lower and tested the 1.0580 zone.
- Gold price could attempt a fresh increase if it stays above the $1,780 zone.
GBP/USD Technical Analysis
The British Pound started a downside correction from the 1.2450 zone against the US Dollar. GBP/USD declined below the 1.2300 and 1.2250 support levels.
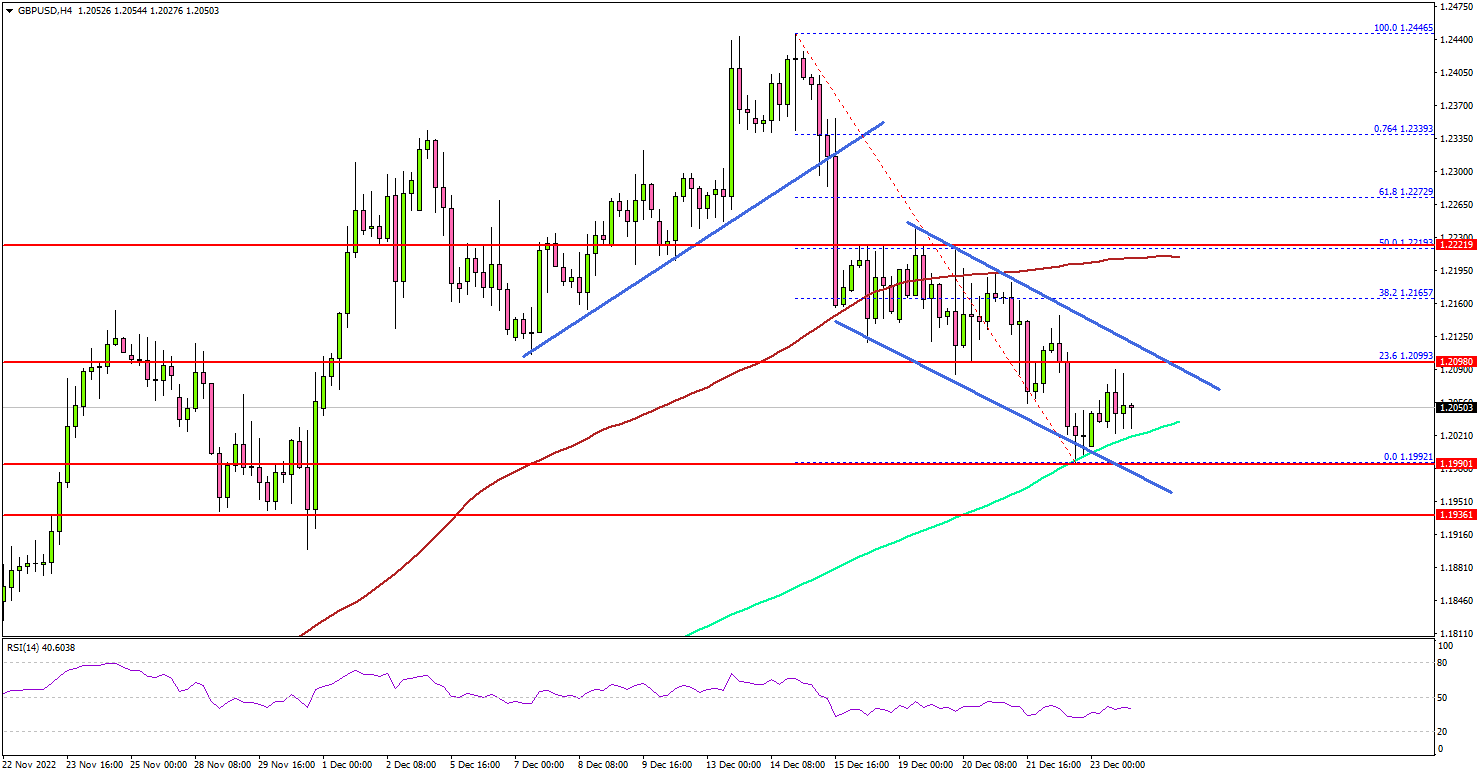
Looking at the 4-hours chart, the pair even traded below the 1.2200 level to move into a short-term bearish zone. During the decline, there was a break below a major bullish trend line with support at 1.2330.
There was a close below the 1.2200 level and the 100 simple moving average (red, 4-hours). The pair tested the 1.2000 support zone and 200 simple moving average (green, 4-hours).
On the downside, there is a major support at 1.2000. A downside break below the 1.2000 zone might spark a major decline. Any more losses might open the doors for a move towards the 1.1850 support zone.
On the upside, an initial resistance is near the 1.2100 level. The next major resistance may perhaps be near 1.2200. A clear move above the 1.2200 resistance might start a steady increase.
In the stated case, GBP/USD may perhaps rise towards the 1.2280 level. Any more gains could lead the pair towards the 1.23200 resistance zone or the 1.2400 level.
Looking at gold price, the bulls seem to be active above the $1,780 level and they might attempt a fresh increase in the near term.
Economic Releases
- Dallas Fed Manufacturing Business Index for Dec 2022 – Forecast -15.0, versus -14.4 previous.
- S&P/Case-Shiller Home Price Indices for Oct 2022 (YoY) - Forecast +9.7%, versus +10.4% previous.
Japan retail sales rose 2.6% yoy in Nov, unemployment rate down to 2.5%
Japan retail sales rose 2.6% yoy in November, below expectation of 3.8% yoy. The growth rate slowed from 4.4% in October and 4.8% in September. Nonetheless, that's still the ninth straight month of expansion.
Released separately, unemployment rate fell from 2.6% to 2.5% in November, better than expectation of 2.6%. The jobs-to-applicants ratio was unchanged from October's 1.35. This gauge of job availability stayed at the highest level since march 2020.
ECB Knot: We are just at the beginning of the second half
ECB Governing Council member Klaas Knot said in an FT interview that in the five monetary policy meetings from now till July, the central bank would deliver "quite a decent pace of tightening".
"The risk of us doing too little is still the bigger risk," Knot said. "We are just at the beginning of the second half."
By slow the pace from 75bps to 50bps, "we grant ourselves a little bit more time along the way as we tighten into 2023 to evaluate the effects of our tightening," he added.
Knot also said recent economic data indicated that recession in the bloc would be "short and shallow" and the "worst... may already be behind us".
BoJ Kuroda: Japan approaching a critical juncture away from low inflation and growth
BoJ Governor Haruhiko Kuroda said yesterday that widening of the allowed band for 10-year JGB yield was "definitely not a step toward an exit" of ultra loose monetary policy.
"The Bank will aim to achieve the price target in a sustainable and stable manner, accompanied by wage increases, by continuing with monetary easing under yield curve control," he added.
"Labour market conditions in Japan are projected to tighten further, and firms' price- and wage-setting behaviour is also likely to change," Kuroda said. "In this sense, Japan is approaching a critical juncture in breaking out of a prolonged period of low inflation and low growth."
EURCHF Wave Analysis
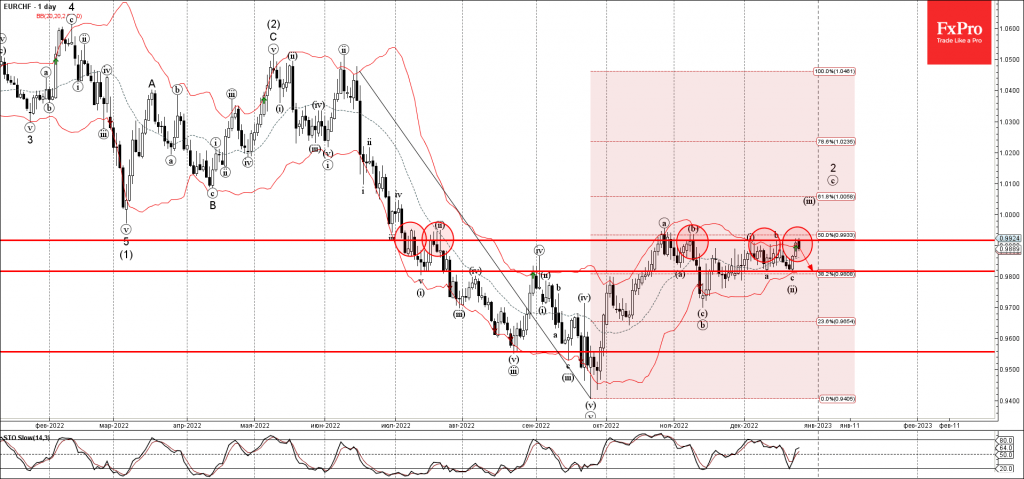
- EURCHF reversed from resistance level 0.9920
- Likely to fall to support level 0.9815
EURCHF today reversed down once again from the powerful resistance level 0.9920 (which has been reversing the price from the start of July), intersecting with the upper daily Bollinger Band and the 50% Fibonacci correction of the sharp downward impulse from June.
The downward reversal from the resistance level 0.9920 stopped the previous short-term ABC correction 2.
Given the predominant daily downtrend, EURCHF can be expected to fall further toward the next support level 0.9815 (which stopped the previous waves a and (ii)).
USDJPY Wave Analysis
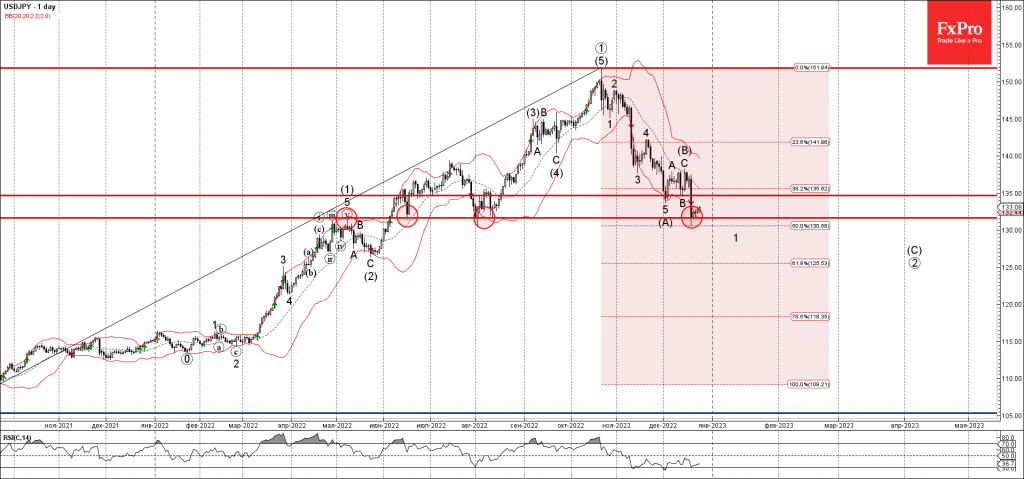
- USDJPY reversed from key support level 131.60
- Likely to rise to resistance level 135.00
USDJPY recently reversed up from the key support level 131.60 (former monthly high from May), intersecting with the lower daily Bollinger Band and the 50% Fibonacci retracement of the upward trend from last year.
The support level 131.60 has been repeatedly reversing the price from the middle of June.
Given the clear daily uptrend, USDJPY can be expected to rise further toward the next resistance level 135.00 (former support which stopped the previous waves (A) and B).
Dollar and Euro 2020-2022: Forecasts and Realities
Traditionally, we publish currency forecasts from the world's leading financial institutions at the turn of the outgoing and coming years. We did this two years, and a year ago. Therefore, we can not only look into the future now, but also analyze whether experts were right in the past.
2020-2021: EUR/USD in Times of COVID
December 2019 There was no talk of a global pandemic that month, when the first outbreak of COVID-19 was recorded in Wuhan, China. But even then, the Financial Times published a forecast of Citigroup experts that the quantitative easing (QE) policy pursued by the US Federal Reserve and pumping the market with cheap dollar liquidity could cause the dollar to fall.
As the pandemic raged on, this scenario began to prove its case. The dollar began to lose ground starting from the last decade of March 2020. The Fed's printing press was running at full capacity, flooding the US market with new cheap dollars. There were no plans to curtail monetary stimulus and, moreover, to raise the interest rate. Starting from 1.0630 on March 22, 2020, EUR/USD met the new 2021 at 1.2300.
The pair continued to grow with the onset of 2021. But this trend lasted... less than one week. It reached the level of 1.2350 on January 6, and this was the year's high. Everything changed starting from January 7, and the dollar began to win back losses.
The US currency moved in a sinusoidal manner until the end of May, fluctuating along with the waves of the coronavirus and statements by the Fed leaders. But the mood of the US Central Bank began to clearly change from dovish to hawkish just before summer, the country's economy was recovering, and investors began to grow confident in the imminent rise in the key interest rate from the current "miserable" level of 0.25%. As a result, the dollar went into steady growth, and EUR/USD ended 2021 in the 1.1350 zone, having lost 1,000 points in a year.
2022: EUR/USD During the Russian-Ukrainian Conflict
The prospect of a tightening of the Fed's monetary policy (QT) and a further rate hike inspired investors to be optimistic about the future of the US currency. Experts' forecasts also looked optimistic. The US economy, including the labor market, was recovering at a good pace, and GDP growth was forecast at 5%, which gave the Federal Reserve the opportunity to actively combat inflation. The fact that the interest rate will rise to at least 1.5% by the end of 2023 was almost beyond doubt. Confidence in the further strengthening of the dollar was added by the dovish position of the Central Banks of the G7 countries, which are more tolerant of rising prices.
Strategists at the Dutch banking Group (Internationale Nederlanden Groep) predicted that EUR/USD would trade at 1.1000 in Q4 2022. Analysts of one of the largest financial conglomerates in the world, HSBC (Hongkong and Shanghai Banking Corporation) were in solidarity with ING. “Our main argument,” their forecast said, “is based on two factors supporting the dollar: 1. a slowdown in global economic growth, and 2. the Federal Reserve’s gradual transition to a possible rate hike." In addition, HSBC considered that the ECB would not raise the interest rate on the euro until the end of 2022.
CIBC (Canadian Imperial Bank of Commerce) specialists also sided with the US dollar, setting the same goal for EUR/USD for the last two quarters of 2022: 1.1000. The JP Morgan financial holding assessed the pair's prospects more modestly, pointing to the level of 1.1200.
However, not all financial authorities relied on the growth of the dollar. Thus, Barclays Bank considered the dollar to be highly overvalued. The bank's economists predicted its modest depreciation as risk appetite and commodities surged on the back of the global economic recovery and cooling inflation. The scenario written for EUR/USD in Barclays looked like this: Q1 2022 - growth to 1.1600, Q2 - 1.1800, Q3 and Q4 - movement in the 1.1900 zone.
Reuters interviewed the largest banks represented on Wall Street and published their scenarios of the dynamics of the foreign exchange market for the next 12 months. In addition to the aforementioned JP Morgan and Barclays, the respondents were banking conglomerates Morgan Stanley, Goldman Sachs, as well as Europe's largest asset management company Amundi.
Morgan Stanley believed that the Fed's rate hike would proceed fairly smoothly, while other central banks would move from dovish to hawkish politics. This should lead to convergence in the actions of regulators, put pressure on the dollar and raise EUR/USD to 1.1800.
Goldman Sachs strategists called the same target of 1.1800. And Amundi said the Fed "can do little to surprise market expectations," although it agreed that the momentum "would remain broadly positive for the dollar." According to the company's strategists, EUR/USD should have ended 2022 around 1.1400.
It's safe to say now that analysts from ING, HSBC, CIBC gave the closest forecast. And it is possible that this forecast could come true by 100%. Or maybe their opponents from Barclays, Morgan Stanley and Goldman Sachs would be right. But if the whole world was turned upside down by the coronavirus pandemic in 2020, a war entered the life of the planet in 2022. Russia's armed invasion of Ukraine and the subsequent anti-Russian sanctions have caused an economic crisis, energy starvation and increased inflation in many countries, even very far from this region.
The proximity of the EU countries to the conflict zone, their heavy dependence on Russian natural energy resources, the nuclear threat and the risk of the transfer of hostilities to their territory all dealt a serious blow to the Eurozone economy and forced the ECB to act as carefully as possible so as not to bring it down completely. The USA found itself in much more favorable conditions, which allowed the Fed not only to continue, but also to accelerate the pace of QT and rate hikes. EUR/USD fell below the 1.0000 parity line for the first time in 20 years on July 14, and it hit a low at 0.9535 on September 28.
The main driver for the strengthening of the dollar was the expectation of a sharp rise in the refinancing rate, supported by the statements and actions of the Fed leaders. The rate was at the level of 0.25% between March 15, 2020 (beginning of the pandemic) to March 16, 2022. It was then raised by 25 basis points (bp), then by another 50 bps, followed by four more 75 bps increases. Then the US Central Bank slightly slowed down the pace of tightening and raised the rate by only 50 bps at its last meeting in 2022, after which it reached 4.50%.
The ECB kept the euro rate at 0.00% for a long time. However, it was forced to start tightening his monetary policy following the Fed. The regulator raised the rate to 0.50% at its meeting on July 21, to 1.25% on September 08, to 2.00% on October 27, and, finally, to 2.50% on December 15.
The fact that the ECB did start tightening its monetary policy has benefited the euro. The fact that Europe filled its oil and gas storage facilities to capacity before the winter cold and also found ways to replace Russian energy resources helped the pan-European currency as well. As a result, EUR/USD rose again above the 1.0000 level and reached a high of 1.0735 on December 15.
***
So, the common European currency lost 2,815 points to the American one from January 06, 2021, to September 28, 2022. Then the euro launched a counterattack, and it managed to win back 1,200 points by the end of the year, or more than 40% of losses. We will tell you what leading experts expect from these two currencies in the coming year, 2023, in a week, in our next review.
In the meantime, let us wish you and your loved ones success in your work, financial well-being, good health and the fulfillment of all your desires, even your most daring ones. And let's hope that unlike the past three years, the coming year will be filled with only positive events. Happy New Year!
USDJPY: How a Dollar Dynamic 2.2 can impact the YEN
Advanced Dollar Dynamic 2.2 – Impact in the Yen.
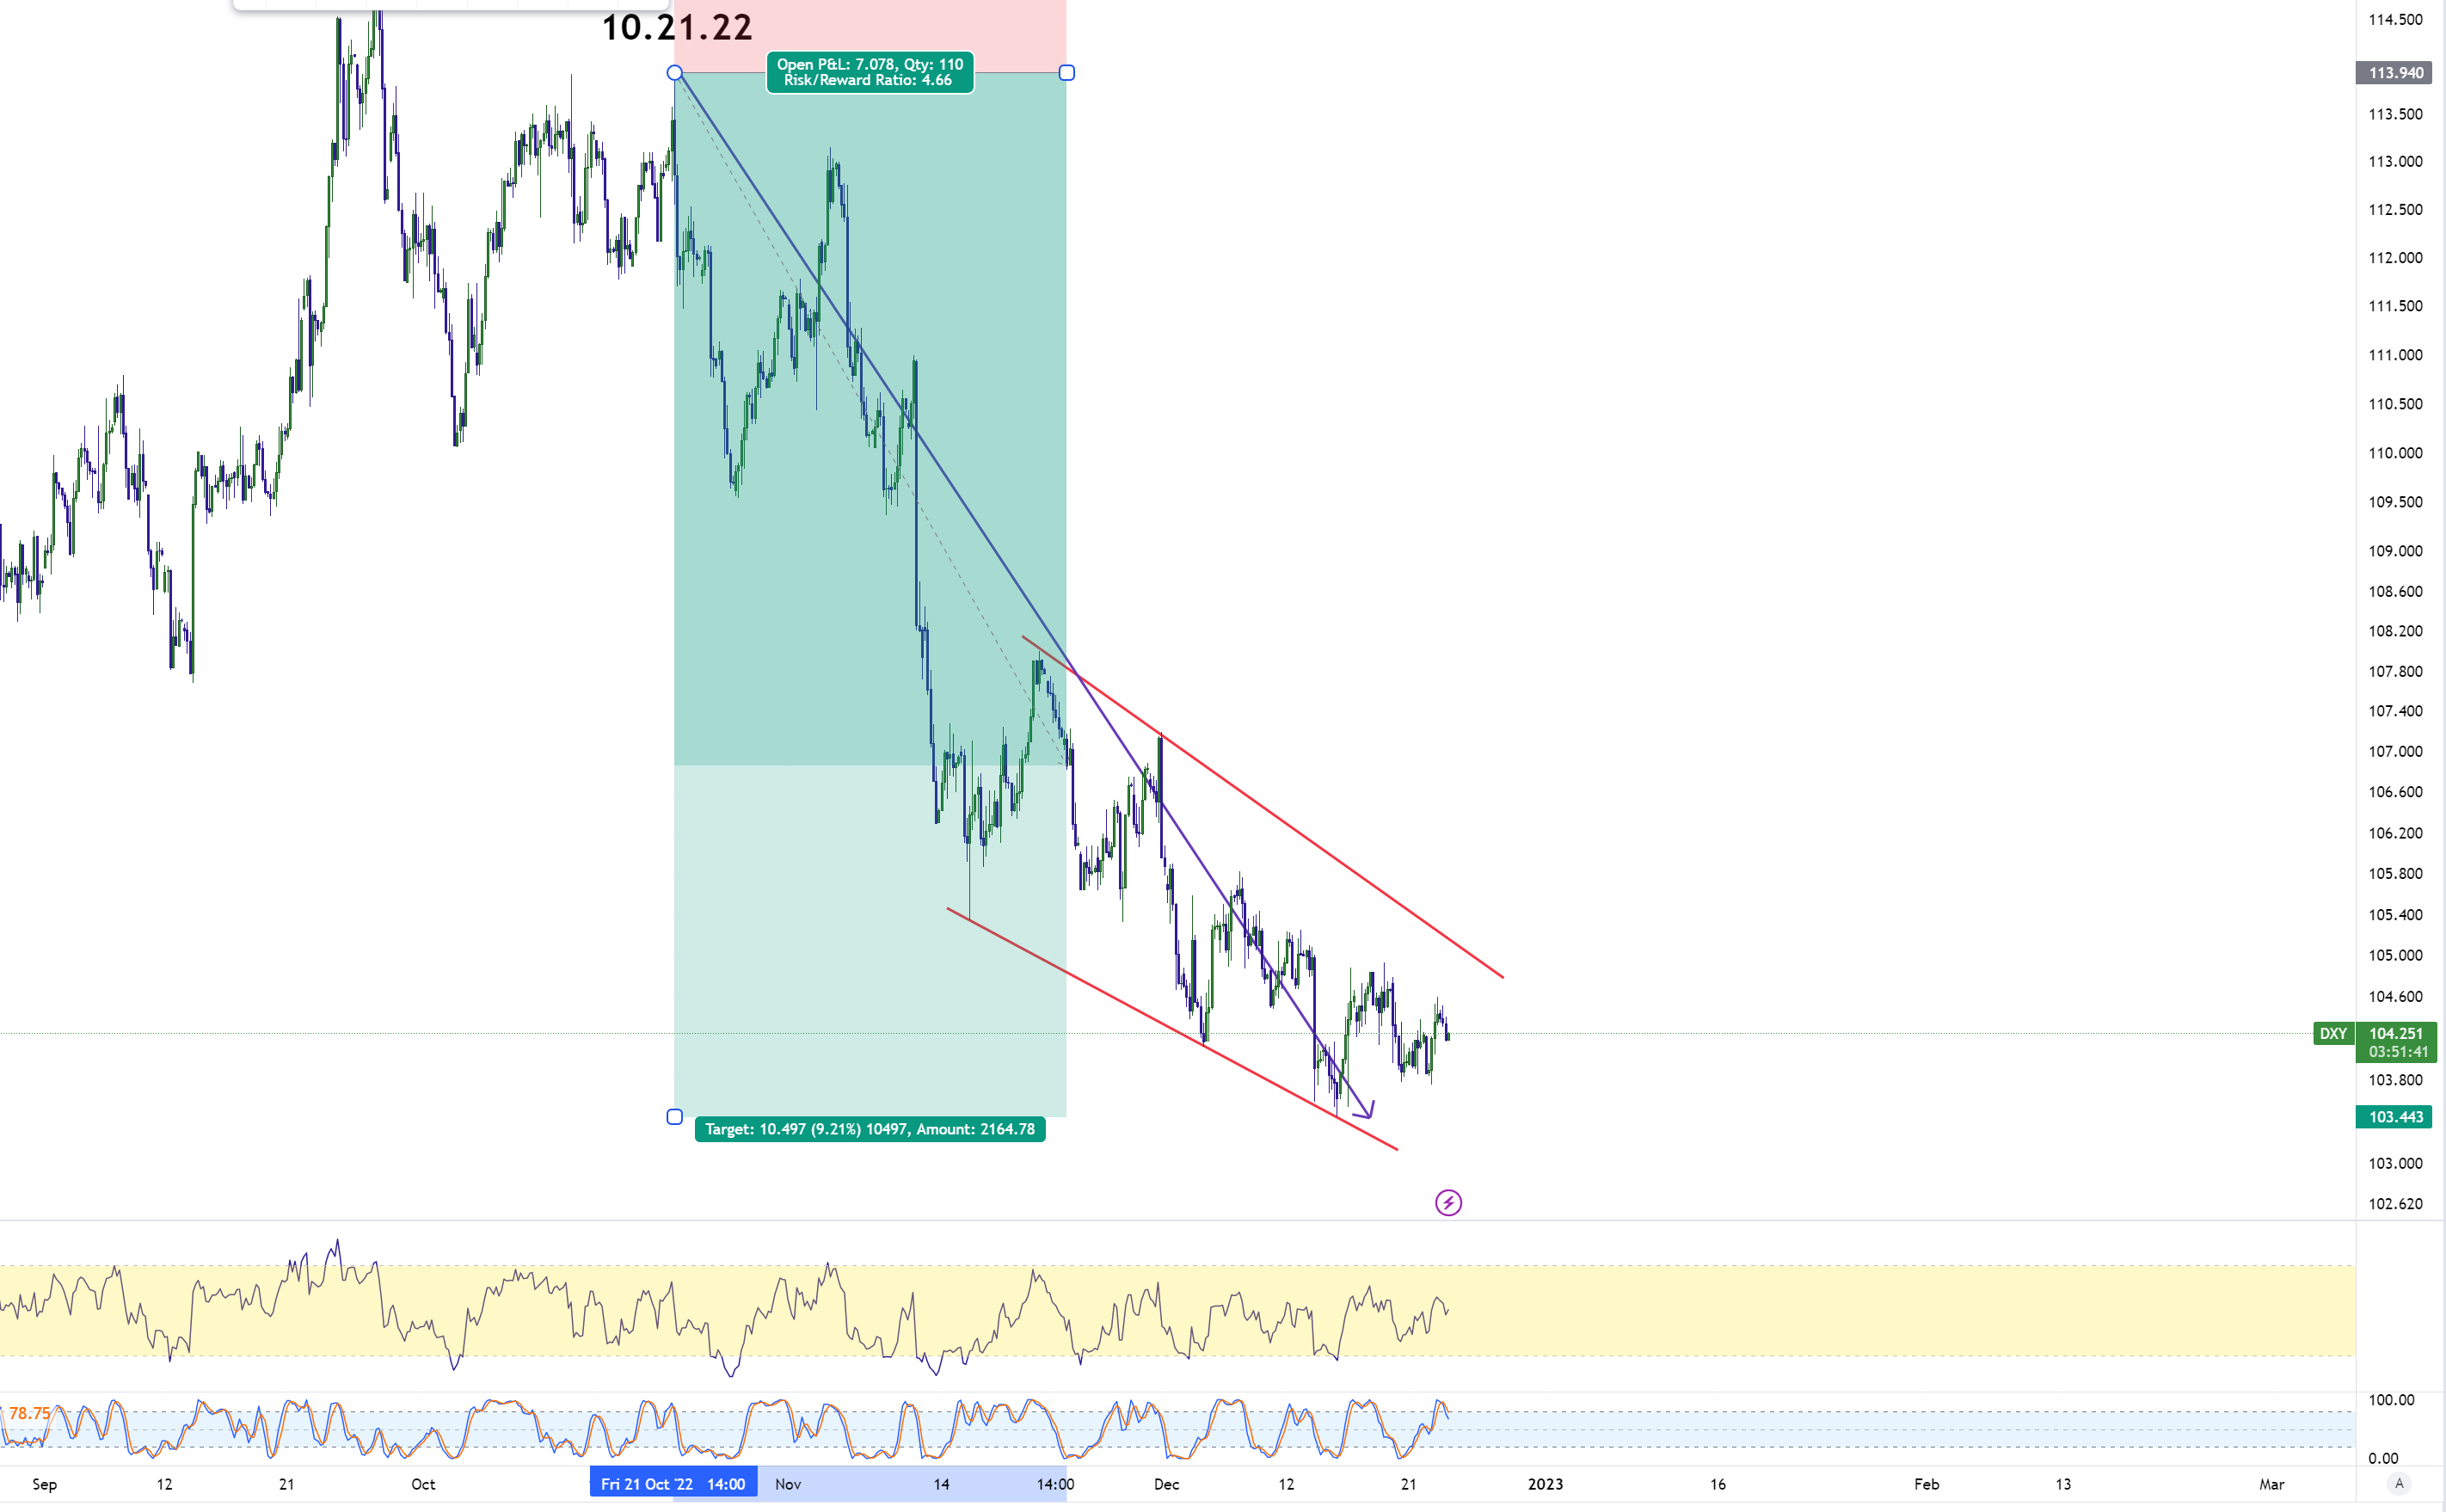
A very interesting dynamic that we got in the last 2 months in the market was the advanced dollar dynamic 2.2. During this dynamic, the move in the USDJPY is of greater magnitude than the move in the dollar pairs.
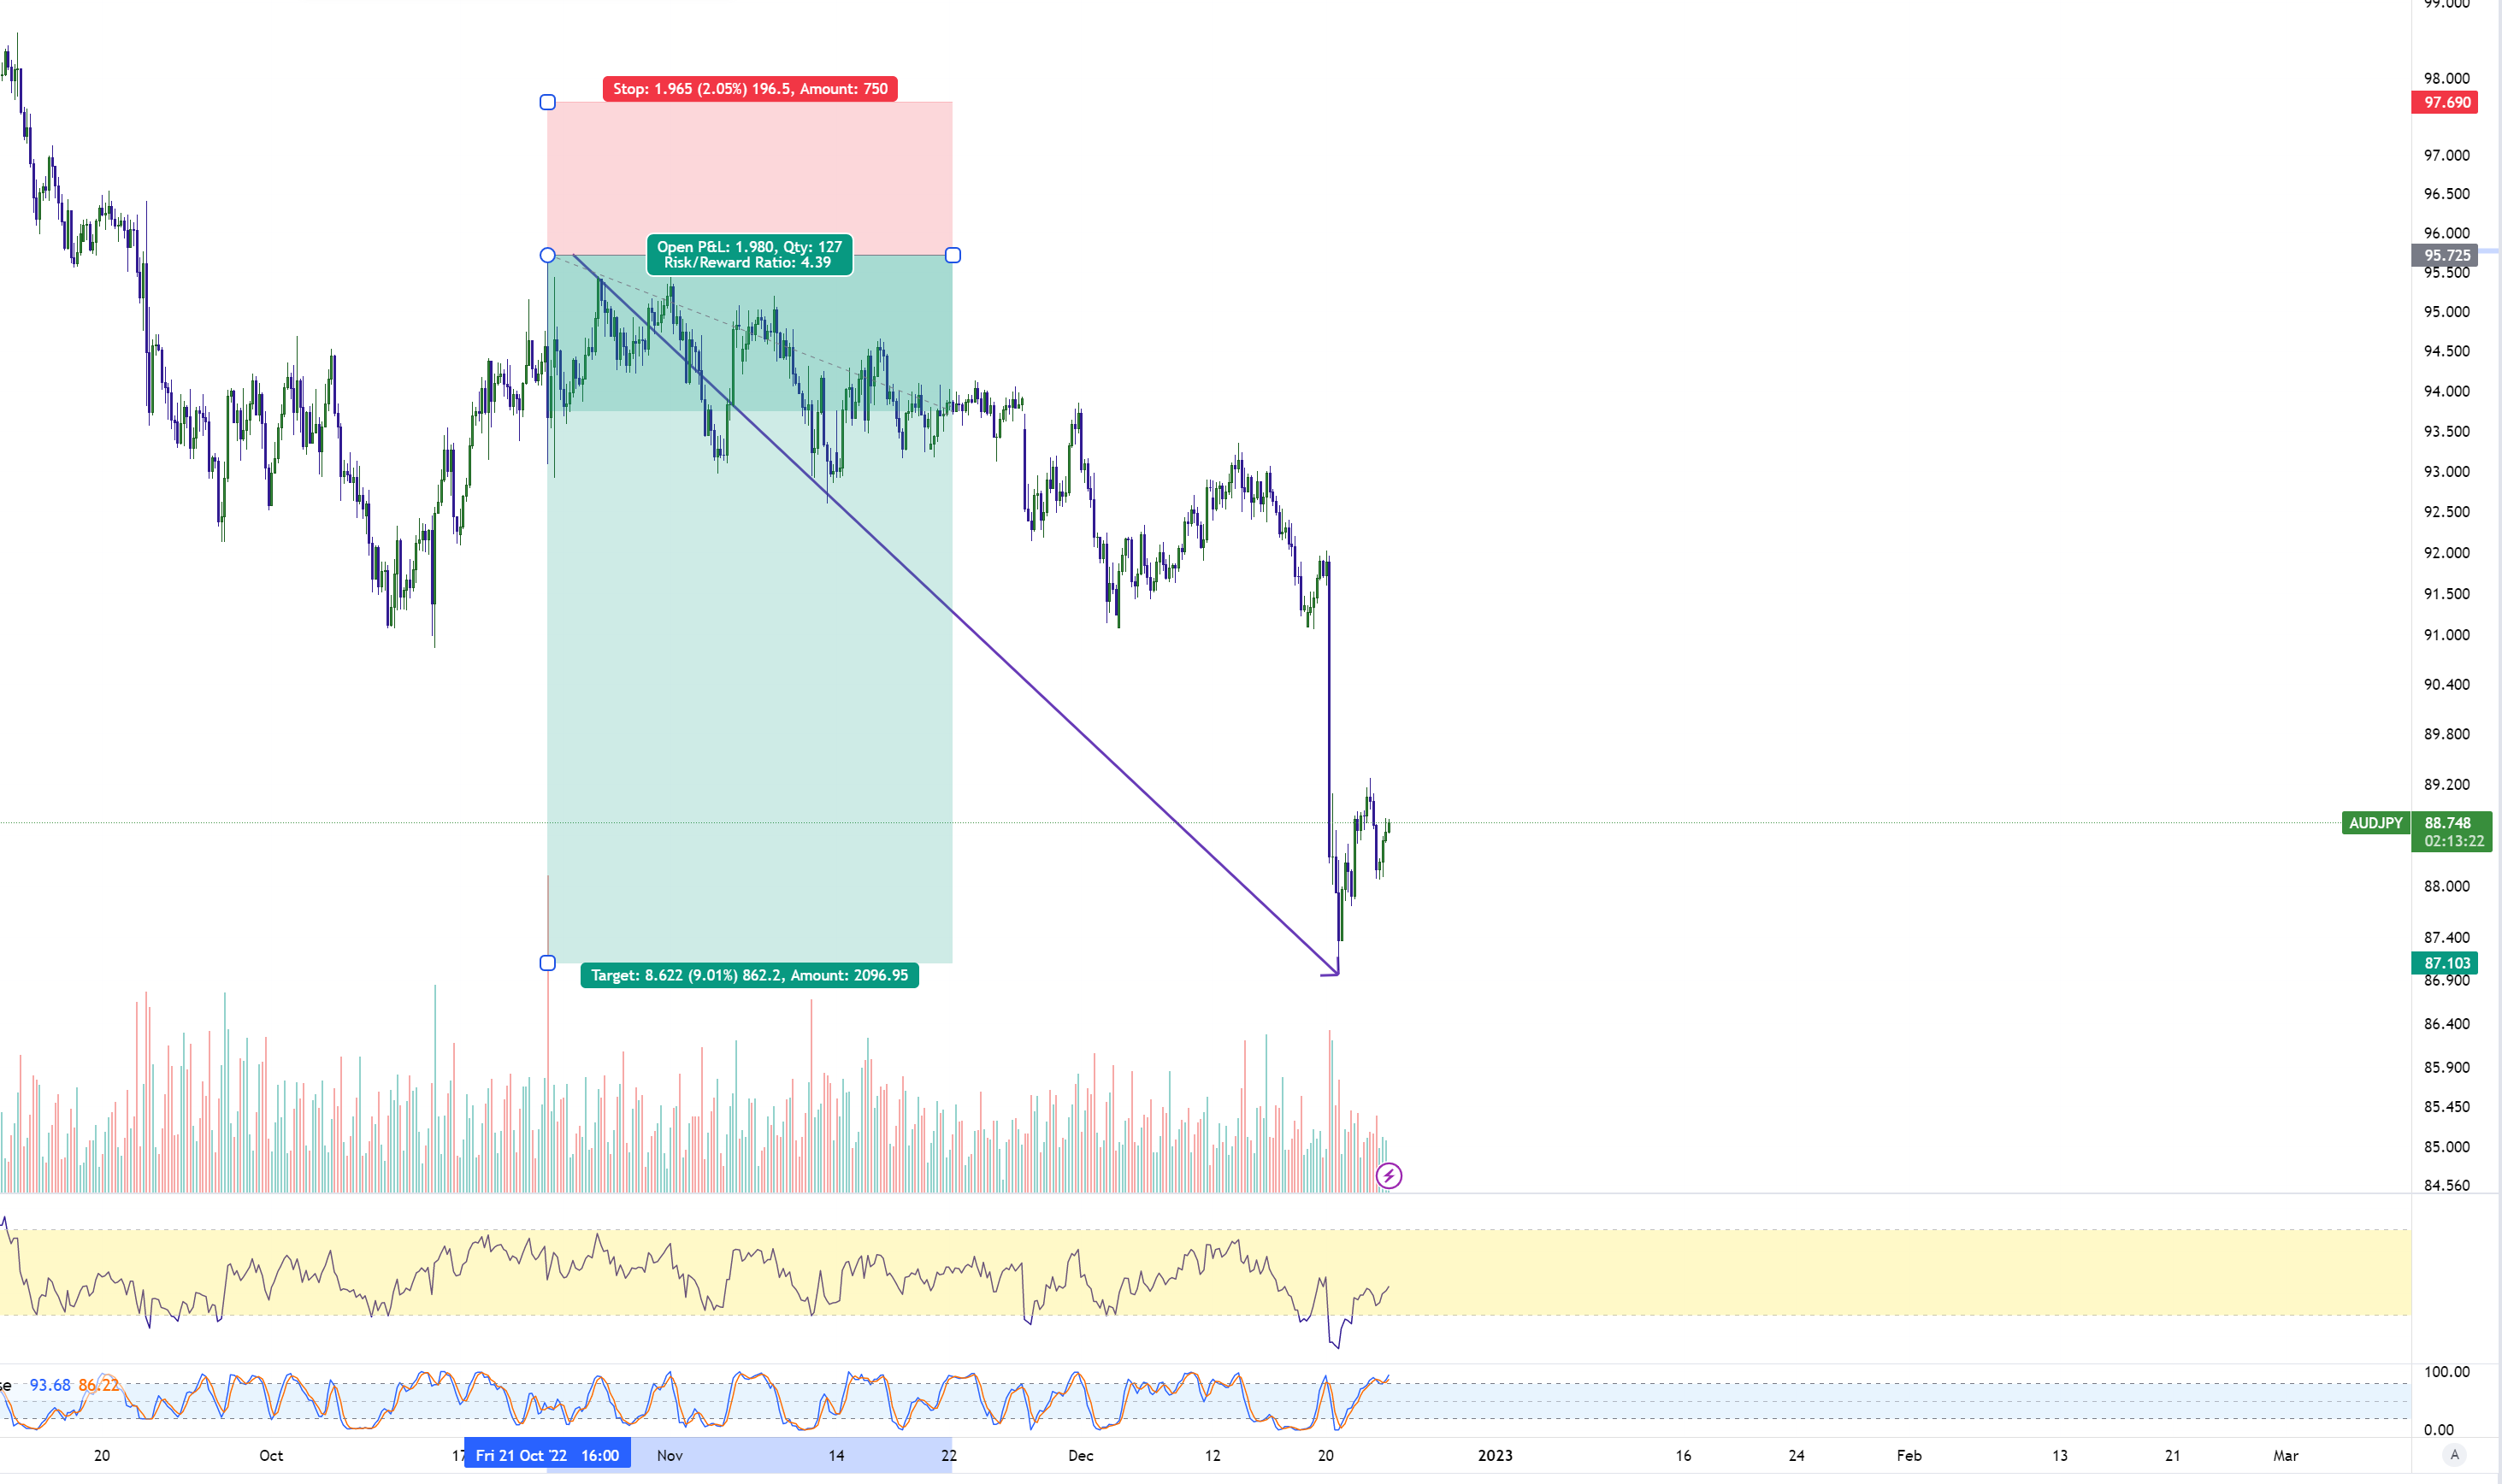
Therefore, then Yen pairs trade sideways to higher (if USDJPY trades higher) or sideways to lower (if USDJPY trades lower).
Since 10.21.22 when we had the secondary peak in the USDX and peak in USDJPY the market has been trading within that dynamic. Let’s first have a look at the USDX since 10.21.22. We can see that it has dropped since that peak to the lowest point 9.21%.
USDX 10.21.22 Dynamic 2.2
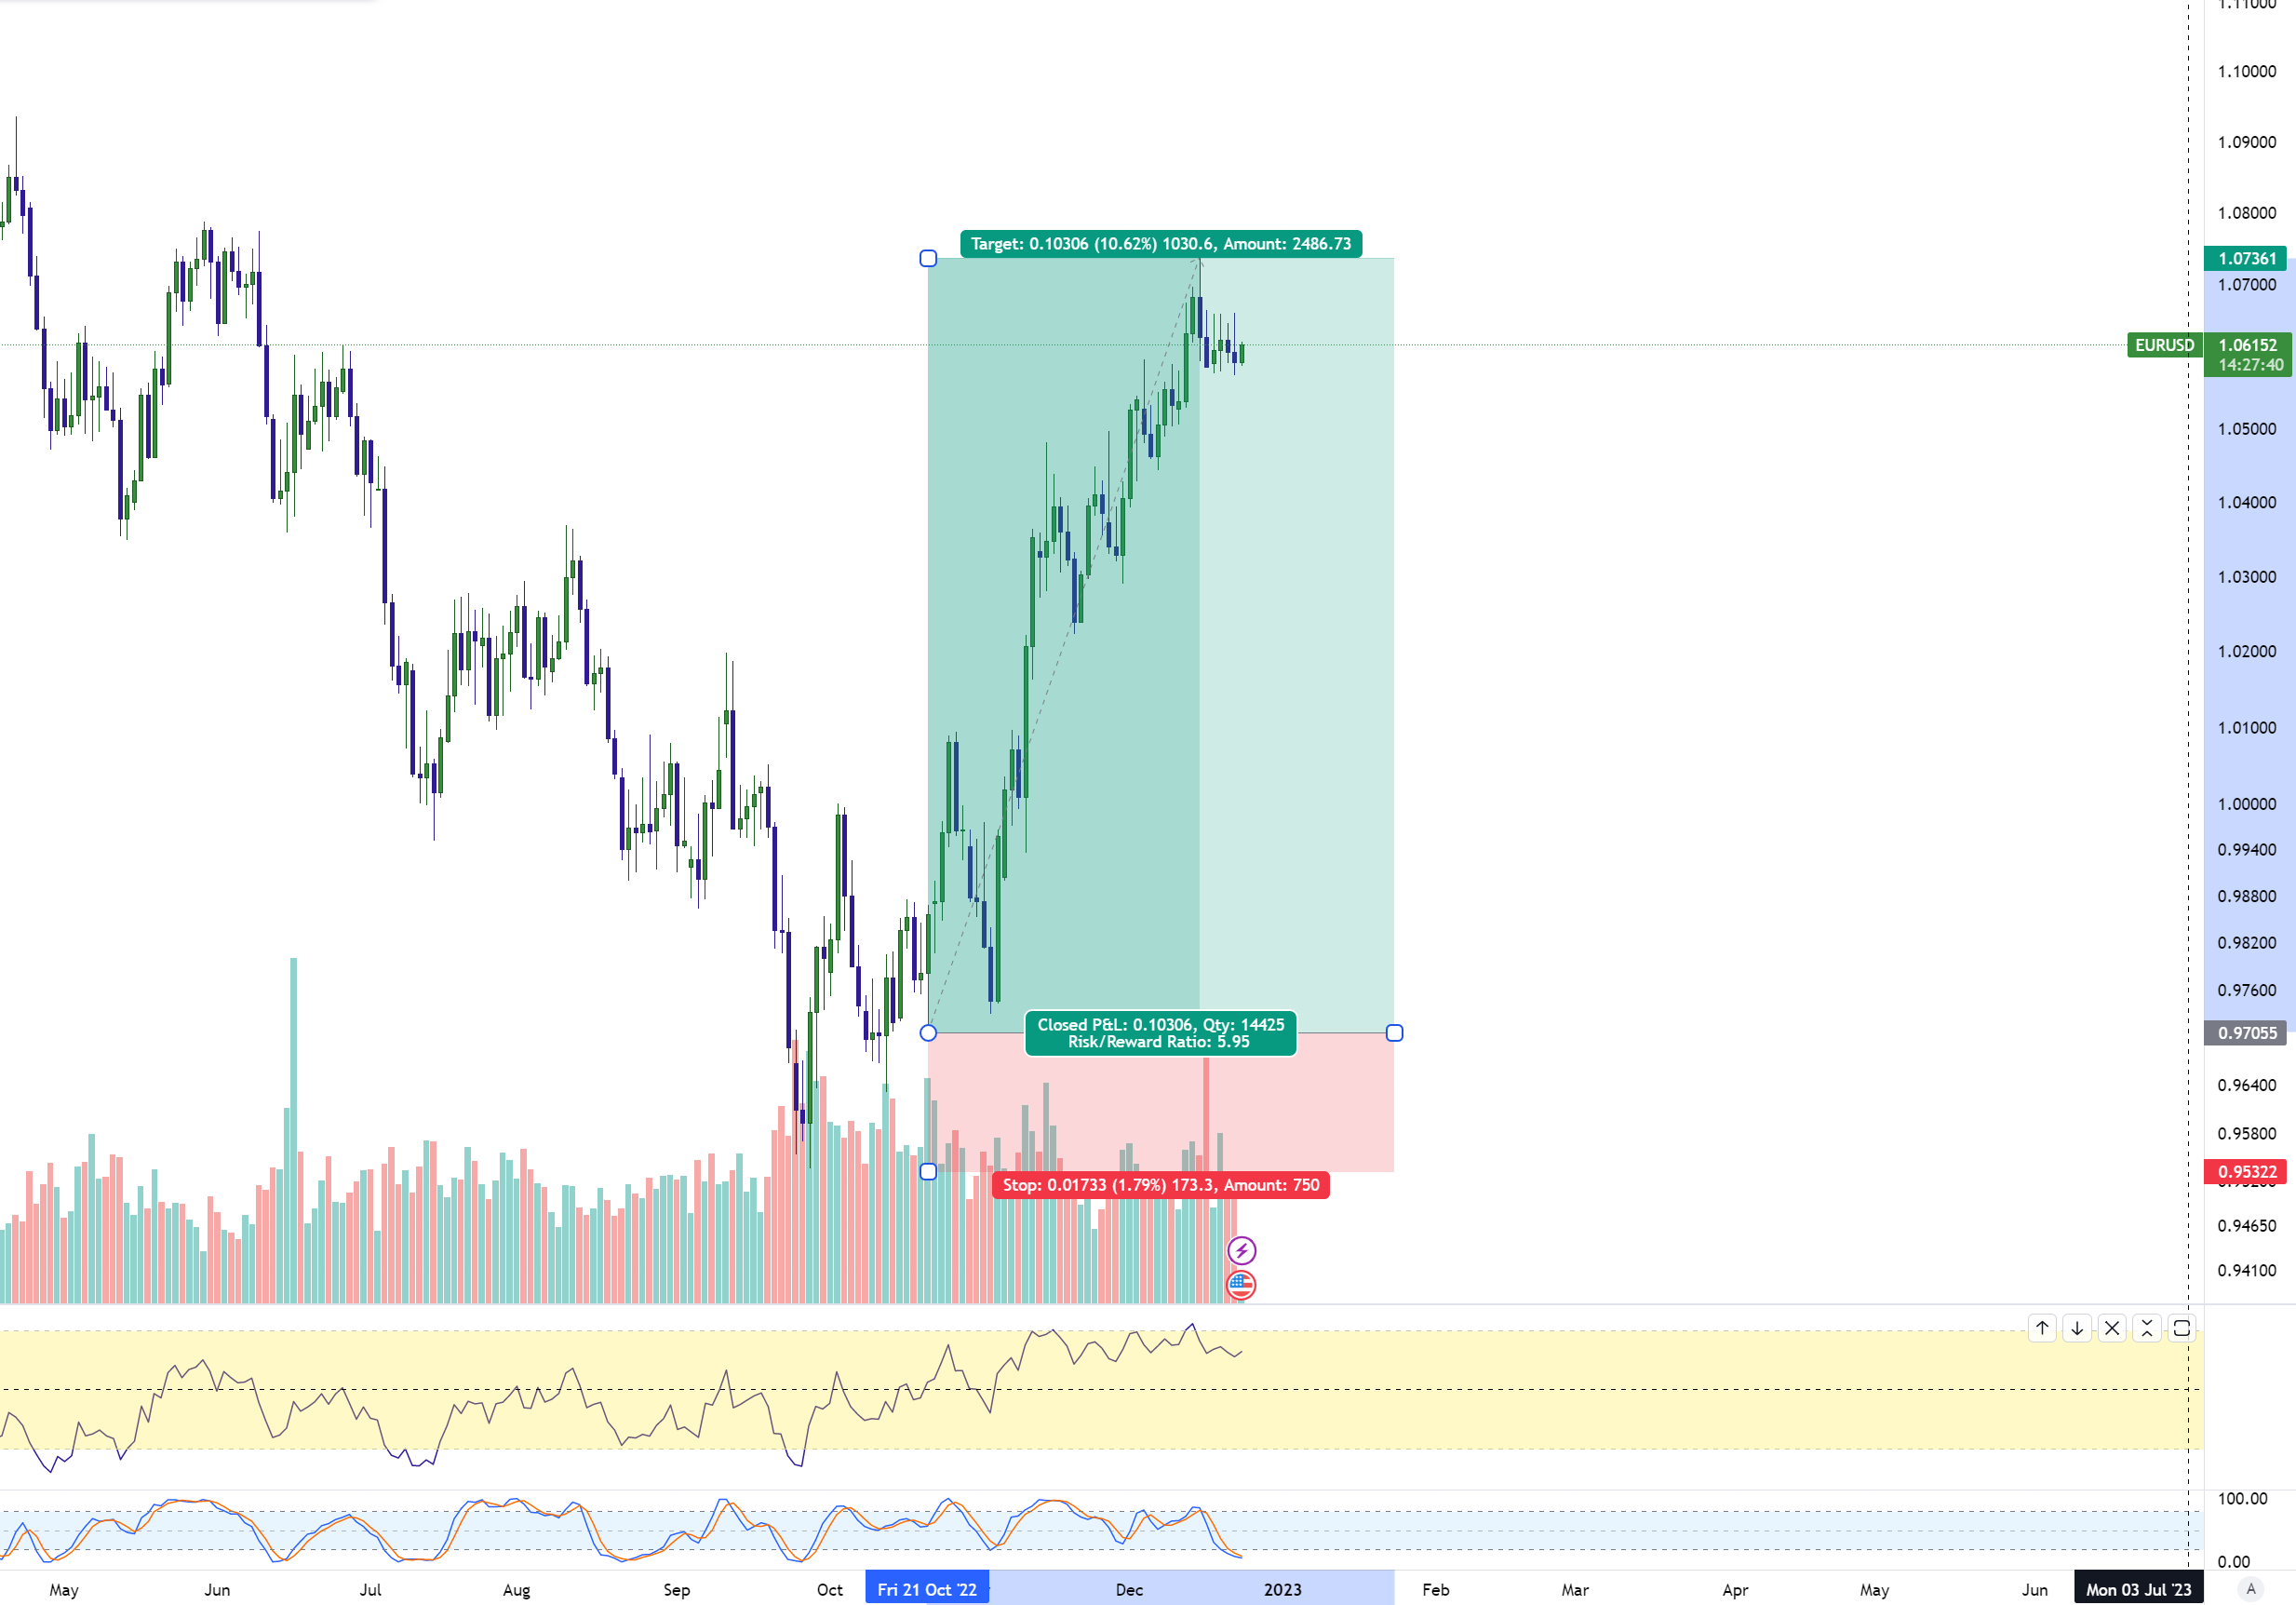
Now let’s have a look at how the main USDX pair EURUSD has moved since 10.21.22. We will see that the move was 10.62% which is comparable to the one of USDX itself.
EURUSD 10.21.22 Dynamic 2.2
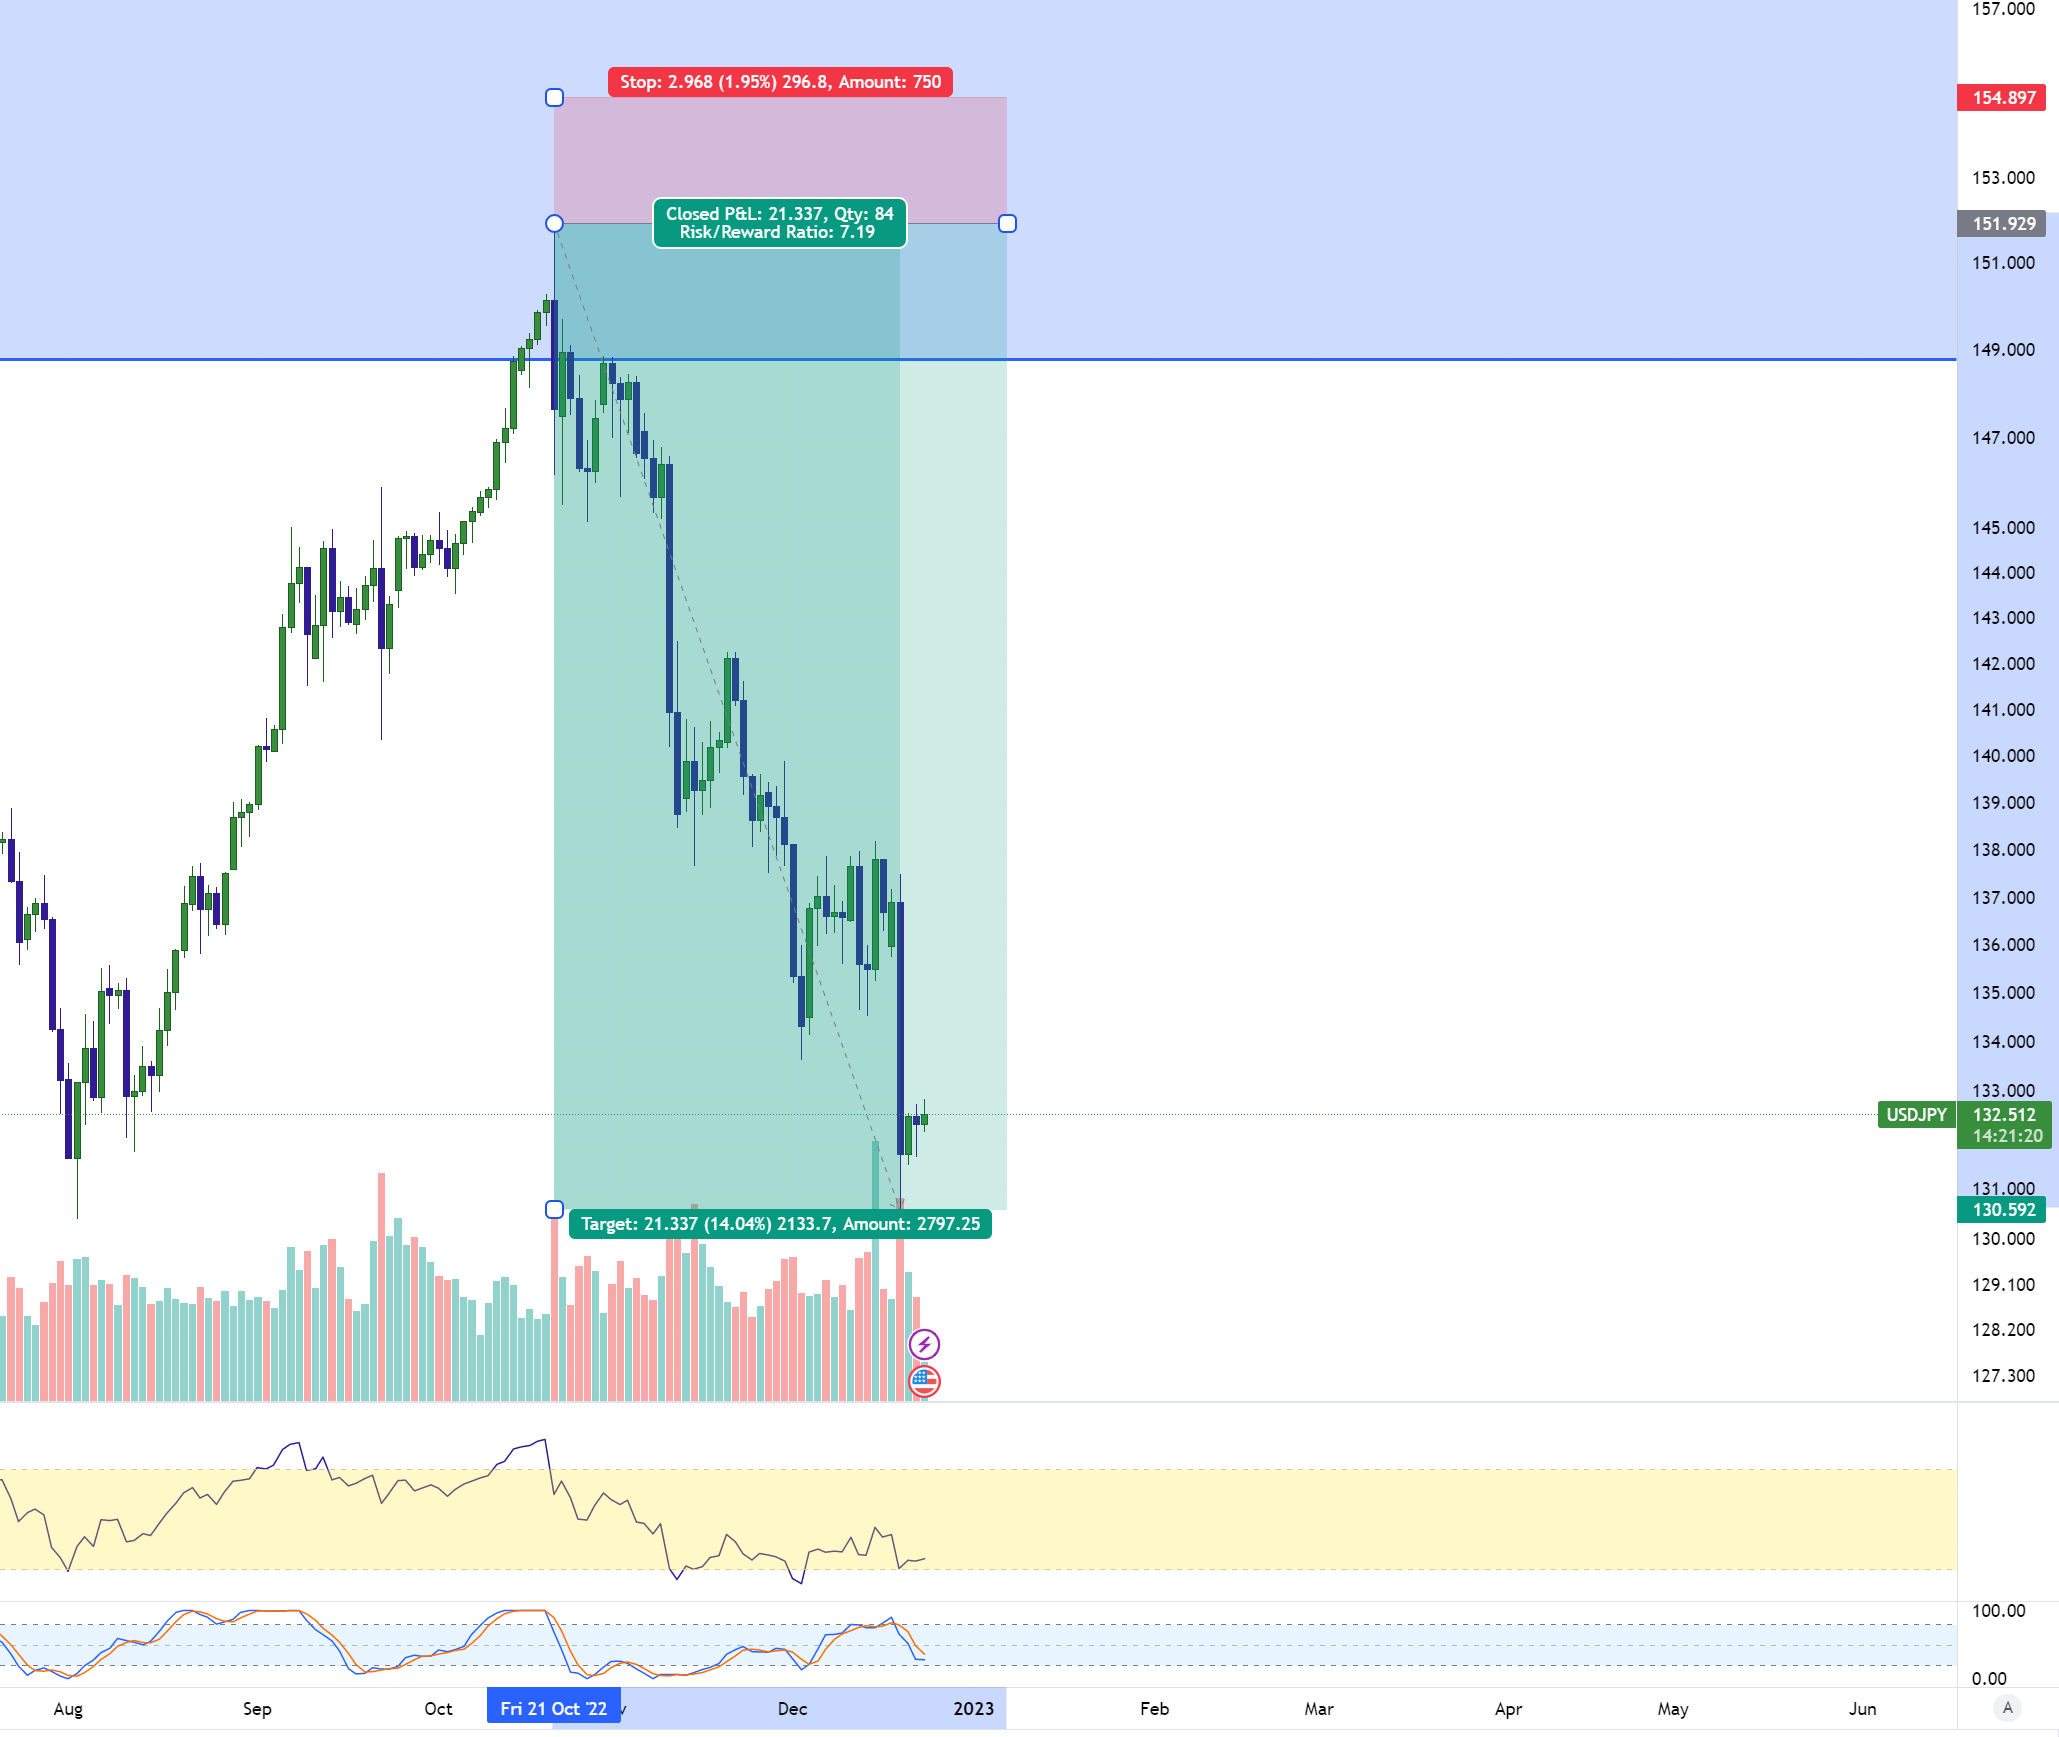
Now let’s see how the USDJPY move was greater than the dollar pairs and the dollar itself. We can see a 14.04% move in this case.
USDJPY 10.21.22 Dynamic 2.2
And lastly let’s see how a YEN pair behaved during this dynamic. Let’s see AUDJPY which has been sideways to lower since 10.21.22.
AUDJPY 10.21.22 Dynamic 2.2
Gold Price Technical Analysis 26th Dec 2022
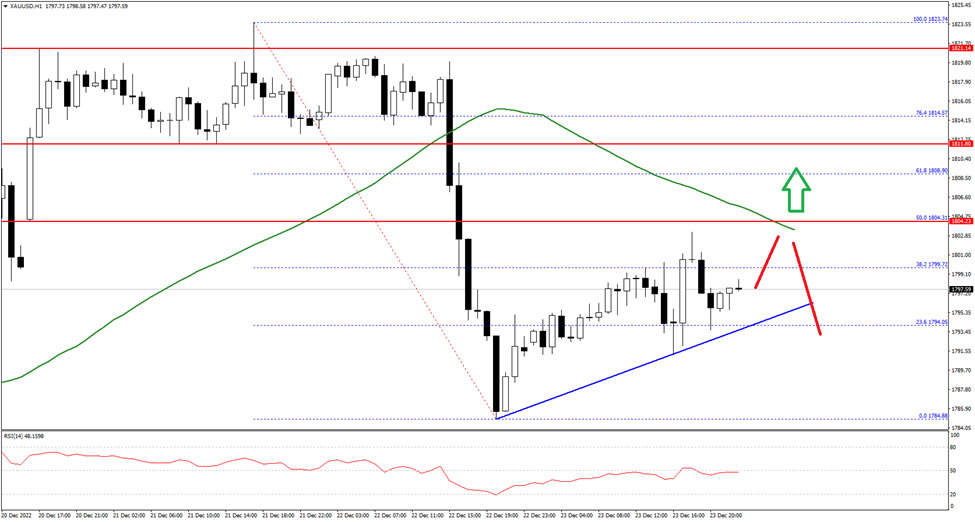
Gold price started a fresh decline from the $1,820 resistance zone against the US Dollar. The XAU/USD price declined below the $1,812 level on FXOpen to move into a short-term bearish zone.
The pair even declined below the $1,800 level and the 50 hourly simple moving average. The price traded as low as $1,784 and is currently correcting losses. It broke the $1,795 resistance zone.
On the upside, the first major resistance is near the $1,805 level. The next main resistance could be near the $1,812 level, above which the price could start a steady increase towards the $1,820 level.
On the downside, an immediate support is near the $1,795 level. The next major support is near the $1,784 level, below which the price might decline towards the $1,776 support level in the near term. Any more losses might call for a test of $1,765.