

Sample Category Title
USDCAD Moves Sideways in a Tight Range
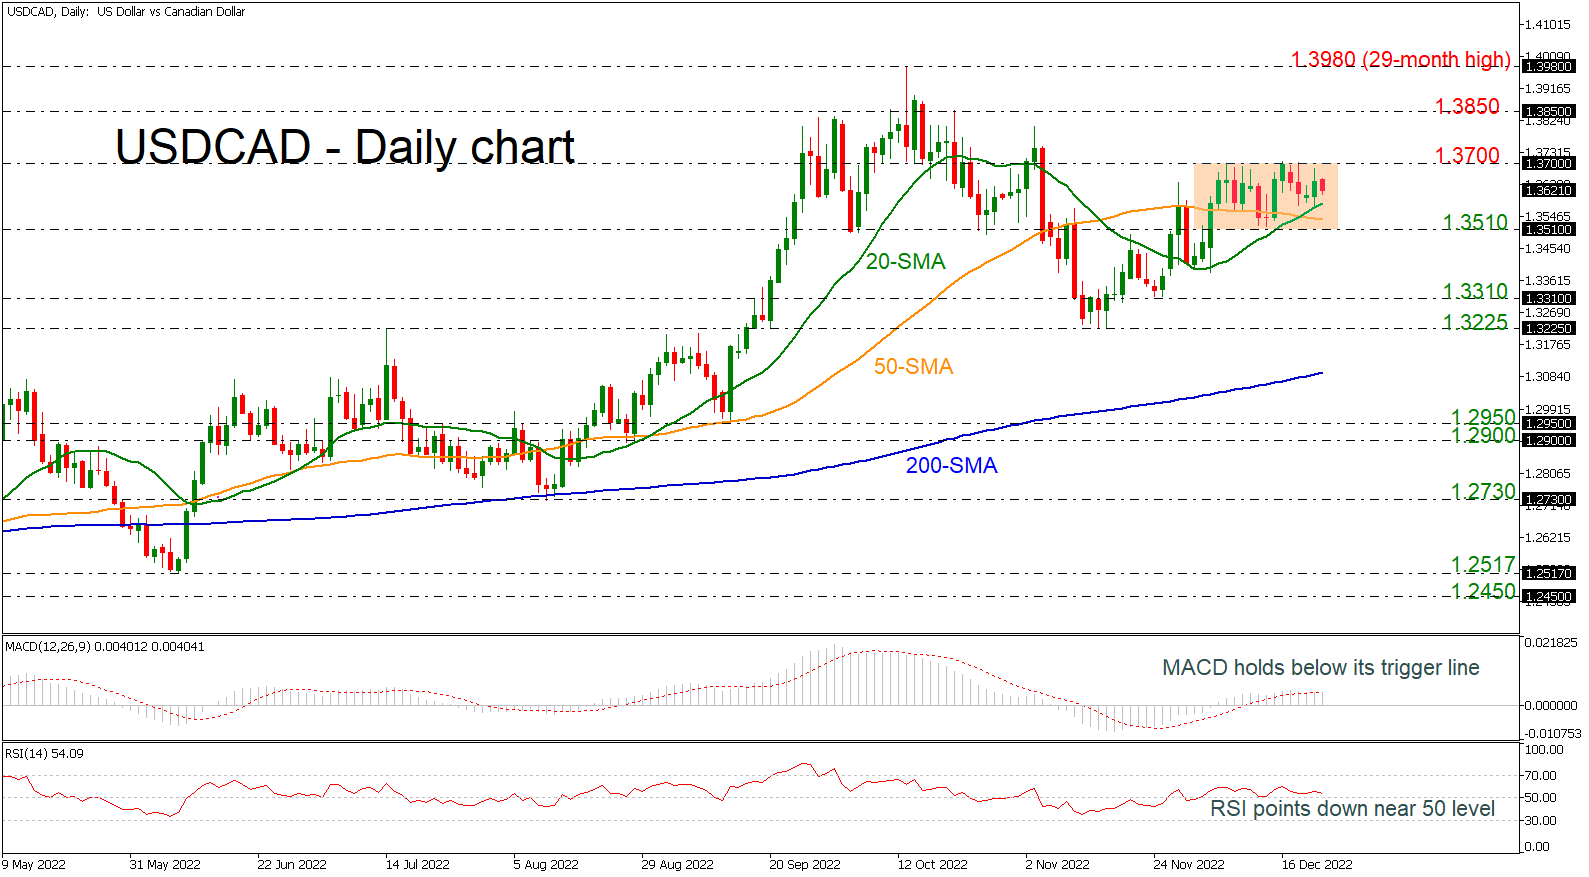
USDCAD has been moving sideways over the last three weeks within a tight range with the upper boundary at the 1.3700 psychological mark and the 1.3510 support level.
In trend indicators the 20-and 50-day simple moving average (SMAs) posted a bullish crossover, suggesting more upside moves. However, the MACD oscillator is moving sideways above the zero level, while the RSI is pointing slightly down in the positive region, indicating a weak bias.
If the market extends its gains above the 1.3700 mark, then the next barrier to have in mind is the 1.3850 resistance and the 29-month high of 1.3980, registered on October 13. Any moves above this line could endorse the long-term bullish outlook sending the market to the 1.4170 barrier, taken from the high in May 2020.
On the other hand, a drop below the short-term SMAs could open the way towards the 1.3510 support before extending the losses towards the 1.3225-1.3310 support area. Below that, the 200-day SMA at 1.3100 may halt the bearish movements.
Summarizing, USDCAD is neutral in the short-term timeframe, but in the broader outlook it is still bullish. A move beneath the 200-day SMA may change the outlook to bearish.
GBPJPY Trades Sideways After Massive Decline Pauses
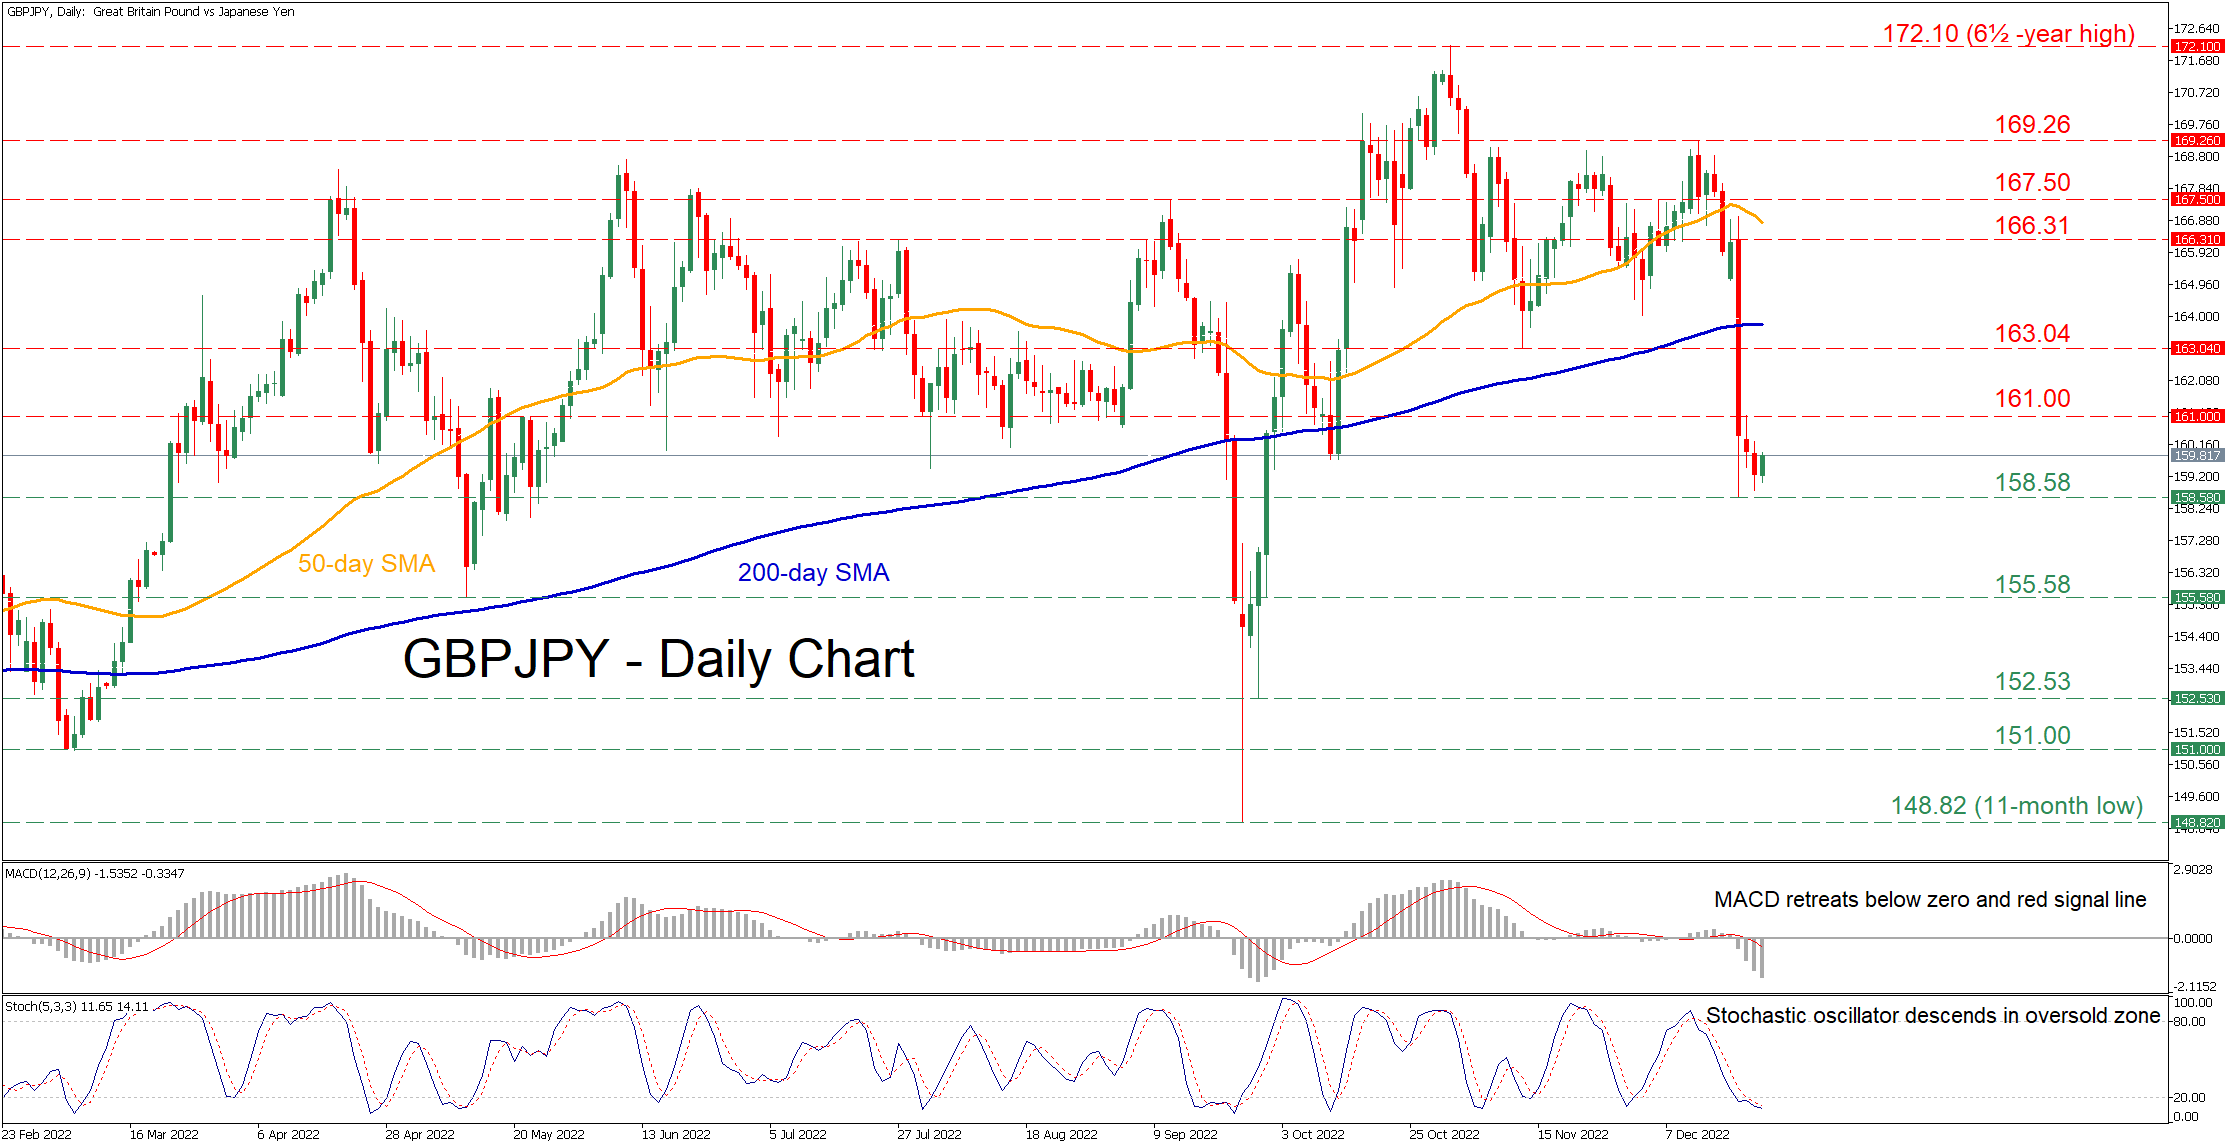
GBPJPY had been in an uptrend since late September, with the price posting a fresh 6½-year high of 172.10. However, after a period of consolidation, the pair experienced a huge downward spike on the back of the BoJ’s surprise decision and has been rangebound since then.
The momentum indicators suggest that bearish forces are intensifying. Specifically, the MACD histogram is extending its decline below both zero and its red signal line, while the stochastic oscillator is sloping downwards within the 20-oversold zone.
Should bearish pressures persist, the recent low of 158.58 could act as the first line of defence. Sliding beneath that floor, the price could descend towards the May bottom of 155.58 or lower to test the September support of 152.53. A violation of the latter could open the door for the March low of 151.00.
On the flipside, if buyers re-emerge and push the price higher, the pair may initially test the 161.00 hurdle. Piercing through that zone, the spotlight could turn to the inside swing low of 163.04, which might now act as resistance. Higher, further advances could then cease at the July resistance region of 166.31.
In brief, GBPJPY is trading without a clear direction after its significant downside move came to a halt. Hence, a break below its recent 2½-month low of 158.58 could reignite the bears’ hopes for a sustained decline.
S&P 500 Tests Key Demand Zone
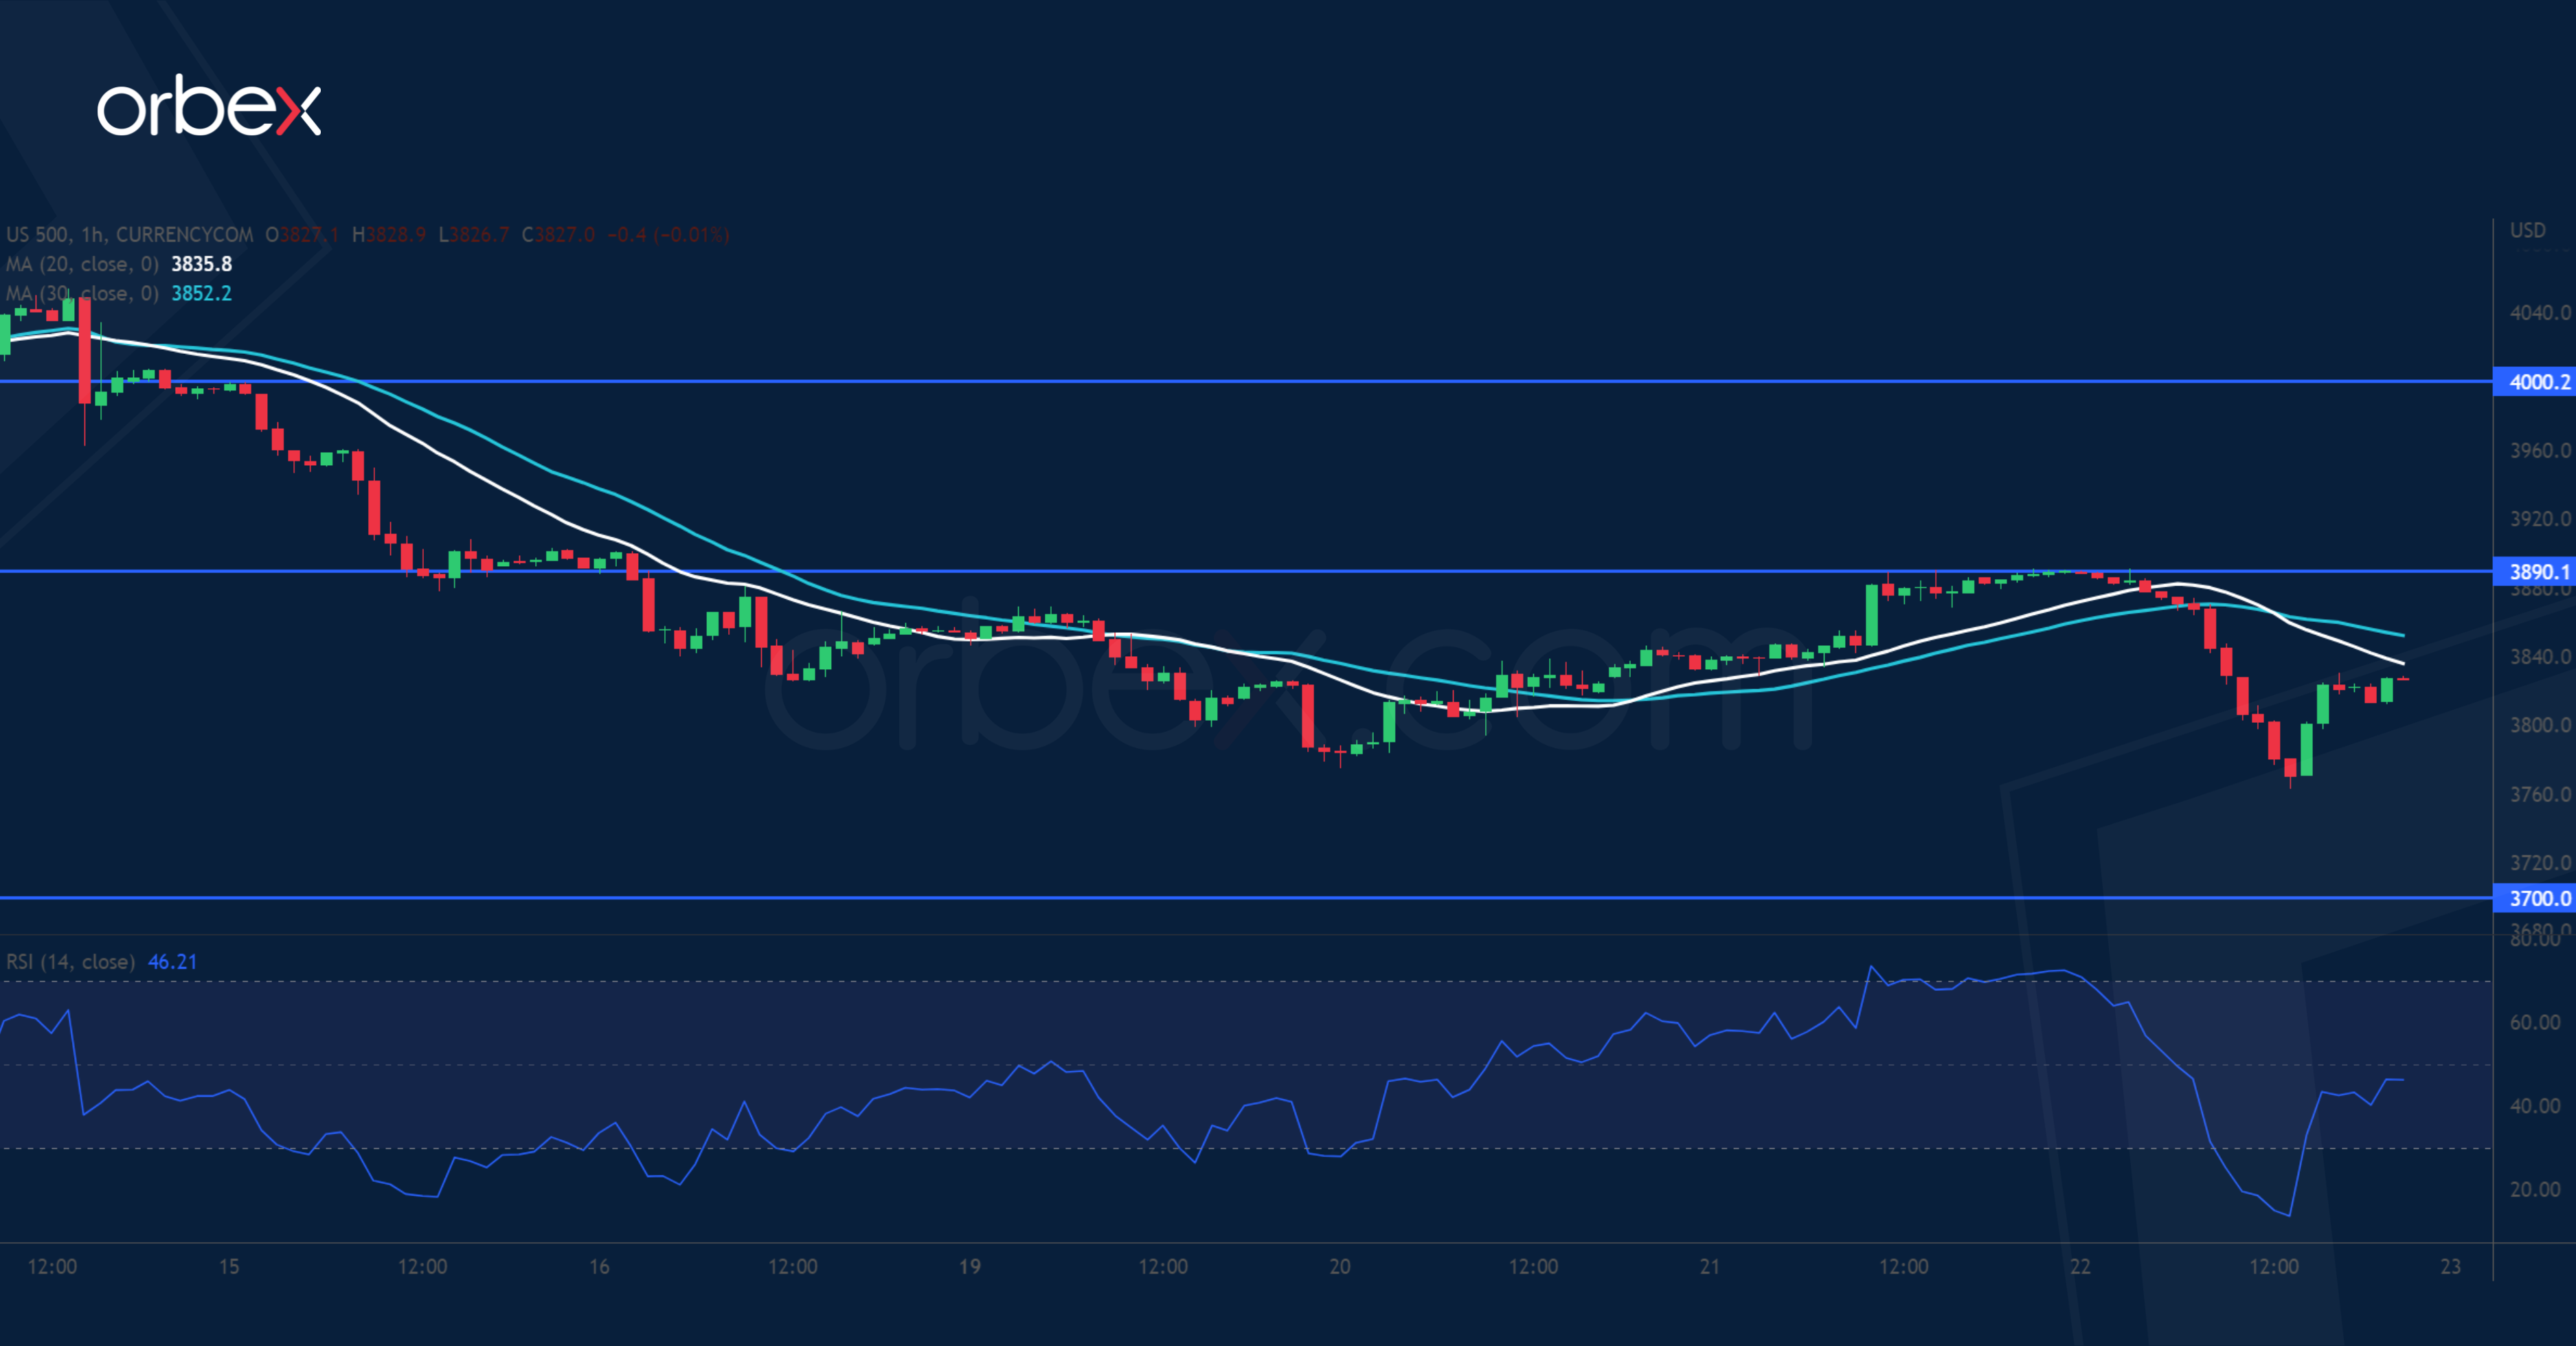
The S&P 500 fell as strong US economic activity fanned fears of restrictive rates for a longer period of time. On the daily chart, the index is drifting towards the daily support of 3700 after coming off November’s high of 4130. This means that the price action is at a crossroads and could stay in this range before a breakout dictates the next direction. In the short-term, a brief bounce came to a halt at 3890, leading to a test of the critical demand zone above 3700. Limited buying may emerge as the RSI returns to the neutral area.
GBP/USD Seeks Support
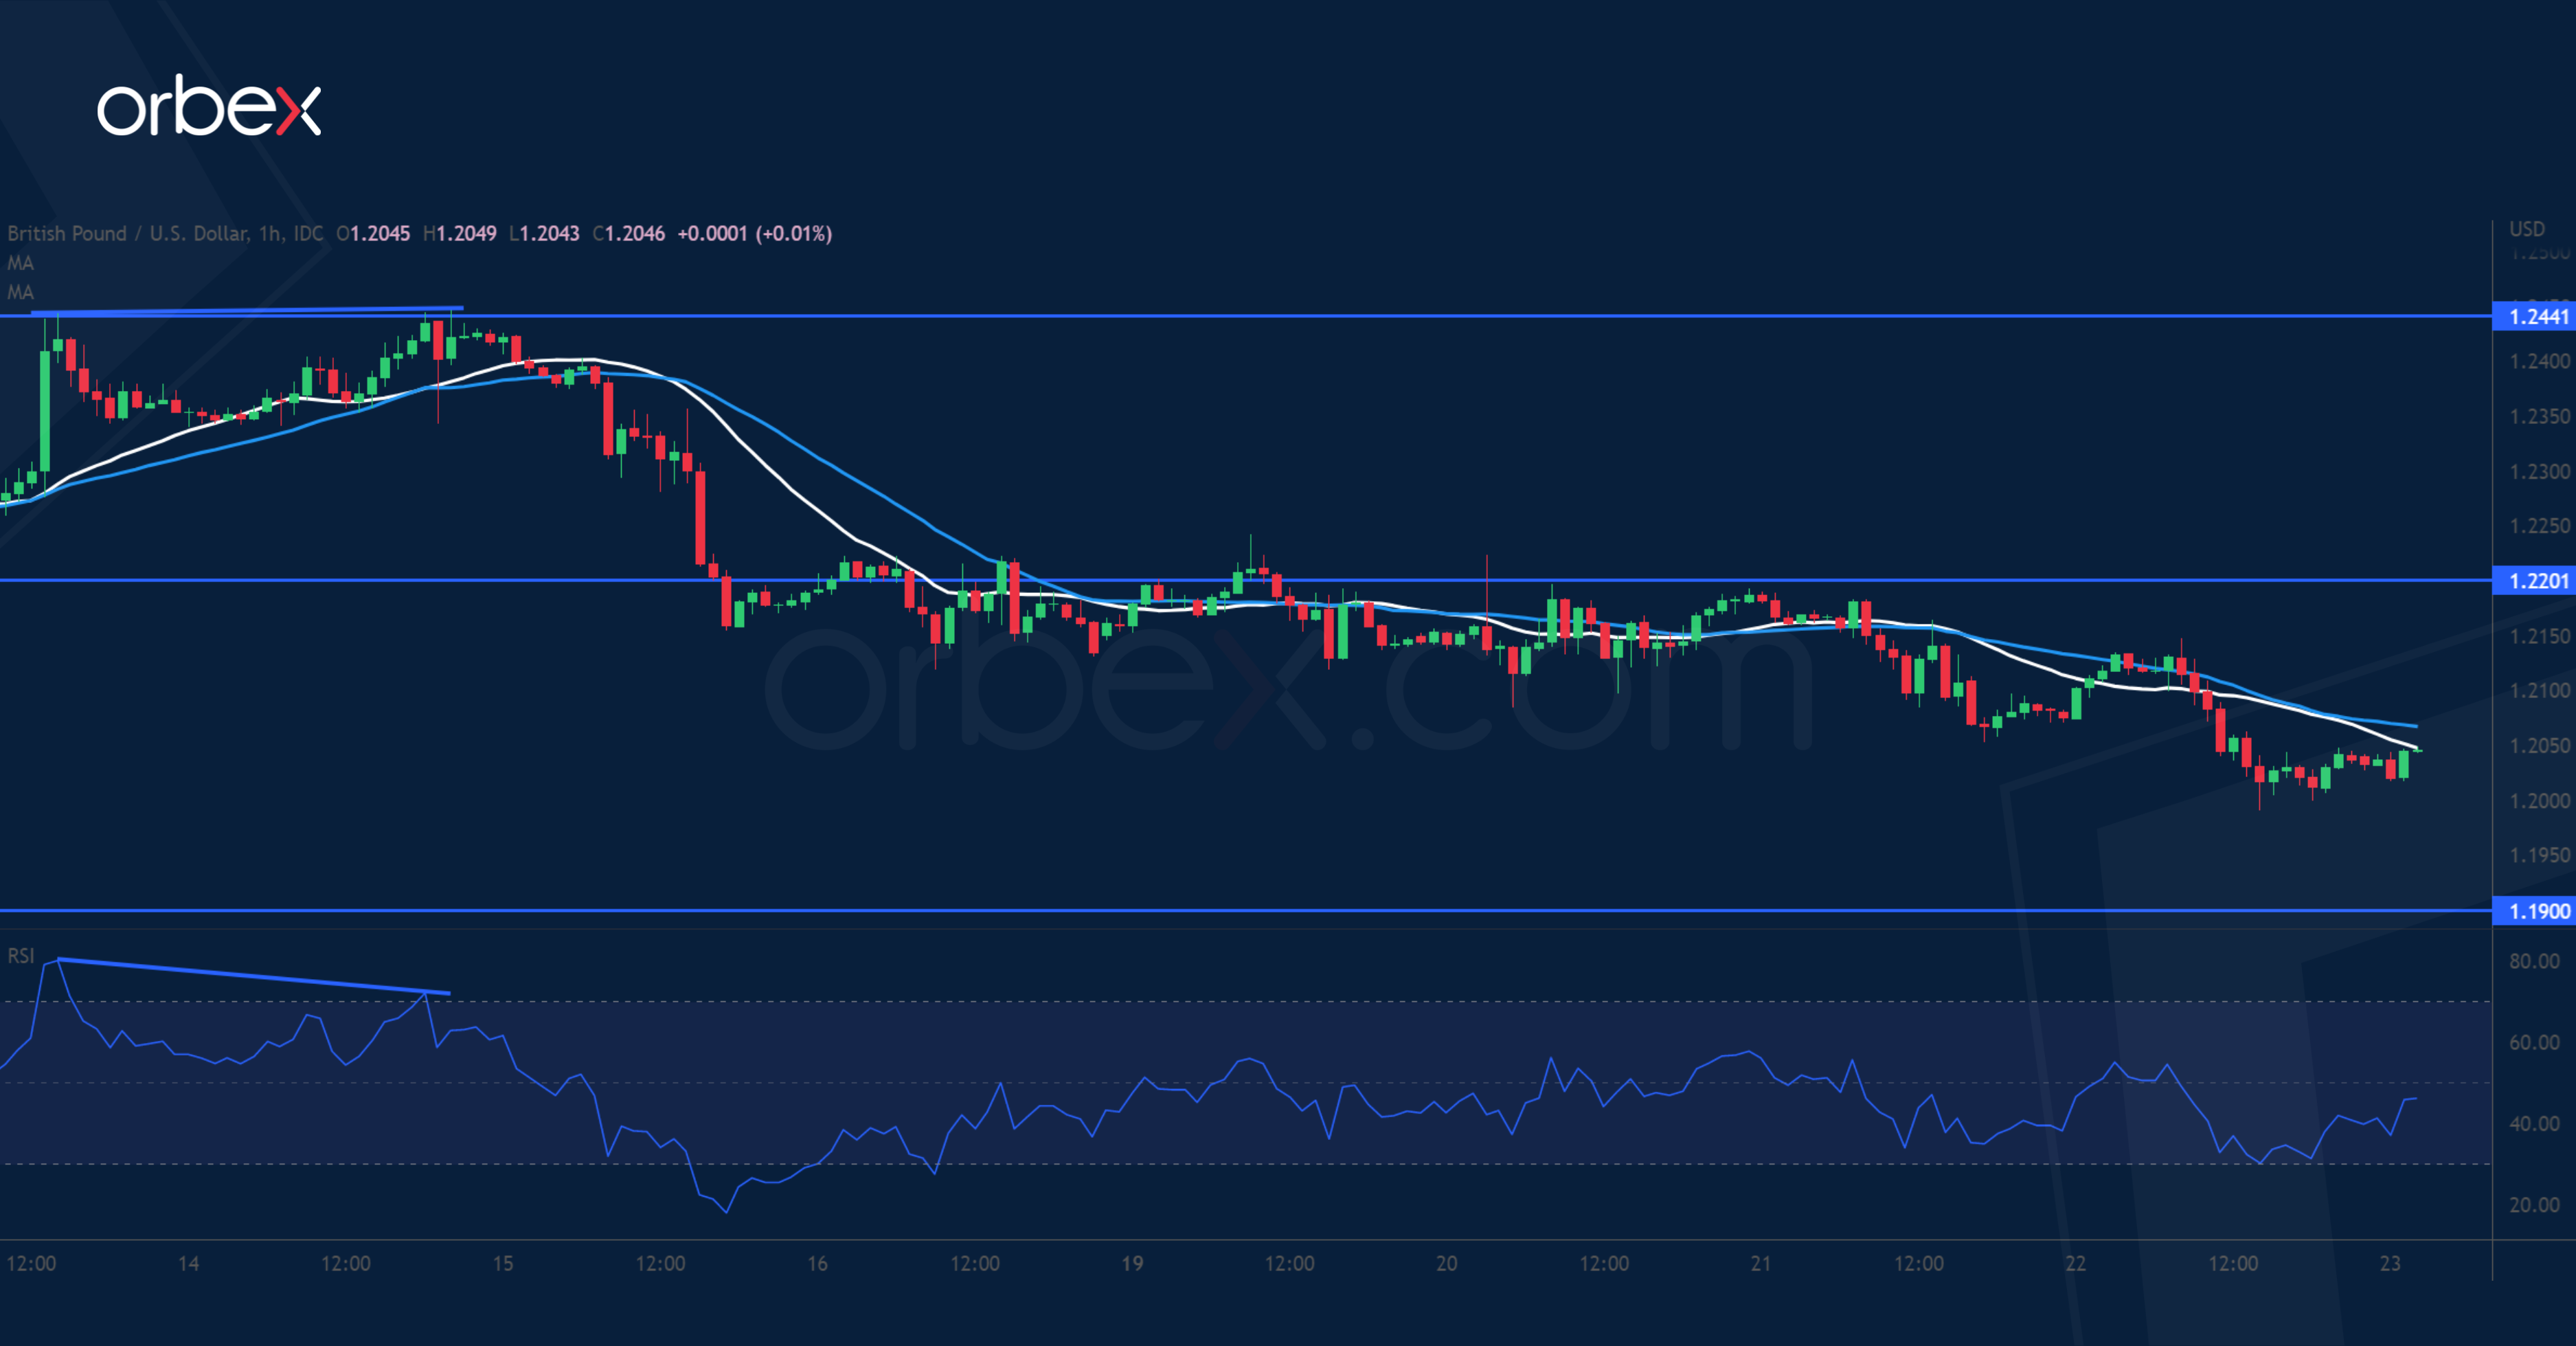
The pound continued lower as Britain’s Q3 GDP failed to impress. A bearish MA cross was a sign that the buying pressure was wearing off. The confirmation came in the shape of subsequent breaks below 1.2200 and 1.2100 which sits on the 20-day moving average. The daily support at 1.1900 is the closest level to see whether buyers would return to the market. Its breach could trigger a new round of sell-off towards 1.1700. The bulls will need to reclaim the former support at 1.2200 before they could regain control.
GBP/JPY Daily Outlook
Daily Pivots: (S1) 158.68; (P) 159.47; (R1) 160.12; More...
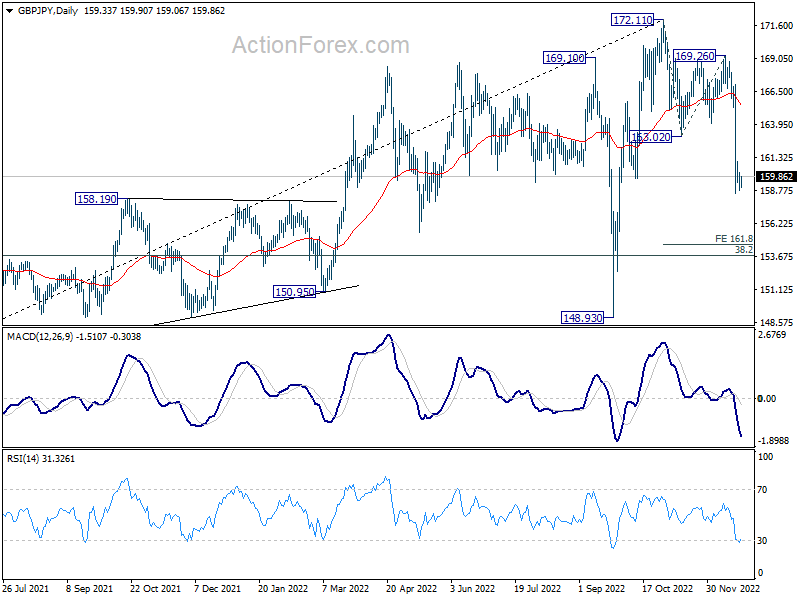
Intraday bias in GBP/JPY remains neutral for consolidation above 158.57 temporary low. Further decline is expected as long as 162.24. Break of 158.57 will target 161.8% projection of 172.11 to 163.02 from 169.26 at 154.55 next. However, break of 162.24 will turn bias to the upside for stronger rebound.
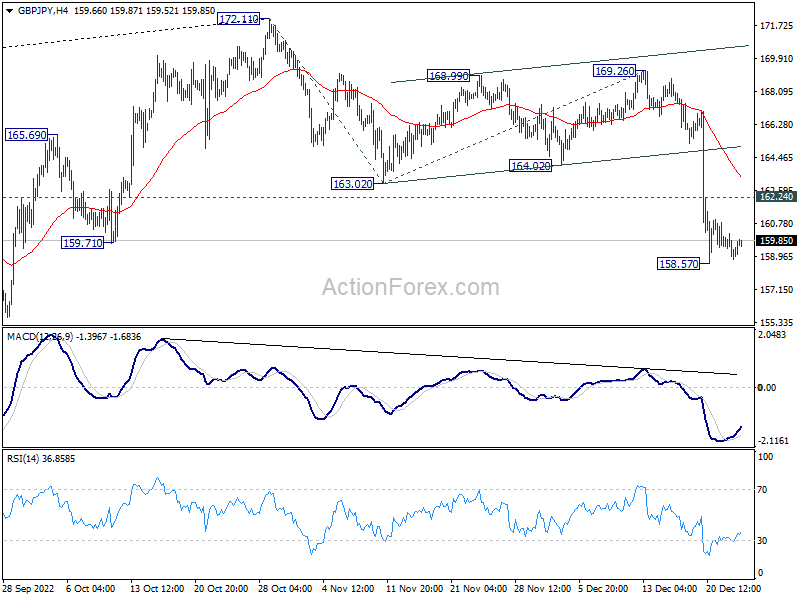
In the bigger picture, sustained break of 55 week EMA (now at 161.26) will confirm medium term topping at 172.11, on bearish divergence condition in weekly MACD. Fall from 172.11 should be correcting whole up trend from 123.94 (2020 low). Deeper decline should be seen to 38.2% retracement of 123.94 to 172.11 at 153.70 and possibly below. This will now remain the favored case as long as 55 day EMA (now at 166.11) holds.
EUR/JPY Daily Outlook
Daily Pivots: (S1) 139.93; (P) 140.29; (R1) 140.62; More....
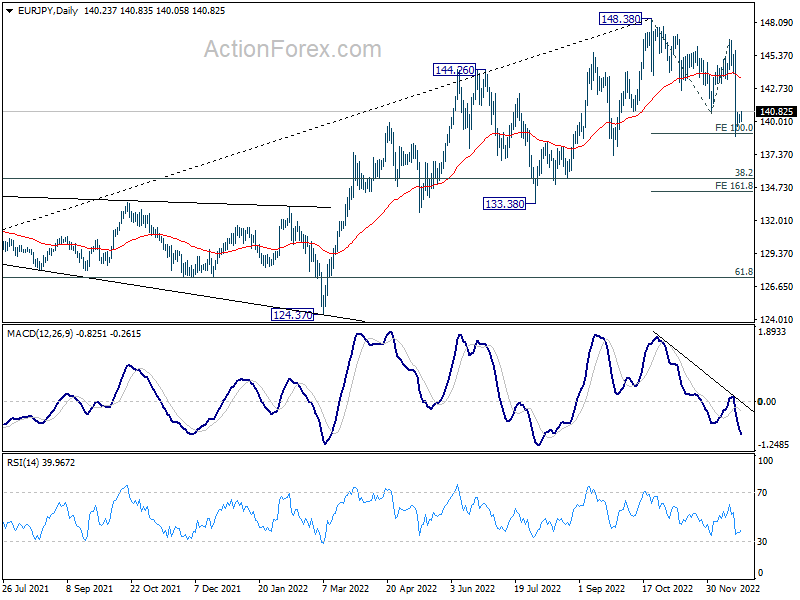
Intraday bias in EUR/JPY neutral as consolidation from 138.79 is extending. Further decline will remain in favor as long as 141.60 minor resistance holds. Firm break of 100% projection of 148.38 to 140.75 from 146.71 at 139.08 will pave the way to 161.8% projection at 134.36. However, break of 141.60 will bring stronger rebound instead.
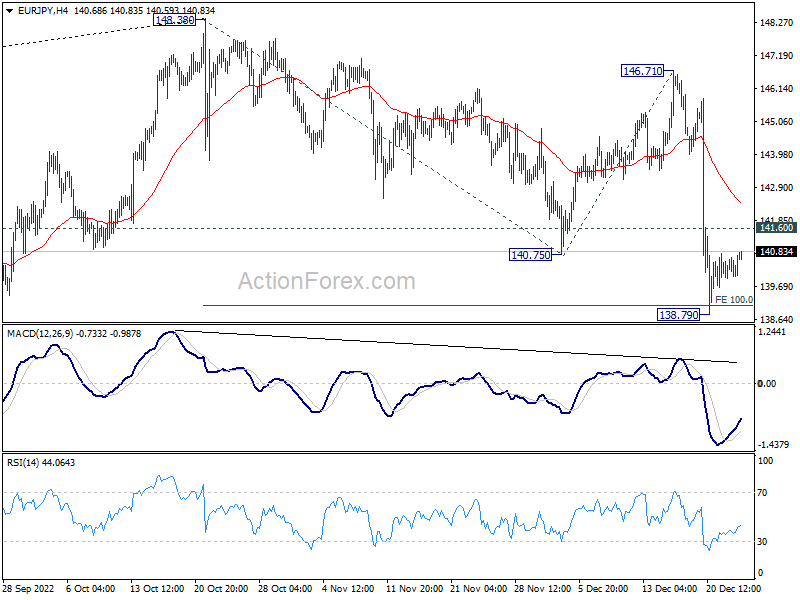
In the bigger picture, as long as 55 week EMA (now at 138.54) holds, larger up trend from 114.42 (2020 low) is still in progress for 149.76 long term resistance. However, firm break of 55 week EMA will bring deeper fall to 38.2% retracement of 114.42 to 148.38 at 135.40 before completing the correction from 148.38.
EUR/GBP Daily Outlook
Daily Pivots: (S1) 0.8768; (P) 0.8801; (R1) 0.8835; More...
Intraday bias in EUR/GBP remains on the upside with focus on 0.8827 resistance. Firm break there will argue that whole decline from 0.9267 has completed and turn near term outlook bullish. On the downside, break of 0.8689 minor support will bring retest of 0.8545 low, and retain near term bearishness.
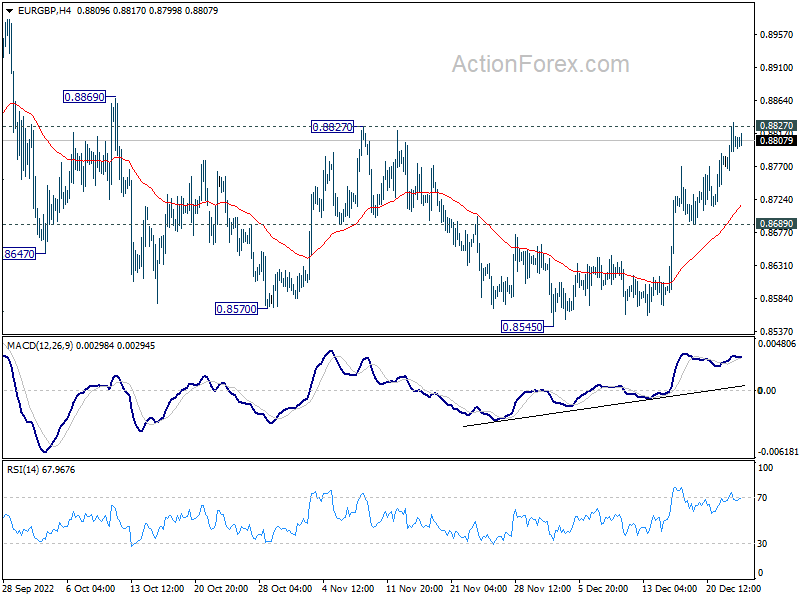
In the bigger picture, fall from 0.9267 is seen as a down leg inside long term range pattern. Deeper fall could be seen towards 0.8201/8338 support zone. But strong support should be seen there to bring reversal. Nevertheless, firm break of 0.8827 resistance will turn favor to the case that such decline is merely a correction in the up trend from 0.8201. That is, further rally would be seen at a later stage through 0.9267.
EUR/AUD Daily Outlook
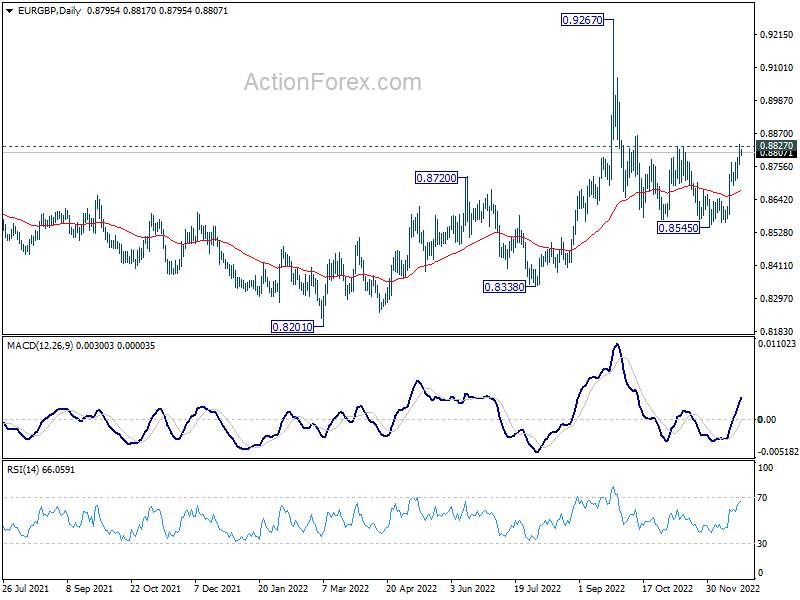
Daily Pivots: (S1) 1.5773; (P) 1.5842; (R1) 1.5960; More...
Intraday bias in EUR/AUD remains neutral for consolidations below 1.5976. Further rally will remain in favor as long as 1.5441 support holds. Break of 1.5976 will resume larger rise from 1.4281 to 61.8% projection of 1.4281 to 1.5704 from 1.5271 at 1.6150.
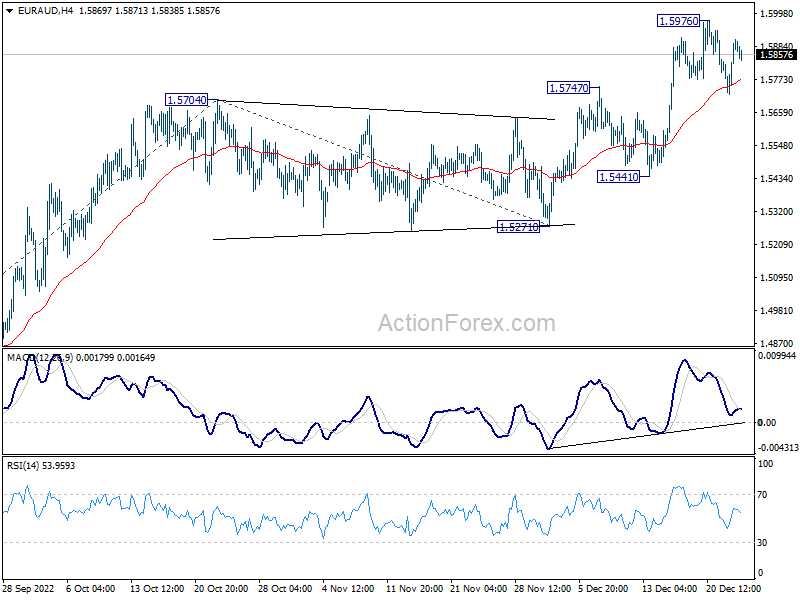
In the bigger picture, strong support from 55 day and 55 week EMA affirms underlying bullishness. As long as 1.5271 support holds, rise from 1.4281 medium term bottom is expected to continue to 1.6434 key resistance next. Decisive break there should confirm medium term bullish trend reversal.
EUR/CHF Daily Outlook
Daily Pivots: (S1) 0.9832; (P) 0.9851; (R1) 0.9885; More....
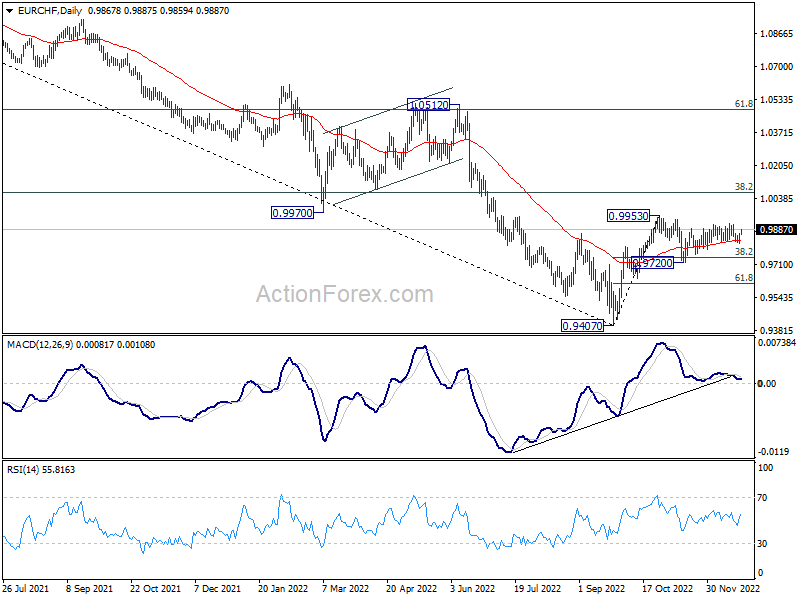
EUR/CHF's consolidation pattern from 0.9953 is still extending and intraday bias remains neutral for the moment. On the upside, firm break of 0.9953 resistance will resume larger rally from 0.9407 to 1.0072 fibonacci level. However, break of 0.9720 will extend the decline from 0.9953 to 61.8% retracement of 0.8407 to 0.9953 at 0.9616.
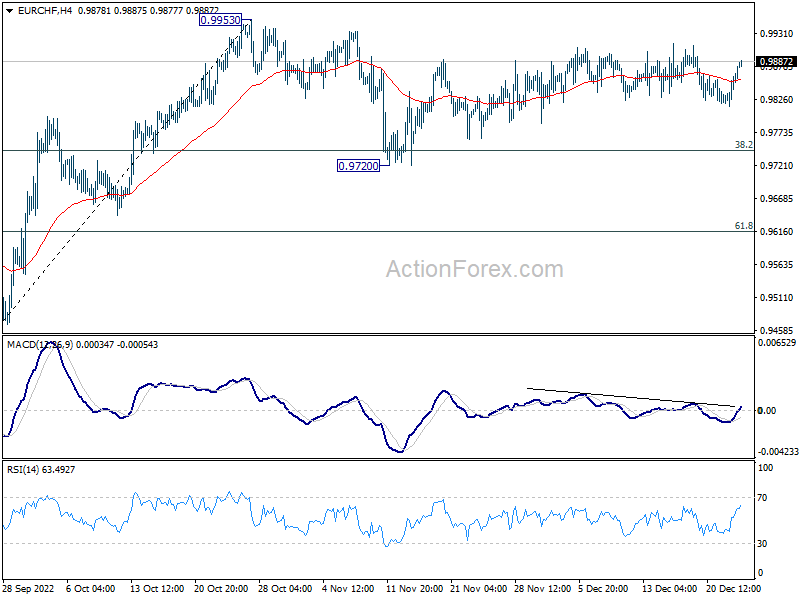
In the bigger picture, as long as 38.2% retracement of 1.1149 to 0.9407 at 1.0072 holds, price actions from 0.9407 medium term bottom will be treated as a corrective pattern. That is, long term down trend would resume through this low at a later stage. Nevertheless, firm break of 1.0072 will also have 55 week EMA (now at 1.0053) taken out. That would be an initial sign of long term bullish reversal.
US Durable Goods and Recession Outlook
Tomorrow has the last bit of potentially major market moving data as trading winds down for the holidays. Which means the figures could have implications for how the new year starts, as attention will come back to the economic outlook for the US in particular.
There is still a strong majority of economists who expect the US to fall into a recession next year. That appears to also be the assessment of many CEOs, as the theme from last quarter's earnings was of cutting guidance and cautionary outlook. But where there is substantial disagreement is just how much of a recession there will be. Many couch those expectations around how the Fed will react to the data as it comes out.
Charting the trend
If businesses expect there to be a recession, they will hold back on investments and try to build up cash to weather the uncertainty. Which means they spend less, contributing to a slowing economy. A market downturn can be something of a self-fulfilling prophecy. Comments from the Fed that interest rates will keep rising also contribute to the general gloom.
While expectations of slower growth can lead to slower growth, that usually doesn't tip over to be a full-blown recession. A so-called "hard landing" implies that the conditions expose an underlying issue that needs a market readjustment. Typically, recessions happen because of an excess of inventories. That can be because businesses got too overconfident and overproduced, or demand has been destroyed (for example, by a prolonged period of high inflation).
Some important indicators
Yesterday's consumer confidence figures helped boost optimism as they were trending in the right direction to avoid a hard landing. They were for the crucial period leading up to the holidays, in which there is an increase in spending. Consumer confidence hit an eight-month high. Additionally, inflation outlook fell to the lowest level seen in over a year. Both are seen as a sign that the US consumer is still healthy.
The other side of the equation is how much money Americans are actually making and spending. Tomorrow is the release of November Personal Income, which is expected to continue to grow but slow the pace to 0.3%, down from 0.7% prior. Not surprising, personal spending is expected to follow a similar pattern, slowing to 0.2% compared to 0.8% prior.
Slow growth is better than no growth
Also tomorrow is the release of durable goods orders, which shows how confident businesses are in medium-term growth as they invest money on goods that take a long time to give a return on investment. Here things are a little less optimistic, as durable goods orders are expected to turn to negative -0.6% compared to 1.0% growth in the prior month.
However, that is expected to be due to factors outside of the economy, as the core figure which excluded defense spending is expected to remain positive, though grow slower at 0.2% compared to 0.8% prior.