Sample Category Title
Japan CPI core rose to 3.7% yoy, highest in 40 yrs
Japan CPI core (all item ex fresh food) accelerate further from 3.6% yoy to 3.7% yoy in November, matched expectations. That's also the highest level in more than 40 years since 1981.
CPI core-core (all time ex fresh food and energy), also rose from 2.5% yoy to 2.8% yoy, above expectation of 2.7% yoy. Headline all item CPI ticked up from 3.7% yoy to 3.8% yoy, above expectation of 3.7% yoy.
USD/JPY Upsides Could Be Capped Despite Rise In US GDP
Key Highlights
- USD/JPY found support near the 130.55 zone and corrected higher.
- It could struggle near the 134.00 resistance zone on the 4-hours chart.
- The US GDP grew 3.2% in Q3 2022, better than the market forecast (2.9%).
- Gold price failed to clear the $1,825 resistance and corrected lower.
USD/JPY Technical Analysis
The US Dollar started another decline from the 138.00 resistance zone against the Japanese Yen. USD/JPY declined heavily after it broke the 136.80 support.
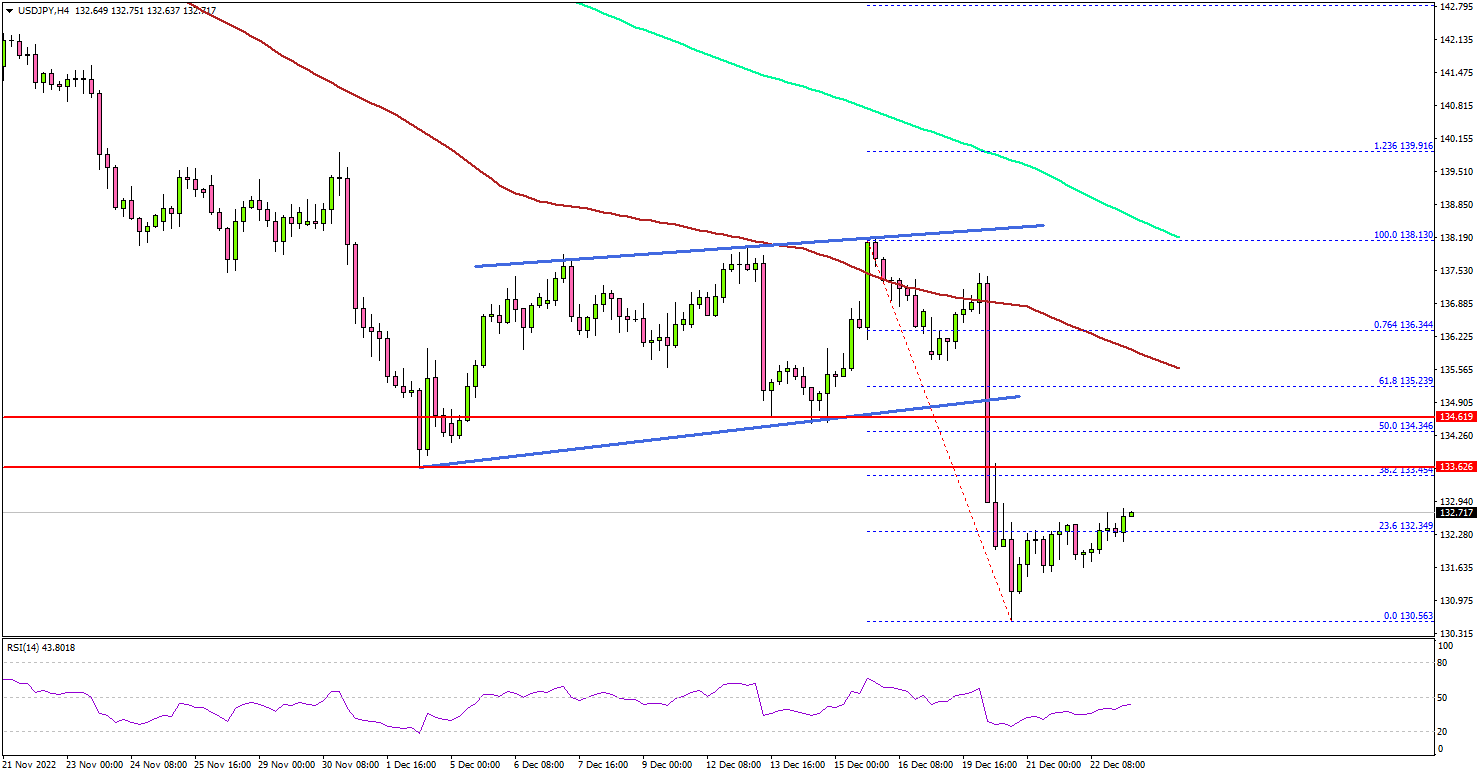
Looking at the 4-hours chart, the pair traded below a key rising channel with support near 135.00. There was a close below the 135.00 level, the 100 simple moving average (red, 4-hours), and the 200 simple moving average (green, 4-hours).
The pair traded as low as 130.56. Recently, the pair started an upside correction above the 131.20 level. There was a positive wave after the US GDP report was released, which exceeded the market forecast with a growth rate of 3.2% in Q3 2022.
On the upside, an initial resistance is near the 133.50 level. The next major resistance may perhaps be near 134.00. A clear move above the 134.00 resistance might start a steady increase.
In the stated case, USD/JPY may perhaps rise towards the 135.00 level. Any more gains could lead the pair towards the 135.50 resistance zone or the 100 simple moving average (red, 4-hours).
On the downside, there is a decent support forming near the 131.00 zone. The next major support is near the 130.50 zone, below which the pair might dive towards the 128.80 level. Any more losses might open the doors for a move towards the 126.50 support zone.
Looking at gold price, there was another rejection near the $1,825 resistance zone. It has opened the doors for a move towards the $1,780 level.
Economic Releases
- US Personal Income for Nov 2022 (MoM) - Forecast +0.2%, versus +0.7% previous.
- US Durable Goods Orders for Nov 2022 – Forecast -0.6% versus +1.1% previous.
- US Nondefense Capital Goods Orders Ex Aircraft for Nov 2022 – Forecast 0% versus +0.6% previous.
ETHUSD Forecasting The Decline & Selling The Rallies At Blue Box
In this technical blog we’re going to take a quick look at the Elliott Wave charts of ETHUSD . As our members know ETH is showing incomplete sequences in the cycle from the 08/15 peak. The cryptocurrency is bearish against the 1681.4 pivot. Recently ETH has made 3 waves bounce , when it has reached our blue box- selling zone. We recommended members to avoid buying and keep selling rallies in 3,7,11 swings due to bearish sequences. In the further text we are going to explain the Elliott Wave Forecast and the trading strategy.
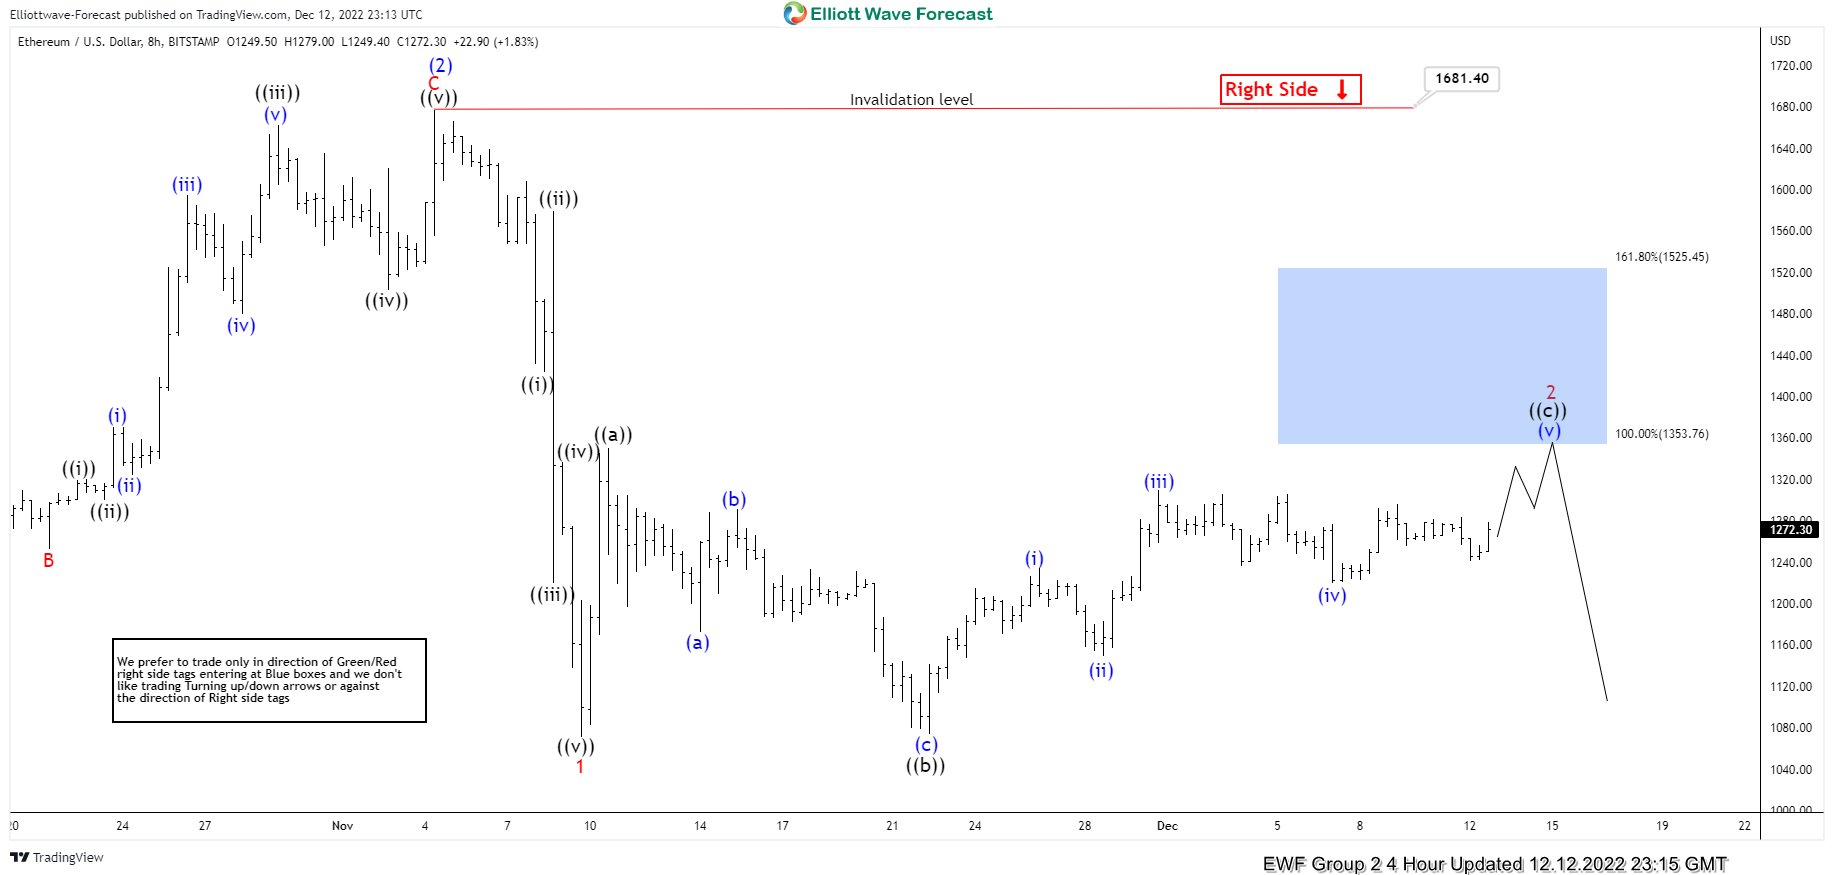
ETHUSD H4 Elliott Wave Analysis 12.12.2022
ETHUSD made 5 waves down from the 1681.4 high. Currently the price is giving us 2 red recovery that is correcting the cycle from the mentioned 1681.4 peak. At this moment we believe recovery is still in progress toward marked blue box area. We recommended members to avoid buying the Index in proposed push up.
ETHUSDLet’s see what the price structure looks like in h1 time frame.
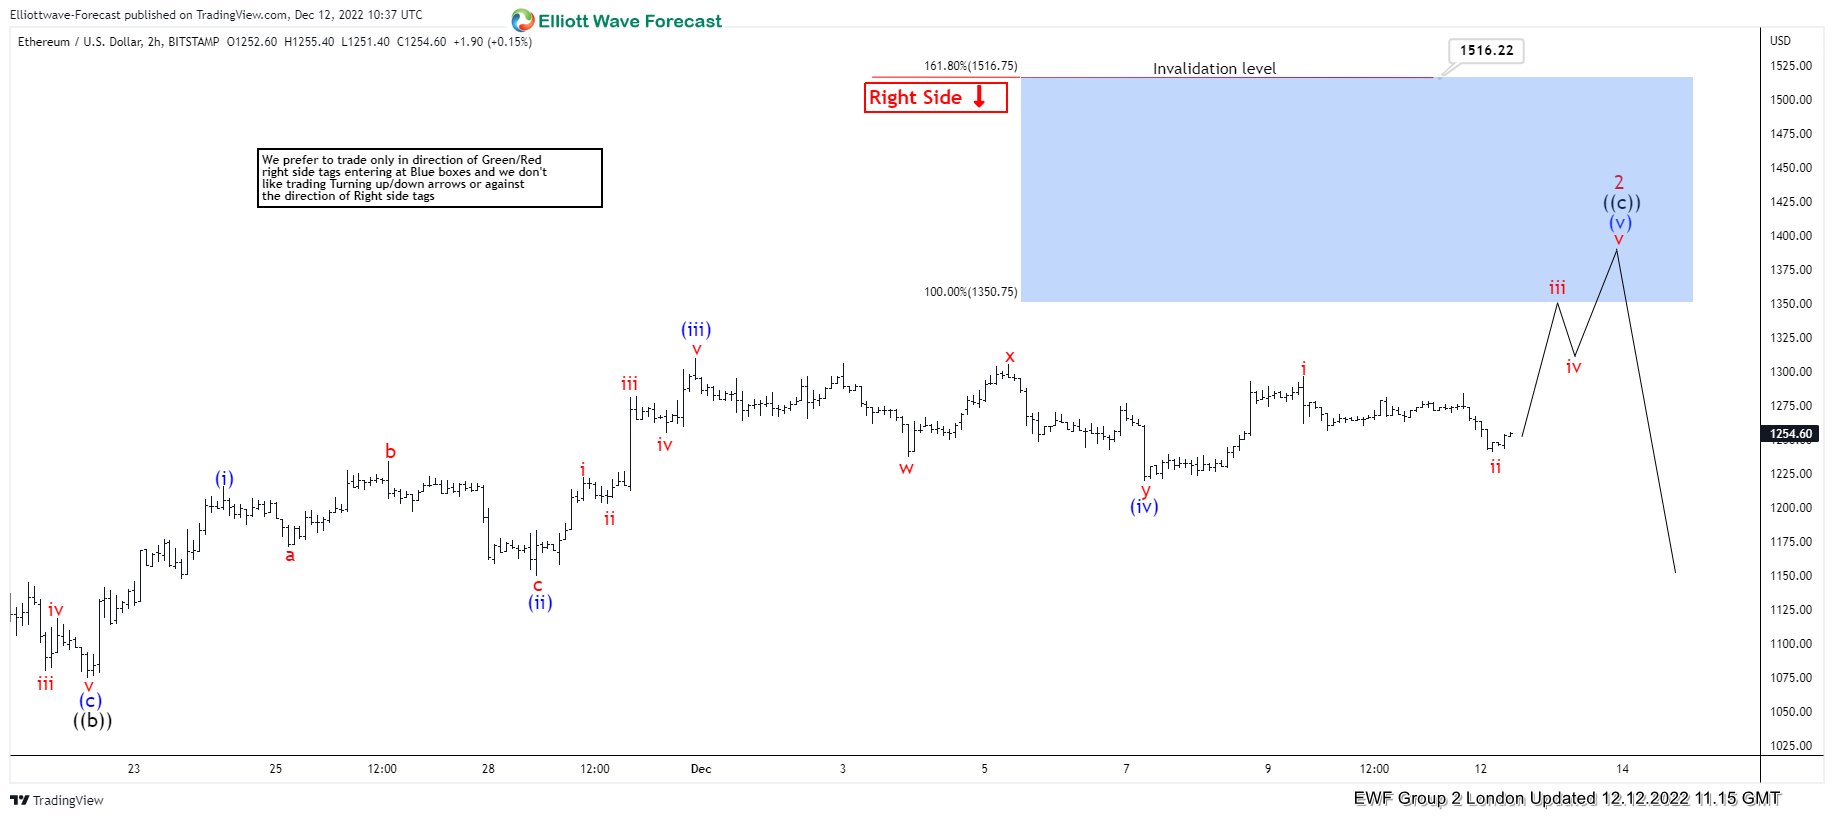
ETHUSD H1 Elliott Wave Analysis 12.12.2022
Correction looks incomplete at the moment. We expect to see more more upside toward 1350.7-1516.75 area. Strategy is waiting for Blue Box to be reached before selling it. Invalidation for the trade would be break above 1.618 fibs extension: 1516.22. As the main trend is bearish we expect sellers to appear at the blue box for 3 waves pull back at least. Once pull back reaches 50 Fibs against the ((b)) black low, we will make short position risk free ( put SL at BE) and take partial profits.
As our members know Blue Boxes are no enemy areas , giving us 85% chance to get a reaction.
ETHUSD H1 Elliott Wave Analysis 12.19.2022
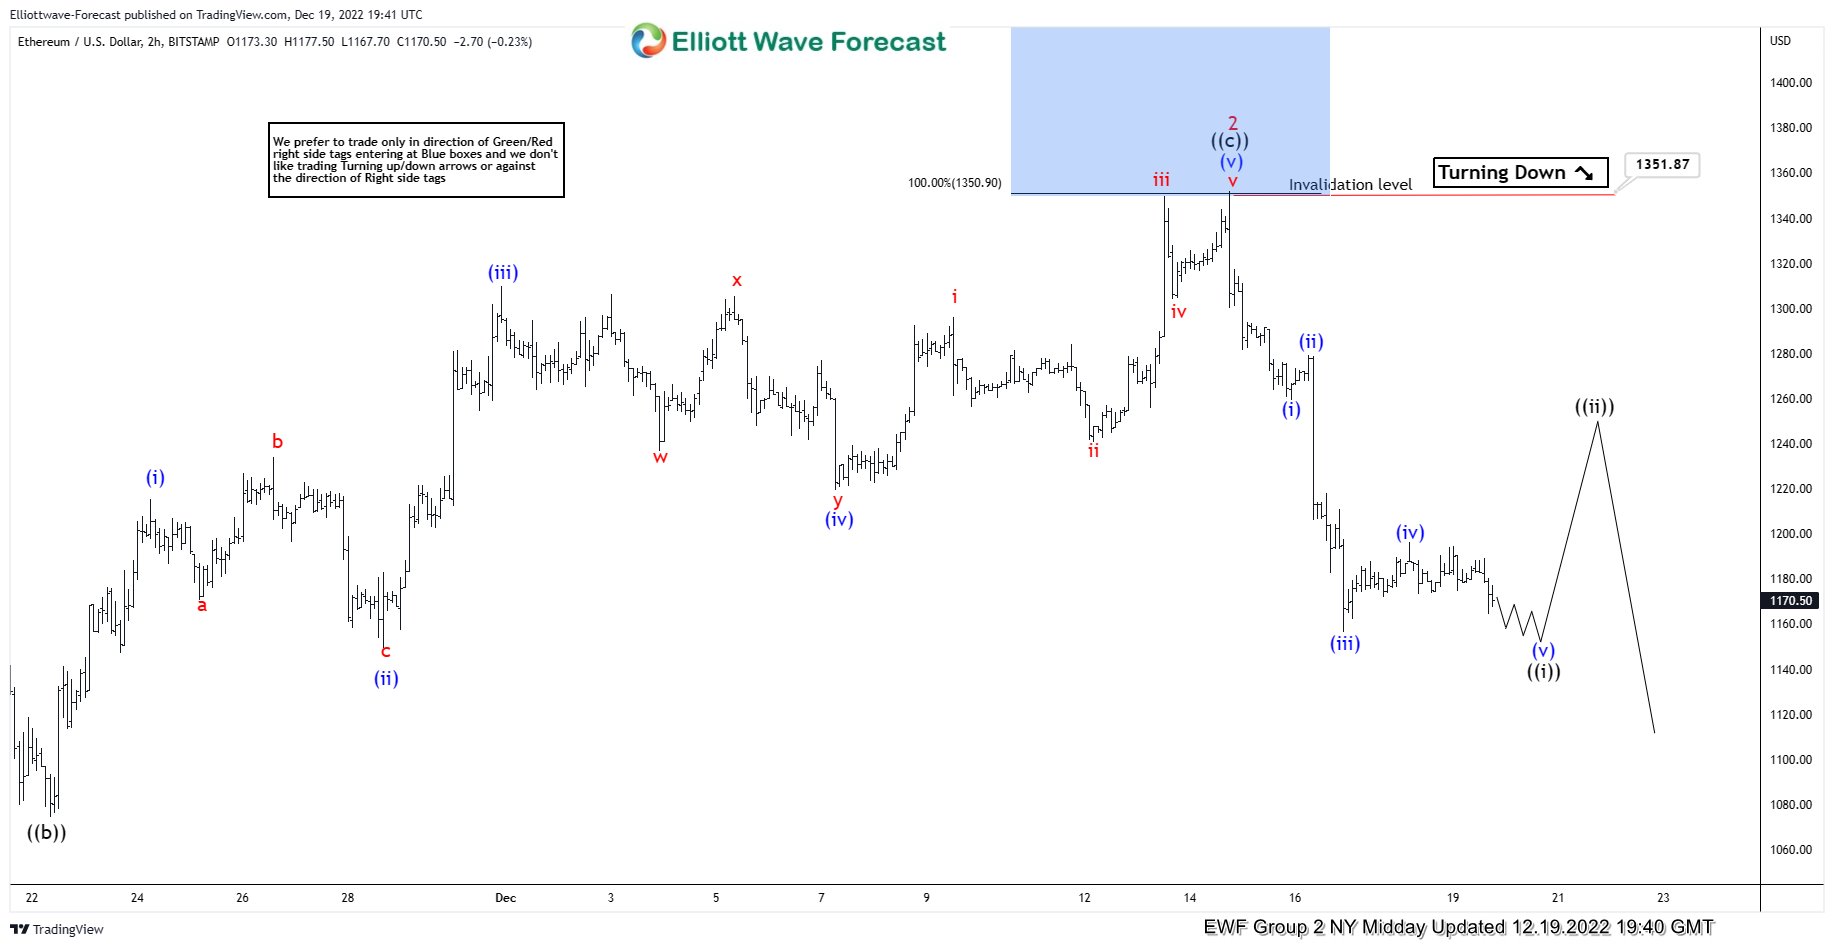
Eventually , ETHUSD made extension higher toward our selling zone : 1350.7-1516.75 area. The pair found sellers right at the blue box and made reaction from there that has reached 50 fibs against the ((b)) black low. As a result, members who took short trades mad positions risk free . ( Put SL at BE) and took partial profits. At this stage we see wave 2 red completed at 1351.87 high. Decline from the peak looks to be unfolding as 5 waves. We expect another marginal low before bounce in ((ii)) takes place. The price should ideally make break of previous low : 3 red 11/09 to confirm wave 3 red is in progress.
Keep in mind market is dynamic and presented view could have changed in the mean time. You can check most recent charts in the membership area of the site. Best instruments to trade are those having incomplete bullish or bearish swings sequences.We put them in Sequence Report and best among them are shown in the Live Trading Room.
GBPUSD Wave Analysis
- GBPUSD falling inside minor correction 2
- Likely to fall to support level 1.1900
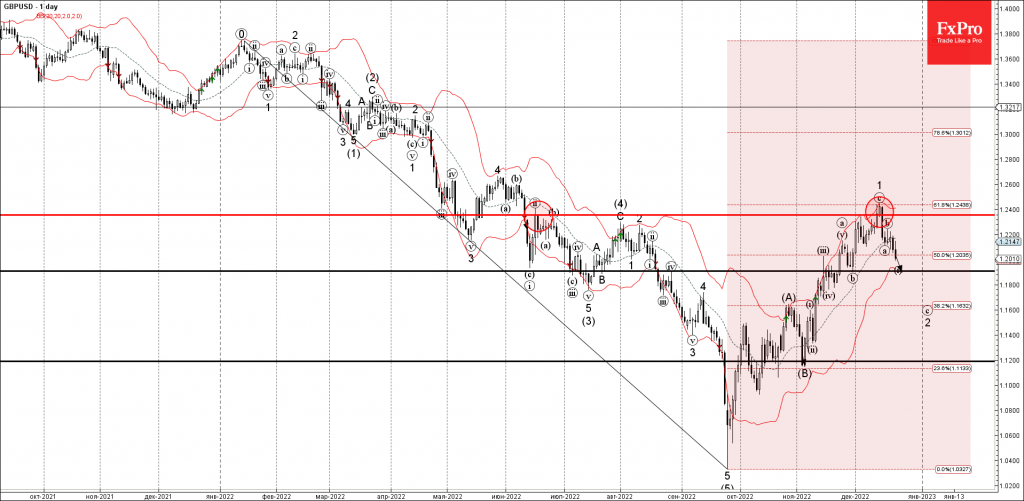
GBPUSD continues to fall inside the minor retracement 2, which started earlier from the key resistance level 1.2355 intersecting with the 61.8% Fibonacci correction of the weekly downward impulse from January.
The active wave 2 belongs to the intermediate impulse sequence (C) from the start of November.
Given the overriding weekly downtrend, GBPUSD can be expected to fall further toward the next support level 1.1900 (low of the earlier correction (b)).
Gold Wave Analysis
- Gold reversed from resistance level 1820.00
- Likely to fall to support level 230.00
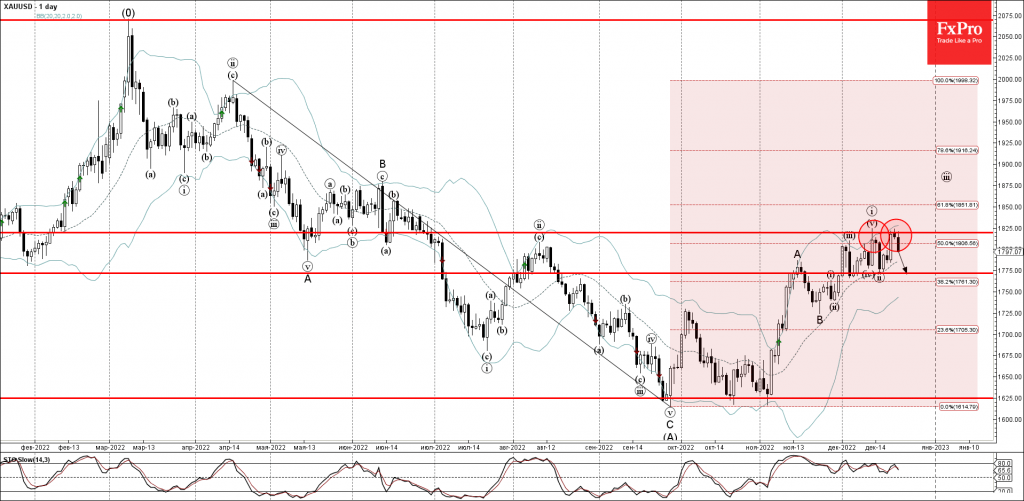
Gold today once again reversed down strongly from the resistance zone located between the resistance level 1820.00 (top of the previous impulse wave (1)) and the upper daily Bollinger Band.
Gold previously created the daily Evening Star candlesticks reversal pattern near the resistance level 1820.00 – highlighting the strength of this price level.
Given the multi-month downtrend, Gold can be expected to fall further toward the next support level 1775.00 (low of the earlier wave (ii)).
EUR/USD Mid-Day Outlook
Daily Pivots: (S1) 1.0581; (P) 1.0613; (R1) 1.0636; More...
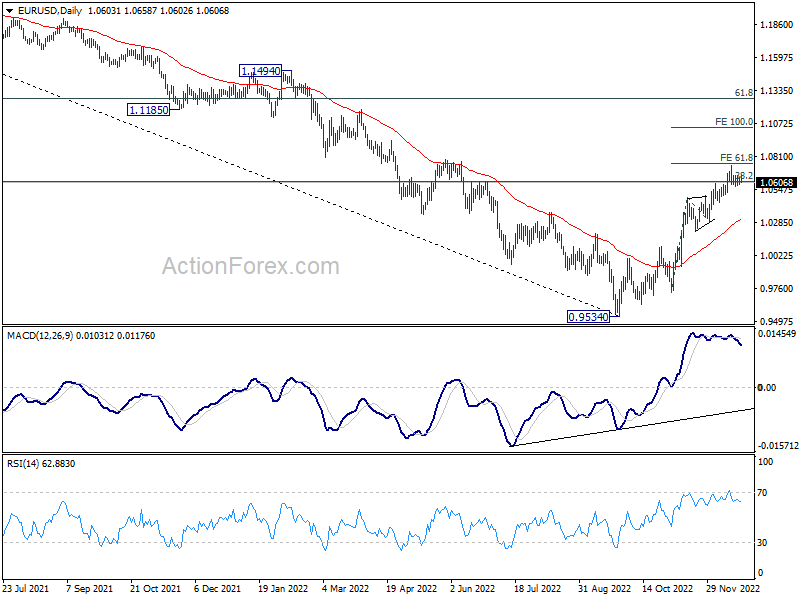
No change in EUR/USD's outlook as sideway trading continues. Intraday bias remains neutral for the moment. Further rally is expected as long as 1.0481 resistance turned support holds. Firm break of 61.8% projection of 0.9729 to 1.0481 from 1.0289 at 1.0754 will pave the way to 100% projection at 1.1041. However, firm break of 1.0481 will confirm short term topping and bring deeper fall to 1.0289 support.
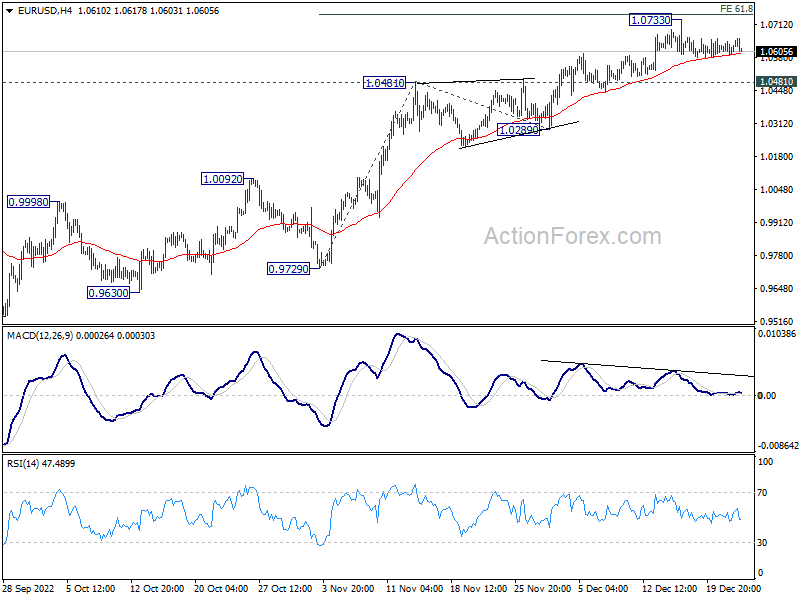
In the bigger picture, focus stays on 38.2% retracement of 1.2348 (2021 high) to 0.9534 at 1.0609. Rejection by 1.0609 will suggest that price actions from 0.9534 medium term bottom are developing into a corrective pattern. Thus, medium bearishness is retained for another fall through 0.9534 at a later stage. However, sustained break of 1.0609 will raise the chance of trend reversal and target 61.8% retracement at 1.1273.
GBP/USD Mid-Day Outlook
Daily Pivots: (S1) 1.2028; (P) 1.2111; (R1) 1.2166; More...
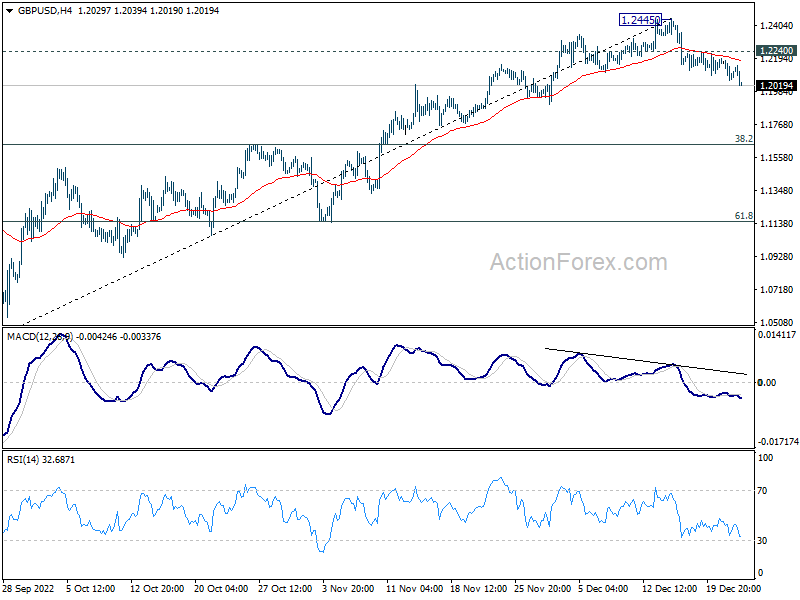
Intraday bias in GBP/USD stays on the downside, as fall from 1.2445 is targeting 55 day EMA (now at 1.1900). Firm break there will target 38.2% retracement of 1.0351 to 1.2445 at 1.1645. On the upside, break of 1.2240 minor resistance will turn bias back to the upside for retesting 1.2445 instead.
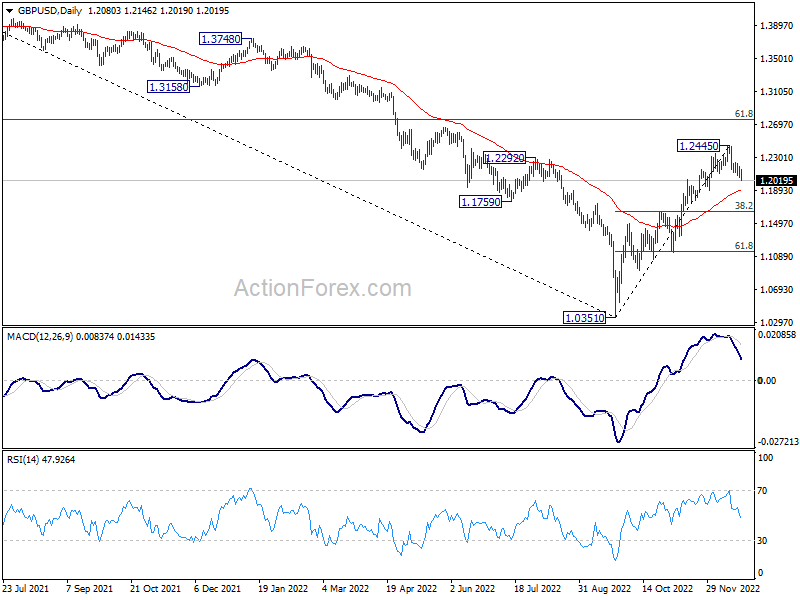
In the bigger picture, rise from 1.0351 medium term bottom is at least correcting whole down trend from 1.4248 (2021 high). Further rise is expected as long as 1.1644 resistance turned support holds. Next target is 61.8% retracement of 1.4248 to 1.0351 at 1.2759. Sustained break there will pave the way back to 1.4248. This will remain the favored case as long as 55 day EMA (now at 1.1900) holds.
USD/JPY Mid-Day Outlook
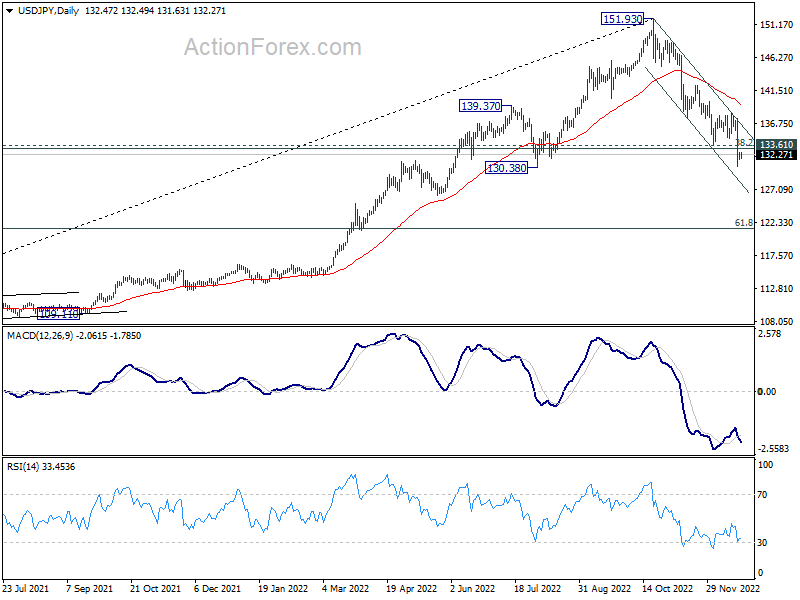
Daily Pivots: (S1) 131.81; (P) 132.17; (R1) 132.83; More...
Intraday bias in USD/JPY stays neutral and outlook is unchanged. Immediate focus remains on 55 week EMA (now at 131.76). Decisive break there will pave the way to next fibonacci level at 121.43. On the upside, above 133.61 support turned resistance will turn intraday bias back to the upside for 138.16 resistance.
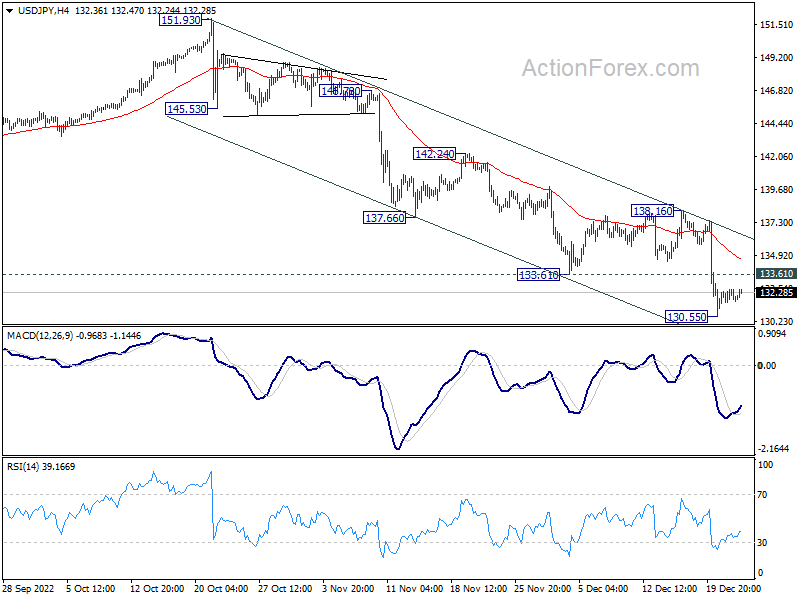
In the bigger picture, price actions from 151.93 medium term could be just a corrective pattern to up trend from 102.58 (2021 low). Strong support from 38.2% retracement of 102.58 to 151.93 at 133.07 and 55 week EMA (now at 131.76) will set the range for such corrective pattern. However, sustained break of 55 week EMA will pave the way to 61.8% retracement at 121.43.
USD/CHF Mid-Day Outlook
Daily Pivots: (S1) 0.9241; (P) 0.9266; (R1) 0.9292; More...
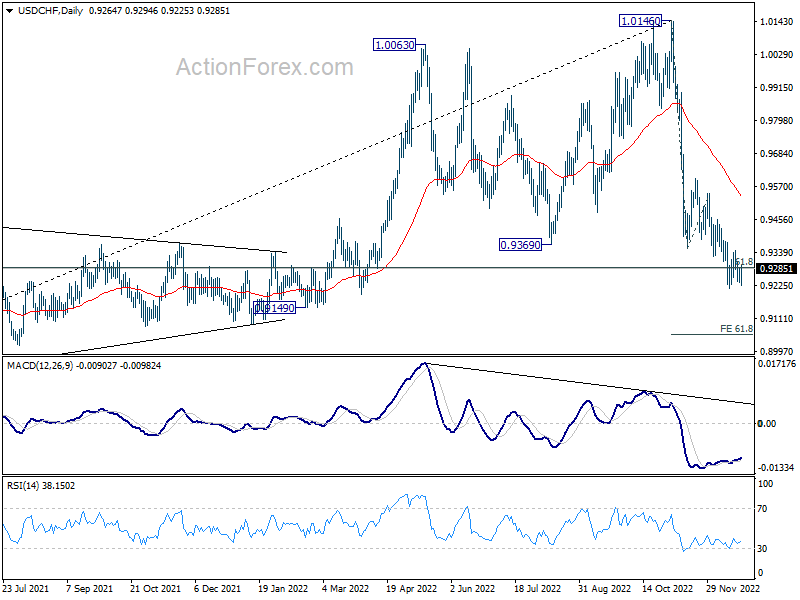
USD/CHF recovers ahead of 0.9214 support as range trading continues. Intraday bias remains neutral first. Further decline is in favor with 0.9378 resistance intact. On the downside, break of 0.9214 will resume the fall and target 61.8% projection of 1.0146 to 0.9355 from 0.9545 at 0.9056. However, break of 0.9378 resistance will indicate short term bottoming and turn bias back to the upside for 0.9545 resistance instead.
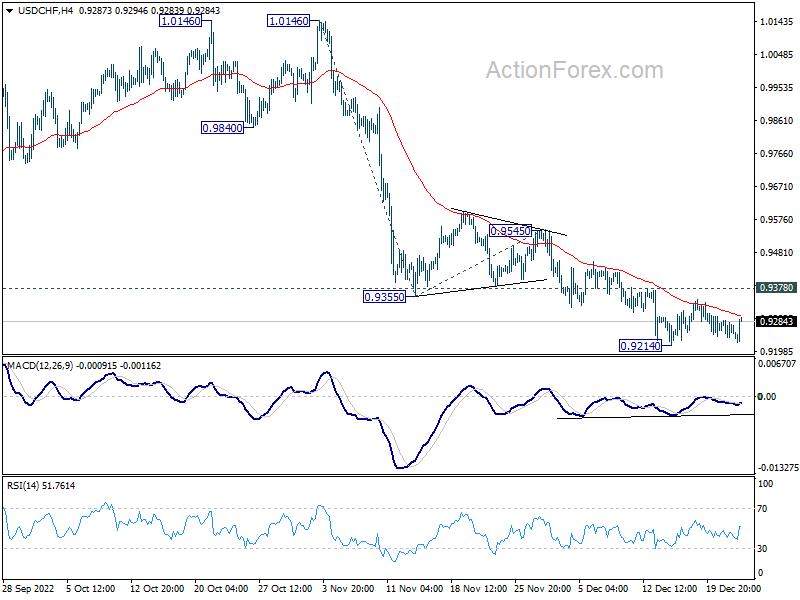
In the bigger picture, rise from 0.8756 (2021 low) has completed at 1.0146, well ahead of 1.0342 long term resistance (2016 high). Based on current downside momentum, fall from 1.0146 might be a medium term down trend itself. Sustained break of 61.8% retracement of 0.8756 to 1.0146 at 0.9287 will pave the way to 0.8756. In any case, risk will stay on the downside as long as 0.9545 resistance holds.