Sample Category Title
Dollar Fighting Back in Pre-Holiday Trading
Dollar is trying to strike back as traders are likely starting to light up their positions ahead of holidays. But for now, Yen and Euro are so far the more resilient ones. Sterling is sold off broadly earlier today but it's not worse the Kiwi. Aussie is also quickly paring back earlier gains.
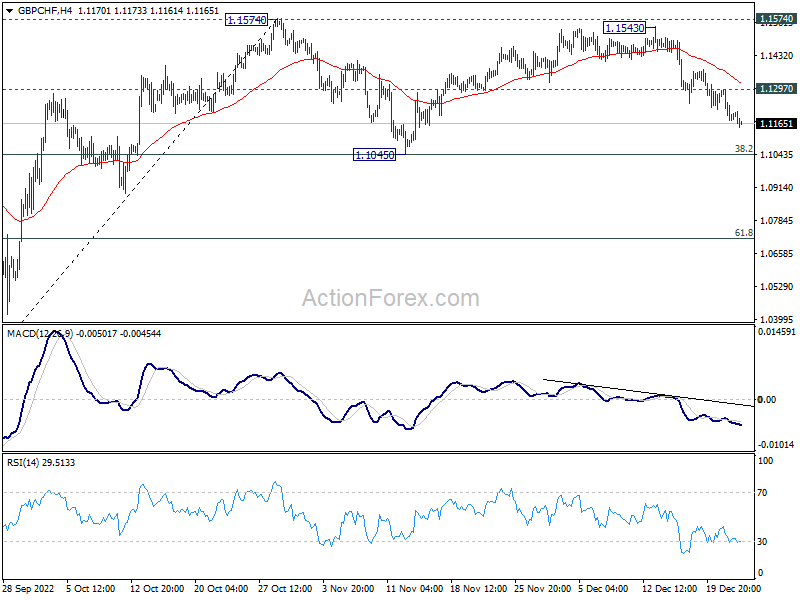
Technically, GBP/CHF is extending the decline from 1.1543 today. Such fall is seen as the third leg of the corrective pattern from 1.1574. Strong support should be seen from 1.1045, (38.2% retracement of 1.0183 to 1.1574) to bring rebound. Above 1.1297 minor resistance will be the first sign of stabilization. However, EUR/GBP is now pressing a key near term resistance level at 0.8827. Strong break there could shoot EUR/GBP further higher towards 0.9267 high. If happens, that might be accompanied by a strong break of 1.1045 in GBP/CHF.
In Europe, at the time of writing, FTSE is up 0.33%. DAX is down -0.45%. CAC is down -0.25%. Germany 10-year yield is up 0.059 at 2.370. Earlier in Asia, Nikkei rose 0.46%. Hong Kong HSI rose 2.71%. China Shanghai SSE dropped -0.46%. Singapore Strait Times rose 0.41%. Japan 10-year JGB yield dropped -0.0809 to 0.399, back below 0.4% handle.
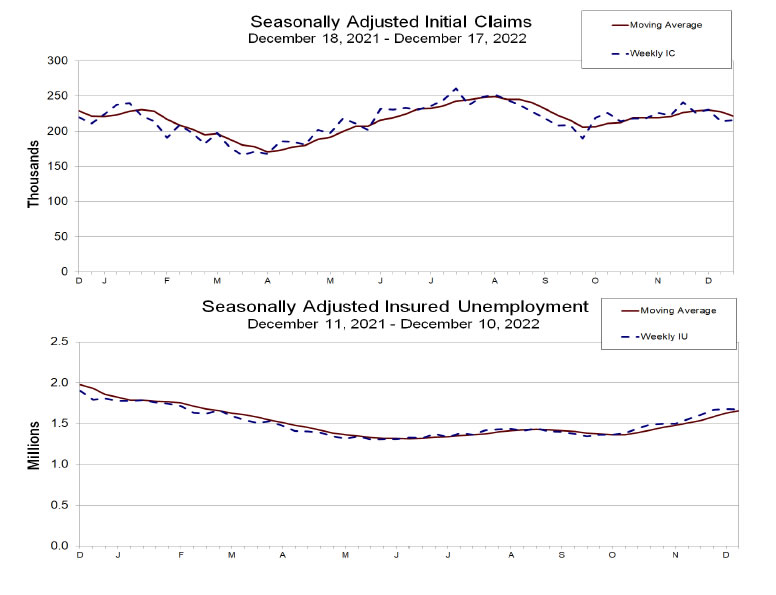
US initial jobless claims rose to 216k, below expectation
US initial jobless claims rose 2k to 216k in the week ending December 17, below expectation of 220k. Four-week moving average of initial claims dropped -6k to 222k.
Continuing claims dropped -6k to 1672k in the week ending December 10. Four-week moving average of continuing claims rose 30k to 1657k.
Also released, Q3 GDP growth was finalized at 3.2% annualized. Price index was finalized at 4.4%.
ECB de Guindos: 50bps is the new norm for a period of time
ECB Vice President Luis de Guindos said in an interview with Le Monde, "increases of 50 basis points may become the new norm in the near term". He added, "we should expect to raise interest rates at this pace for a period of time" and "enter into restrictive territory."
He expects inflation will be "somewhere around its current level" at 10% "over the course of the next two or three months". Inflation will then drop to "hover around 7% by middle of the year. As it's "still clearly above" ECB's target of 2%, "We have no choice but to act."
Regarding the economy, he said, "our projections therefore expect the euro area to fall into a mild recession in the last quarter of this year and in the first quarter of 2023, when GDP is expected to contract by 0.1%."
USD/CHF Mid-Day Outlook
Daily Pivots: (S1) 0.9241; (P) 0.9266; (R1) 0.9292; More...
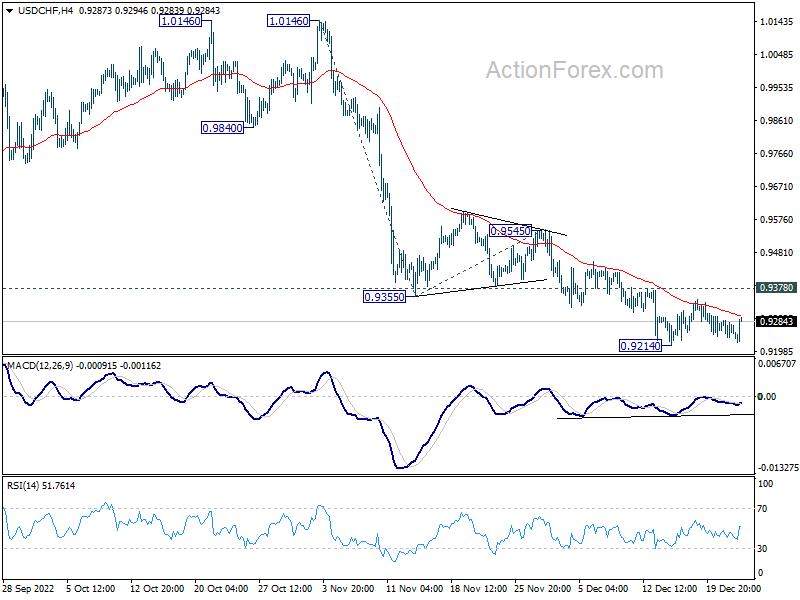
USD/CHF recovers ahead of 0.9214 support as range trading continues. Intraday bias remains neutral first. Further decline is in favor with 0.9378 resistance intact. On the downside, break of 0.9214 will resume the fall and target 61.8% projection of 1.0146 to 0.9355 from 0.9545 at 0.9056. However, break of 0.9378 resistance will indicate short term bottoming and turn bias back to the upside for 0.9545 resistance instead.
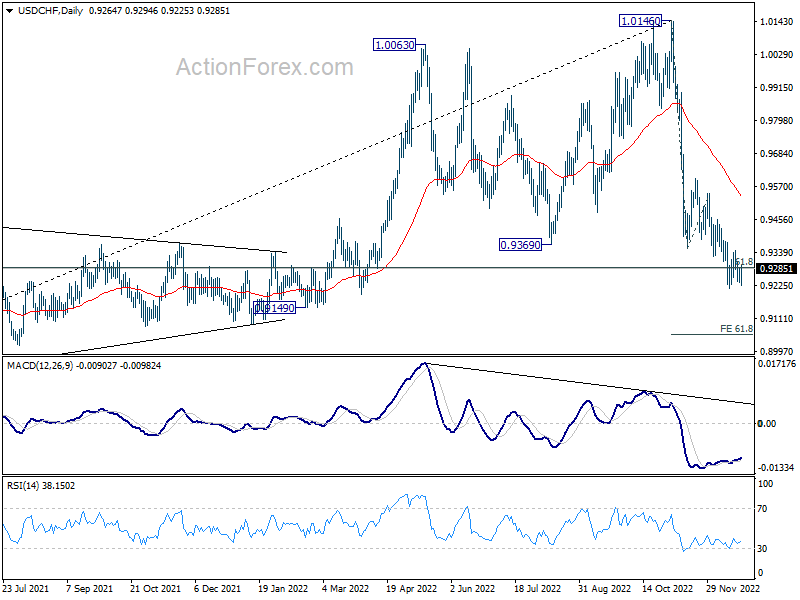
In the bigger picture, rise from 0.8756 (2021 low) has completed at 1.0146, well ahead of 1.0342 long term resistance (2016 high). Based on current downside momentum, fall from 1.0146 might be a medium term down trend itself. Sustained break of 61.8% retracement of 0.8756 to 1.0146 at 0.9287 will pave the way to 0.8756. In any case, risk will stay on the downside as long as 0.9545 resistance holds.
Economic Indicators Update
| GMT | Ccy | Events | Actual | Forecast | Previous | Revised |
|---|---|---|---|---|---|---|
| 07:00 | GBP | Current Account (GBP) Q3 | -19.4B | -20.0B | -33.8B | |
| 07:00 | GBP | GDP Q/Q Q3 F | -0.30% | -0.20% | -0.20% | |
| 13:30 | USD | Initial Jobless Claims (Dec 16) | 216K | 220K | 211K | 214K |
| 13:30 | USD | GDP Annualized Q3 F | 3.20% | 2.90% | 2.90% | |
| 13:30 | USD | GDP Price Index Q3 F | 4.40% | 4.30% | 4.30% | |
| 15:30 | USD | Natural Gas Storage | -91B | -50B |
US initial jobless claims rose to 216k, below expectation
US initial jobless claims rose 2k to 216k in the week ending December 17, below expectation of 220k. Four-week moving average of initial claims dropped -6k to 222k.
Continuing claims dropped -6k to 1672k in the week ending December 10. Four-week moving average of continuing claims rose 30k to 1657k.
Japanese Yen Steady Ahead of CPI
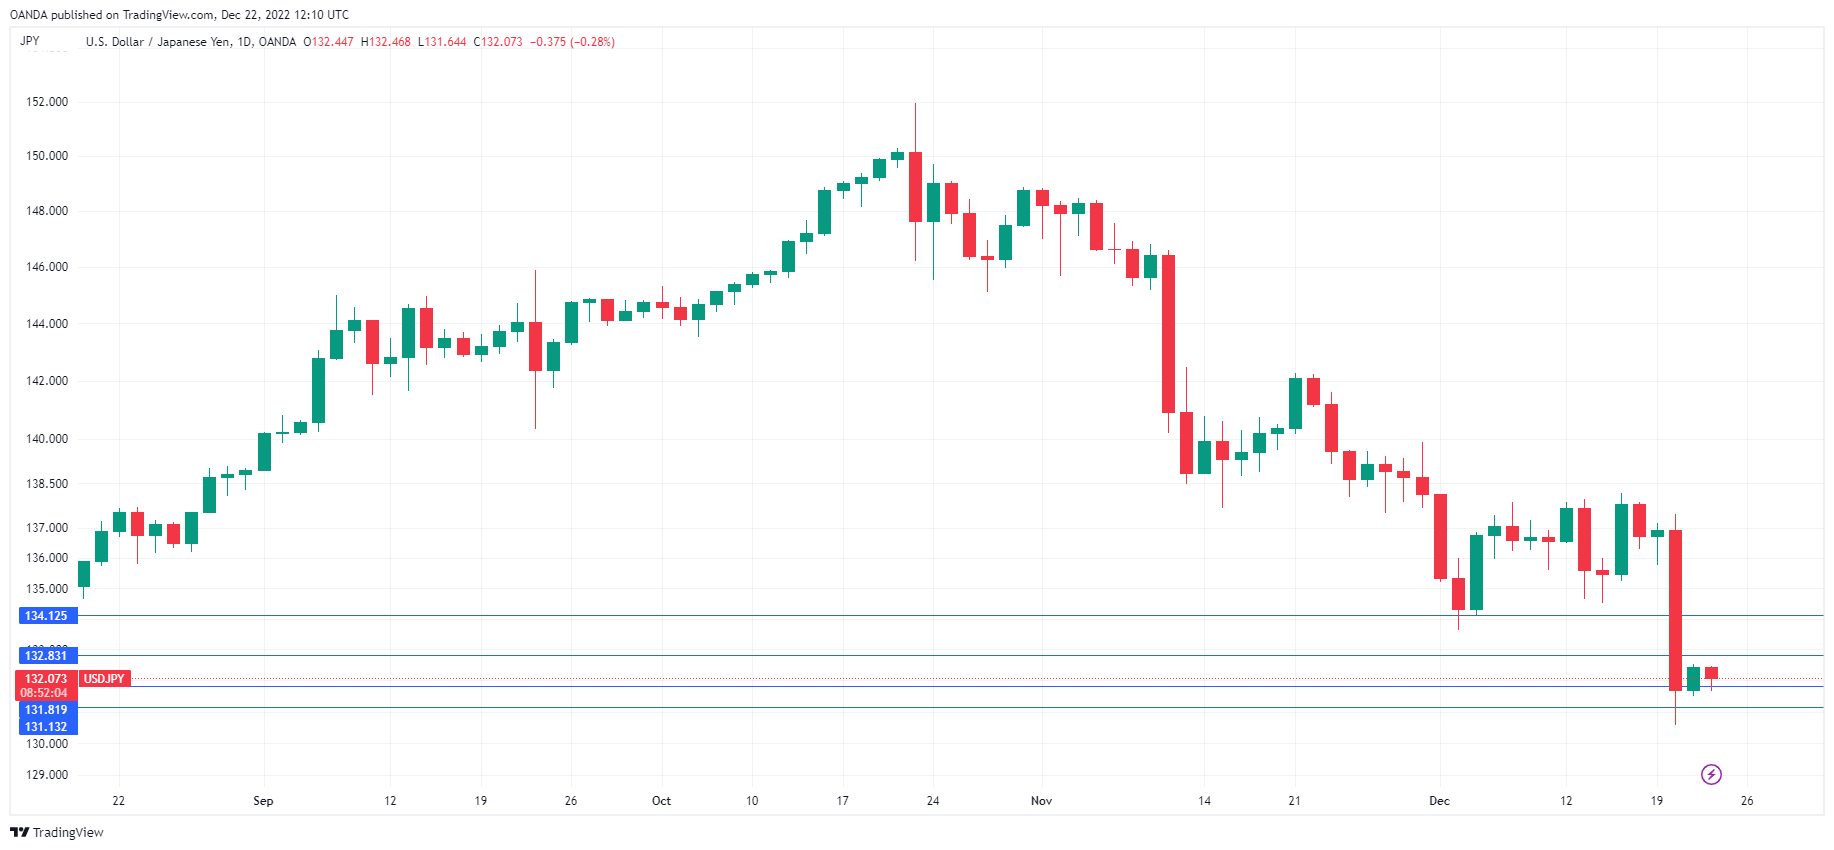
The Japanese yen has edged higher on Thursday. In the European session, USD/JPY is trading at 132.09, down 0.27%.
The dust has settled after Tuesday’s dramatic events, when the yen shot up 3.7%. This followed the Bank of Japan’s shocking announcement that it would widen its yield curve control on 10-year bonds from 25 bp to 50 bp. The markets were completely blindsided, which could very well be what the BoJ was hoping for. The markets hadn’t expected any policy moves until after BoJ Governor Kuroda ends his term in April, but now there is talk of major policy moves before then, such as raising interest rates out of negative territory. The BoJ releases minutes later today, but these are minutes of the November meeting. Still, with all of the drama that the BoJ has produced this week, investors will be keeping an eye on this release, looking for clues about future policy.
National Core CPI next
What will be of more interest to the markets is National Core CPI for November, which will also be released later today. The index is expected to inch up to 3.7%, up from 3.6% in October. Japan’s inflation rate is much lower than the US or the UK, but price pressures have nonetheless put the squeeze on households and businesses, which became accustomed to decades of deflation. With economic conditions improving and inflation rising, there has been speculation that the BoJ might consider major policy moves in the short-term, such as exiting from its stimulus programme. The BoJ showed this week that it was willing to make significant moves, and more tightening could be on the way.
USD/JPY Technical
- USD/JPY has support at 131.13 and 130.15
- There is resistance at 132.83 and 134.12
Euro Steady on Light Data Calendar
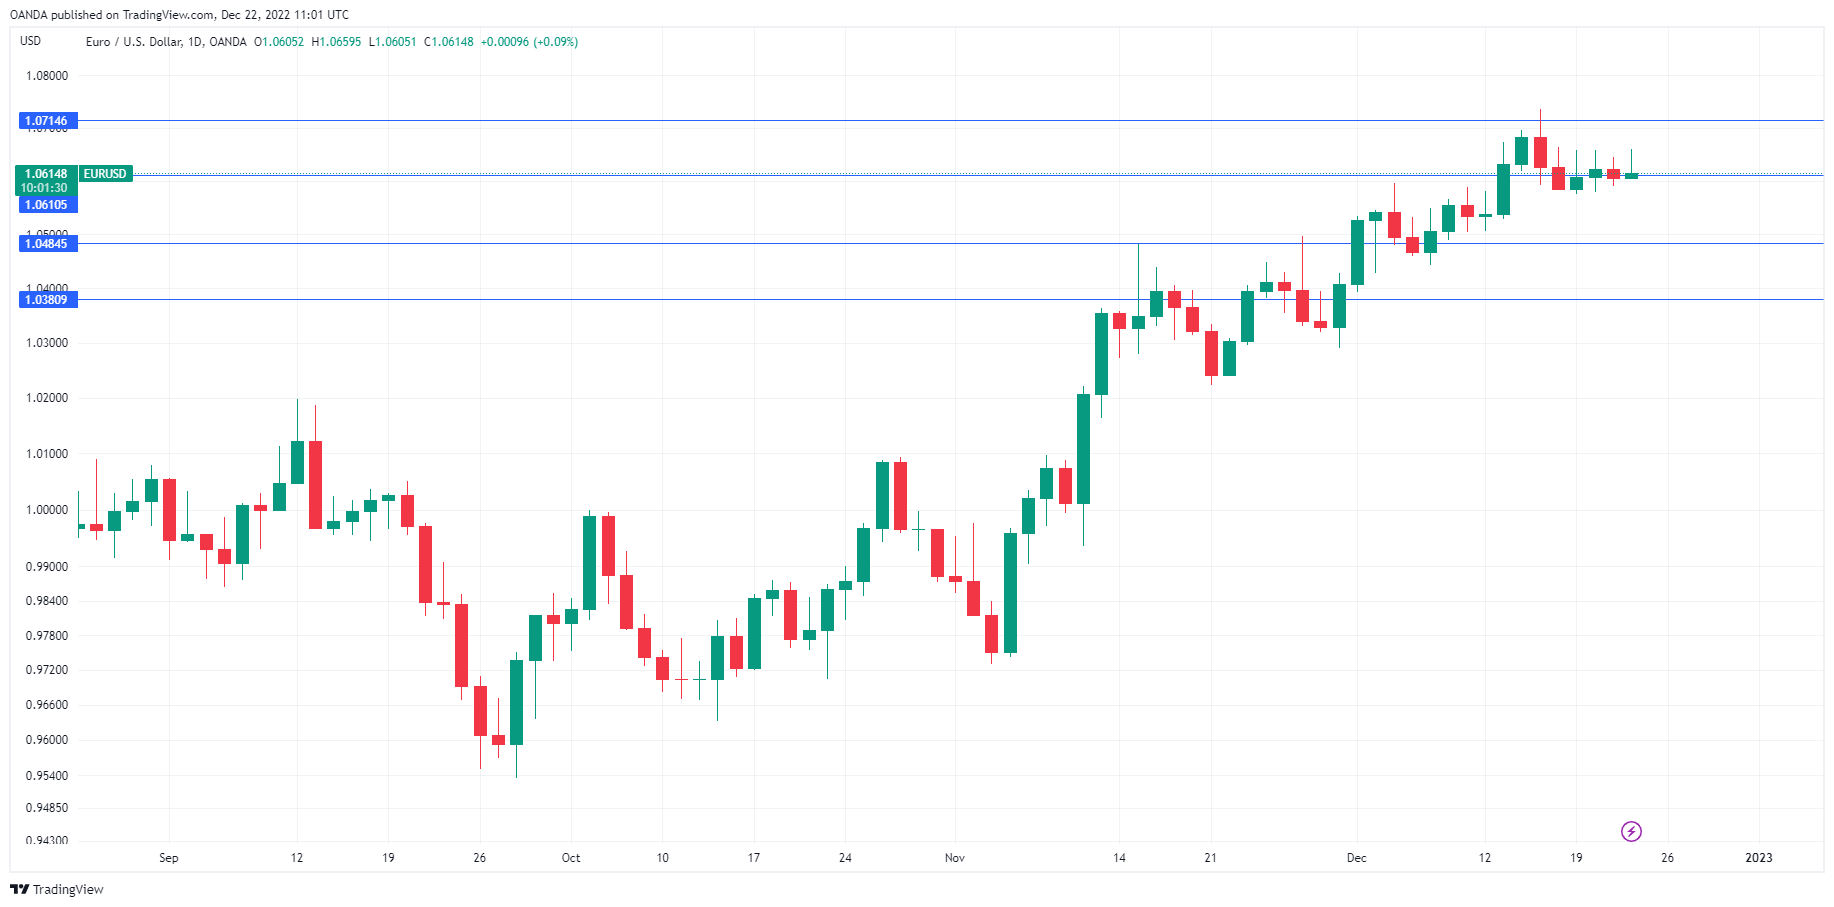
EUR/USD continues to drift this week, content to stick close to the 1.06 line. There are no eurozone releases today, so I expect the euro to continue treading in place for the remainder of the day.
This week’s data calendar in Europe has been very light, with mostly tier-2 releases. On Thursday, Germany and the US both released consumer confidence data, which pointed to very different consumer mindsets. Germany’s GfK Consumer Sentiment Index remained in deep freeze at -37.8, although the index has been inching higher, courtesy of energy prices stabilizing. Still, the German consumer is deeply pessimistic. At home, high inflation and rising interest rates are squeezing consumers, while the war in Ukraine, which has dampened economic activity, shows no signs of ending anytime soon. The German release mirrored Tuesday’s eurozone consumer confidence, which is also mired deep in negative territory.
Contrast this gloomy outlook with the US, where CB Consumer Confidence surprised the markets by climbing to a 5-month high, with a reading of 108.3 in December. This blew past the November reading of 101.4 and the consensus of 101.0. The CB noted that inflation expectations fell to their lowest level since September 2021, in large part due to the drop in gas prices. The strong improvement in consumer confidence is interesting, as the US economy is expected to tip into recession – perhaps consumers are confident that the recession will not be all that bad.
ECB’s De Guindos talks hawkish
The ECB eased up on the pace of rates at the December meeting, as it delivered a 50-bp increase after two consecutive 75-bp increases. ECB President Lagarde warned that this was not a dovish pivot and that further rates hikes were coming. ECB Vice-President Luis de Guindos sounded hawkish on Thursday, saying, “Increases of 50 basis points may become the new norm in the near term.” De Guindos said the ECB had to do more in the fight against inflation and voiced concern that the markets might underestimate the persistence of inflation. Fed Chair Jerome Powell would likely agree, as the Fed has had a tough time trying to convince the markets that it plans to continue tightening in order to curb inflation.
EUR/USD Technical
- EUR is testing resistance at 1.0610. Above, there is resistance at 1.0714
- 1.0484 and 1.0380 are providing support
WTI Oil Futures Bounce off 1-Year Low
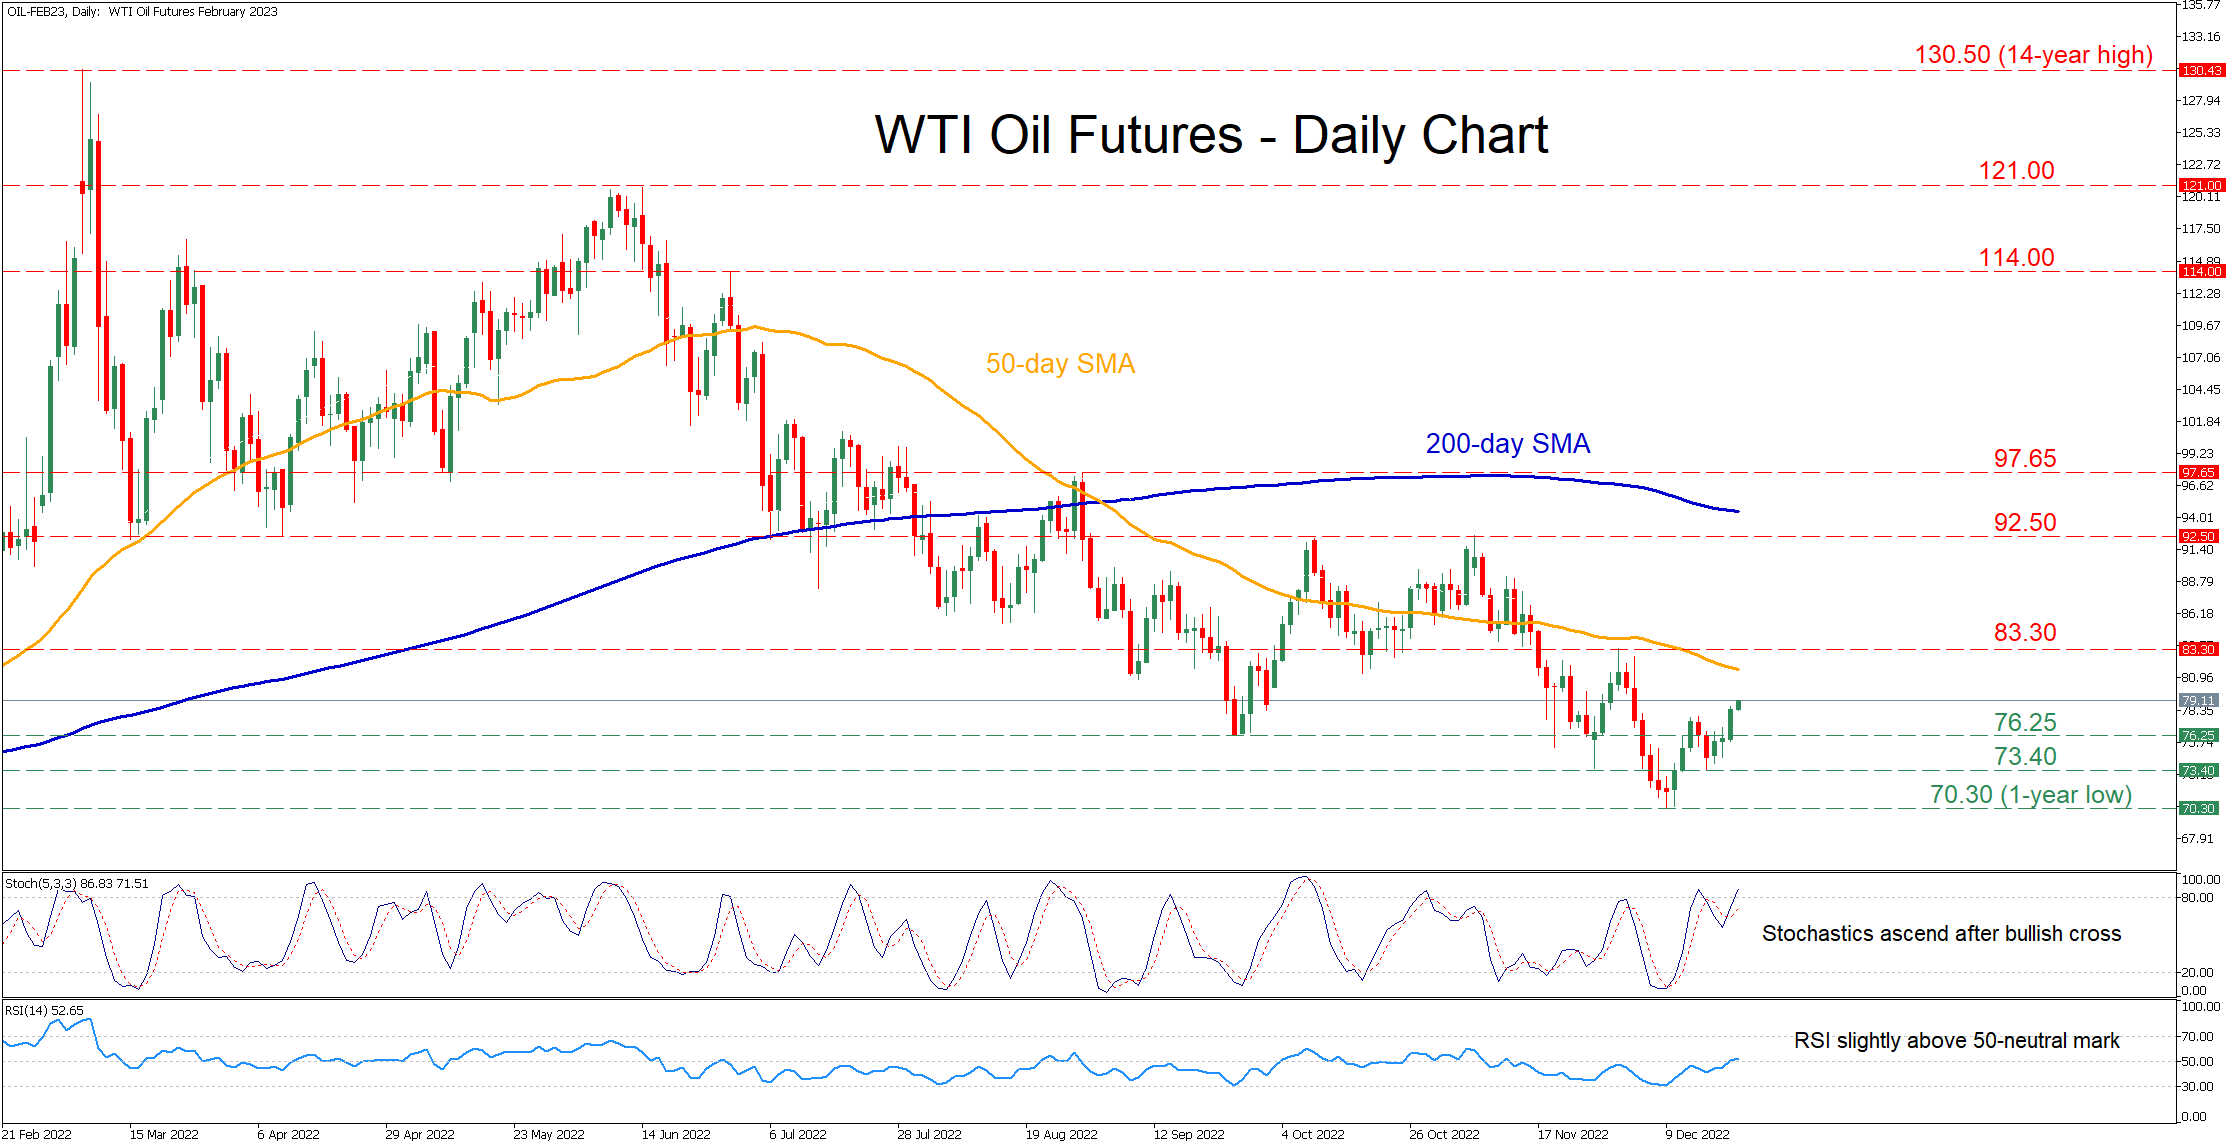
WTI oil futures (February delivery) have been trending lower since mid-June when the price got rejected at the 121.00 region. Furthermore, in the last few daily sessions, the commodity plummeted to a fresh one-year low of 70.30 before recouping some losses.
The momentum indicators currently suggest that bullish forces are strengthening. Specifically, the RSI has jumped above its 50-neutral mark, while the stochastic oscillator is sloping upwards after posting a bullish cross.
Should buying pressures persist, oil futures might ascend towards the recent resistance of 83.30. Piercing through this region, the spotlight could turn to the November high of 92.50. Conquering this barricade, the August peak of 97.65 may curb any further advances.
On the flipside, if sellers re-emerge and push the price lower, initial support could be met at the September low of 76.25. Failing to halt there, the bears could aim at the recent support of 73.40. A violation of that wall may trigger a retreat towards the one-year low of 70.30.
Overall, even though WTI oil futures appear to be gaining some ground after hitting a one-year low, the technical picture remains bearish. Hence, a break above the 92.50 ceiling is needed to alter the short-term outlook back to positive.
EURGBP Gets Fresh Impetus; Tests Key Resistance
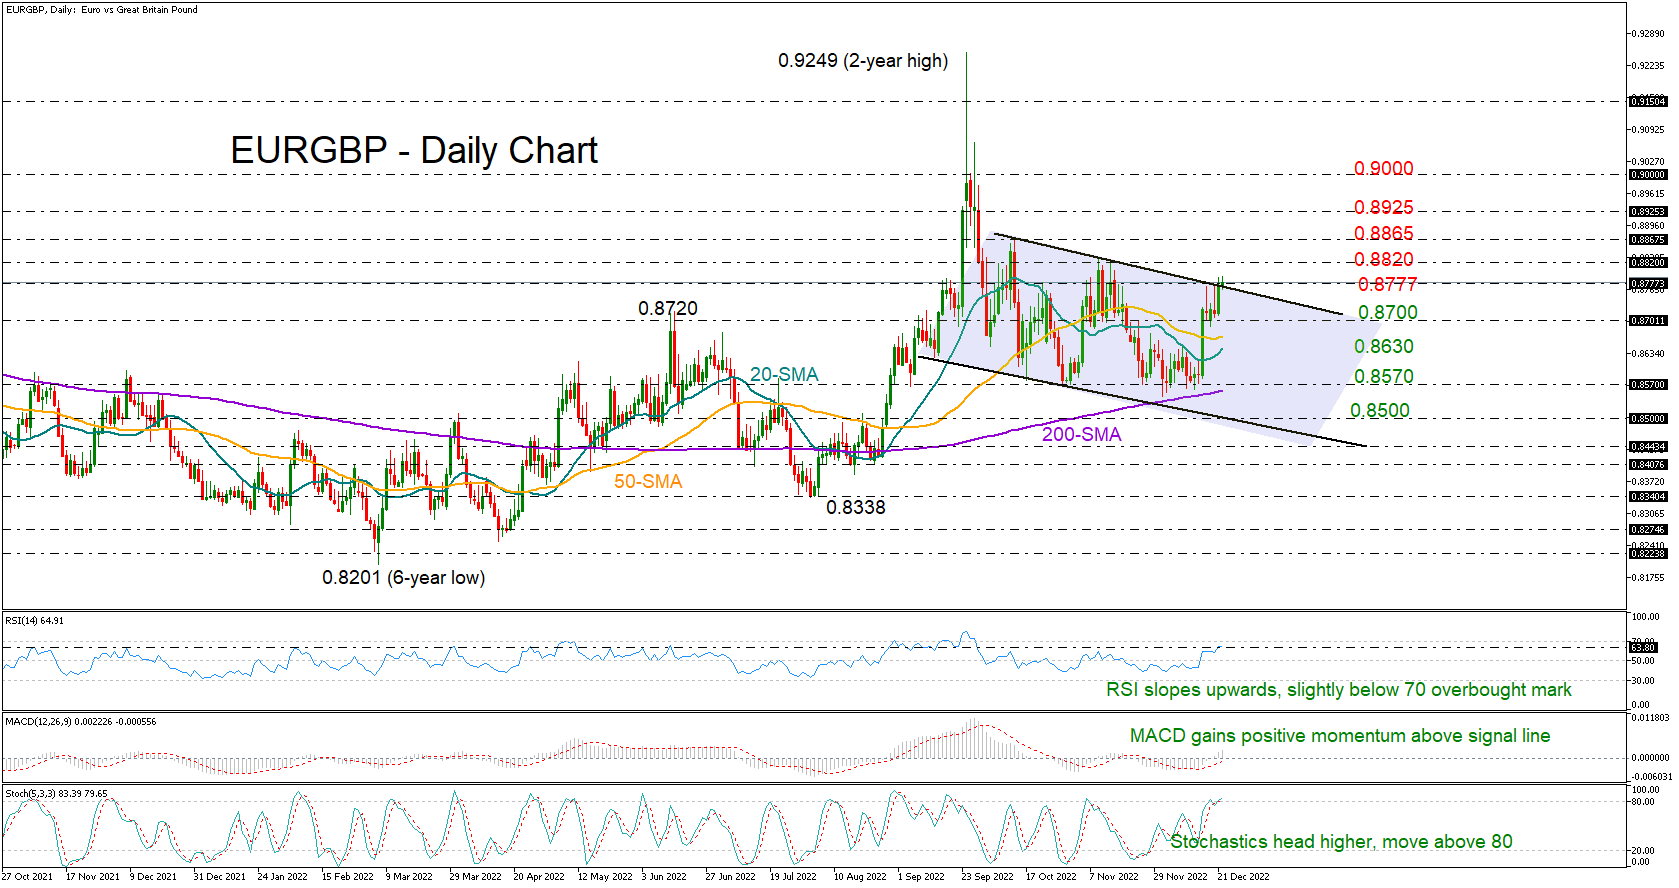
EURGBP drew bulls‘ attention after setting a nice foothold around the 0.8700 key constraining zone, with the price accelerating to a new five-week high of 0.8790 early on Thursday.
Additional gains are likely as the momentum indicators keep strengthening within the bullish area. Yet, some caution is required as the RSI and the stochastics are close to overbought levels. Besides, with the price trading around the upper boundary of a descending channel at 0.8777 and not far below the key 0.8820 resistance area, the bears might be around the corner. Otherwise, should the bulls successfully claim the latter, October’s high of 0.8865 could be the next challenge ahead of the 0.8925 barricade. Even higher, the spotlight will fall on the 0.9000 psychological mark.
Alternatively, a bearish correction could retest the 0.8700 base before extending to the 0.8630 handle. A continuation lower could then meet the 200-day simple moving average (SMA) around the crucial 0.8570 floor, a break of which could press the price straight to the channel's lower line seen around 0.8500.
In summary, although the technical signals in EURGBP are looking encouraging at the moment, traders may not engage in more buying unless the price pierces through the 0.8777-0.8820 region.
Another Sign of Cooling Inflation in the US?
The last couple of US inflation readings came in well below expectations, showing a dramatic acceleration to the downside in the inflation rate. In fact, inflation for November was recorded as lower than in January. December might prove to be a bit of an exception because of the demand distortion around the holidays.
But, the value of the dollar is tied to the expectation of the Fed's rate policy in the months ahead. Which in turn is largely predicated on where inflation is headed. One of the main questions is whether the Fed will keep rates high as the economy slows. If inflation remains high, the chances of a Fed "pivot" fade. However, there is an indicator here which could show increasing downward pressure on inflation, which could allow the Fed a little more room for dovishness.
What happened?
First, we need to distinguish between core and headline inflation. The latter is driven in large part by increasing energy costs, which tend to be more volatile. Headline inflation has been coming down in line with fuel prices. But the Fed generally ignores this indicator, and focuses more on the core rate, which doesn't account for energy or food costs.
Diving a little deeper into the core inflation data from the last couple of months, we can see that the largest contributor to the drop was a cooling real estate market. CPI figures don't take into account the cost of houses, but do consider rent. And rent prices have been slowing down dramatically in line with slower home sales, as interest rates push up the cost of mortgages.
The new data
The presumption is that core inflation will continue its slide if rent prices continue their current trend. And a new gauge developed by the Federal Reserve Bank of Cleveland points in that direction. This indicator looks at the change in the amount of rent paid by new tenants and compares it to existing tenants. Essentially, it measures how much people are paying to rent a new place compared to their current rent prices.
Rent prices rise slowly, as it takes time for landlords and tenants to negotiate new contracts. But prices of rent coming on the market can fluctuate quite quickly. If there is demand, then the price of new contracts will rise quickly. If there is less demand, then the price of new contracted rents will drop. That's even if landlords raise asking rent; it won't be reflected in the data unless a contract is actually signed.
The trends and the future
What the indicator shows is that new rental contracts spiked through 2021 and early 2022, showing that people were renting at as much as 13% higher prices than the prior year. But, since September, those price increases have started to come down dramatically.
People are still paying significantly higher rental prices, at a growth rate of 5% compared to the prior year in November. But the trend is showing an even faster fall than the rise in prior years. In fact, it's the fastest drop on record.
If the trend maintains, it could contribute to core inflation coming in below expectations once again. That, in turn, could give the Fed more reason to keep rates from rising as high, and potentially allow room for a pivot to the downside at some point.
US Oil Grinds Higher
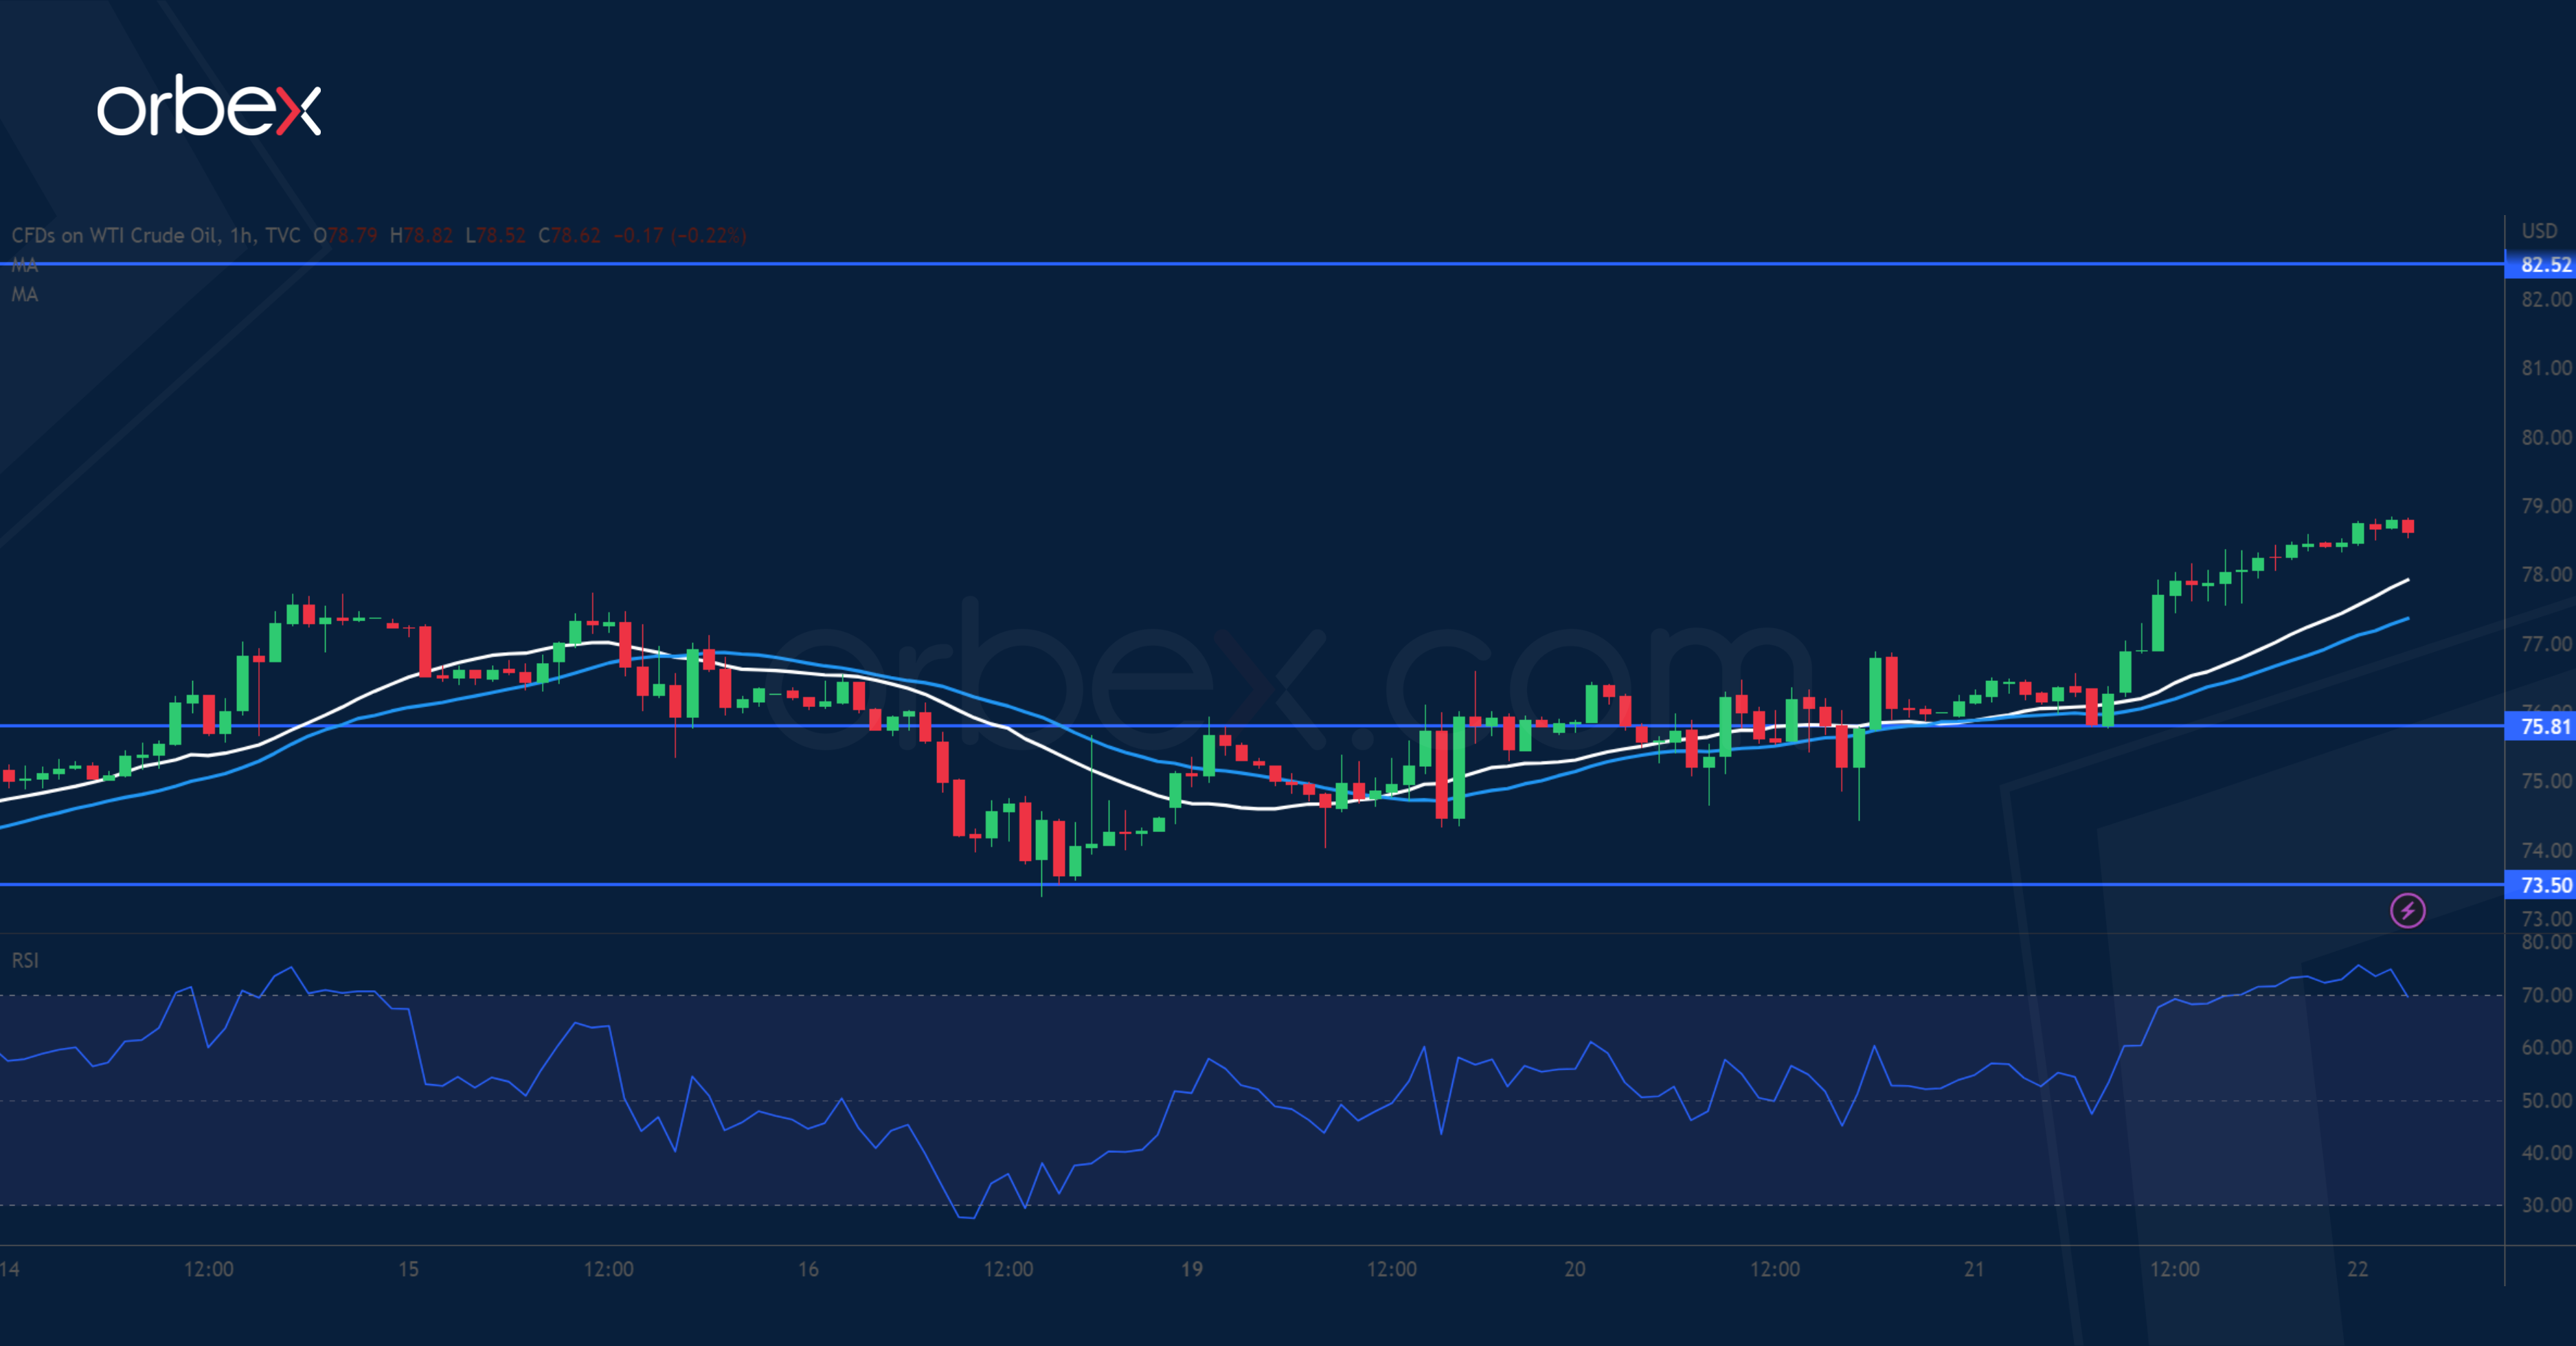
WTI crude edges higher over a larger-than-expected draw in US inventories. The commodity has so far found support at a 12-month low also the psychological handle of 70.00. Then a brief retracement saw follow-up bids over 73.50, suggesting solid interest from the buy side. A break above the recent high of 77.70 would open the path towards the daily resistance at 82.50 where renewed selling could be expected. Its breach, however, would put the oil price back on track. 75.80 is a fresh support in case of weakness.
USD/CHF Tests Critical Floor
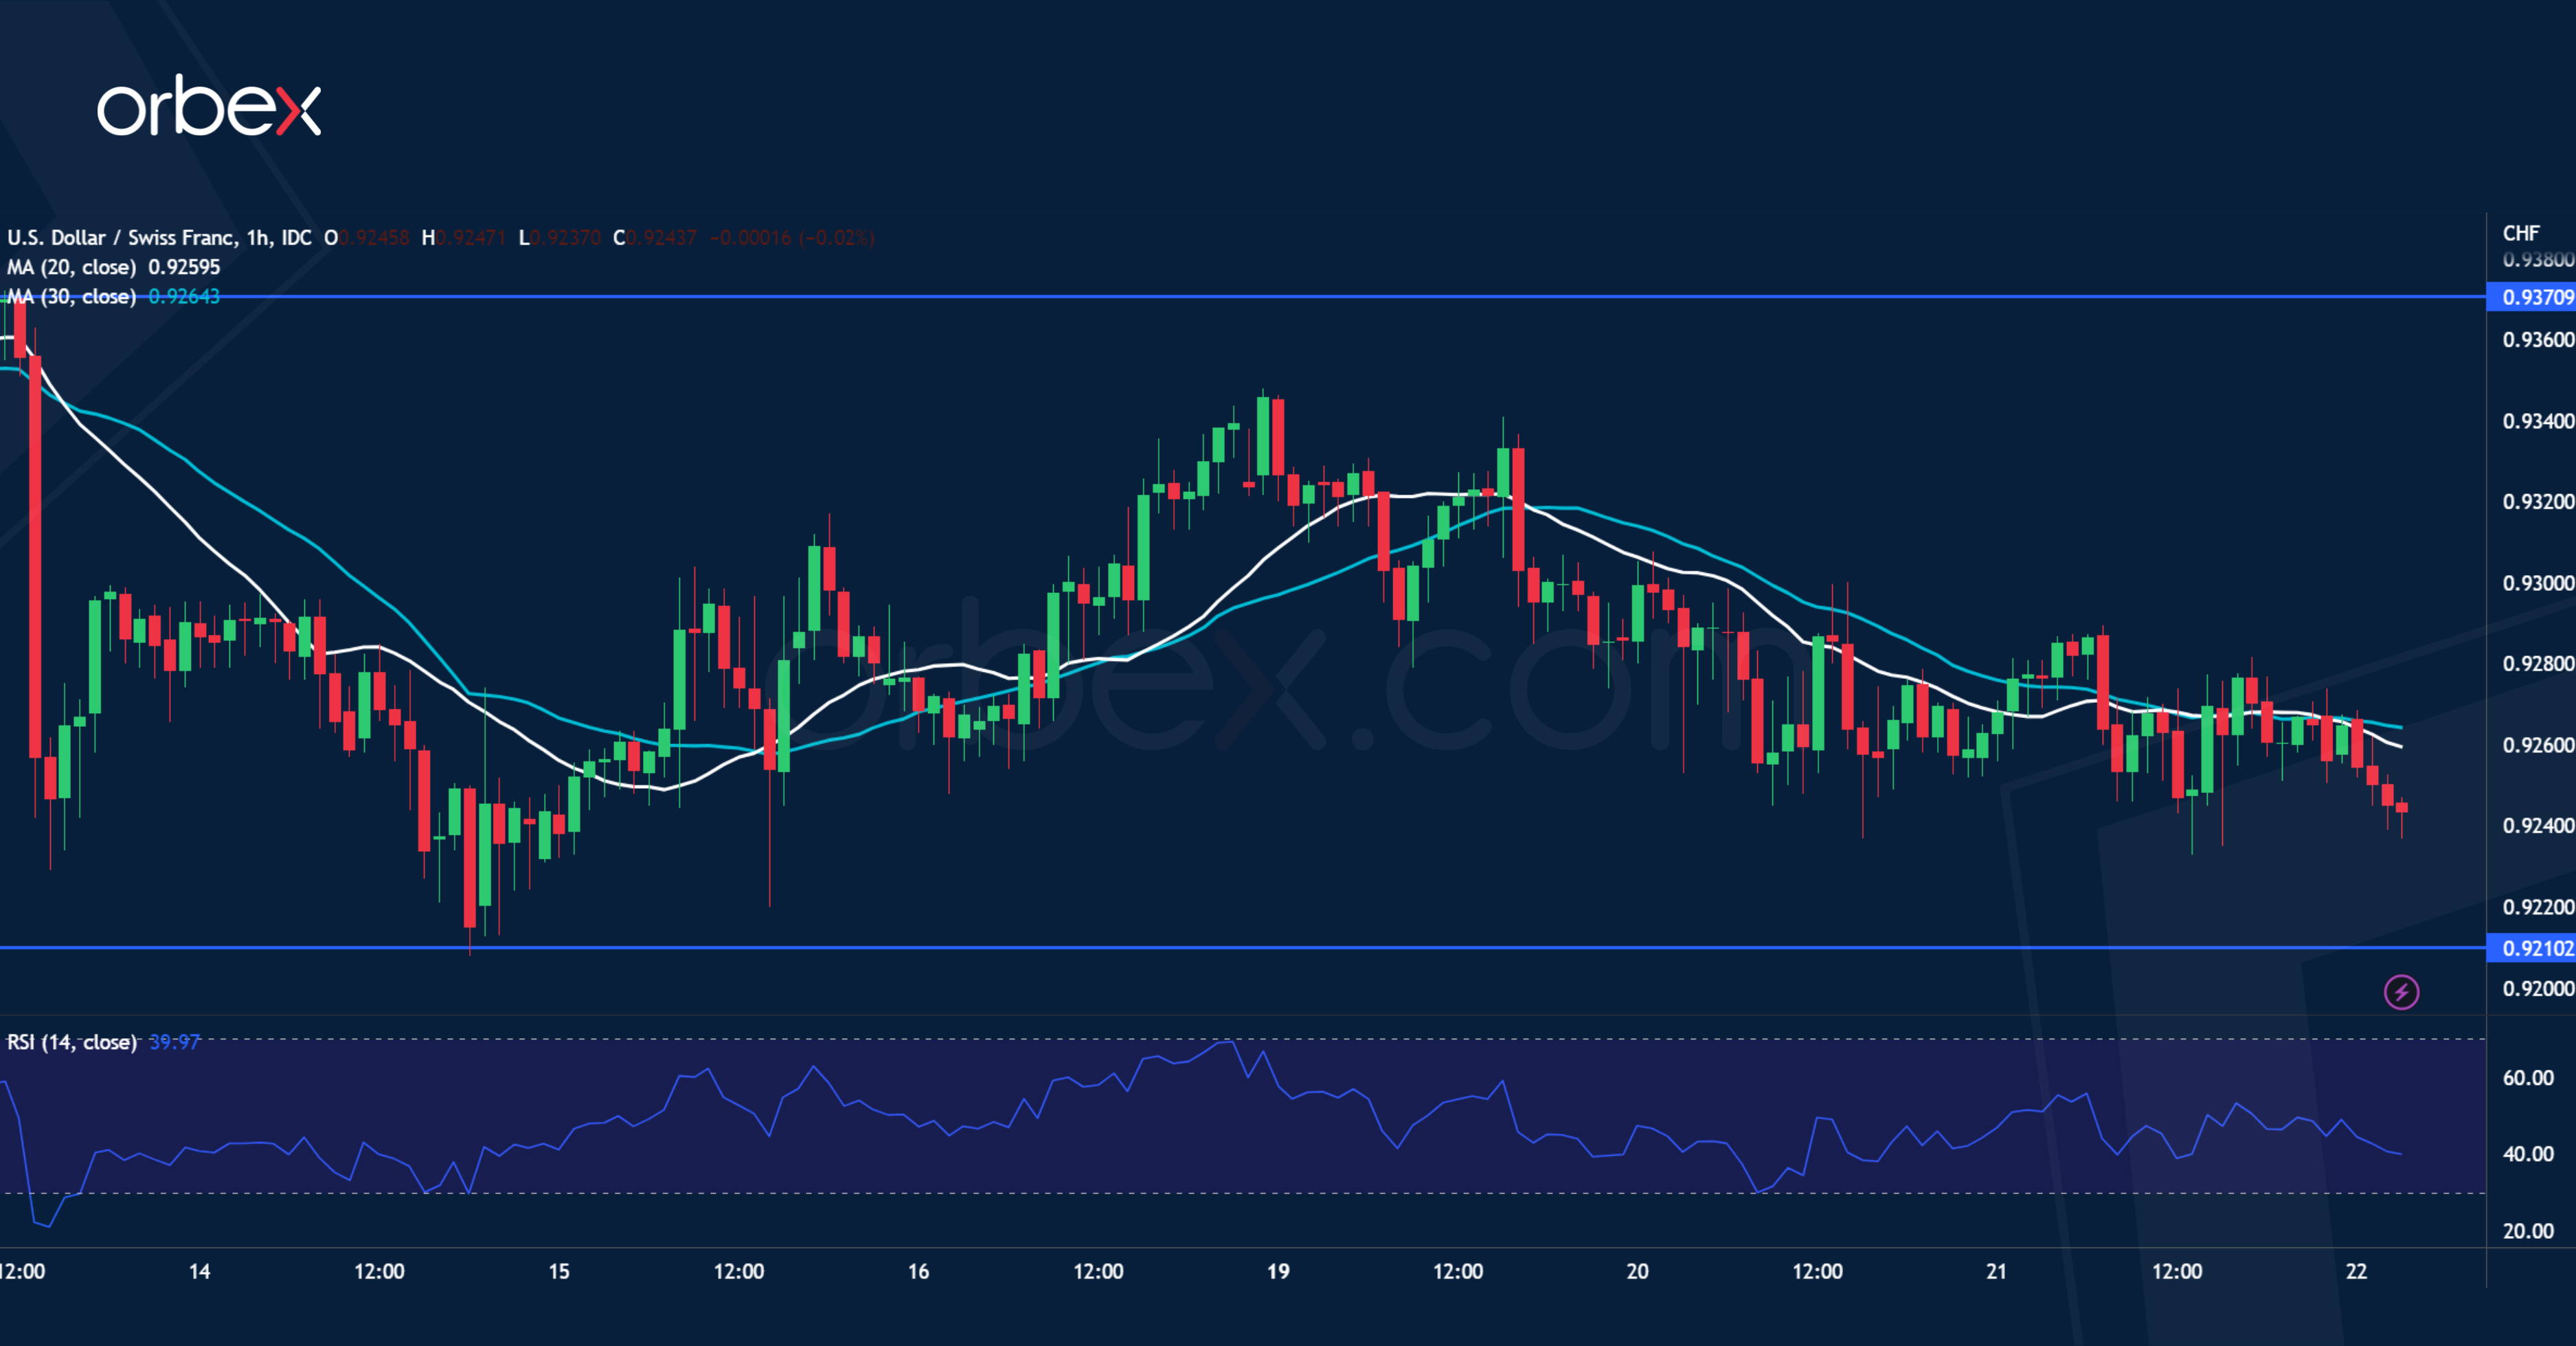
The US dollar steadies as consumer confidence climbed to an eight-month high in December. Still, the pair has given up all the gains from its rally earlier this year, which shows a lack of commitment to keep the dollar rolling. The mood is still downbeat as the pair drifts lower and is capped by a series of lower highs, the latest being at 0.9370 right under the 20-day moving average. Last April’s low of 0.9210 has attracted some bargain hunters but its breach could trigger a new round of sell-off to 0.9100.
USD/CAD Hits Resistance
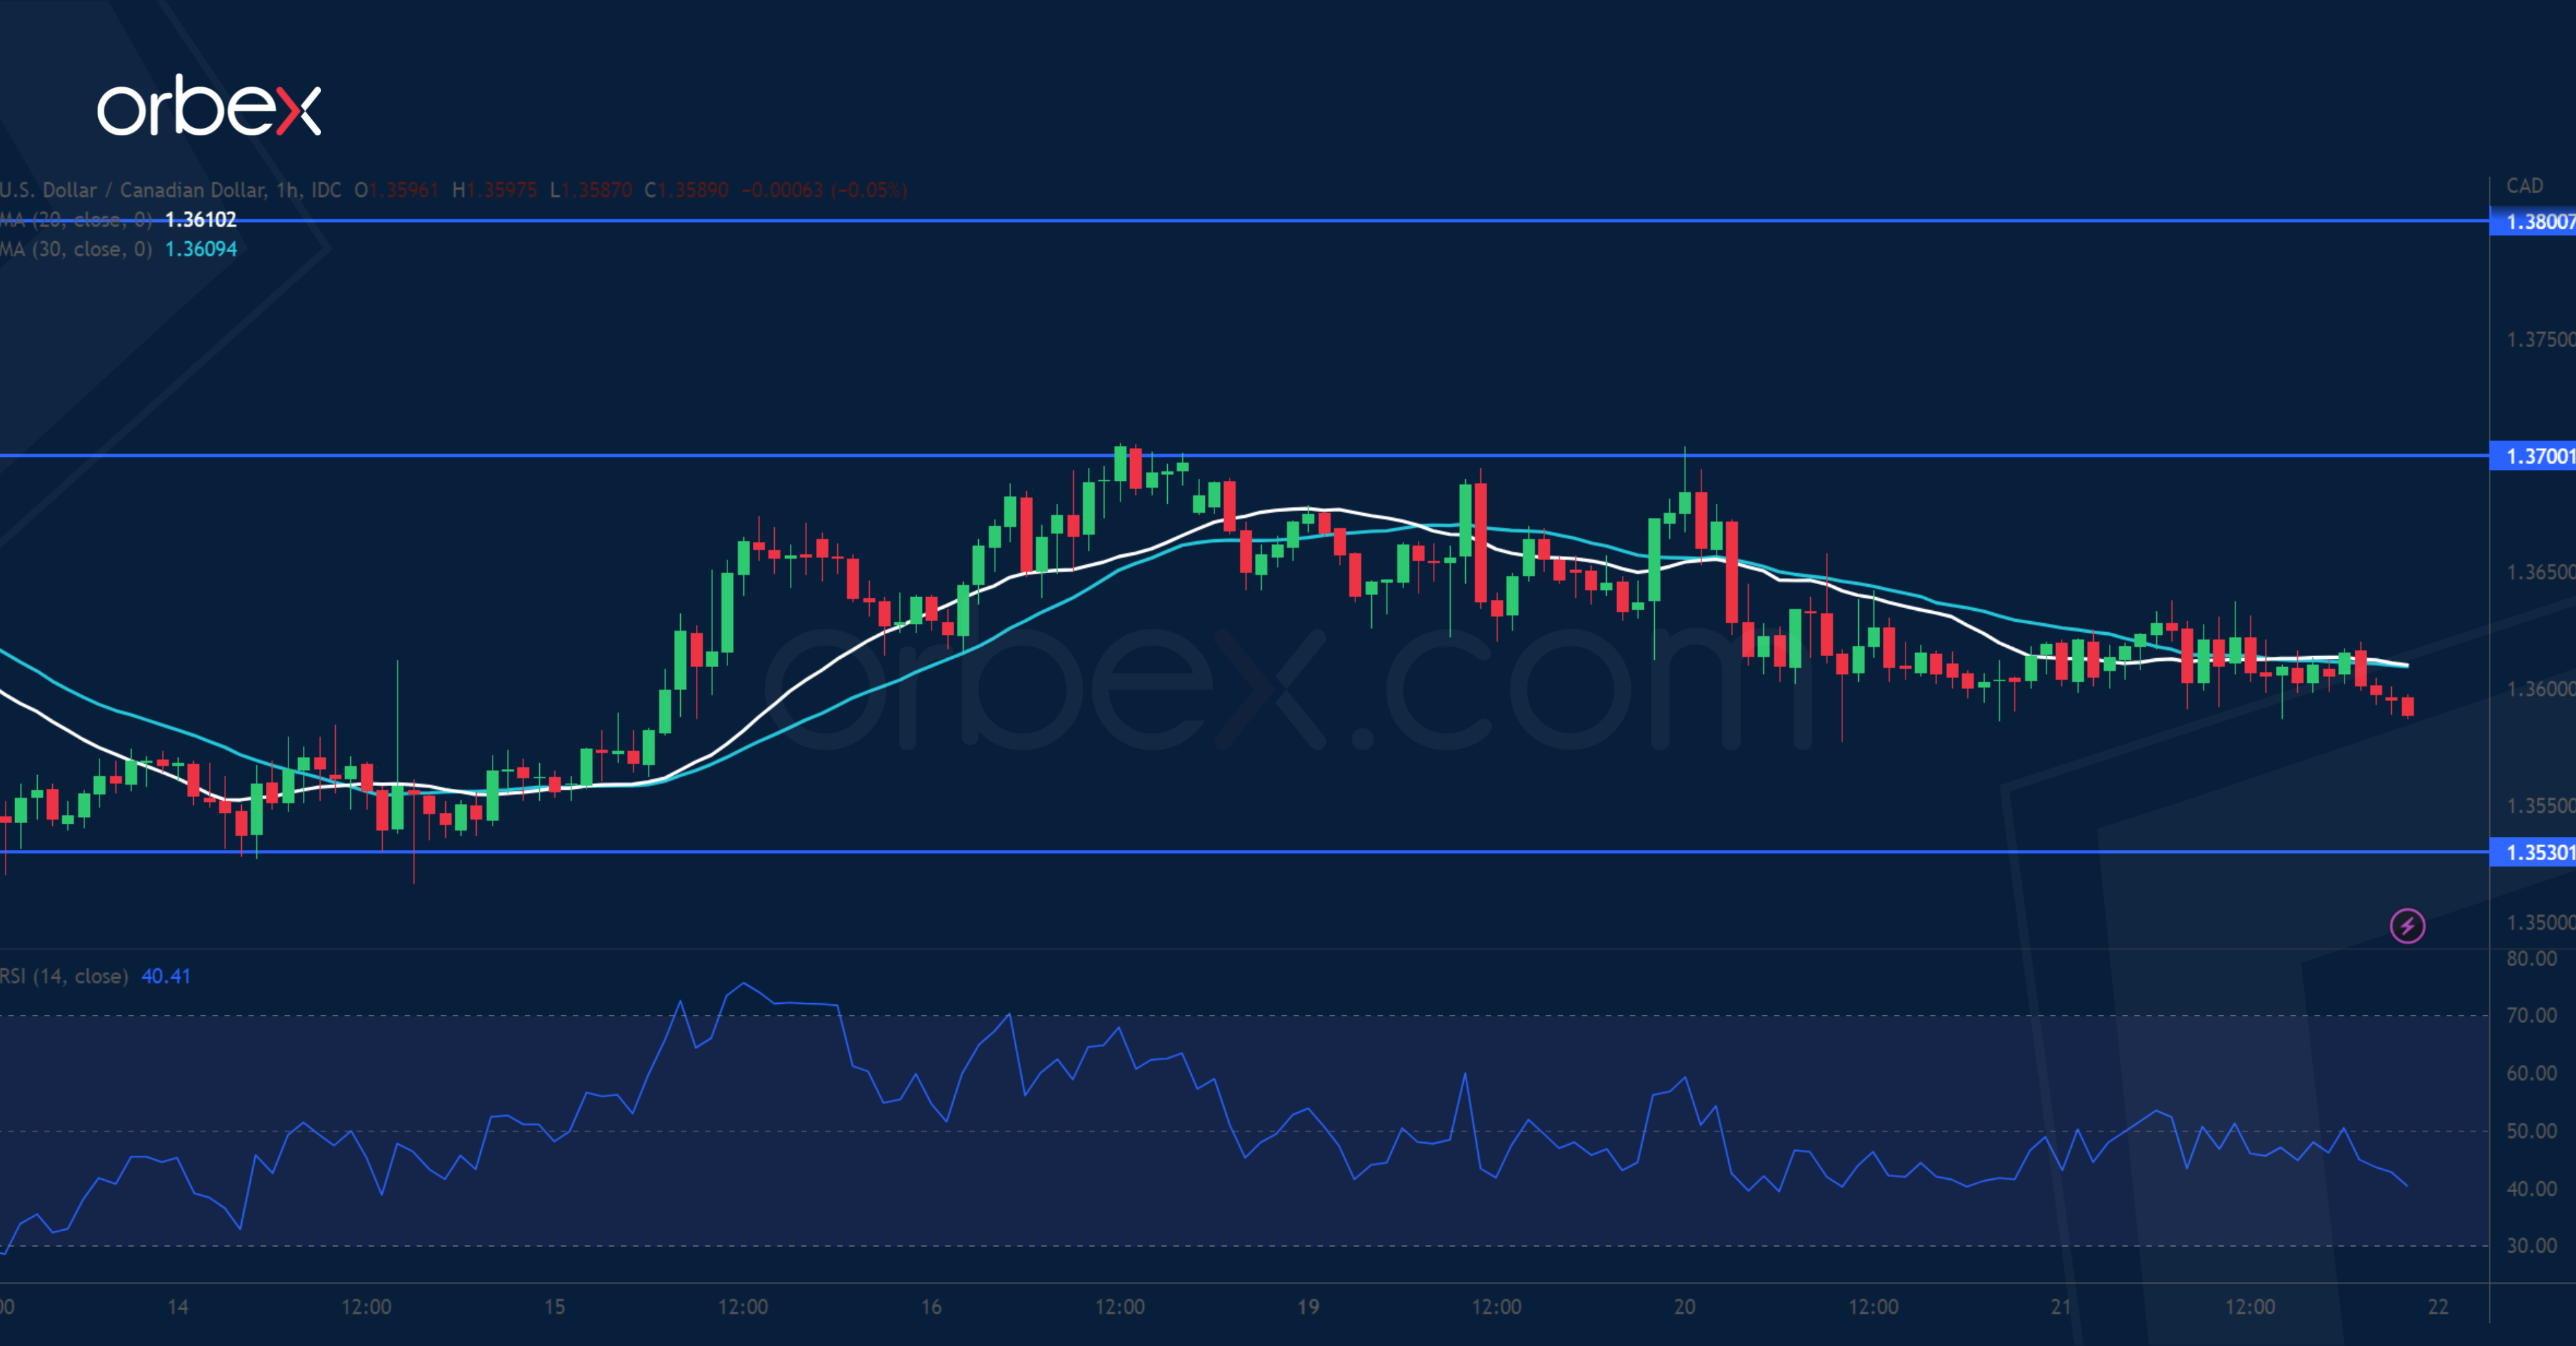
The Canadian dollar softened as November’s inflation reading showed signs of slowing down. On the daily chart, the uptrend remains intact and a bullish MA cross indicates solid support and a potential acceleration to the upside. However, the pair is still grinding the supply area around 1.3700 as the pressure builds up. A breakout would lead to a test of November’s peak at 1.3800, which would be a step closer to a bullish continuation. On the downside, 1.3530 next to the 30-day moving average is the first support.