

Sample Category Title
USD/CHF Daily Outlook
Daily Pivots: (S1) 0.9241; (P) 0.9266; (R1) 0.9292; More...
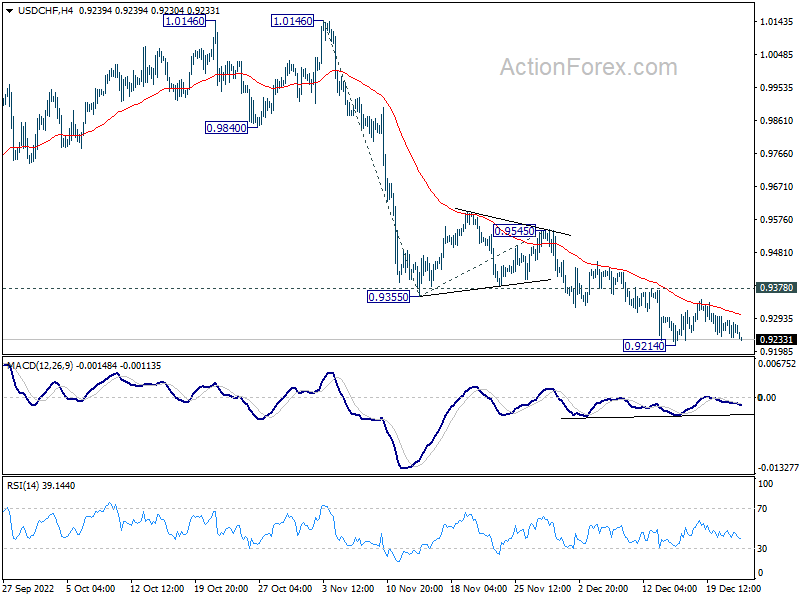
Intraday bias in USD/CHF stays neutral as sideway trading continues. Further decline is in favor with 0.9378 resistance intact. On the downside, break of 0.9214 will resume the fall and target 61.8% projection of 1.0146 to 0.9355 from 0.9545 at 0.9056. However, break of 0.9378 resistance will indicate short term bottoming and turn bias back to the upside for 0.9545 resistance instead.
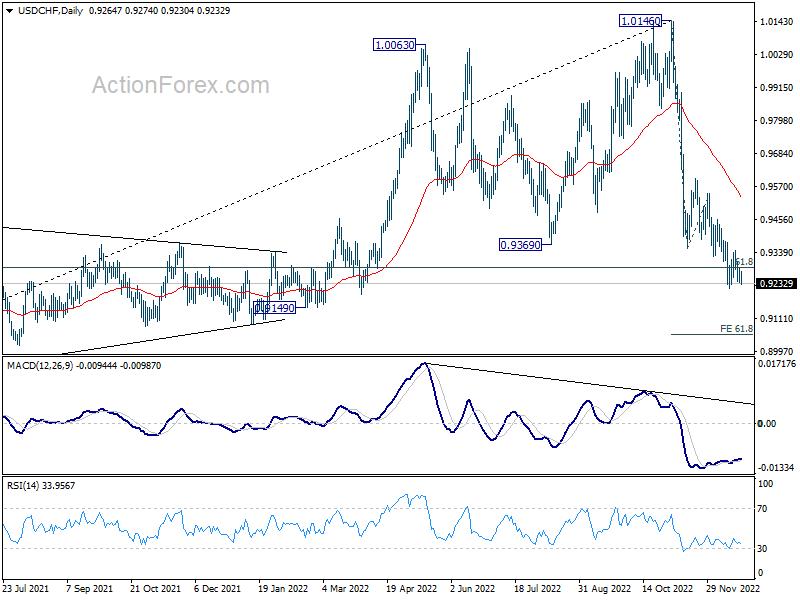
In the bigger picture, rise from 0.8756 (2021 low) has completed at 1.0146, well ahead of 1.0342 long term resistance (2016 high). Based on current downside momentum, fall from 1.0146 might be a medium term down trend itself. Sustained break of 61.8% retracement of 0.8756 to 1.0146 at 0.9287 will pave the way to 0.8756. In any case, risk will stay on the downside as long as 0.9545 resistance holds.
USD/JPY Daily Outlook
Daily Pivots: (S1) 131.81; (P) 132.17; (R1) 132.83; More...
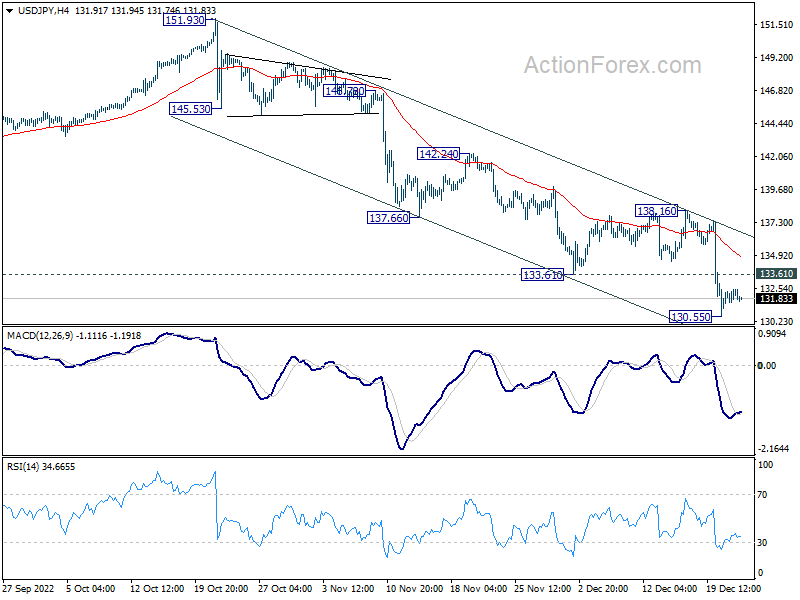
Intraday bias in USD/JPY is turned neutral with 4 hour MACD crossed above signal line. Immediate focus stays on 55 week EMA (now at 131.76). Decisive break there will pave the way to next fibonacci level at 121.43. On the upside, above 133.61 support turned resistance will turn intraday bias back to the upside for 138.16 resistance.
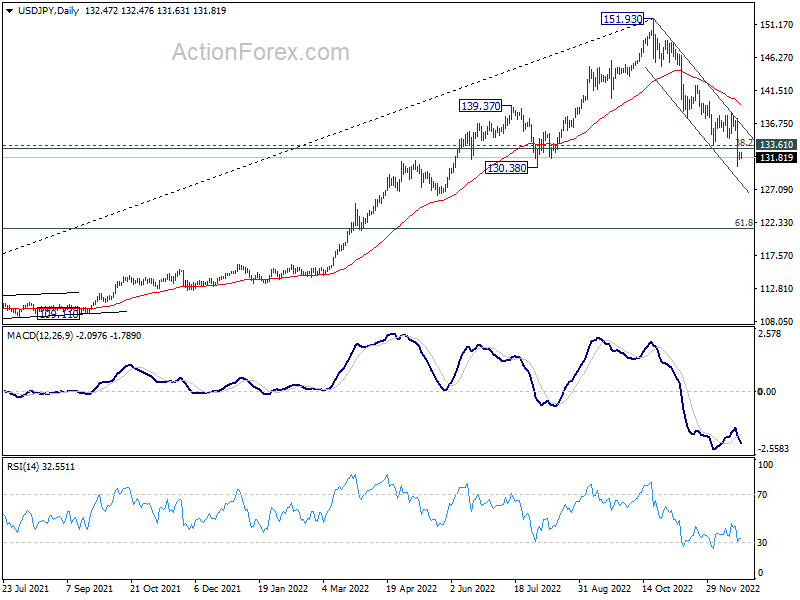
In the bigger picture, price actions from 151.93 medium term could be just a corrective pattern to up trend from 102.58 (2021 low). Strong support from 38.2% retracement of 102.58 to 151.93 at 133.07 and 55 week EMA (now at 131.76) will set the range for such corrective pattern. However, sustained break of 55 week EMA will pave the way to 61.8% retracement at 121.43.
USD/CAD Daily Outlook
Daily Pivots: (S1) 1.3589; (P) 1.3613; (R1) 1.3638; More....
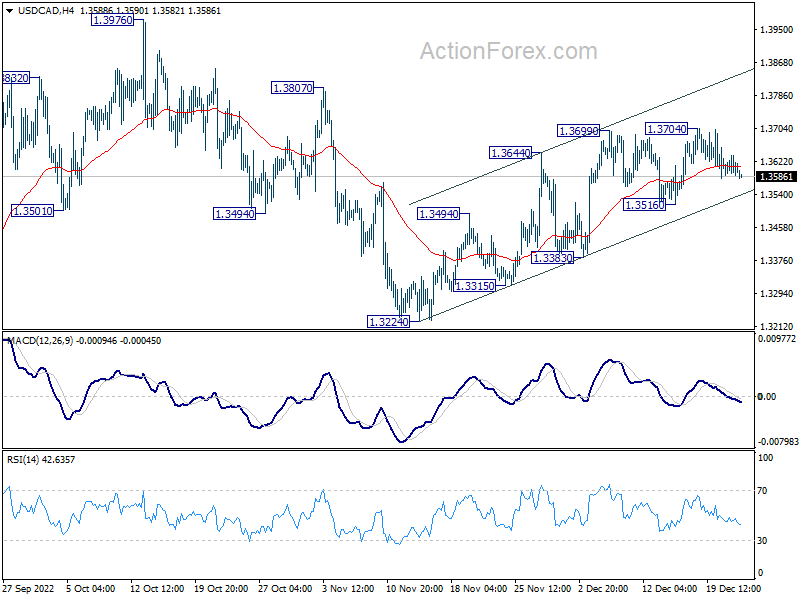
Range trading continues in USD/CAD and intraday bias remains neutral first. Further rally is still in favor as long as 1.3516 support holds. Break of 1.3704 will resume the rebound from 1.3224 to 1.3807 resistance. Break there will bring retest of 1.3976 high. On the downside, however, break of 1.3516 support will suggest that the rebound has completed, and turn bias back to the downside.
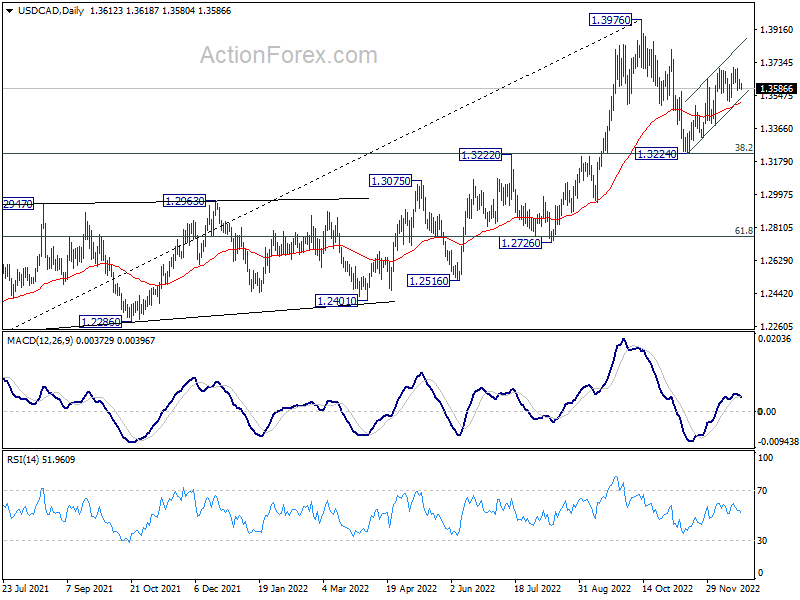
In the bigger picture, as long as 1.3222 cluster support (38.2% retracement of 1.2005 to 1.3976 at 1.3223) holds, larger up trend from 1.2005 (2021 low) is still expected to resume through 1.3976 high at a later stage. However, firm break of 1.3222/3 will indicate that the trend might have reversed. Deeper fall would be seen to next cluster support at 1.2726 (61.8% retracement at 1.2758).
AUD/USD Daily Report
Daily Pivots: (S1) 0.6667; (P) 0.6697; (R1) 0.6738; More...
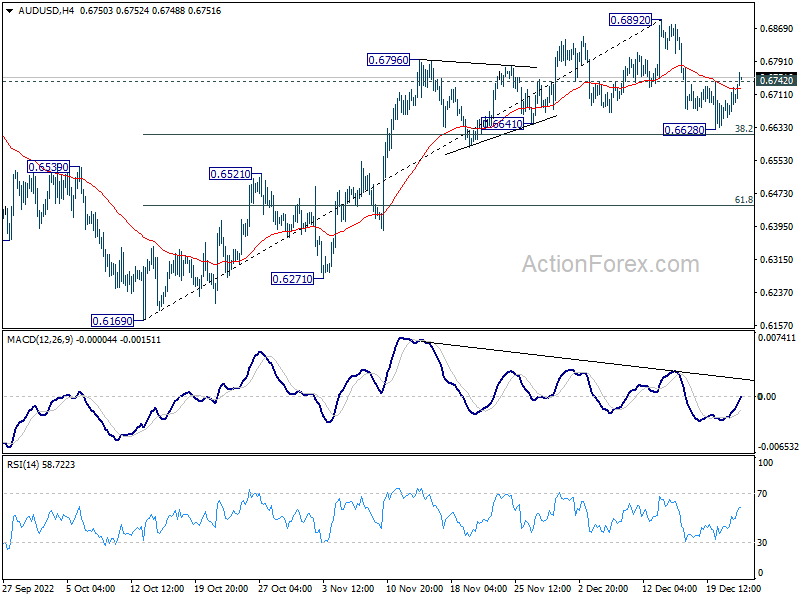
AUD/USD's break of 0.6742 minor resistance suggests that pull back from 0.6892 has completed at 0.6628 already, ahead of 38.2% retracement of 0.6169 to 0.6892 at 0.6616. Intraday bias is back on the upside for retesting 0.6892. Firm break there will resume larger rise from 0.6169. On the downside, though, sustained break of 0.6616 will indicate rejection by 0.66871 fibonacci level and bring deeper decline.
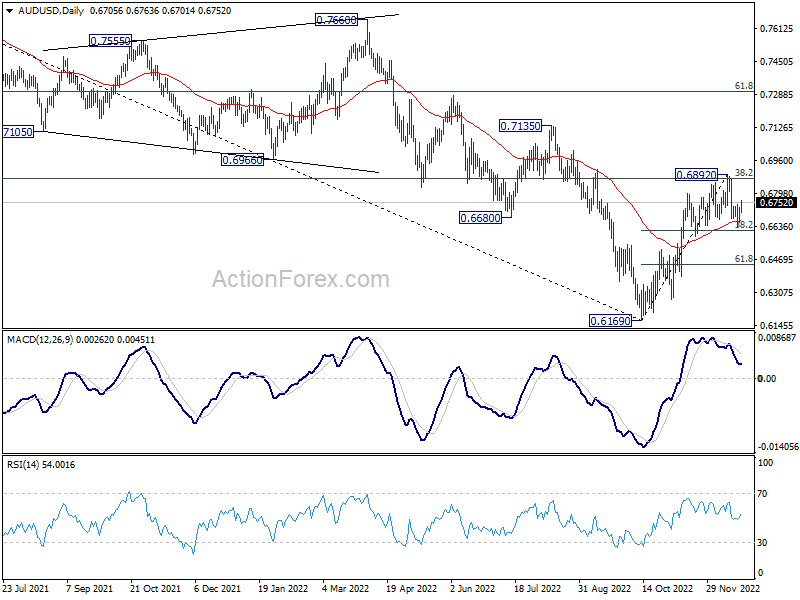
In the bigger picture, it's still unsure if price actions from 0.6169 medium term bottom are developing into a corrective pattern or trend reversal. Rejection by 38.2% retracement of 0.8006 to 0.6169 at 0.6871 will maintain medium term bearishness for another fall through 0.6169 at a later stage. However, firm break of 0.6871, and sustained trading above 55 week EMA (now at 0.6900) will raise the chance of the start of a bullish up trend.
Aussie Turning Up on Positive Sentiment, Dollar Struggles
Australian Dollar rebounds broadly today, as risk-on sentiment continues in Asian session. For now, Yen is still supported solidly by BoJ's action earlier in the week, even though 10-year JGB yield dips back towards 0.4% level. However, Dollar and Swiss Franc are turning softer together with Loonie. Meanwhile, Euro and Sterling are mixed, awaiting the trigger for the next move.
Technically, EUR/GBP is extending the rebound from 0.8545 even though upside momentum is unconvincing. Near term focus will be on reaction to 0.8827 resistance. Rejection by this resistance will retain near term bearishness in the cross, for breaking through 0.8545 support at a later stage. However, firm break there will argue that whole decline from 0.9267 has completed and turn near term outlook bearish. It's a development to watch before the end of the year.
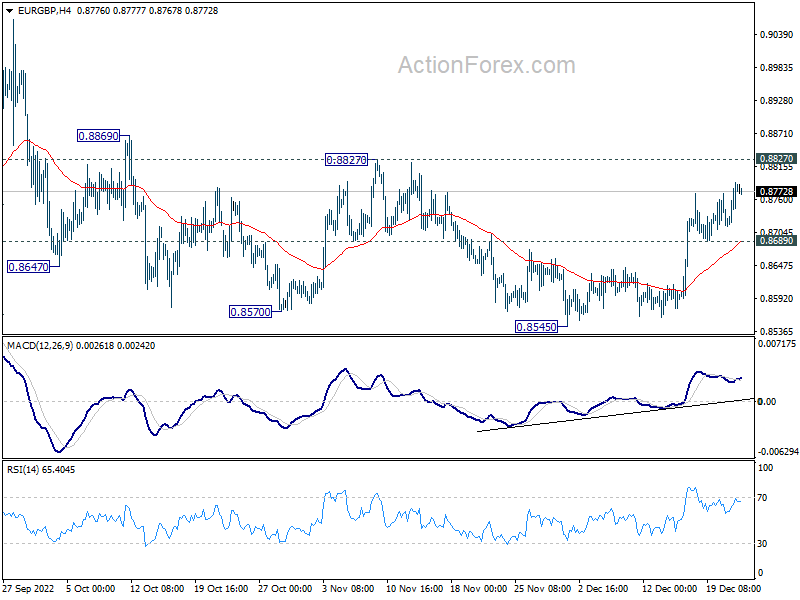
In Asia, at the time of writing, Nikkei is up 0.50%. Hong Kong HSI is up 2.44%. China Shanghai SSE is up 0.05%. Singapore Strait Times is up 0.49%. Japan 10-year JGB yield is down -0.074 at 0.404. Overnight, DOW rose 1.60%. S&P 500 rose 1.49%. NASDAQ rose 1.54%. 10-year yield closed flat at 3.684.
WTI oil extends rebound, but down trend still intact
Oil prices extended the near term rebound this week as winter storm hit the US. Heating demand would be boosted by the arctic blast, offsetting the curbed travel plans. Also, as reported yesterday, US oil inventories unexpected dropped -5.9m barrels in the week ending December 16.
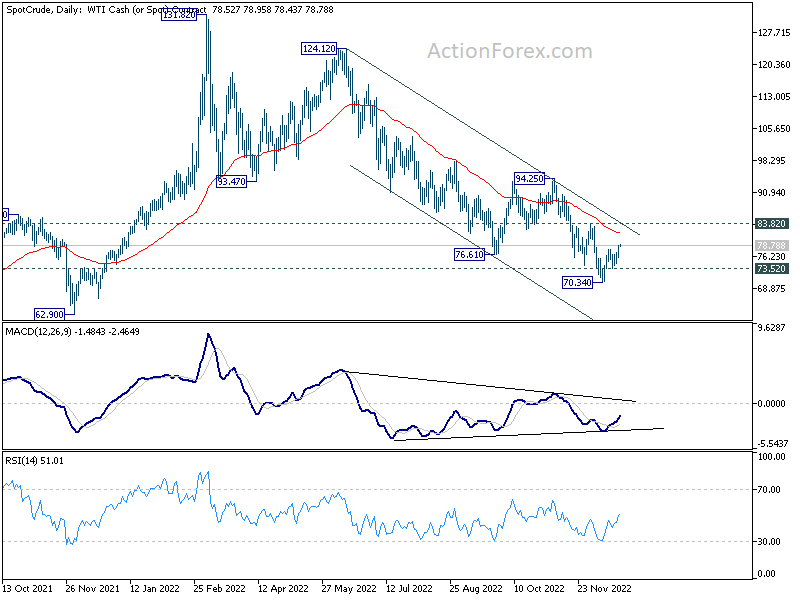
WTI is extending the rebound from 70.34 short term bottom and hit as high as 78.95 so far. While further rise cannot be ruled out, it's too early to confirm the end of the medium term down trend, not to mention a reversal. There level layers of resistance ahead at 55 day EMA (now at 82.03), 83.82 resistance and then trend line resistance at 85.07.
Another decline will remain in favor for now, at a later stage. Break of 73.52 minor support will likely send WTI through 70.34 low.
AUD/NZD extending corrective rebound
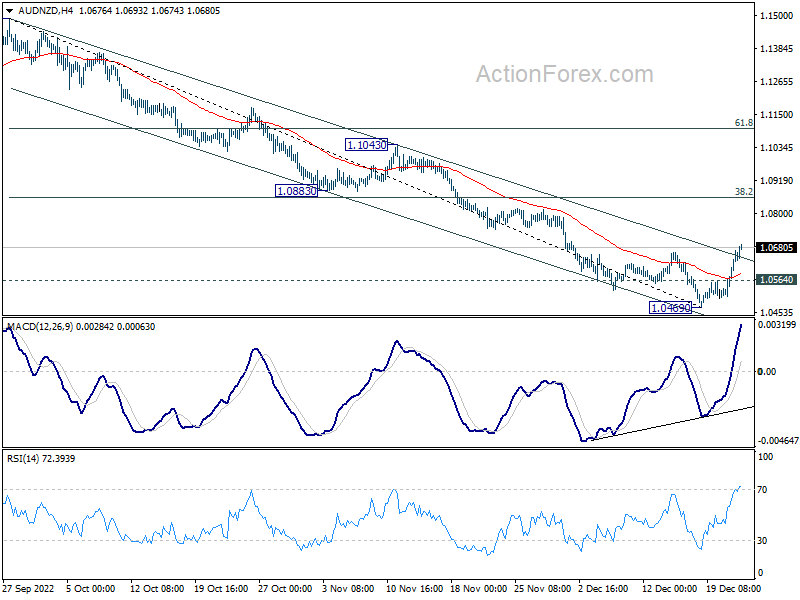
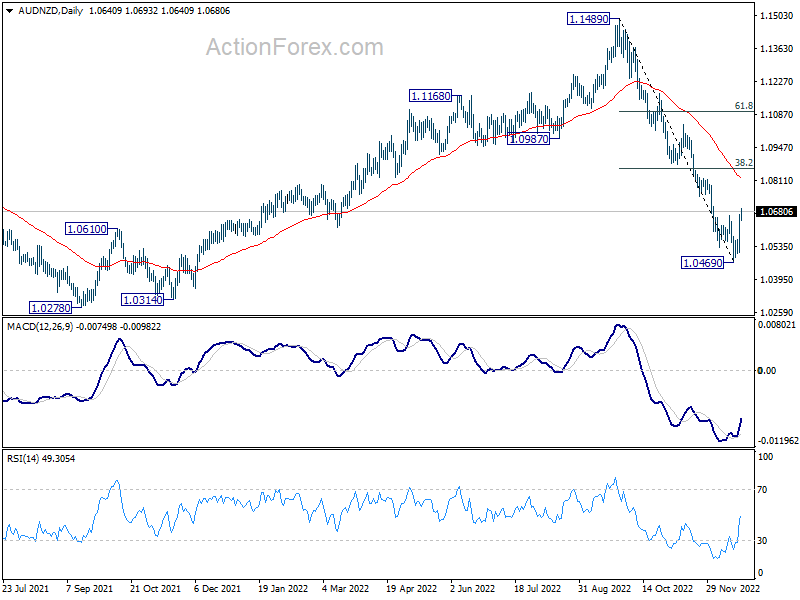
As risk-on sentiment carried forward to Asian sessions, Aussie is benefiting much more than Kiwi for now. AUD/NZD is extending the rebound from 1.0469 and hit as high as 1.0640 so far.
A short term bottom should be confirmed at 1.0469 with break of the near term channel resistance, on bullish convergence condition in hour MACD. Yet, the rebound should be more of a result of deeply oversold condition, as seen in daily RSI. It's too early to call for a trend reversal.
While further rise is now mildly in favor, upside should be capped by 55 day EMA (now at 1.0826). Indeed, break of 1.0564 minor support will suggest that the decline from 1.1498 is ready to resume through 1.0469.
Looking ahead
UK Q3 GDP final and current account will be released in European session. Later in the day, US will release jobless claims and Q3 GDP final too.
AUD/USD Daily Report
Daily Pivots: (S1) 0.6667; (P) 0.6697; (R1) 0.6738; More...
AUD/USD's break of 0.6742 minor resistance suggests that pull back from 0.6892 has completed at 0.6628 already, ahead of 38.2% retracement of 0.6169 to 0.6892 at 0.6616. Intraday bias is back on the upside for retesting 0.6892. Firm break there will resume larger rise from 0.6169. On the downside, though, sustained break of 0.6616 will indicate rejection by 0.66871 fibonacci level and bring deeper decline.
In the bigger picture, it's still unsure if price actions from 0.6169 medium term bottom are developing into a corrective pattern or trend reversal. Rejection by 38.2% retracement of 0.8006 to 0.6169 at 0.6871 will maintain medium term bearishness for another fall through 0.6169 at a later stage. However, firm break of 0.6871, and sustained trading above 55 week EMA (now at 0.6900) will raise the chance of the start of a bullish up trend.
Economic Indicators Update
| GMT | Ccy | Events | Actual | Forecast | Previous | Revised |
|---|---|---|---|---|---|---|
| 07:00 | GBP | Current Account (GBP) Q3 | -20.0B | -33.8B | ||
| 07:00 | GBP | GDP Q/Q Q3 F | -0.20% | -0.20% | ||
| 13:30 | USD | Initial Jobless Claims (Dec 16) | 220K | 211K | ||
| 13:30 | USD | GDP Annualized Q3 F | 2.90% | 2.90% | ||
| 13:30 | USD | GDP Price Index Q3 F | 4.30% | 4.30% | ||
| 15:30 | USD | Natural Gas Storage | -50B |
Technical Outlook and Review
USD/JPY:
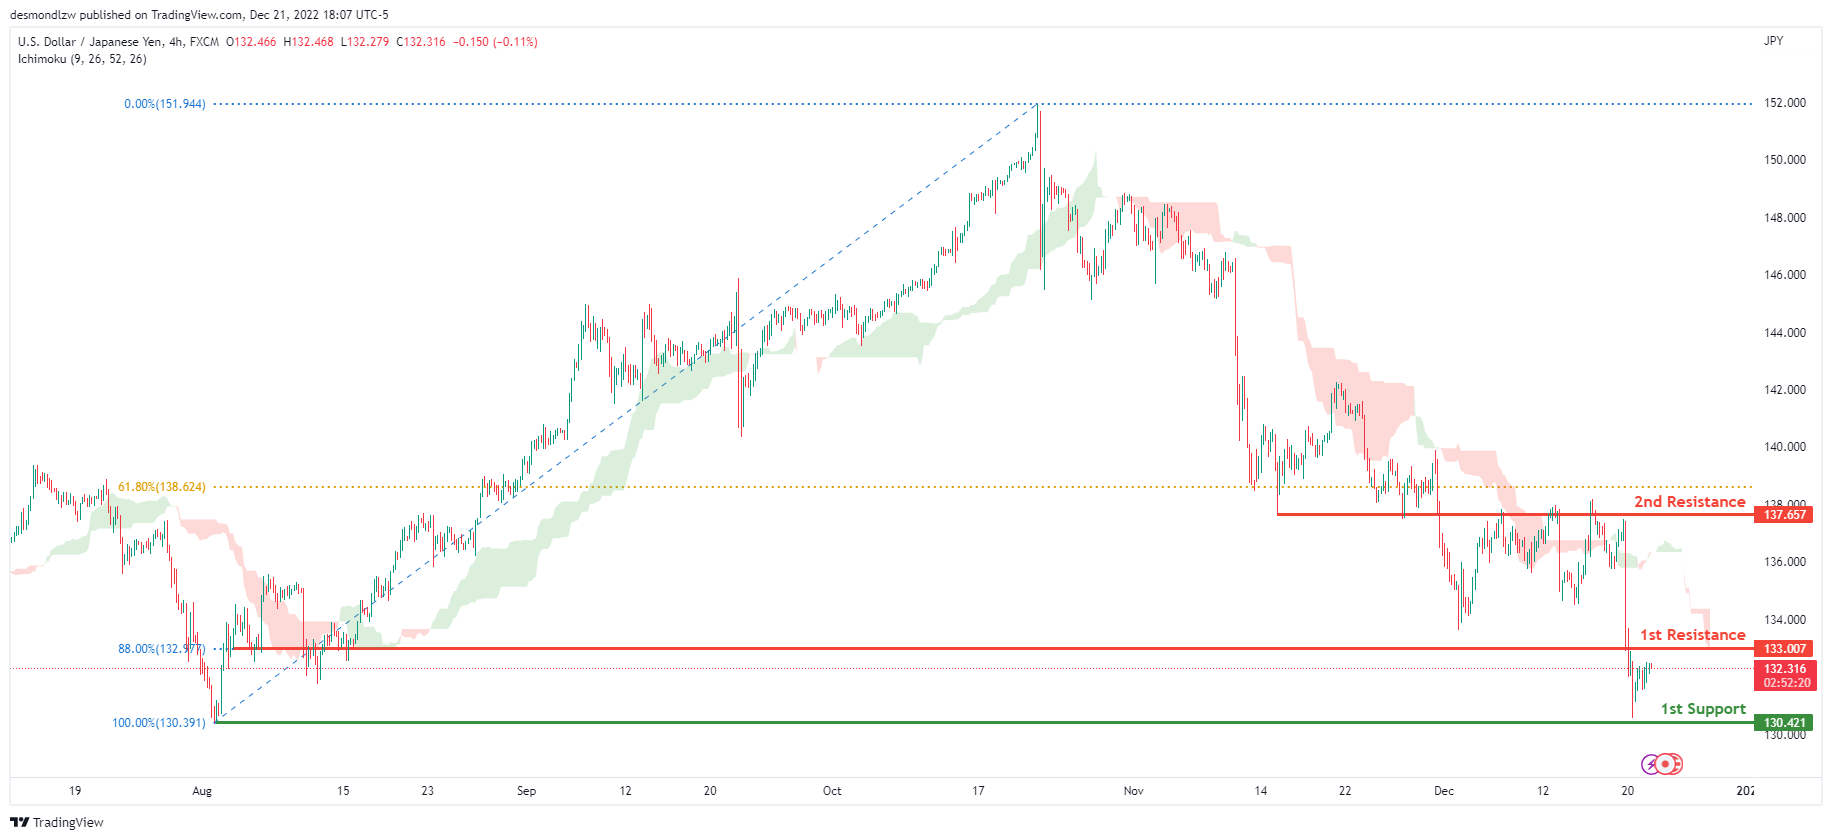
Looking at the H4 chart, my overall bias for USDJPY is bearish due to the current price being below the Ichimoku cloud, indicating a bearish market. If this bearish momentum continues, expect price to possibly head towards the 1st support at 130.421, where the previous swing low is located. In an alternate scenario, price could possibly head back up towards the 1st resistance level at 133.007 where the 88% Fibonacci line is.
Areas of consideration:
- H4 time frame, 1st resistance at 137.657
- H4 time frame, 2nd resistance at 140.356
- H4 time frame, 1st support at 133.007
DXY:
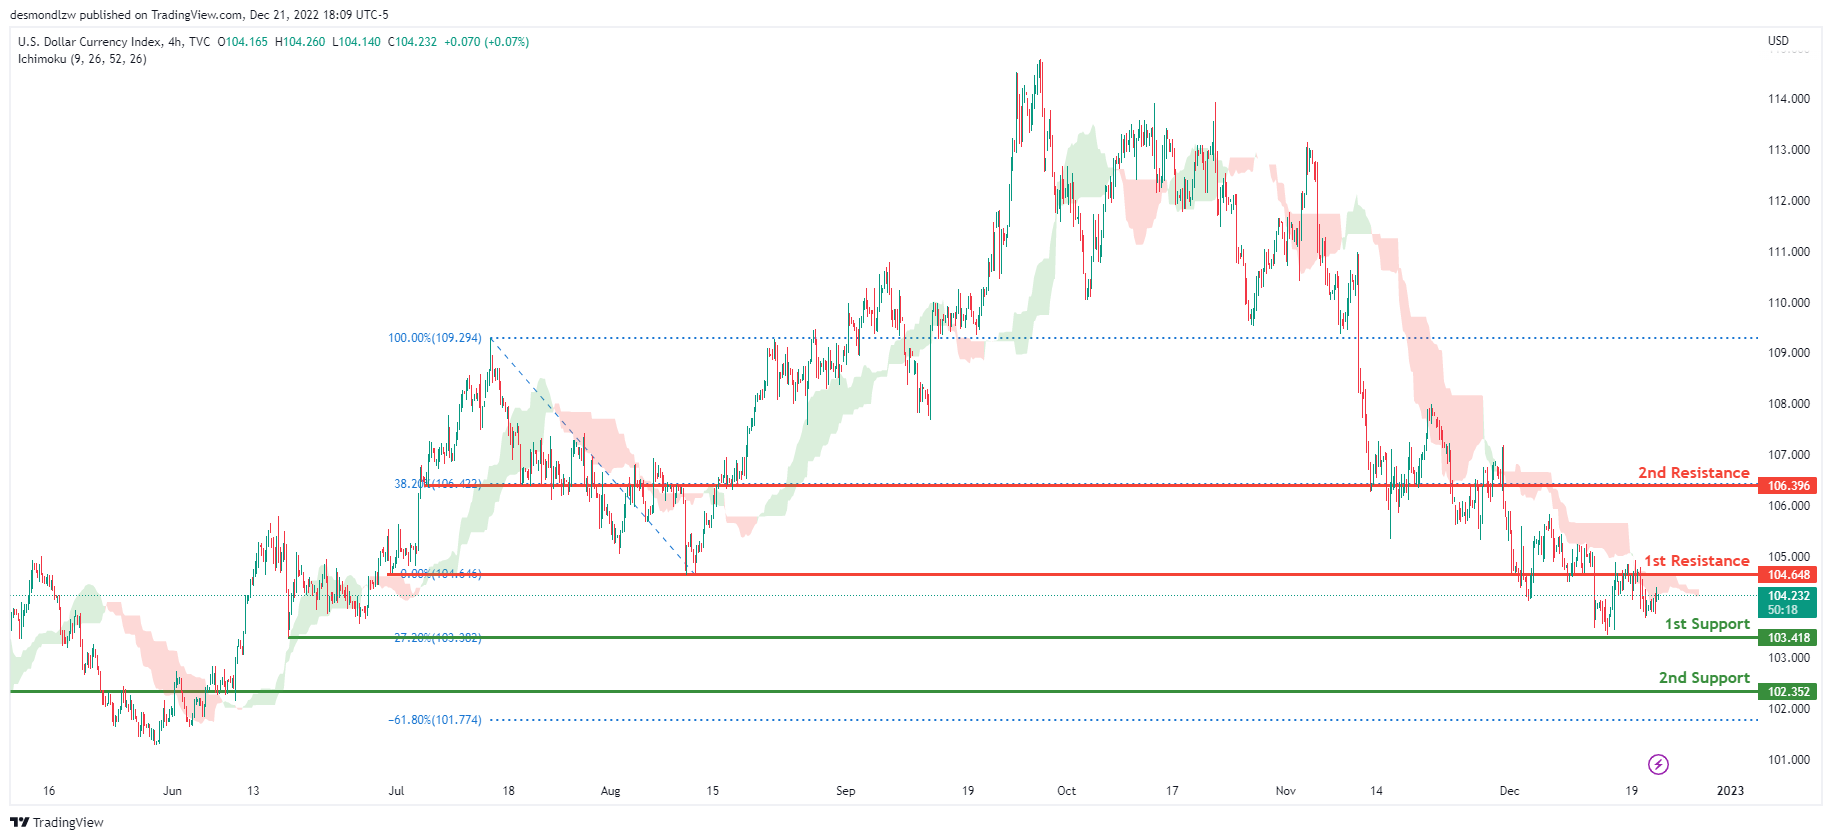
On the H4 chart, the overall bias for DXY is bearish. To add confluence to this, the price is below the Ichimoku cloud which indicates a bearish market. If this bearish momentum continues, expect the price to possibly break the 1st support line at 103.418, where the -27.2% Fibonacci expansion line is before heading towards the 2nd support at 102.352, where the -61.8% Fibonacci expansion line is. In an alternative scenario, price could head back up and break the 1st resistance line resistance at 104.648, where the previous swing low is before heading towards the 2nd resistance at 106.396, where the 38.2% Fibonacci line is.
Areas of consideration:
- H4 time frame, 1st resistance at 104.648
- H4 time frame, 1st support at 103.418
- H4 time frame, 2nd support at 102.352
EUR/USD:
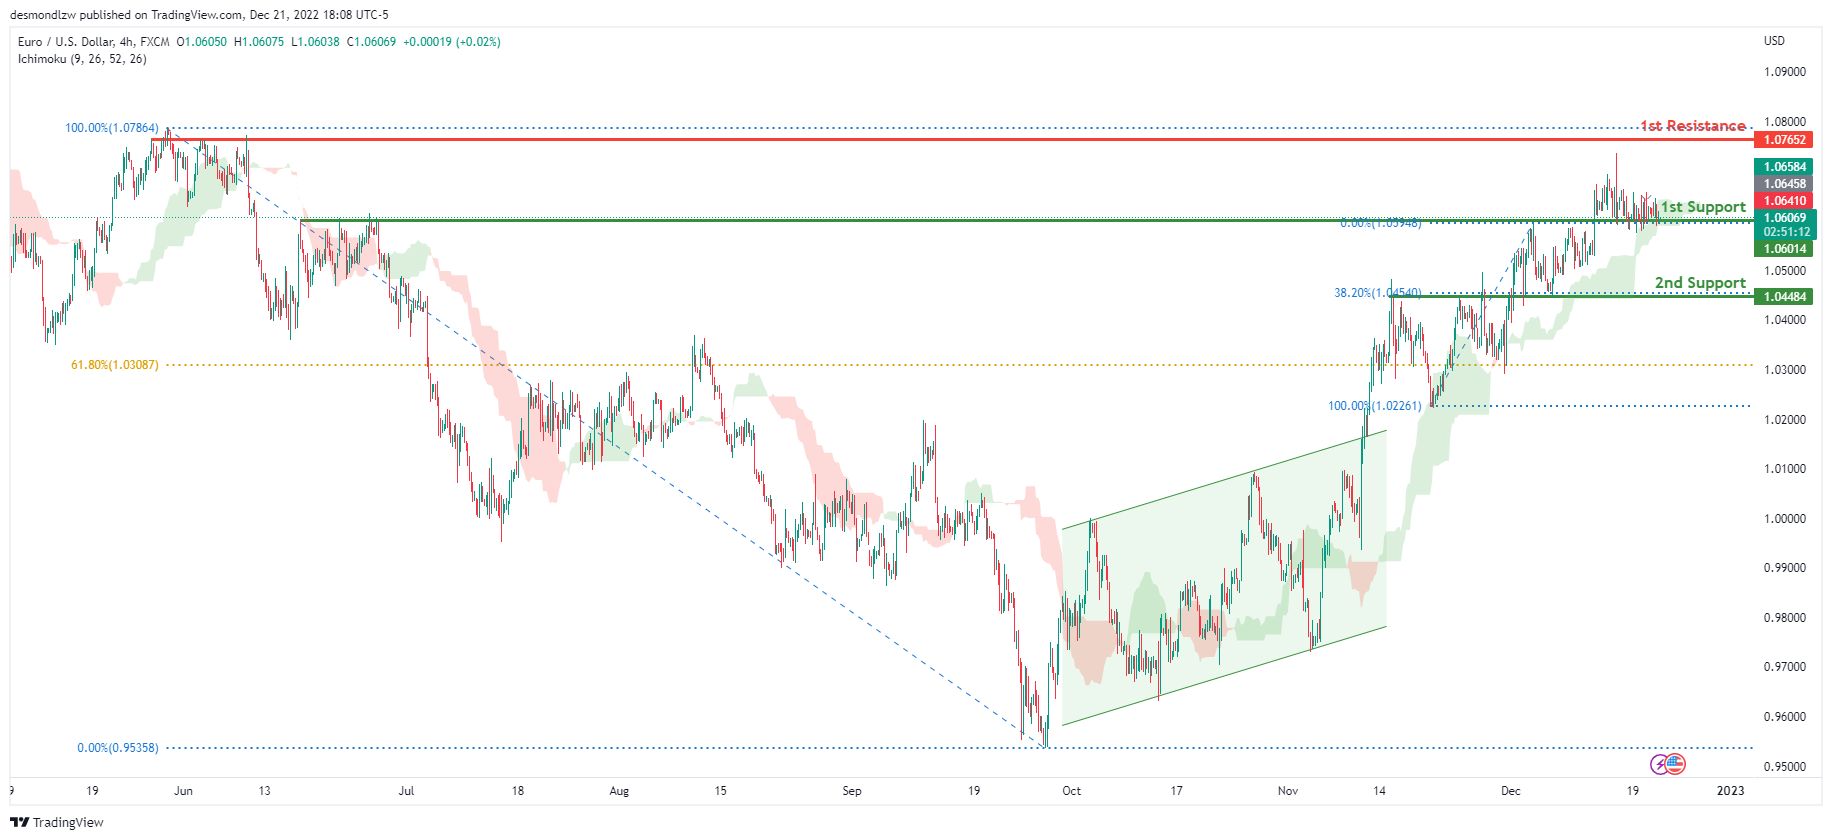
Looking at the H4 chart, my overall bias for EURUSD is bullish due to the current price being above the Ichimoku cloud, indicating a bullish market. To add confluence to this bias, price has also broken above the ascending bullish channel. If this bullish momentum continues, expect the price to possibly head towards the 1st resistance at 1.07652, where the previous swing high is. In an alternate scenario, price could possibly head back down to break the 1st support level at 1.06014, where the previous swing high and 78.6% Fibonacci line are located before heading towards the 2nd support at 1.04484, where the 38.2% Fibonacci line is.
Areas of consideration :
- H4 1st resistance at 1.07652
- H4 1st support at 1.06014
- H4 2nd support at 1.04484
GBP/USD:
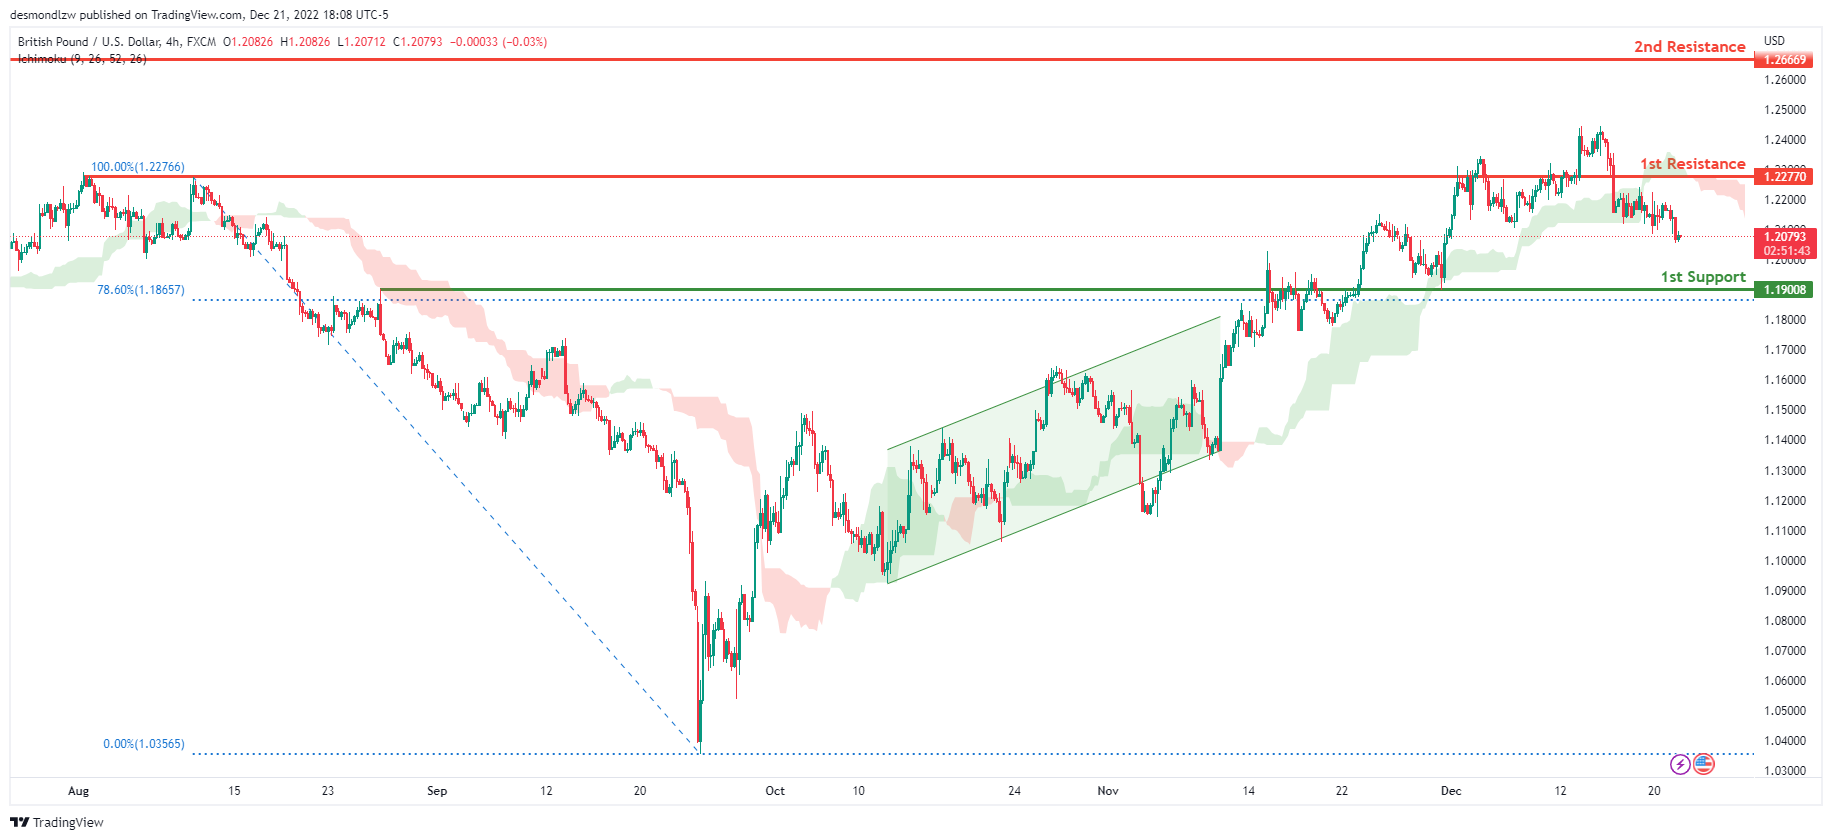
Looking at the H4 chart, my overall bias for GBPUSD is bearish due to the current price being below the Ichimoku cloud, indicating a bearish market. If this bearish momentum continues, expect price to possibly head towards the 1st support at 1.19008, where the 78.6% Fibonacci line is. In an alternate scenario, price could possibly head back up to retest the 1st resistance level at 1.22770, where the previous swing high is.
Areas of consideration:
- H4 1st resistance at 1.22770
- H4 1st support at 1.19008
USD/CHF:
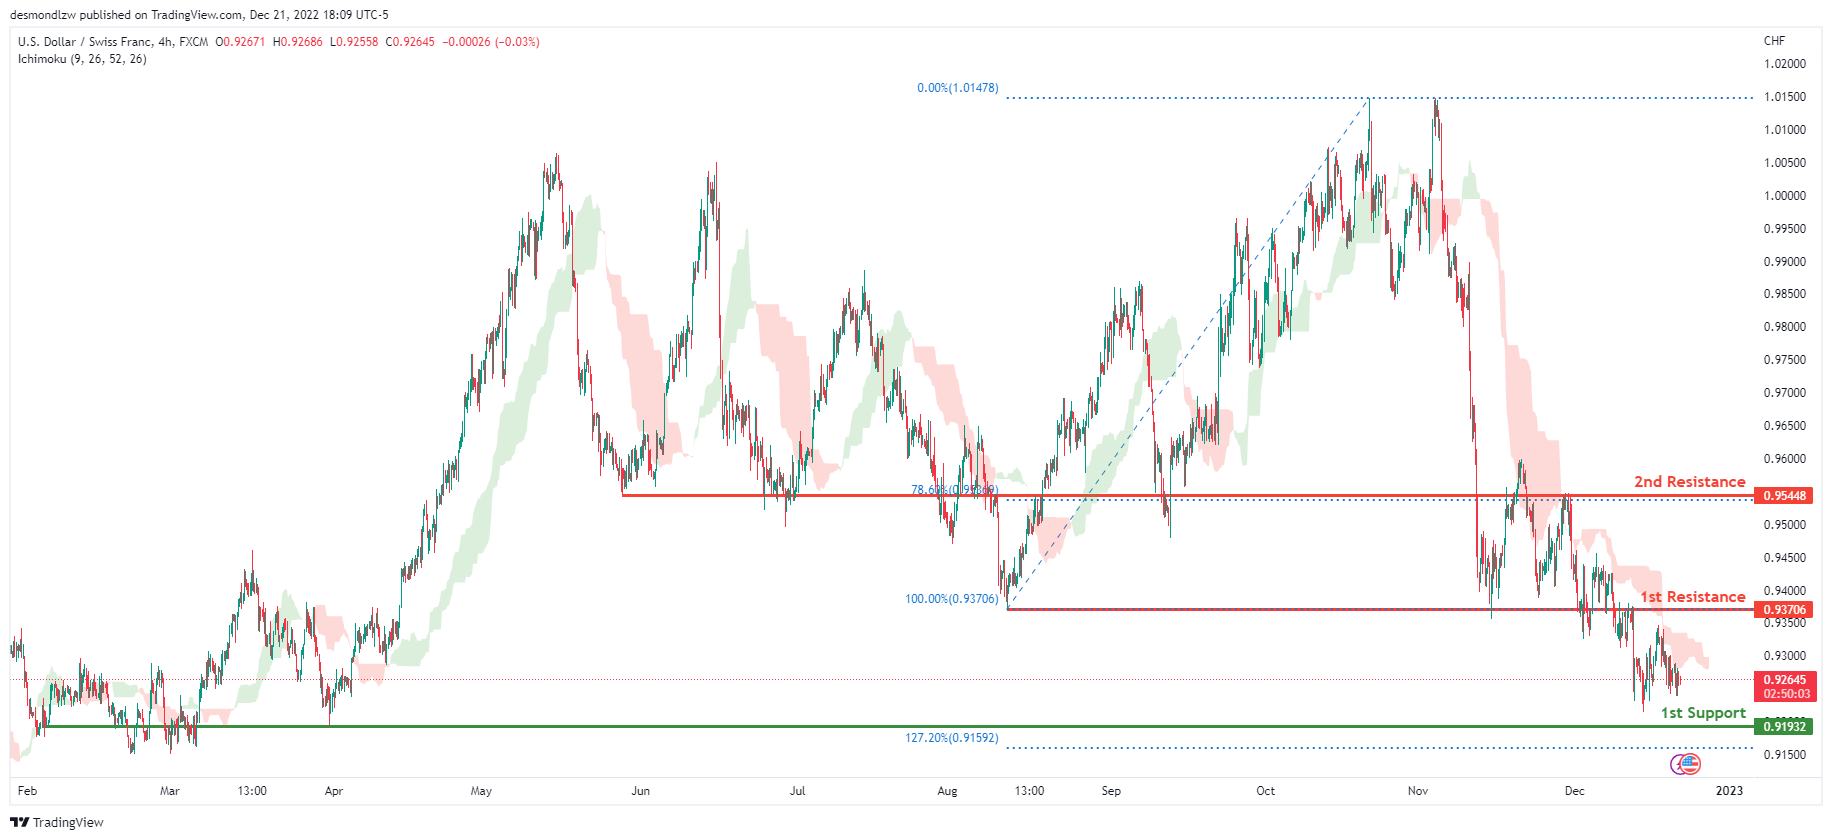
The overall bias for USDCHF on the H4 chart is bearish. In addition, the price is below the Ichimoku cloud, indicating a bearish market. If the current bearish trend continues, expect the price to head back down towards the 1st support line at 0.91932, where the previous swing low and 12.72% Fibonacci extension line is . In an alternative scenario, price could possibly head up towards the 1st resistance at 0.93706, where the previous swing low is .
Areas of consideration
- H4 1st support at 0.91932
- H4 1st resistance at 0.93706
XAU/USD (GOLD):
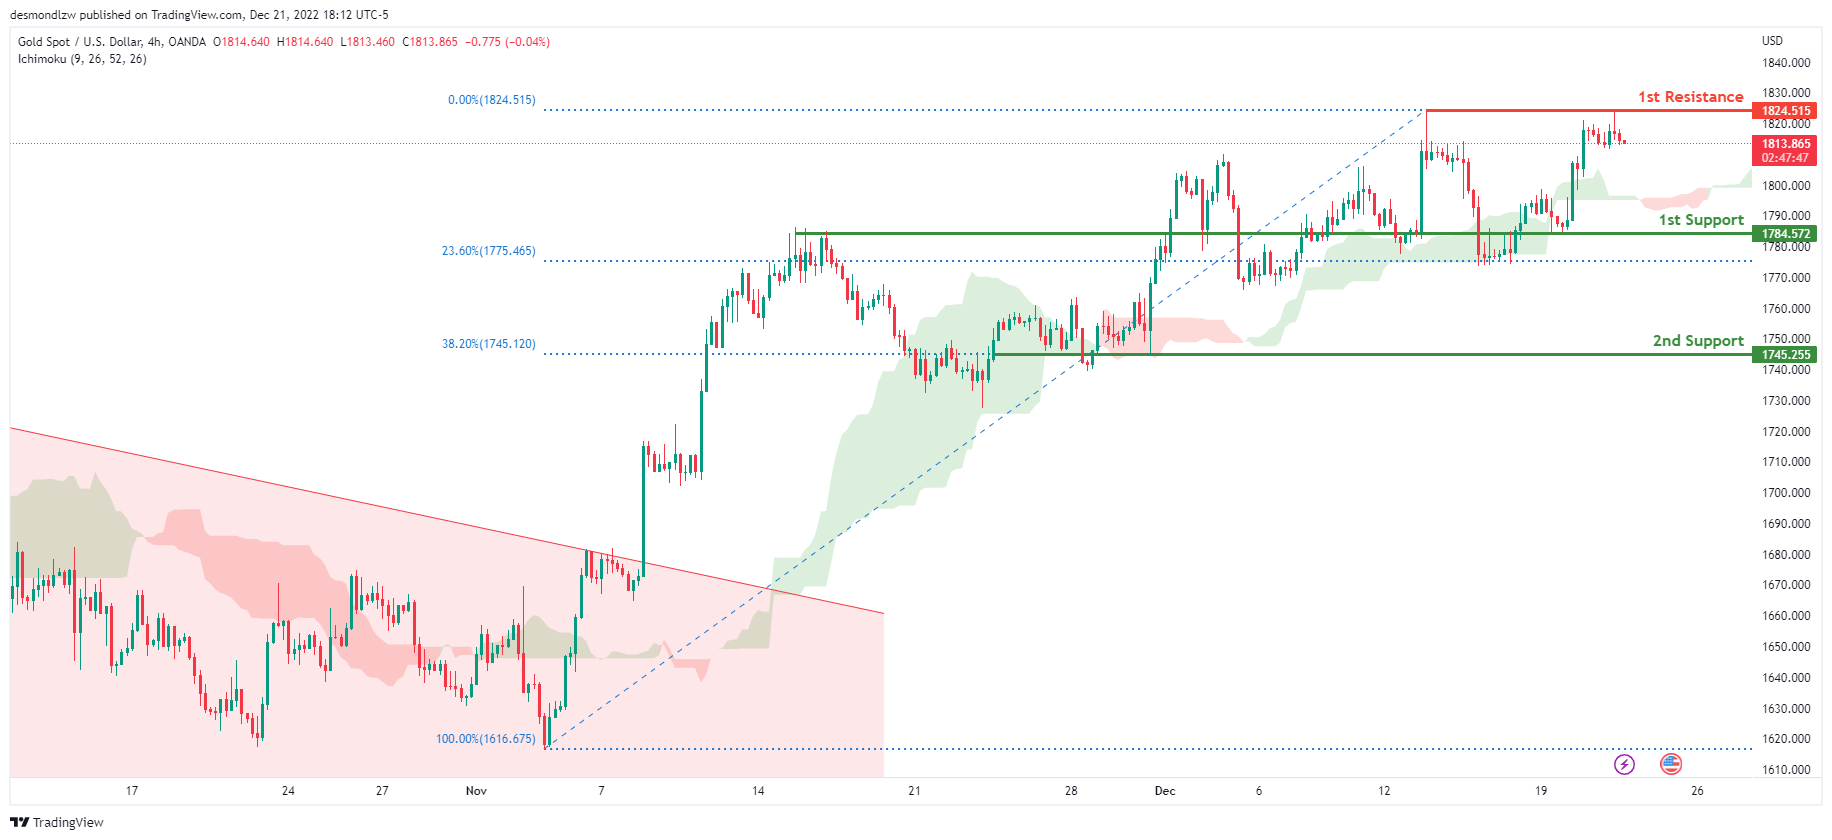
Looking at the H4 chart, my overall bias for XAUUSD is bullish due to the current price being above the Ichimoku cloud, indicating a bullish market. If this bullish momentum continues, expect the price to continue heading towards the 1st resistance at 1824.515 where the recent high is. In an alternative scenario, price could possibly head back down to break the 1st support at 1784.572, where the previous high is before heading towards the 2nd support at 1745.255, where the 38.2% Fibonacci line is.
Areas of consideration:
- H4 time frame, 1st resistance at 1824.515
- H4 time frame, 1st support at 1784.572
- H4 time frame, 2nd support at 1745.255
AUD/USD:
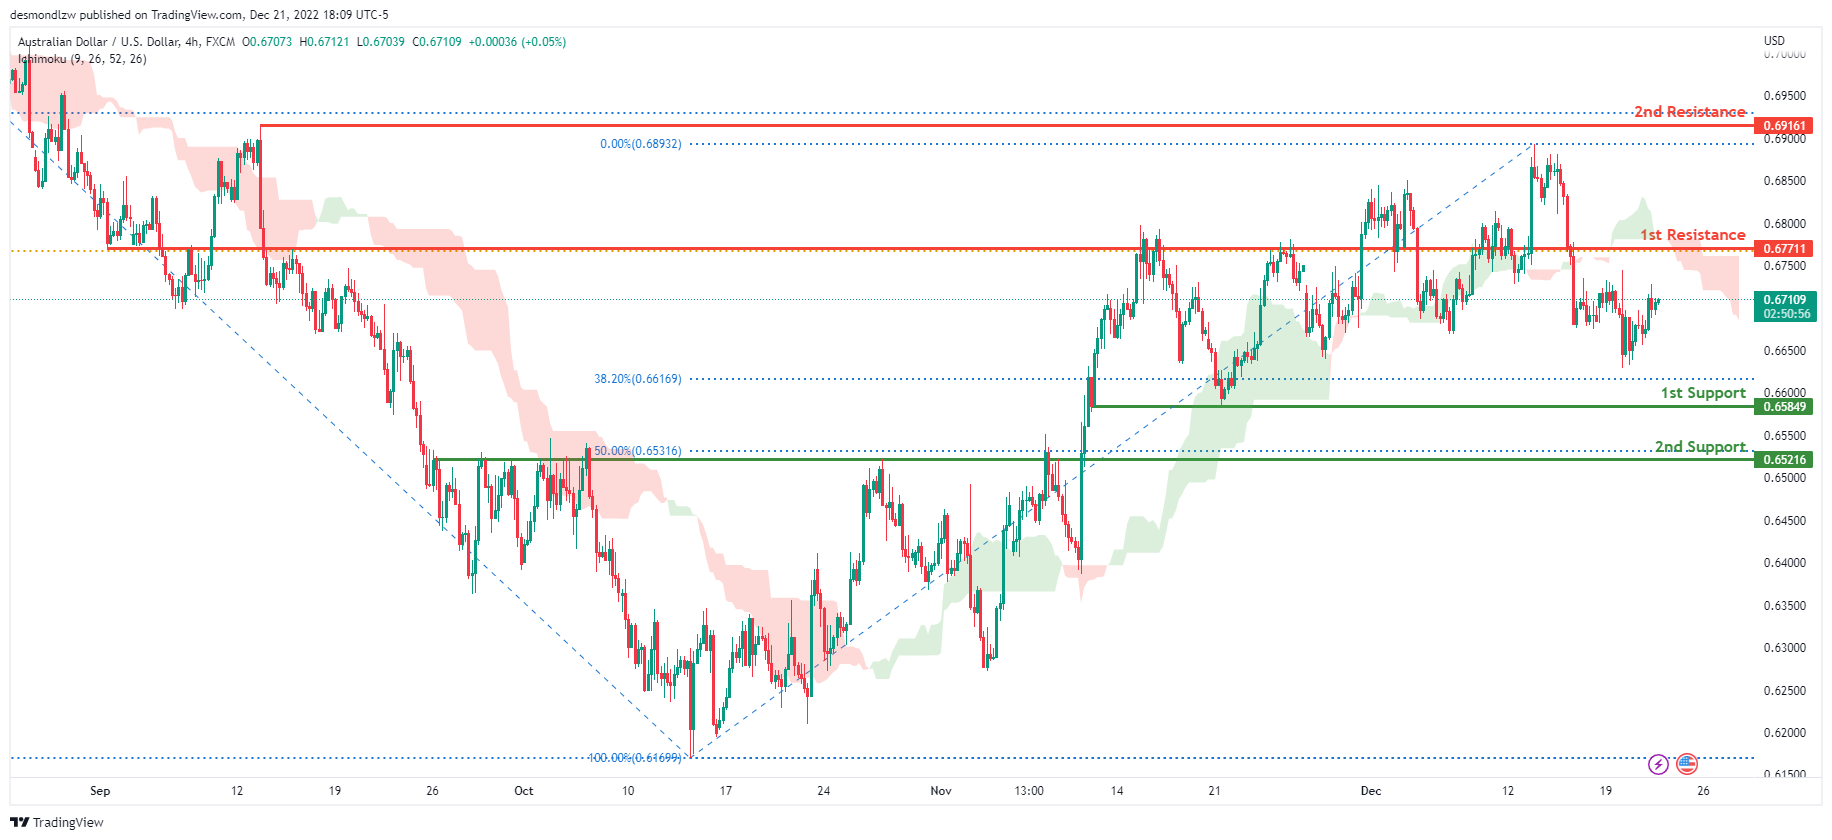
Looking at the H4 chart, my overall bias for AUDUSD is bearish due to the current price being below the Ichimoku cloud, indicating a bearish market. If this bearish momentum continues, expect the price to continue heading towards the 1st support at 0.65849, where the 78.6% Fibonacci line is. In an alternative scenario, price could possibly head back up towards the 1st resistance at 0.67711, where the 61.8% Fibonacci line is
Areas of consideration
- H4, 1st resistance at 0.67711
- H4, 1st support at 0.65849
NZD/USD:
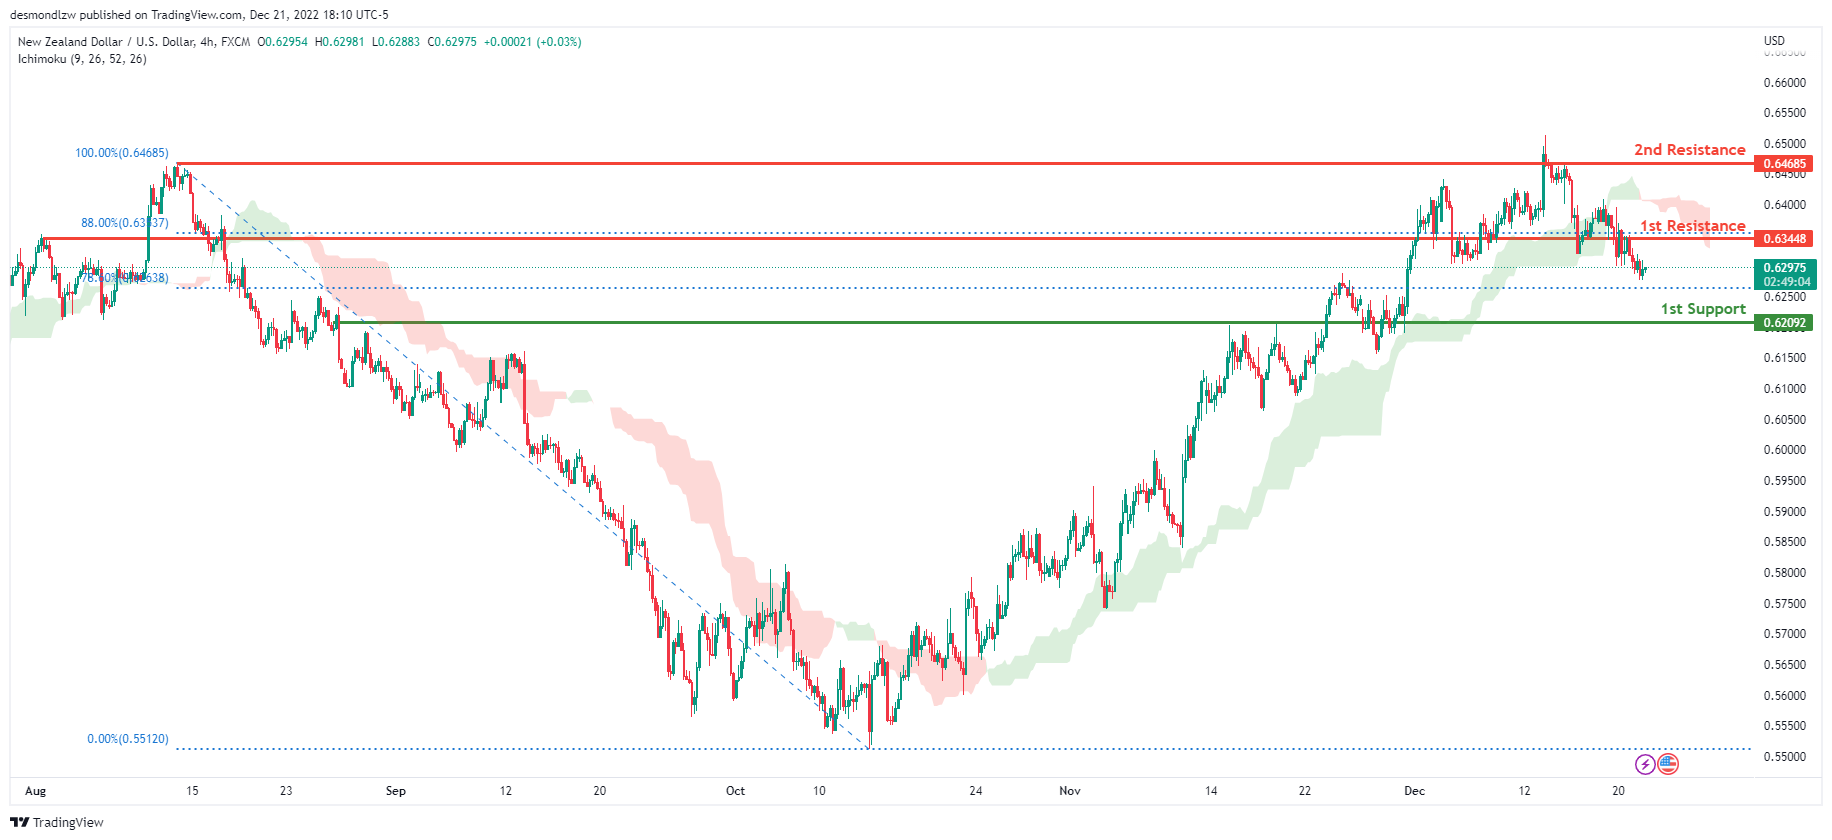
Looking at the H4 chart, my overall bias for NZDUSD is bearish due to the current price being below the Ichimoku cloud, indicating a bearish market. If this bearish momentum continues, expect price to possibly head towards the 1st support at 0.62092, where the 78.6% Fibonacci line is. In an alternate scenario, price could possibly head back up towards the 1st resistance level at 0.63448, where the 88% Fibonacci line is
Areas of consideration:
- H4 time frame, 1st resistance at 0.63448
- H4 time frame, 1st support at 0.62092
USD/CAD:
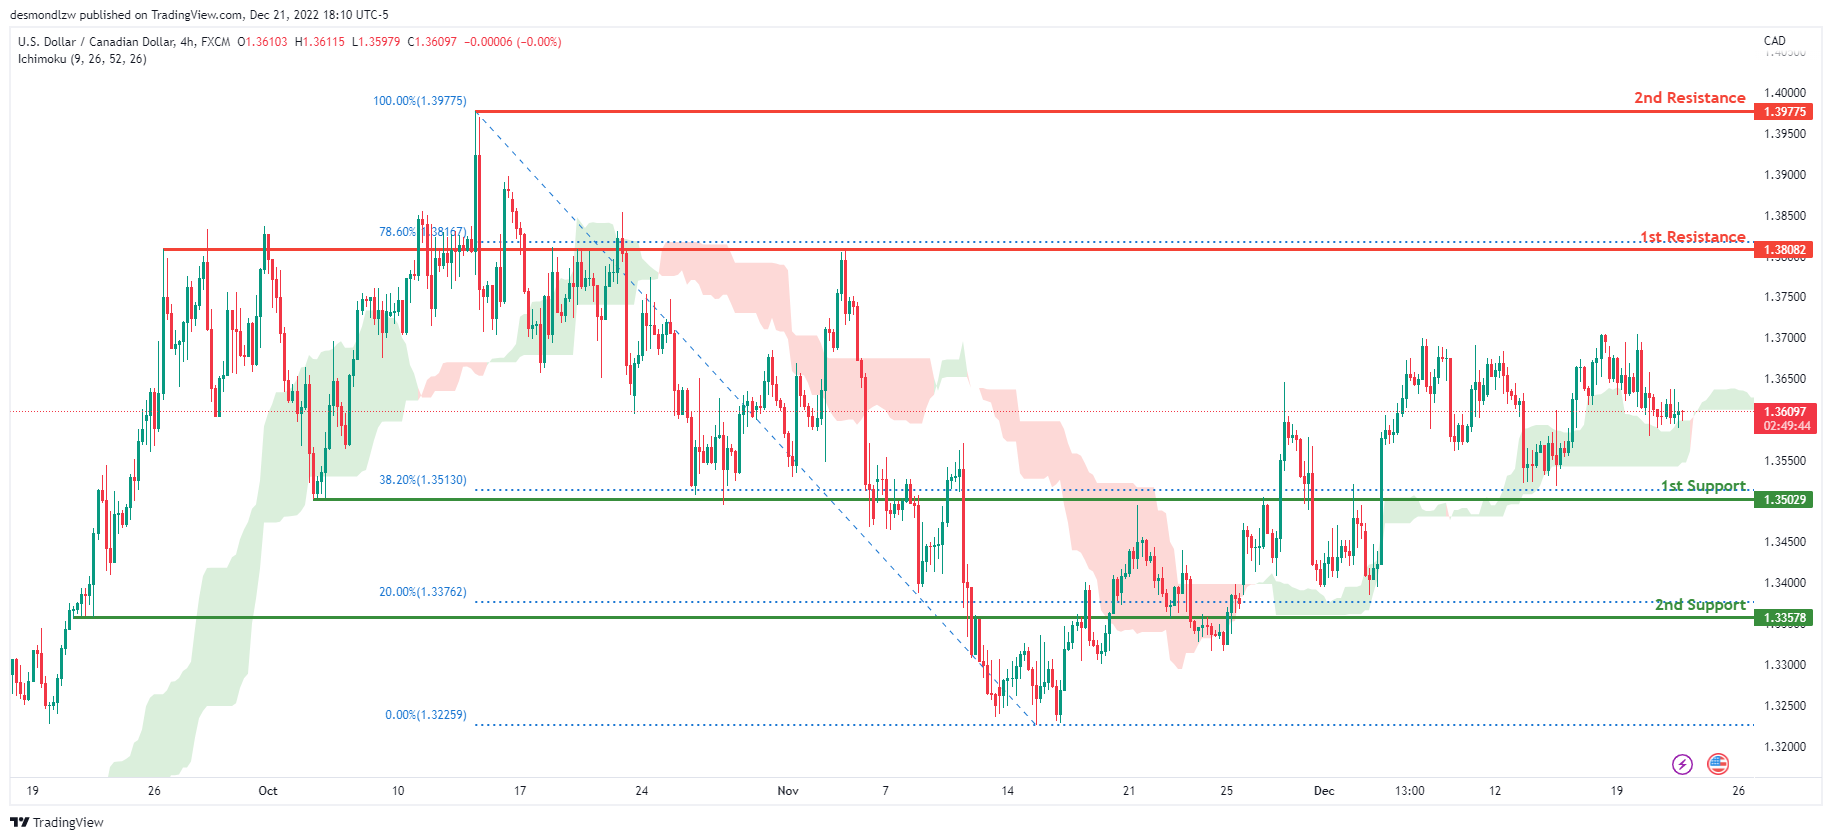
On the H4 chart, the overall bias for USDCAD is bullish. To add confluence to this, the price is crossing above the Ichimoku cloud which indicates a bullish market. If this bullish momentum continues, expect the price to head towards 1st resistance line at 1.38082, where the 78.6% Fibonacci line is. In an alternative scenario, price could head back down to retest the 1st support at 1.35029, where the 38.2% Fibonacci line is.
Areas of consideration:
- H4 time frame, 1st resistance at 1.38082
- H4 time frame, 2nd resistance at 1.39775
- H4 time frame, 1st support at 1.35029
OIL:
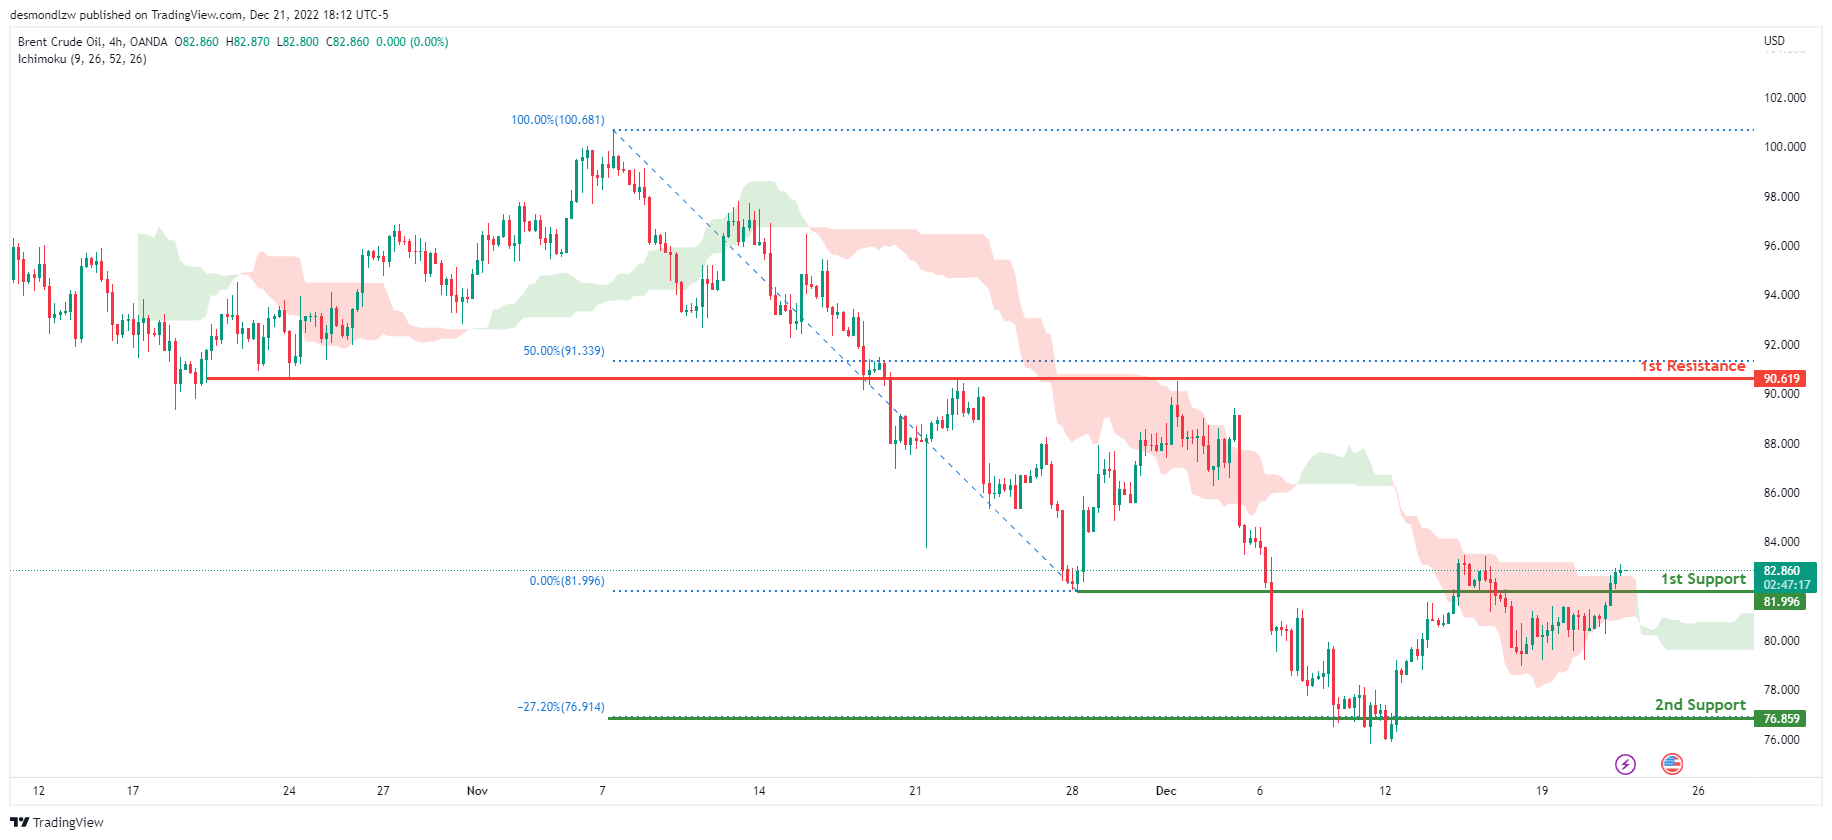
Looking at the H4 chart, my overall bias for BCOUSD is bullish due to the current price being above the Ichimoku cloud, indicating a bullish market. If this bullish momentum continues, expect the price to possibly head towards the 1st resistance at 90.619, where the 50% Fibonacci line is. In an alternate scenario, price could possibly head back down to retest the 1st support level at 81.996, where the previous low is located.
Areas of consideration:
- H4 time frame, 1st resistance at 90.619
- H4 time frame, 1st support at 81.996
Dow Jones Industrial Average:
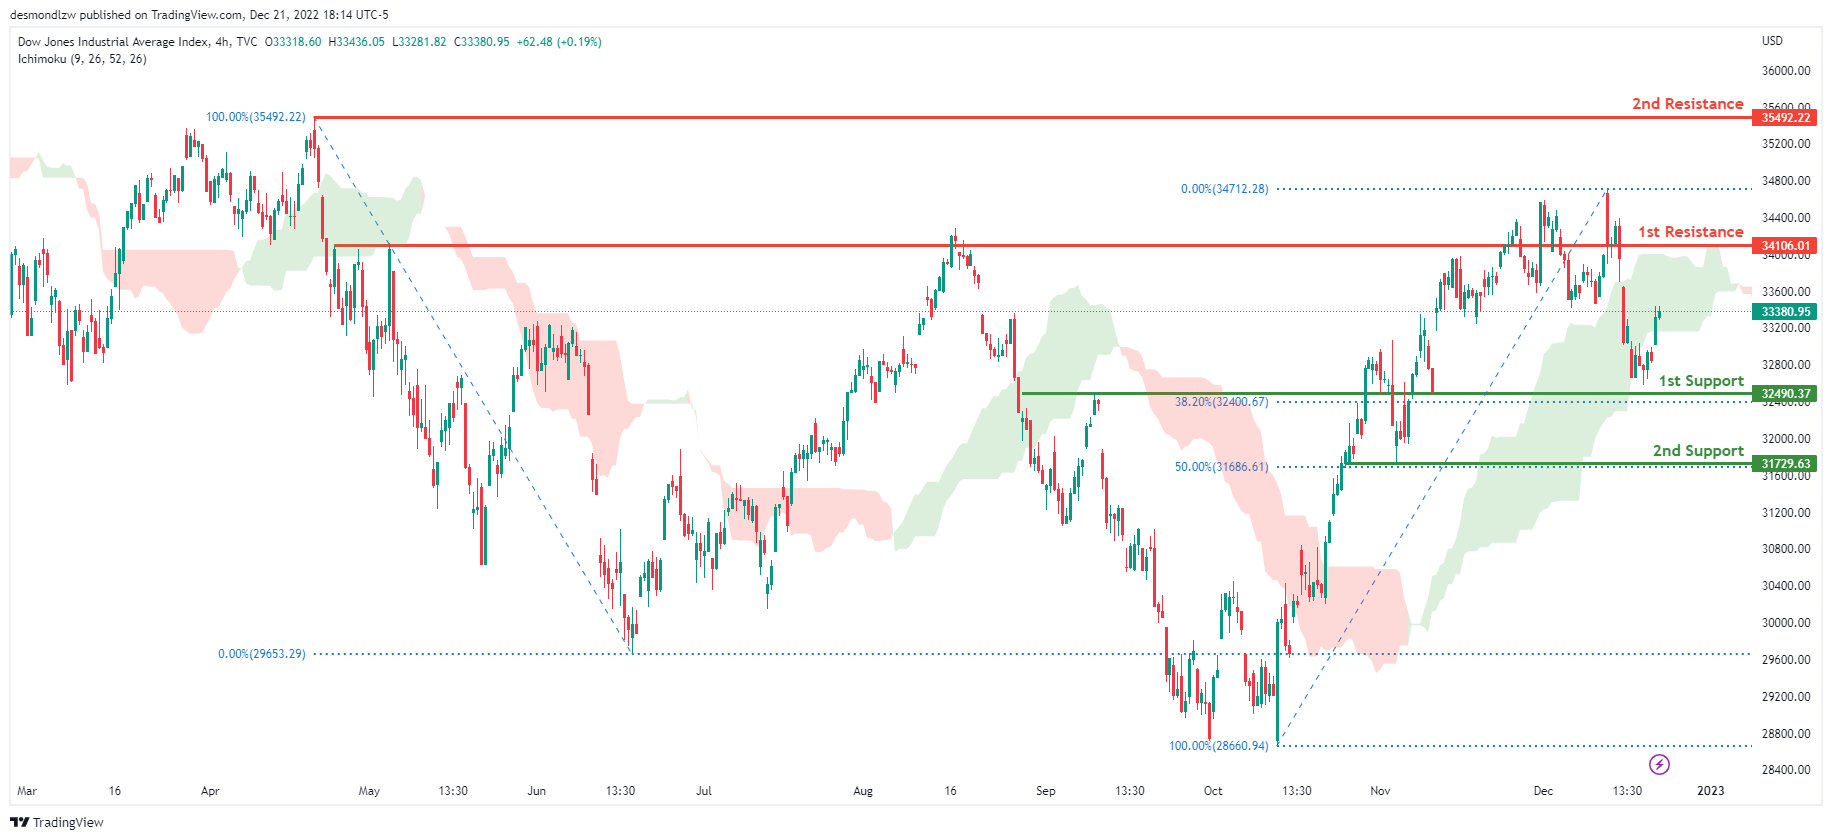
On the H4 chart, the overall bias for DJI is bearish . To add confluence to this, the price is crossing below the Ichimoku cloud which indicates a bearish market. If this bearish momentum continues, expect the price to head back down towards the 1st support at 32490.37, where the 61.8% Fibonacci line is. In an alternative scenario, price could possibly break the 1st resistance line at 34106.01, where the previous swing high is before heading towards the 2nd resistance line at 35492.22, where the previous swing high is.
Areas of consideration:
- H4 time frame, 1st support at 32490.37
- H4 time frame, 1st Resistance at 34106.01
- H4 time frame, 2nd Resistance at 35492.22
DAX:
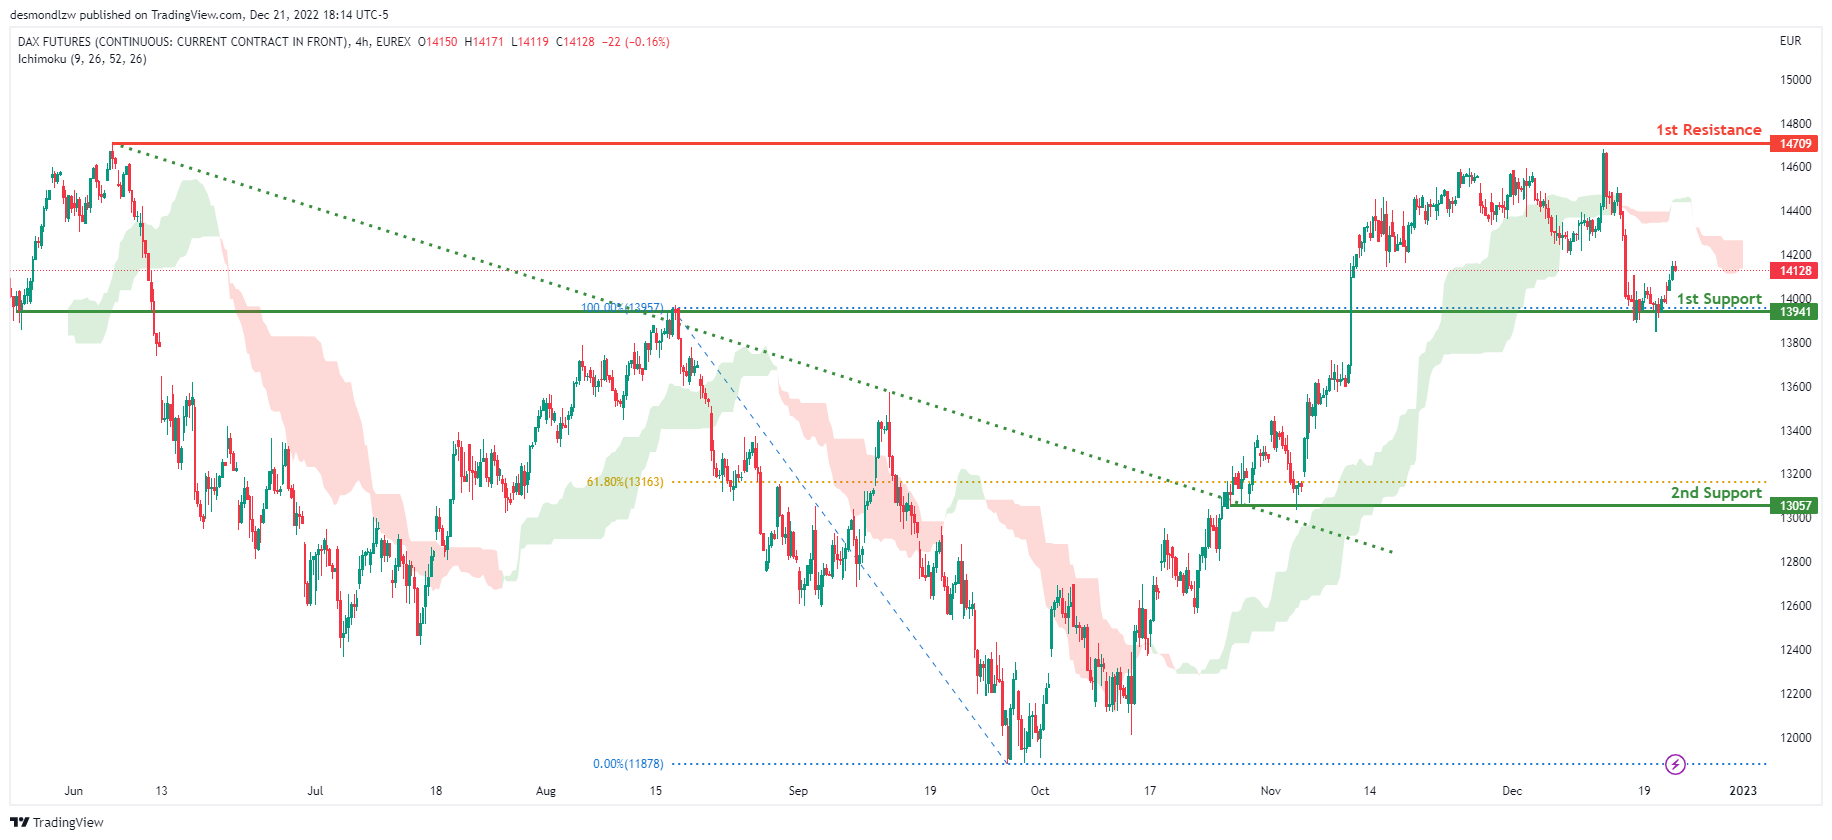
Looking at the H4 chart, my overall bias for DAX is bearish due to the current price being below the Ichimoku cloud, indicating a bearish market. If this bearish momentum continues, expect price to break the 1st support at 13941 where the previous swing high is before heading towards the 2nd support at 13057, where the 61.8% Fibonacci line is. In an alternative scenario, price could possibly head back up to retest the 1st resistance at 14709, where the previous swing high is.
Areas of consideration:
- H4 time frame, 1st resistance is at 14709
- H4 time frame, 1st support is at 13941
- H4 time frame, 2nd support is at 13057
ETHUSD:
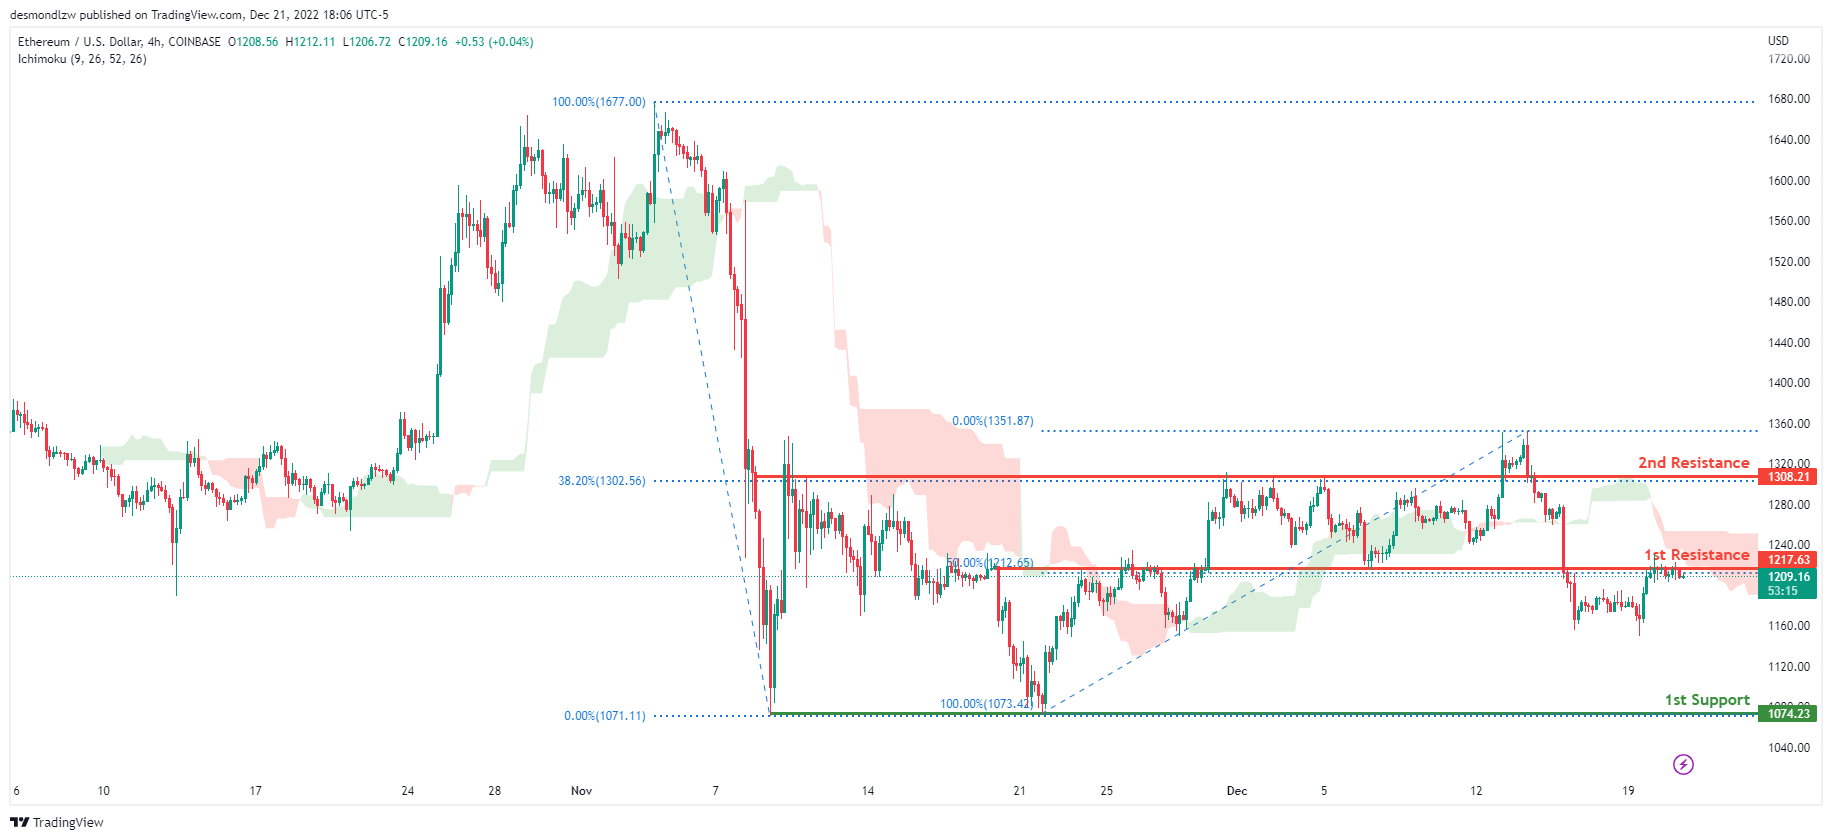
Looking at the H4 chart, my overall bias for ETHUSD is bearish due to the current price crossing below the Ichimoku cloud, indicating a bearish market. If this bearish momentum continues, expect price to head towards the 1st support at 1074.23, where the previous swing low is. In an alternative scenario, price could head back up to break the 1st resistance at 1217.63, where the 50% Fibonacci line is, before heading towards the 2nd resistance at 1308.21, where the 38.2% Fibonacci line is.
Areas of consideration:
- H4 time frame, 1st resistance of 1217.63
- H4 time frame, 2nd resistance of 1308.21
- H4 time frame, 1st support at 1074.23
BTCUSD:
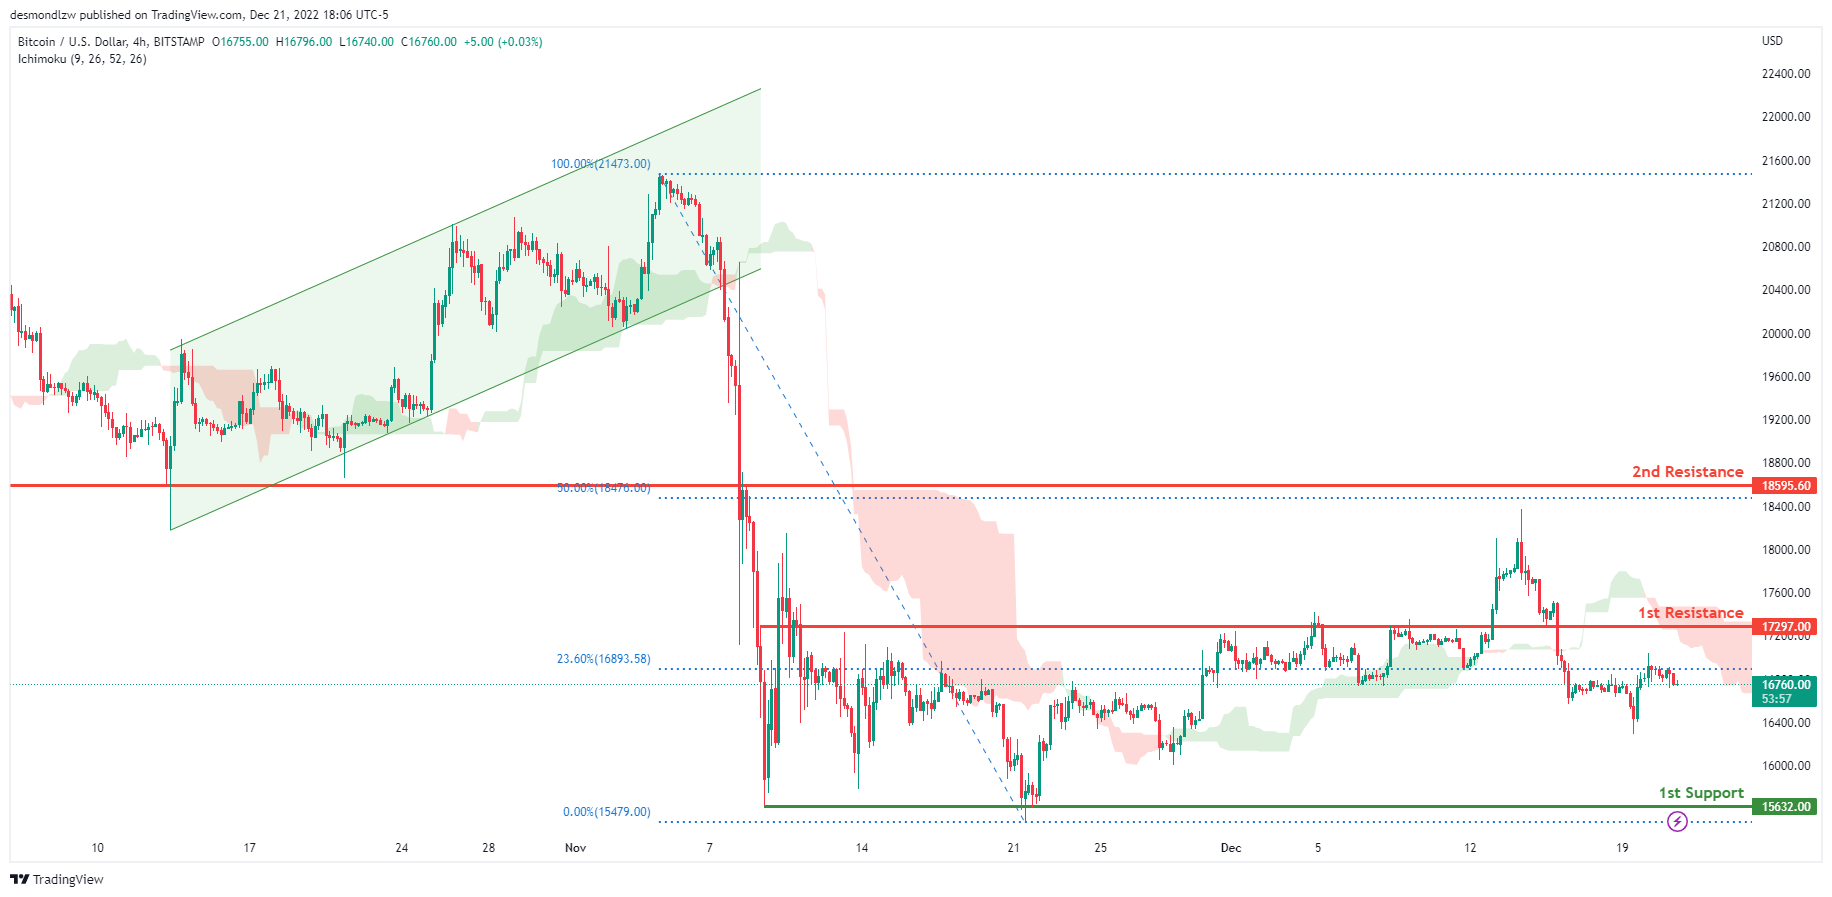
Looking at the H4 chart, my overall bias for BTCUSD is bearish due to the current price being below the Ichimoku cloud, indicating a bearish market. Expecting price to possibly continue heading towards the 1st support at 15632.00, where the previous swing low is. In an alternative scenario, price could possibly head up towards the 1st resistance at 17297.00, where the 23.6% Fibonacci line is.
Areas of consideration:
- H4 time frame, 1st resistance 17297.00
- H4 time frame, 1st support at 15632.00
S&P 500:
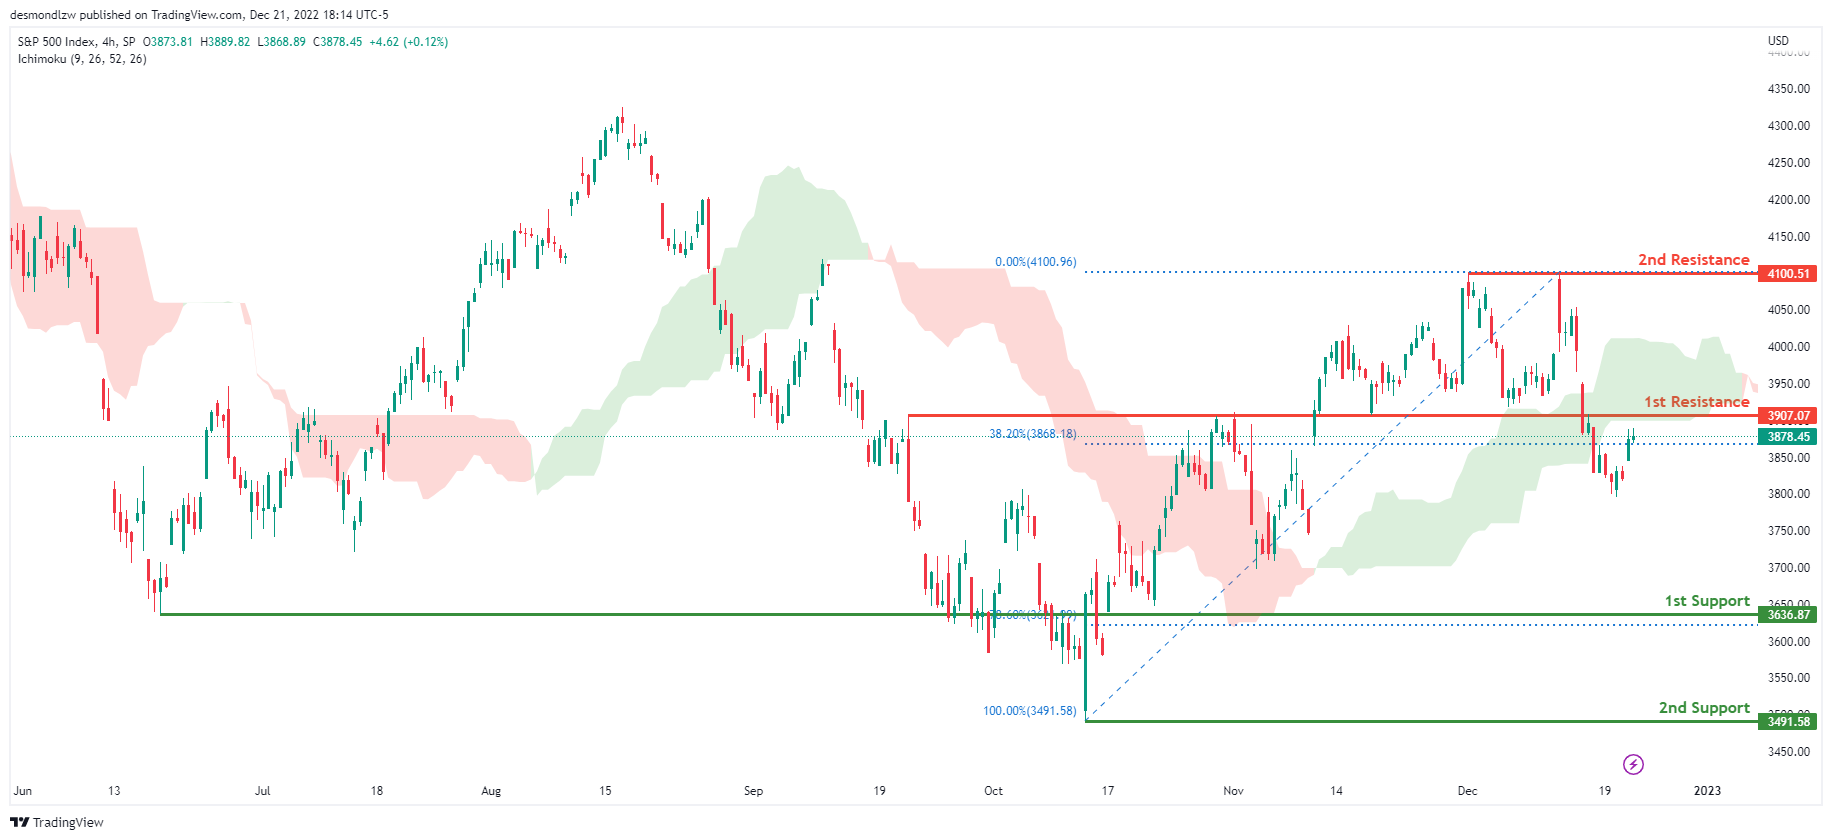
Looking at the H4 chart, my overall bias for S&P500 is bearish due to the current price being below the Ichimoku cloud, indicating a bearish market. If this bearish momentum continues, expect price to continue heading towards the 1st support at 3636.87, where the 78.6% Fibonacci line is. In an alternative scenario, price could possibly head back up to retest the 1st resistance at 3907.07, where the 38.2% Fibonacci line is.
Areas of consideration:
- H4 time frame, 1st support at 3636.87
- H4 time frame, 1st resistance at 3907.07
AUD/NZD extending corrective rebound
As risk-on sentiment carried forward to Asian sessions, Aussie is benefiting much more than Kiwi for now. AUD/NZD is extending the rebound from 1.0469 and hit as high as 1.0640 so far.
A short term bottom should be confirmed at 1.0469 with break of the near term channel resistance, on bullish convergence condition in hour MACD. Yet, the rebound should be more of a result of deeply oversold condition, as seen in daily RSI. It's too early to call for a trend reversal.
While further rise is now mildly in favor, upside should be capped by 55 day EMA (now at 1.0826). Indeed, break of 1.0564 minor support will suggest that the decline from 1.1498 is ready to resume through 1.0469.
WTI oil extends rebound, but down trend still intact
Oil prices extended the near term rebound this week as winter storm hit the US. Heating demand would be boosted by the arctic blast, offsetting the curbed travel plans. Also, as reported yesterday, US oil inventories unexpected dropped -5.9m barrels in the week ending December 16.
WTI is extending the rebound from 70.34 short term bottom and hit as high as 78.95 so far. While further rise cannot be ruled out, it's too early to confirm the end of the medium term down trend, not to mention a reversal. There level layers of resistance ahead at 55 day EMA (now at 82.03), 83.82 resistance and then trend line resistance at 85.07.
Another decline will remain in favor for now, at a later stage. Break of 73.52 minor support will likely send WTI through 70.34 low.
Bitcoin Price Technicals Suggest Fresh Drop To $16K
Key Highlights
- Bitcoin price started a fresh decline below the $17,150 support.
- It traded below a major bullish trend line with support at $17,280 on the 4-hours chart.
- Crude oil price climbed higher and broke the $78.00 resistance.
- The US GDP could grow 2.9% in Q3 2022.
Bitcoin Price Technical Analysis
Bitcoin price spiked above the $18,000 resistance before the bears appeared. BTC/USD topped near $18,354 and started a fresh decline below $18,000.
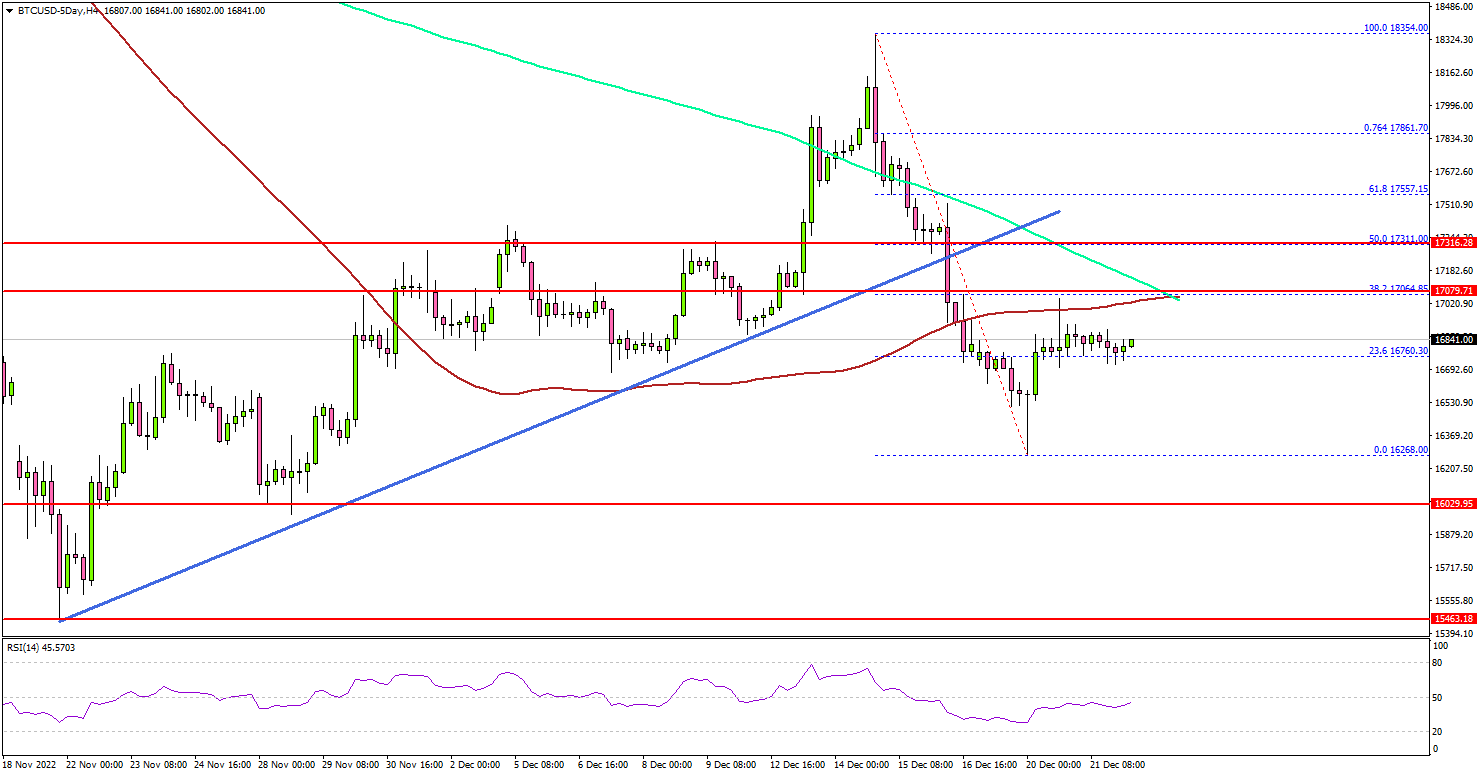
Looking at the 4-hours chart, the price traded below the $17,500 support zone, the 200 simple moving average (green, 4-hours), and the 100 simple moving average (red, 4-hours). The move was such that the price even dived below the $17,000 level.
The price traded as low as $16,268 and recently started an upside correction. There was a minor move above the $16,500 resistance zone.
Bitcoin climbed above the 23.6% Fib retracement level of the key decline from the $18,354 swing high to $16,268 low. It is now facing a confluence resistance near the $17,100 level and the 100 simple moving average (red, 4-hours).
The next resistance sits near the $17,310 zone. It is close to the 50% Fib retracement level of the key decline from the $18,354 swing high to $16,268 low.
A close above the $17,310 level may perhaps start another steady increase in the coming days. In the stated case, the price could rise towards the $18,000 level. Any more gains could set the pace for a move towards the $18,400 level.
On the downside, an initial support sits near the $16,520 level. The main breakdown support sits near the $16,265 zone. If there is a downside break and close below $16,265, bitcoin might start another major decline in the coming days. In the stated case, it could revisit the $16,000 support or even test $15,650.
Economic Releases
- US Initial Jobless Claims - Forecast 215K, versus 211K previous.
- US Gross Domestic Product for Q3 2022 – Forecast 2.9% versus previous 2.9%.