Sample Category Title
USD/JPY Pair is Currently Consolidating Losses from 130.56
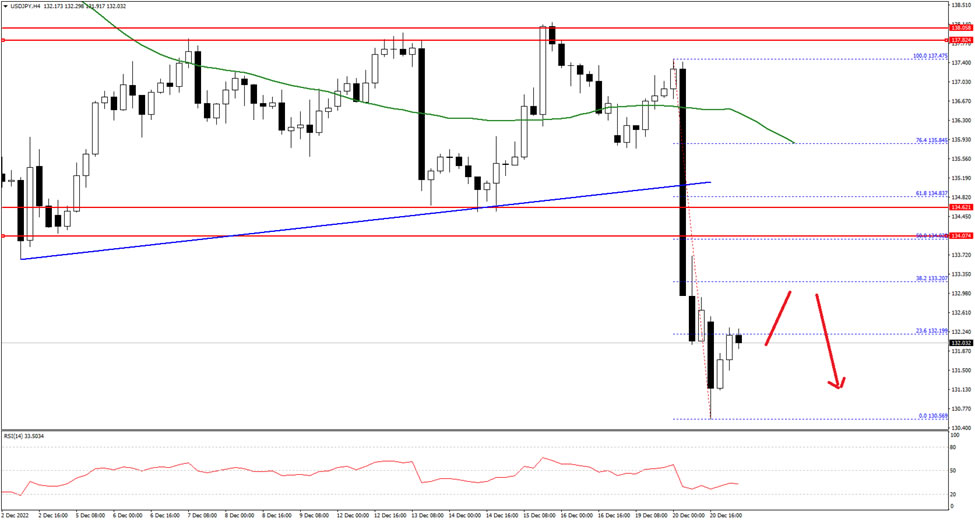
The US Dollar started a fresh decline from the 138.00 resistance zone against the Japanese Yen. The USD/JPY pair traded below the 136.00 level to move into a bearish zone.
There was a clear move below the 133.50 support zone and the 50 hourly simple moving average. The pair traded as low as 130.56 and is currently consolidating losses. An immediate resistance on the upside is near the 133.20 level.
The next major resistance is near the 134.00 zone. A clear break above the 134.00 resistance could push the price towards 135.00. The next major resistance is near the 135.50 level or the 50 hourly simple moving average.
On the downside, an initial support is near the 131.50 zone. The next major support sits near the 130.50 level, below which there is a risk of more downsides towards 128.80 on FXOpen.
GBPAUD Wave Analysis
- GBPAUD reversed from resistance level 1.8200
- Likely to fall to support level 1.8000
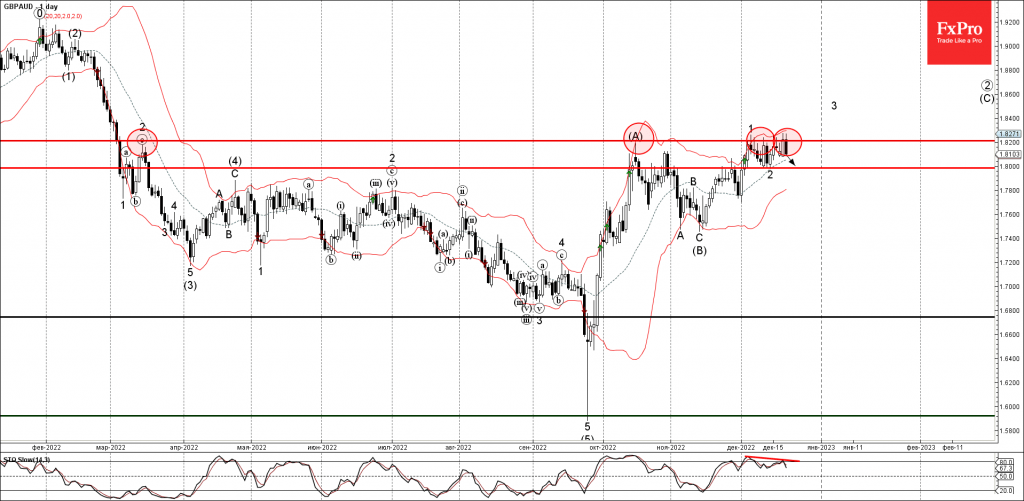
GBPAUD earlier reversed down once again from the long-term resistance level 1.8200 (which has been reversing the pair from middle March, as can be seen from the daily GBPAUD chart below).
If the price closes today near the current levels it will form the daily candlesticks reversal pattern Bearish Engulfing.
Given the bearish divergence on the daily Stochastic indicator, GBPAUD can be expected to fall further toward the next support level 1.8000 (low of the previous correction 2).
NZDUSD Wave Analysis
- NZDUSD reversed from key resistance level 0.6440
- Likely to fall to support level 0.6250
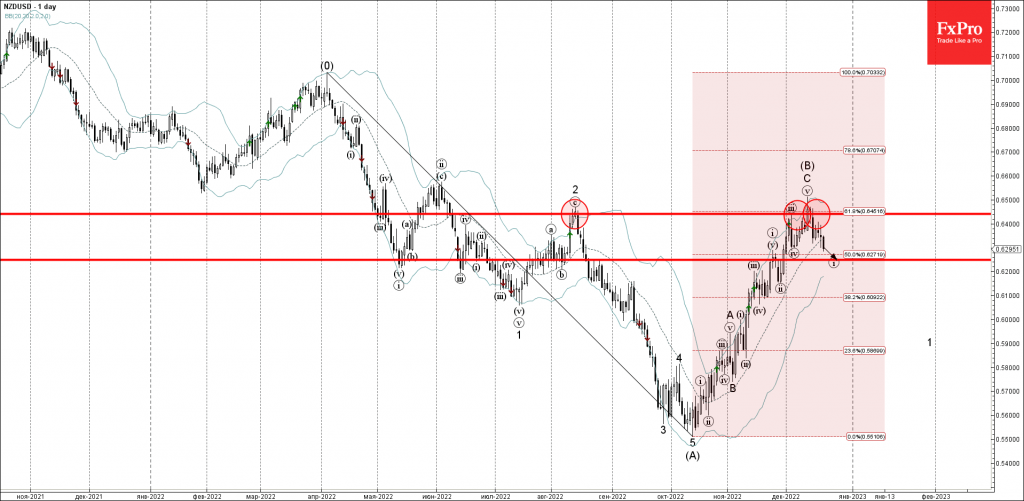
NZDUSD recently reversed down from the key resistance level 0.6440 (which has been reversing the pair from middle July, as can be seen below).
The resistance level 0.6440 was further strengthened by the nearby upper daily Bollinger Band and by the 61.8% Fibonacci correction of the downward impulse from last April.
NZDUSD can be expected to fall further toward the next support level 0.6250 (target price for the completion of the active short-term impulse wave (i)).
GBPUSD Flirts With 20- and 200-day SMAs; Weak Momentum
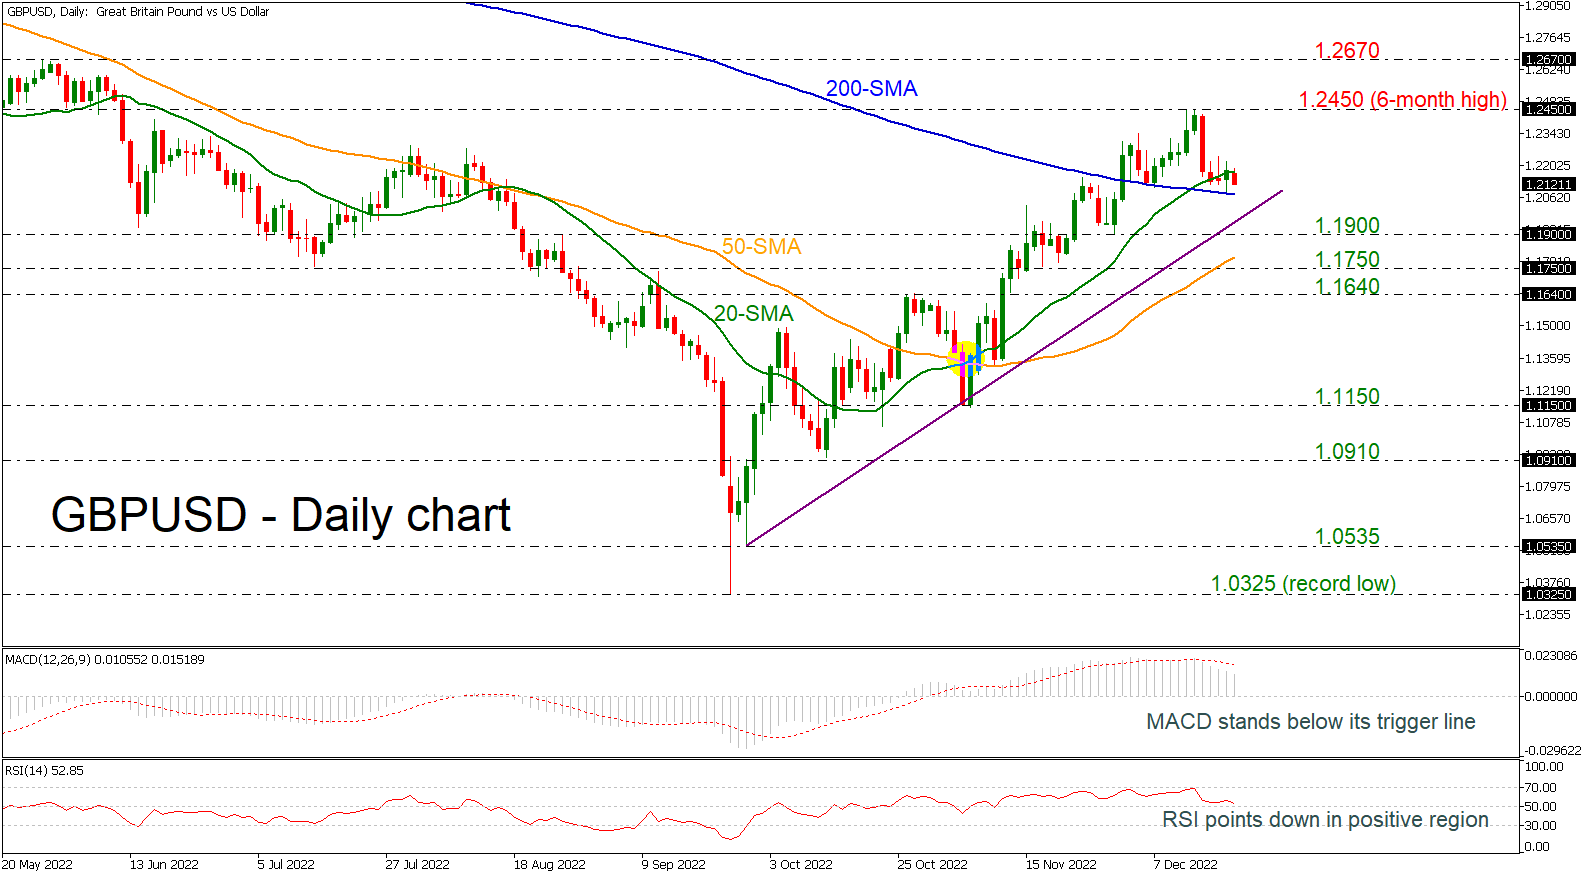
GBPUSD has been moving sideways over the last few sessions, remaining above the 200-day simple moving average (SMA) but the momentum is weak for now. The pair is still holding in an ascending tendency after the bounce off the record low of 1.0325; however, the technical oscillators are suggesting a bearish correction may be on the cards.
The MACD oscillator is moving lower below its trigger line in the bullish region, while the RSI is pointing down near the neutral threshold of 50.
If the pair remains above the 200-day SMA and surpasses the 20-day SMA as well, then the price may reach the previous high of 1.2450, which is a six-month high, before rallying to the 1.2670 barrier.
In the negative scenario, a drop below the 200-day SMA could open the way for a retest of the short-term uptrend line at 1.2000 before touching the 1.1900 psychological mark. Further losses could switch the outlook back to bearish, hitting the 50-day SMA at 1.1800 and the next support levels such as 1.1750 and 1.1640 respectively.
Summarizing, GBPUSD is bullish in the short-term timeframe and if there is a climb above the previous top, that would increase the optimism for further bullish actions in the longer-term outlook.
EURAUD Wave Analysis
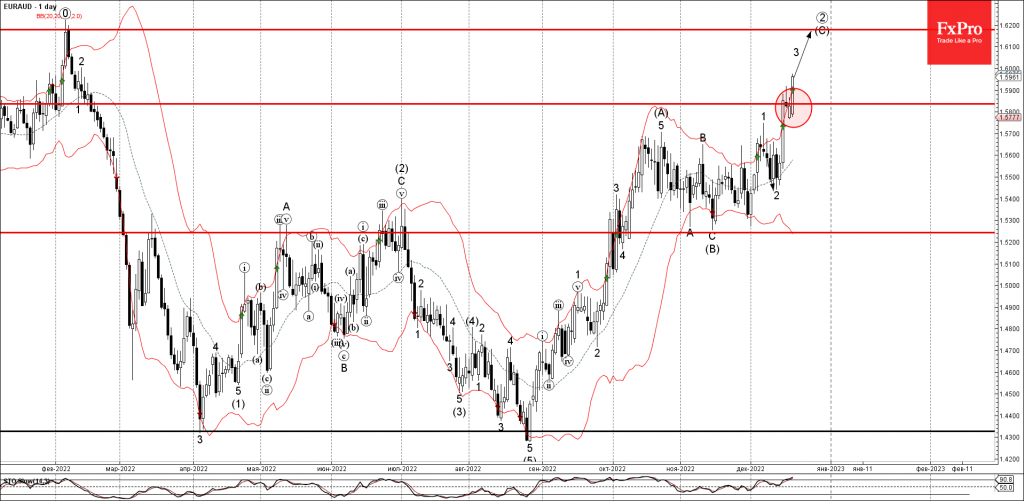
- EURAUD broke resistance level 1.5840
- Likely to rise to resistance level 1,6200
EURAUD recently broke above the resistance level 1.5840 (which stopped the pair earlier this month).
The breakout of the resistance level 1.5840 resistance level 1.5840 accelerated the active upward impulse wave (С) from the middle of November.
Given the clear daily uptrend, EURAUD can be expected to rise further toward the next resistance level 1,6200 (major resistance from February and the target for the completion of impulse wave (С)).
Japanese Yen Steadies after Massive Gains
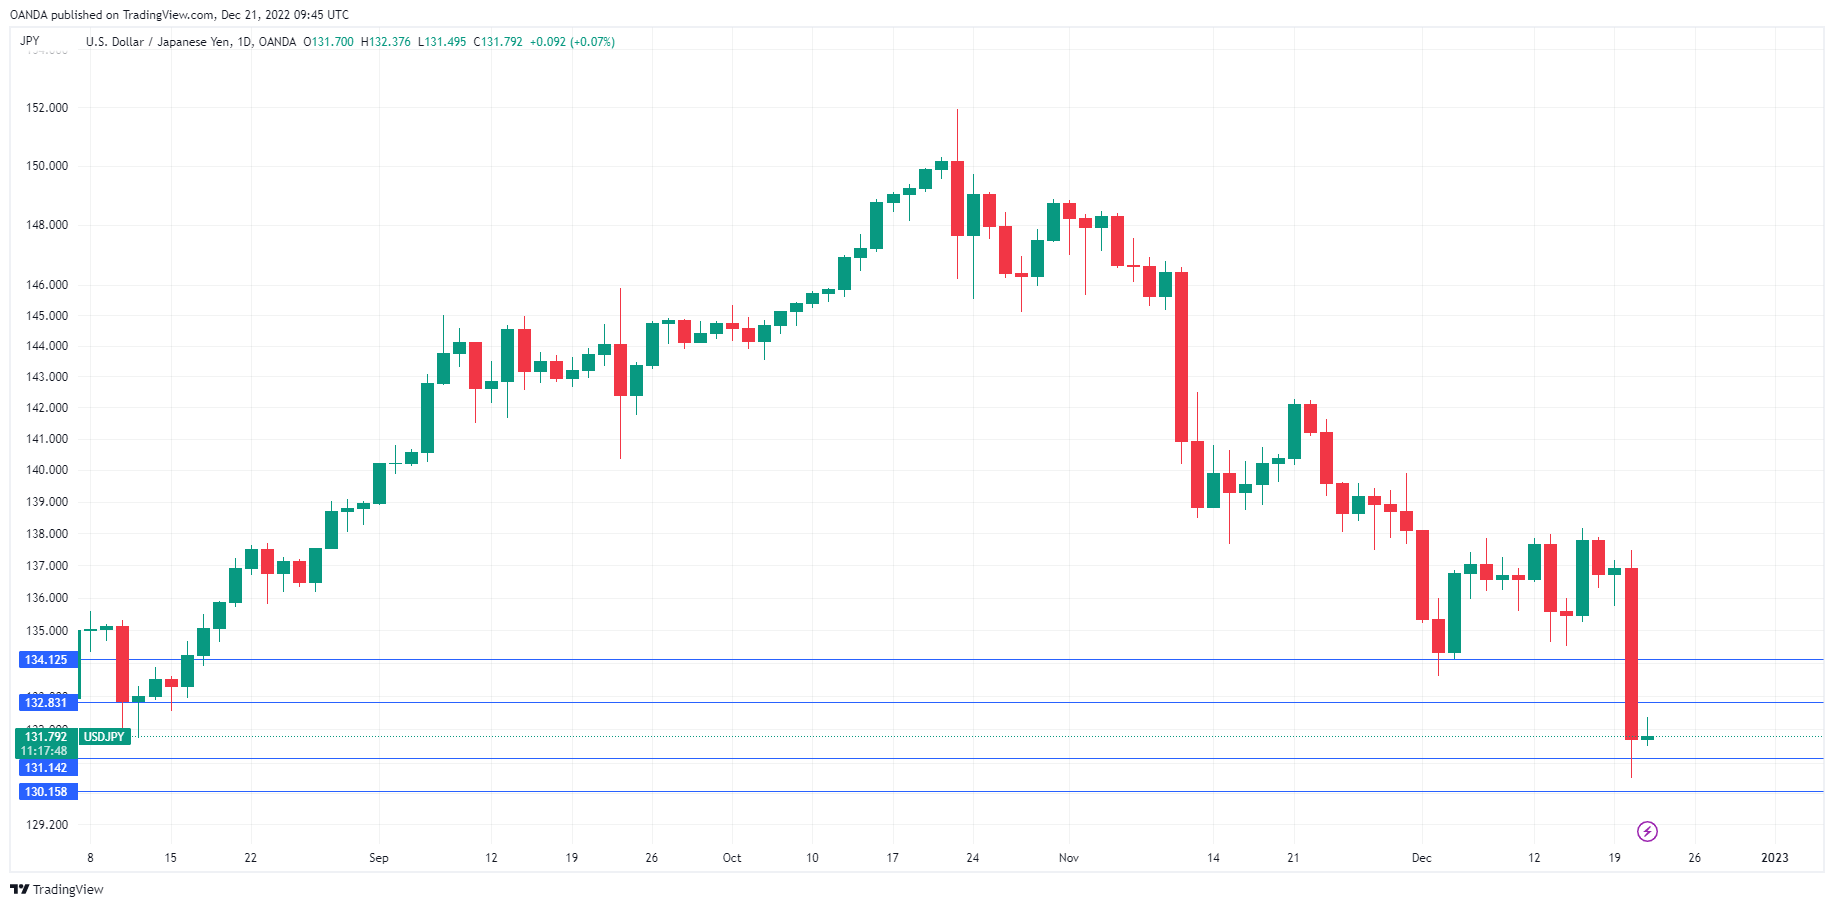
The Japanese yen is unchanged on Wednesday, taking a pause after posting huge gains a day earlier. In the European session, USD/JPY is trading at 131.68.
BoJ yield move sends yen soaring
It was a day to remember for the Japanese yen, which gained a staggering 3.7% against the dollar. USD/JPY fell as low as 130.56, its lowest level since August. The yen’s upswing was triggered by the Bank of Japan, which stunned the markets by widening the yield control band to 50 basis points, up from 25 bp. The move, which was announced at the BoJ’s policy meeting, was completely unexpected as policy makers gave no hints of any changes prior to the meeting. The markets had assumed that any major policy moves would wait until after Governor Kuroda’s term ends in April.
The band for 10-year yields has widened, but it’s important to remember that yield curve control policy, although modified, remains in effect, as the target of 0% hasn’t changed. At a press conference after the meeting, Governor Kuroda insisted that the move was not an interest hike. This is technically correct, although the effect of the wider band is the same, as Japanese bonds can now pay higher interest rates since the cap on yields is higher.
Now that the dust has settled, the question is what’s next from the BoJ? The tweak to the yield control band can be viewed as a baby step towards normalisation, after decades of an ultra-loose monetary policy. There is now talk of the BoJ raising rates out of negative territory next year, which would mark a sea change in policy. The BoJ meets next in January, and the markets have priced in a rate hike at 22%.
USD/JPY Technical
- USD/JPY has support at 131.13 and 130.15
- There is resistance at 132.83 and 134.12
NZDUSD Extends Slide Near 200-day SMA
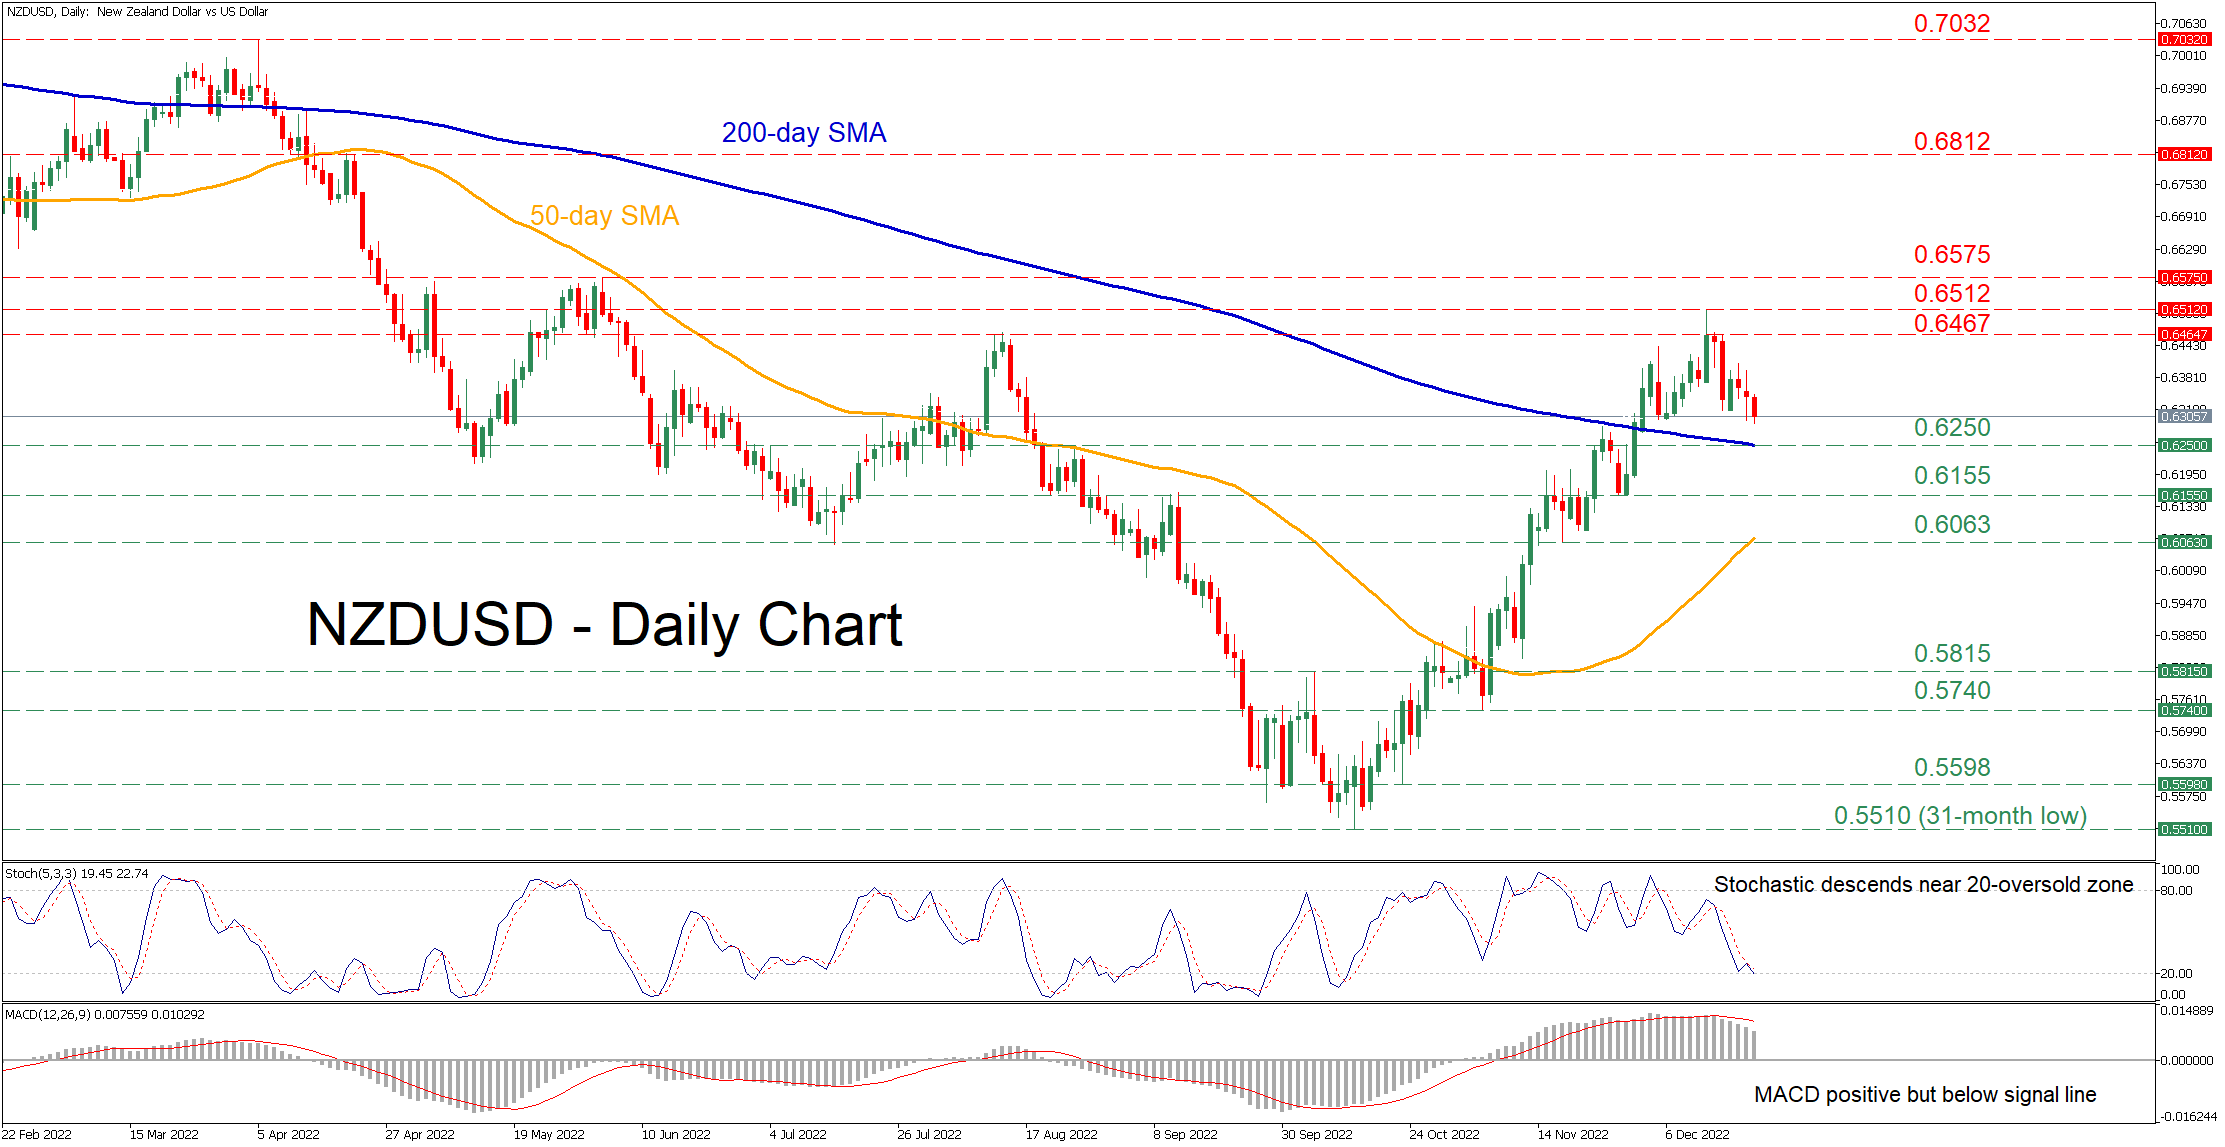
NZDUSD had experienced a prolonged downtrend since March, hitting a 31-month low of 0.5510 in early October. Even though the pair has posted a strong recovery since then, it is currently experiencing a pullback after its rebound came to halt at the six-month high of 0.6575.
The momentum indicators suggest that bearish forces have gained control. Specifically, the stochastic oscillator is descending after it failed to complete a bullish cross, while the MACD histogram has retreated further below its red signal line but remains in the positive zone.
Should the pair extend its decline, immediate support could be met at the 200-day simple moving average (SMA), currently at 0.6250. Dipping below that region, the bears could target 0.6155 before the focus shifts to the November support of 0.6063, which overlaps with the 50-day SMA. Even lower, the inside swing high of 0.5815 could halt any further retreats.
To the upside, bullish forces might propel the pair towards the August high of 0.6467. Conquering this barricade, the price could test the recent peak of 0.6512, which rejected the pair's medium-term rebound. Surpassing that zone, the spotlight could turn to the June high of 0.6575.
Overall, NZDUSD seems to be experiencing a short-term downside correction after its rebound failed to strengthen. Hence, a clear break above the 0.6512 ceiling could signal the continuation of the pair’s recovery.
AUD/USD: Are We Going for a Bearish Trend?
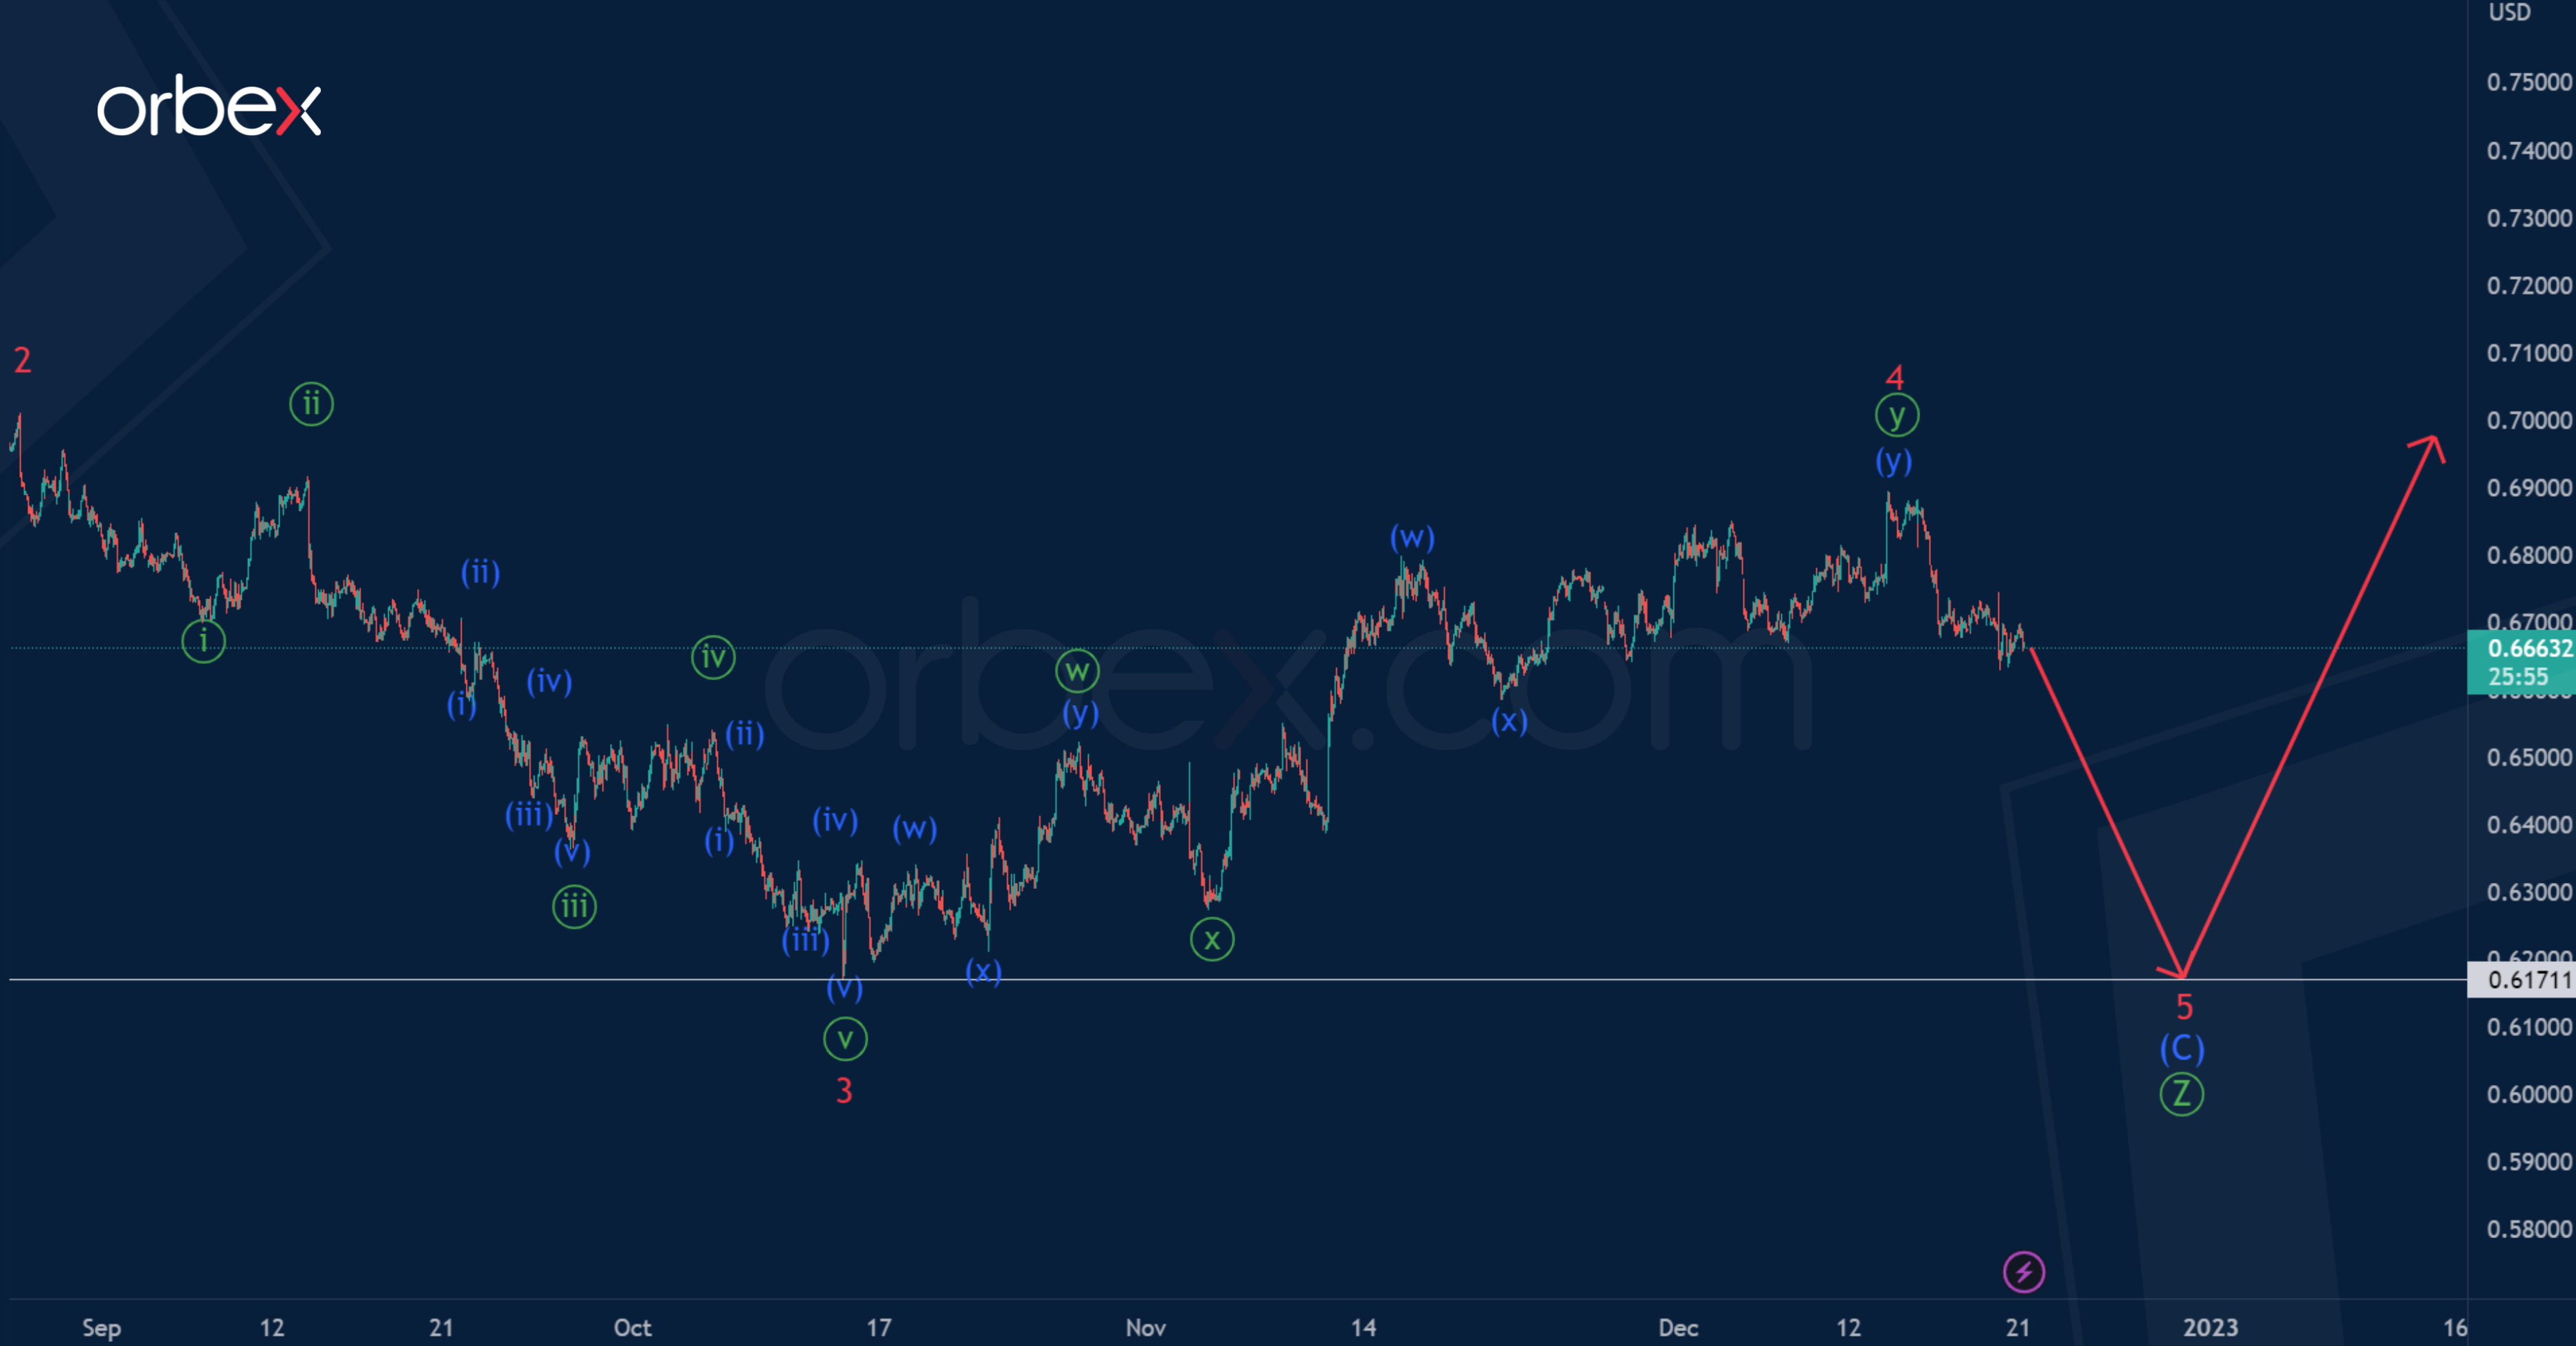
Half a month ago we were talking about AUDUSD. Most likely, the currency forms a bearish triple zigzag Ⓦ-Ⓧ-Ⓨ-Ⓧ-Ⓩ, where the primary wave Ⓩ is a simple zigzag (A)-(B)-(C).
At the moment, an impulse wave (C) is being formed, which consists of minor sub-waves 1-2-3-4-5. Minor wave 3 consists of five minute sub-waves.
Most likely, the development of the minor corrective wave 4 in the form of a minute double zigzag was completed not so long ago. Thus, the market may continue to move down in the impulse wave 5.
The currency is expected to decline to the previous low of 0.617, marked by the impulse 3.
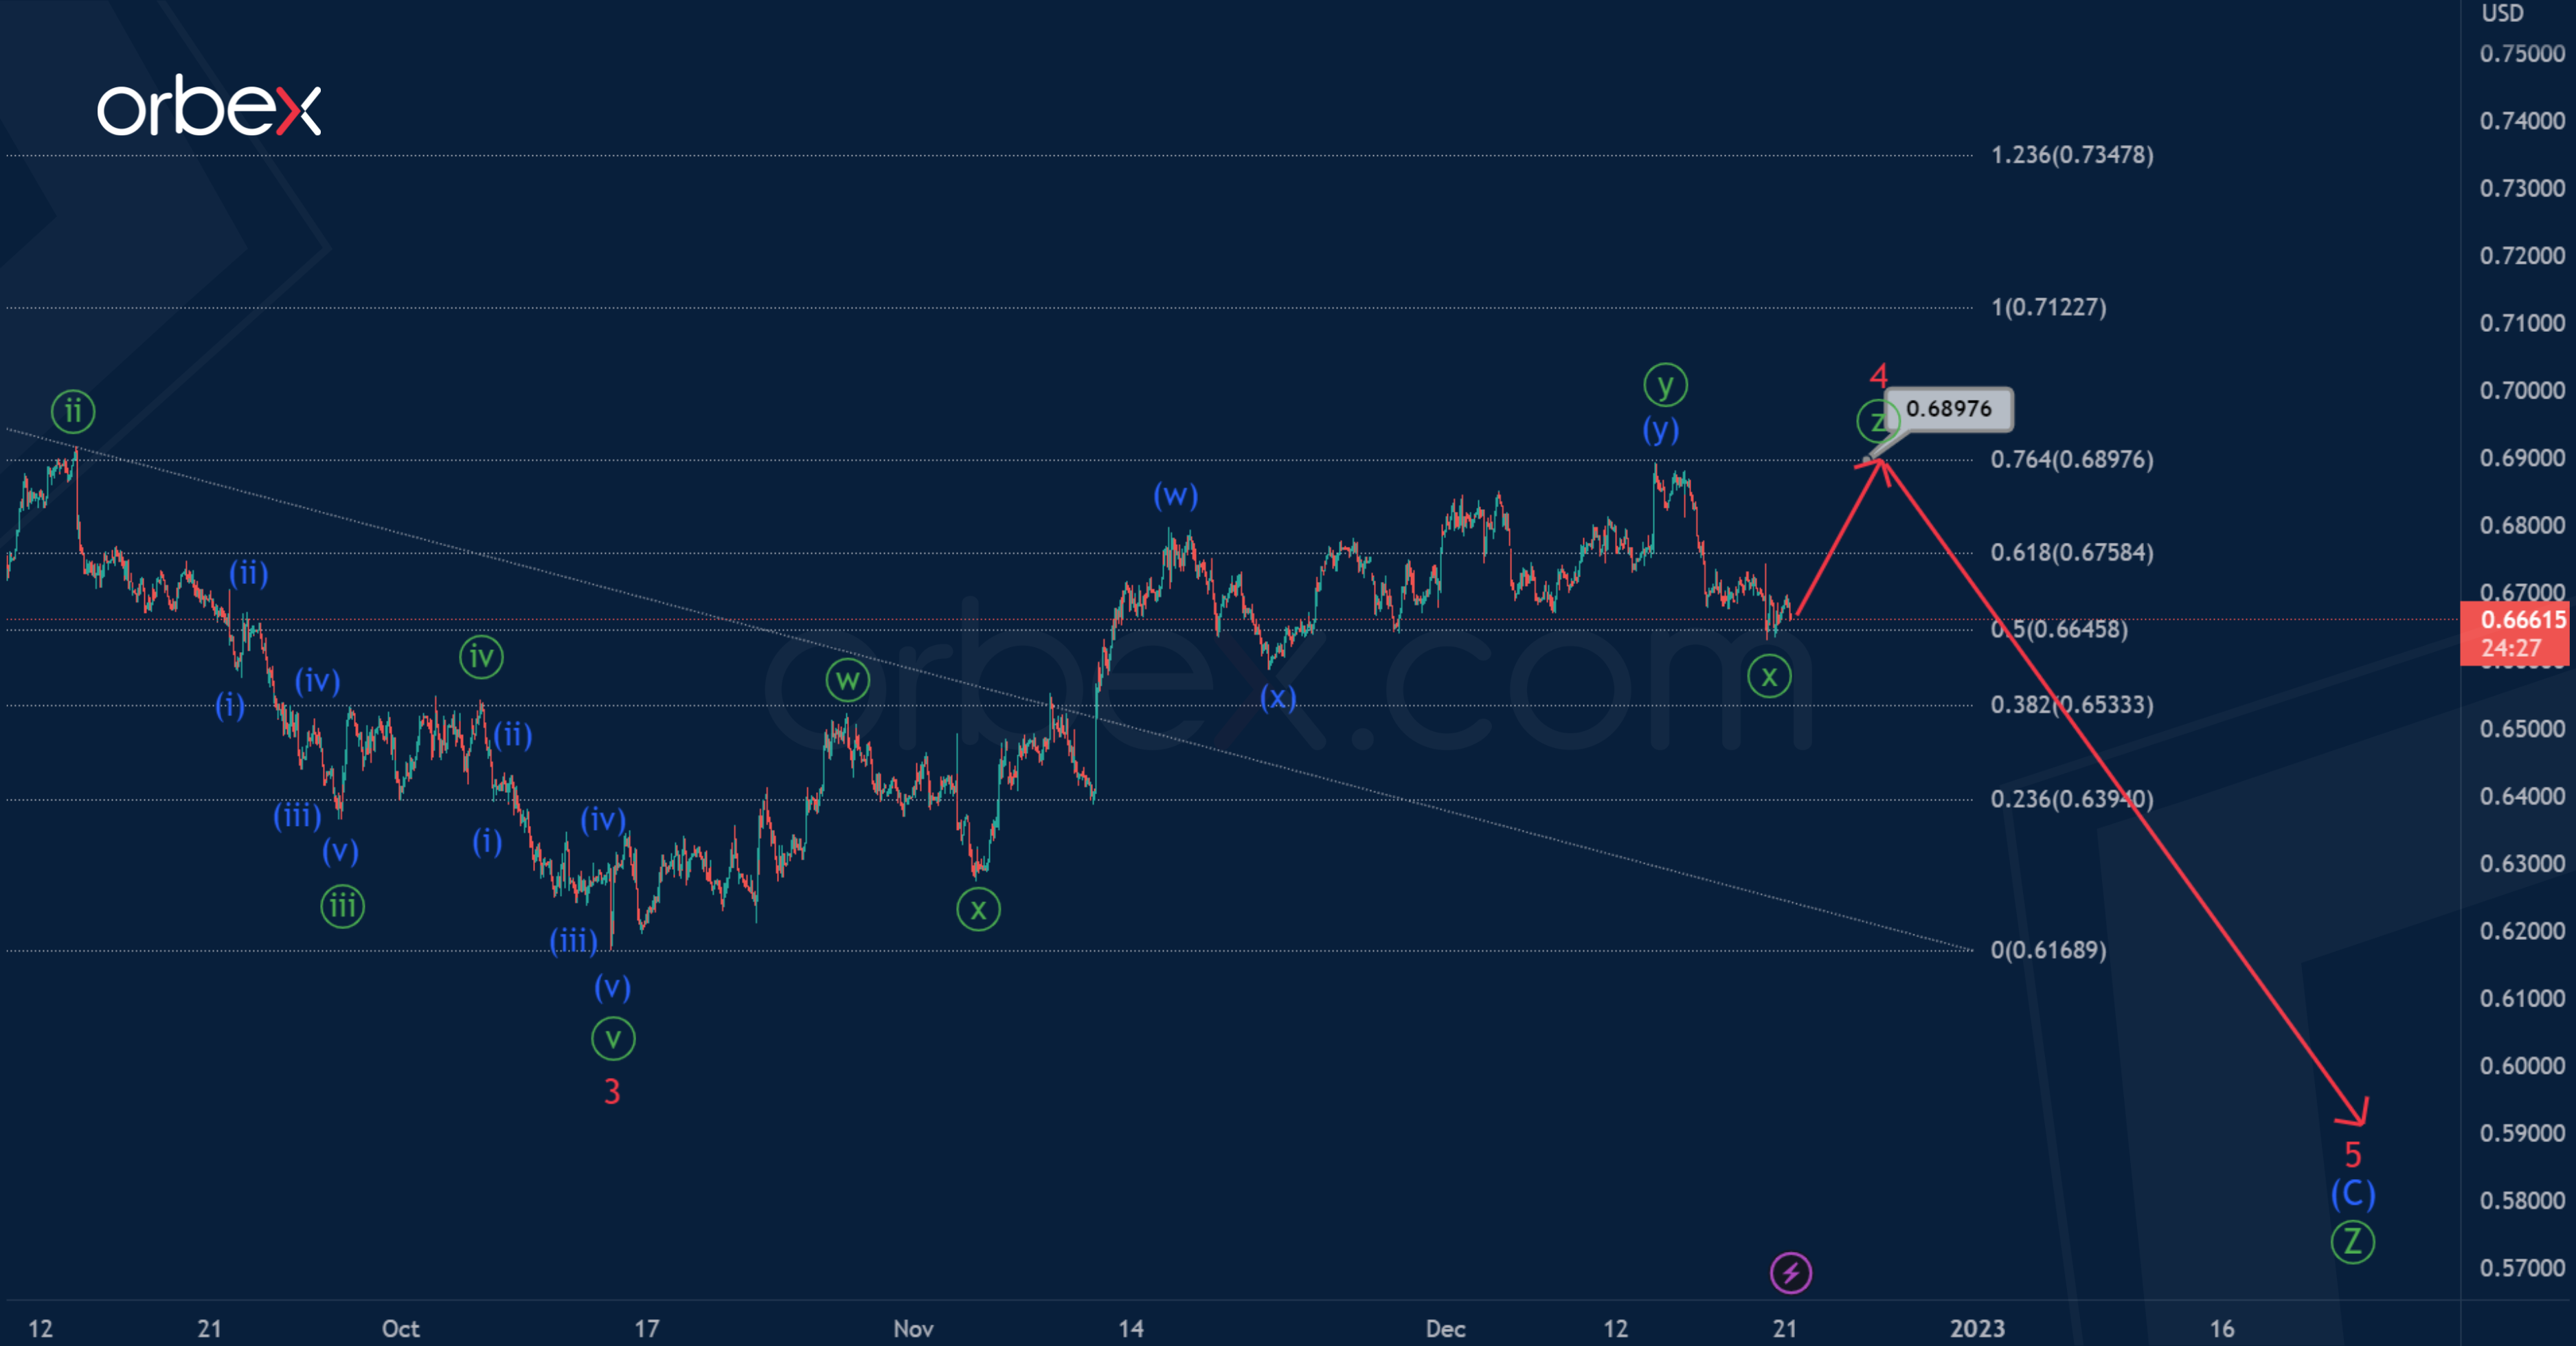
However, corrective wave 4 may not have been fully completed, and most likely it will have a triple zigzag structure.
Bulls could build only four parts of correction 4, that is, we can see fully formed sub-waves ⓦ-ⓧ-ⓨ-ⓧ, and the sub-wave ⓩ is still being built.
In the near future, the market may grow to 0.689. At that level, corrective wave 4 will be at 76.4% along the Fibonacci lines of previous bearish impulse 3. Then, after the full completion of wave 4, we can expect a decline in the minor wave 5.
GBP/JPY Daily Outlook
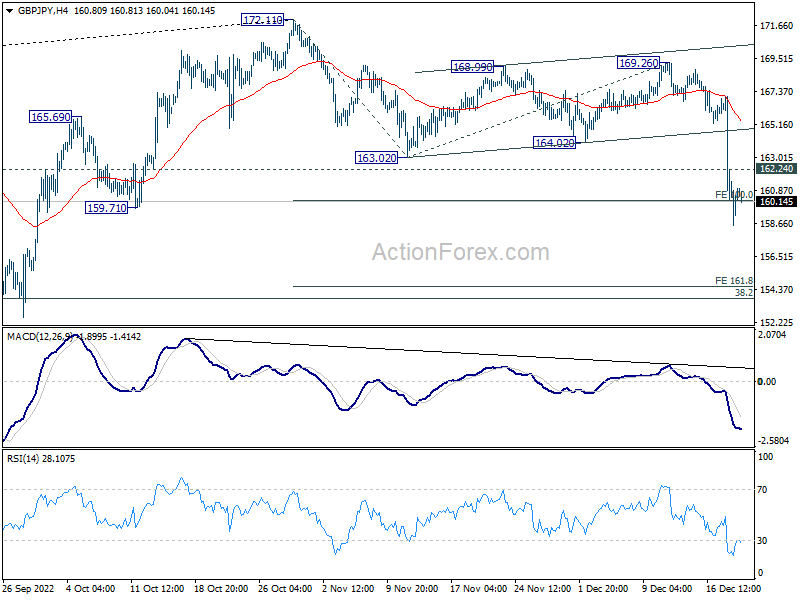
Daily Pivots: (S1) 157.07; (P) 162.05; (R1) 165.48; More...
Intraday bias in GBP/JPY remains on the downside for the moment. Firm break of 100% projection of 172.11 to 163.02 from 169.26 at 160.17 will target 161.8% projection at 154.55 next. On the upside, above 162.24 minor resistance will turn intraday bias neutral first.
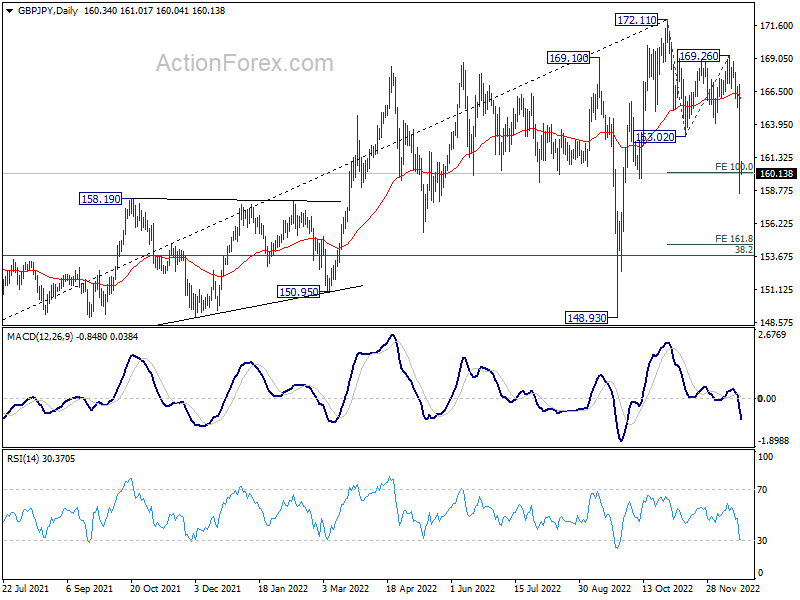
In the bigger picture, sustained break of 55 week EMA (now at 161.26) will confirm medium term topping at 172.11, on bearish divergence condition in weekly MACD. Fall from 172.11 should be correcting whole up trend from 123.94 (2020 low). Deeper decline should be seen to 38.2% retracement of 123.94 to 172.11 at 153.70 and possibly below. This will now remain the favored case as long as 55 day EMA (now at 166.11) holds.
EUR/JPY Daily Outlook
Daily Pivots: (S1) 137.25; (P) 141.54; (R1) 144.28; More....
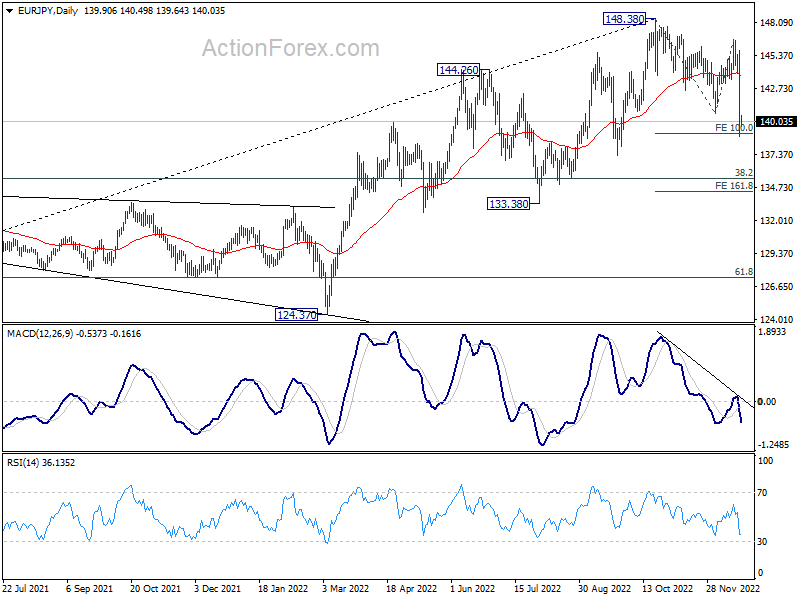
Intraday bias in EUR/JPY remains neutral for the moment. Firm break of 100% projection of 148.38 to 140.75 from 146.71 at 139.08 will pave the way to 161.8% projection at 134.36. On the upside, above 141.60 minor resistance will turn intraday bias neutral first.
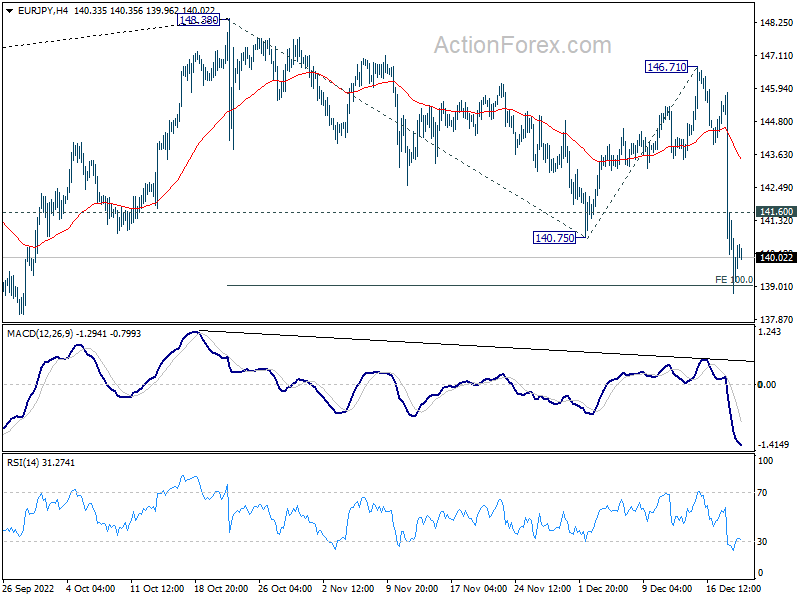
In the bigger picture, as long as 55 week EMA (now at 138.54) holds, larger up trend from 114.42 (2020 low) is still in progress for 149.76 long term resistance. However, firm break of 55 week EMA will bring deeper fall to 38.2% retracement of 114.42 to 148.38 at 135.40 before completing the correction from 148.38.