

Sample Category Title
USD/CHF Daily Outlook
Daily Pivots: (S1) 0.9233; (P) 0.9271; (R1) 0.9299; More...
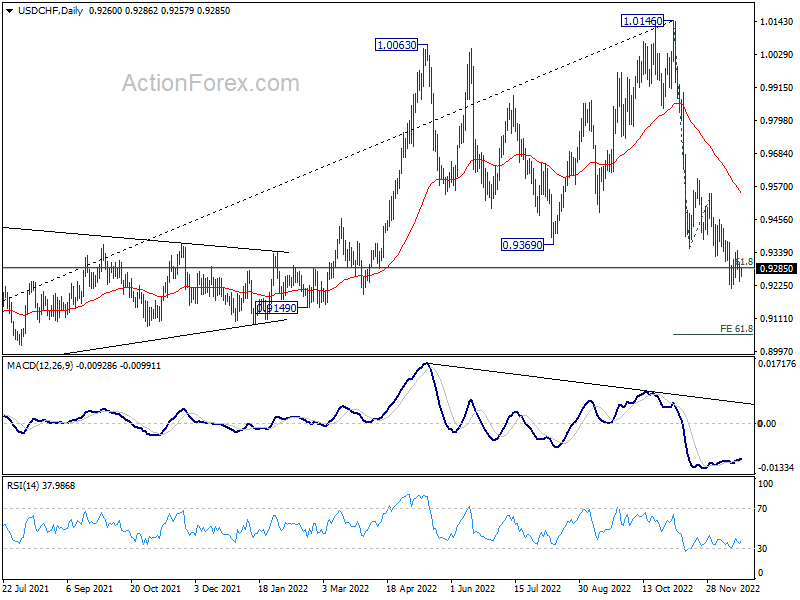
Range trading continues in USD/CHF and intraday bias stays neutral at this point. Further decline is in favor with 0.9378 resistance intact. On the downside, break of 0.9214 will resume the fall and target 61.8% projection of 1.0146 to 0.9355 from 0.9545 at 0.9056. However, break of 0.9378 resistance will indicate short term bottoming and turn bias back to the upside for 0.9545 resistance instead.
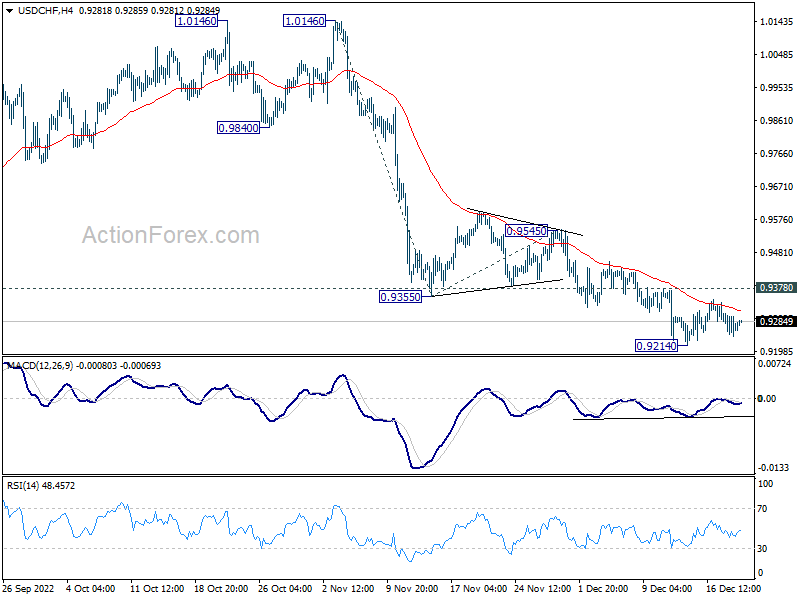
In the bigger picture, rise from 0.8756 (2021 low) has completed at 1.0146, well ahead of 1.0342 long term resistance (2016 high). Based on current downside momentum, fall from 1.0146 might be a medium term down trend itself. Sustained break of 61.8% retracement of 0.8756 to 1.0146 at 0.9287 will pave the way to 0.8756. In any case, risk will stay on the downside as long as 0.9545 resistance holds.
GBP/USD Daily Outlook
Daily Pivots: (S1) 1.2106; (P) 1.2165; (R1) 1.2244; More...
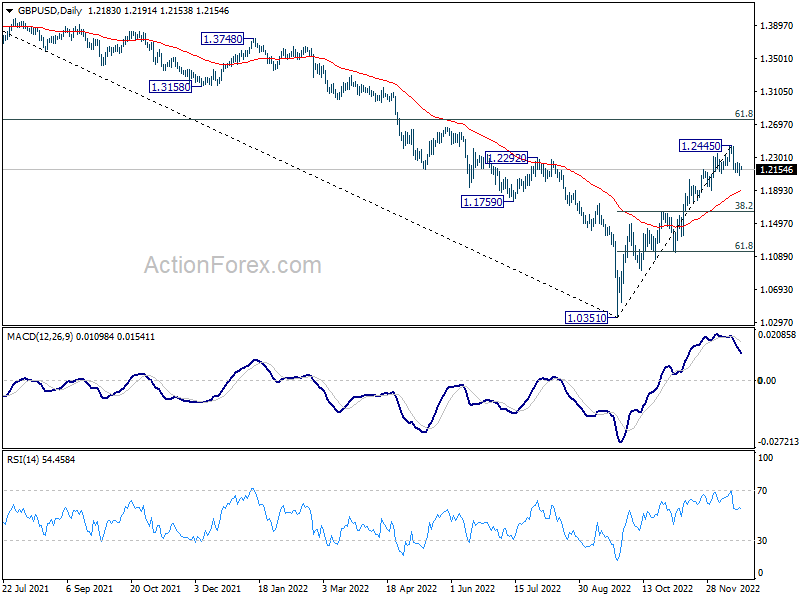
Intraday bias in GBP/USD is turned neutral first with loss of downside momentum. Risk stays on the downside with 1.2445 resistance intact. Below 1.2084 will resume the fall from 1.2445 to 55 day EMA (now at 1.1894). Firm break there will target 38.2% retracement of 1.0351 to 1.2445 at 1.1645.
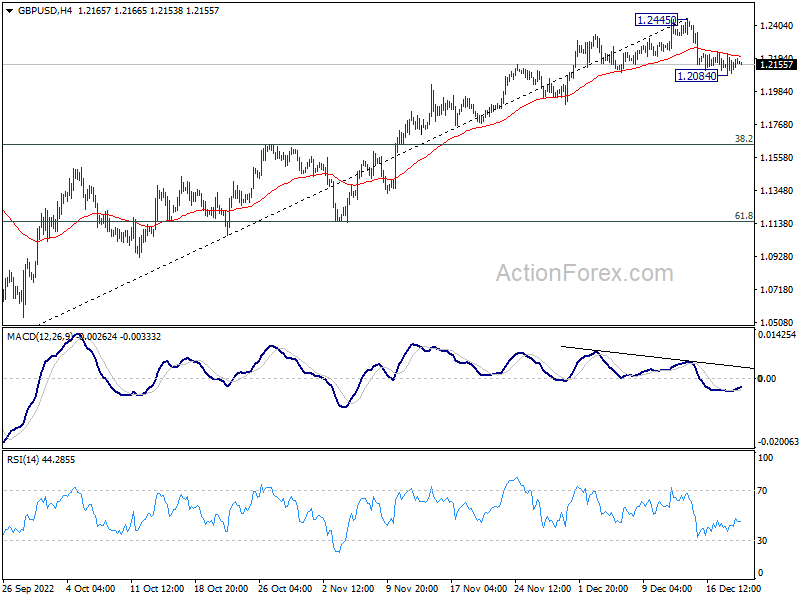
In the bigger picture, rise from 1.0351 medium term bottom is at least correcting whole down trend from 1.4248 (2021 high). Further rise is expected as long as 1.1644 resistance turned support holds. Next target is 61.8% retracement of 1.4248 to 1.0351 at 1.2759. Sustained break there will pave the way back to 1.4248. This will remain the favored case as long as 55 day EMA (now at 1.1874) holds.
EUR/USD Daily Outlook
Daily Pivots: (S1) 1.0582; (P) 1.0621; (R1) 1.0662; More...
EUR/USD still bounded in sideway trading below 1.0733 and intraday bias remains neutral for the moment. Further rally is expected as long as 1.0481 resistance turned support holds. Firm break of 61.8% projection of 0.9729 to 1.0481 from 1.0289 at 1.0754 will pave the way to 100% projection at 1.1041. However, firm break of 1.0481 will confirm short term topping and bring deeper fall to 1.0289 support.
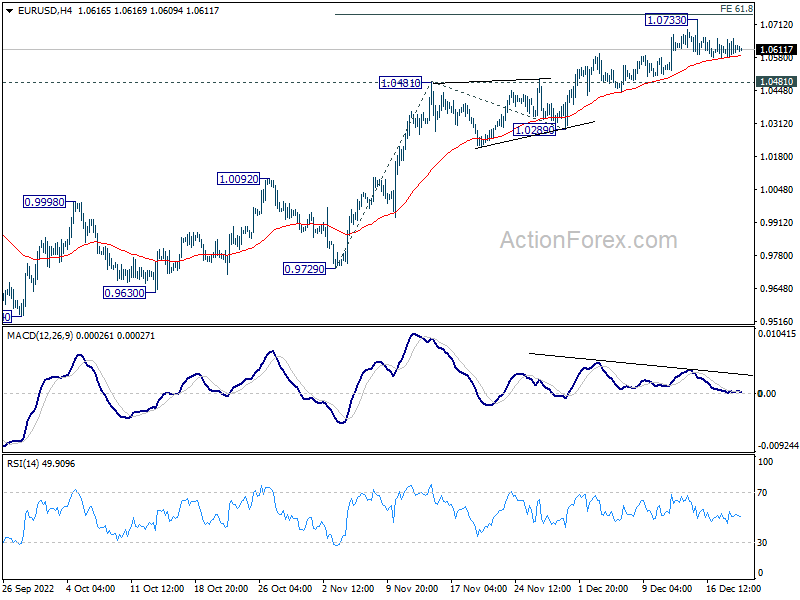
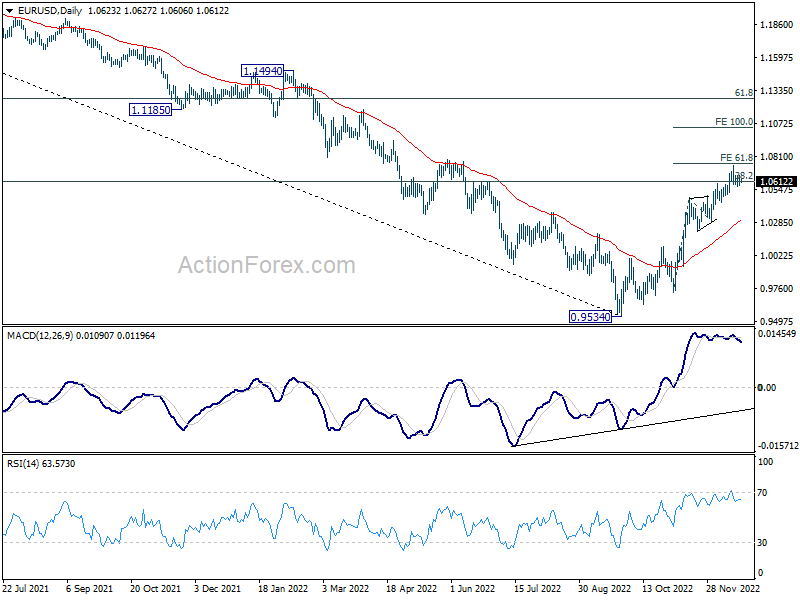
In the bigger picture, focus stays on 38.2% retracement of 1.2348 (2021 high) to 0.9534 at 1.0609. Rejection by 1.0609 will suggest that price actions from 0.9534 medium term bottom are developing into a corrective pattern. Thus, medium bearishness is retained for another fall through 0.9534 at a later stage. However, sustained break of 1.0609 will raise the chance of trend reversal and target 61.8% retracement at 1.1273.
Yen Rally Takes a Breather, Dollar and Canadian Await Data
The markets become rather directionless again in Asian session. Yen is paring some gains as the boost from BoJ faded. Swiss Franc, Aussie and Kiwi are on the weaker side too. On the other hand, Canadian and US Dollar are the stronger ones for the day. Both are awaiting economic data release, including Canadian CPI and US consumer confidence. Meanwhile, Euro and Sterling are mixed.
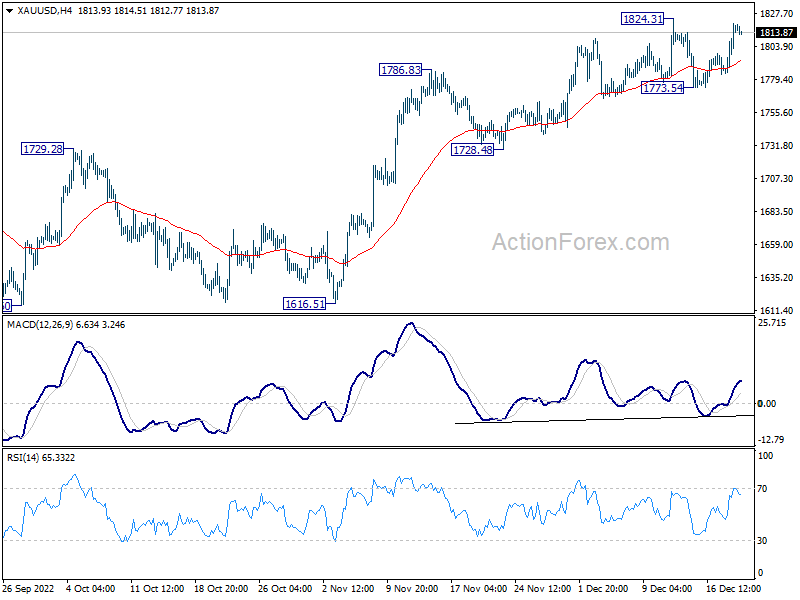
Technically, Gold rebounded strongly after retreating to 1773.54. Immediate focus is back on 1824.31 resistance. Firm break there will resume larger rise from 1616.51. On the downside, however, break of 1773.54 will bring deeper decline back to 1728.48 support, as a corrective move. The breakout in Gold could be an early indicate of the next move in Dollar, in particular in EUR/USD.
In Asia, Nikkei closed down -0.61%. Hong Kong HSI is up 0.13%. China Shanghai SSE is down -0.28%. Singapore Strait Times is up 0.06%. Japan 10-year yield is up 0.0686 at 0.486, getting closer to new cap at 0.50%. Overnight, DOW rose 0.28%. S&P 500 rose 0.10%. NASDAQ rose 0.01%. 10-year yield rose 0.103 to 3.684.
IMF: BoJ YCC adjustment a sensible step
Ranil Salgado, the IMF's mission chief to Japan, said that "with uncertainty around the inflation outlook, the Bank of Japan's adjustment of yield curve control settings is a sensible step including given concerns about bond market functioning."
"Providing clearer communications on the conditions for adjusting the monetary policy framework would help anchor market expectations and strengthen the credibility of the Bank of Japan's commitment to achieve its inflation target," he said.
BoJ announced to raise the cap on 10-year JGB yield from 0.25% to 0.50% yesterday, to " correct distortions in the yield curve".
Australia leading index consistent with below trend growth well into 2023
Australia Westpac-MI leading index dropped from -0.84% to -0.92% in November. Growth rate was, thus, in negative territory for the fourth consecutive month. The data is consistent with below trend growth well into 2023. Drivers of weakness are the RBA interest rate and commodity prices.
Westpac expects another 25bps rate hike by RBA in February, "give the outlook for wages; inflation and economic growth". It expects wages and inflation challenges to persist through early months of 2023, requiring "further increase of 25bps in both March and May.
Looking ahead
Germany Gfk consumer confidence and UK public sector net borrowing will be released in European session. Later in the day, Canada CPI and US consumer confidence will be the main features.
EUR/USD Daily Outlook
Daily Pivots: (S1) 1.0582; (P) 1.0621; (R1) 1.0662; More...
EUR/USD still bounded in sideway trading below 1.0733 and intraday bias remains neutral for the moment. Further rally is expected as long as 1.0481 resistance turned support holds. Firm break of 61.8% projection of 0.9729 to 1.0481 from 1.0289 at 1.0754 will pave the way to 100% projection at 1.1041. However, firm break of 1.0481 will confirm short term topping and bring deeper fall to 1.0289 support.
In the bigger picture, focus stays on 38.2% retracement of 1.2348 (2021 high) to 0.9534 at 1.0609. Rejection by 1.0609 will suggest that price actions from 0.9534 medium term bottom are developing into a corrective pattern. Thus, medium bearishness is retained for another fall through 0.9534 at a later stage. However, sustained break of 1.0609 will raise the chance of trend reversal and target 61.8% retracement at 1.1273.
Economic Indicators Update
| GMT | Ccy | Events | Actual | Forecast | Previous | Revised |
|---|---|---|---|---|---|---|
| 21:45 | NZD | Trade Balance (NZD) Nov | -1863M | -2062M | -2129M | -2298M |
| 23:30 | AUD | Westpac Leading Index Nov | -0.10% | -0.10% | 0.00% | |
| 07:00 | EUR | Germany Gfk Consumer Confidence Jan | -38 | -40.2 | ||
| 07:00 | GBP | Public Sector Net Borrowing (GBP) Nov | 10.3B | 12.7B | ||
| 13:30 | CAD | CPI M/M Nov | 0.40% | 0.70% | ||
| 13:30 | CAD | CPI Y/Y Nov | 7.40% | 6.90% | ||
| 13:30 | CAD | CPI Median Y/Y Nov | 4.90% | 4.80% | ||
| 13:30 | CAD | CPI Trimmed Y/Y Nov | 5.30% | 5.30% | ||
| 13:30 | CAD | CPI Common Y/Y Nov | 6.10% | 6.20% | ||
| 13:30 | USD | Current Account (USD) Q3 | -222B | -251B | ||
| 15:00 | USD | Existing Home Sales Nov | 4.20M | 4.43M | ||
| 15:00 | USD | Consumer Confidence Dec | 101 | 100.2 | ||
| 15:30 | USD | Crude Oil Inventories | 2.5M | 10.2M |
Technical Outlook and Review
USD/JPY:
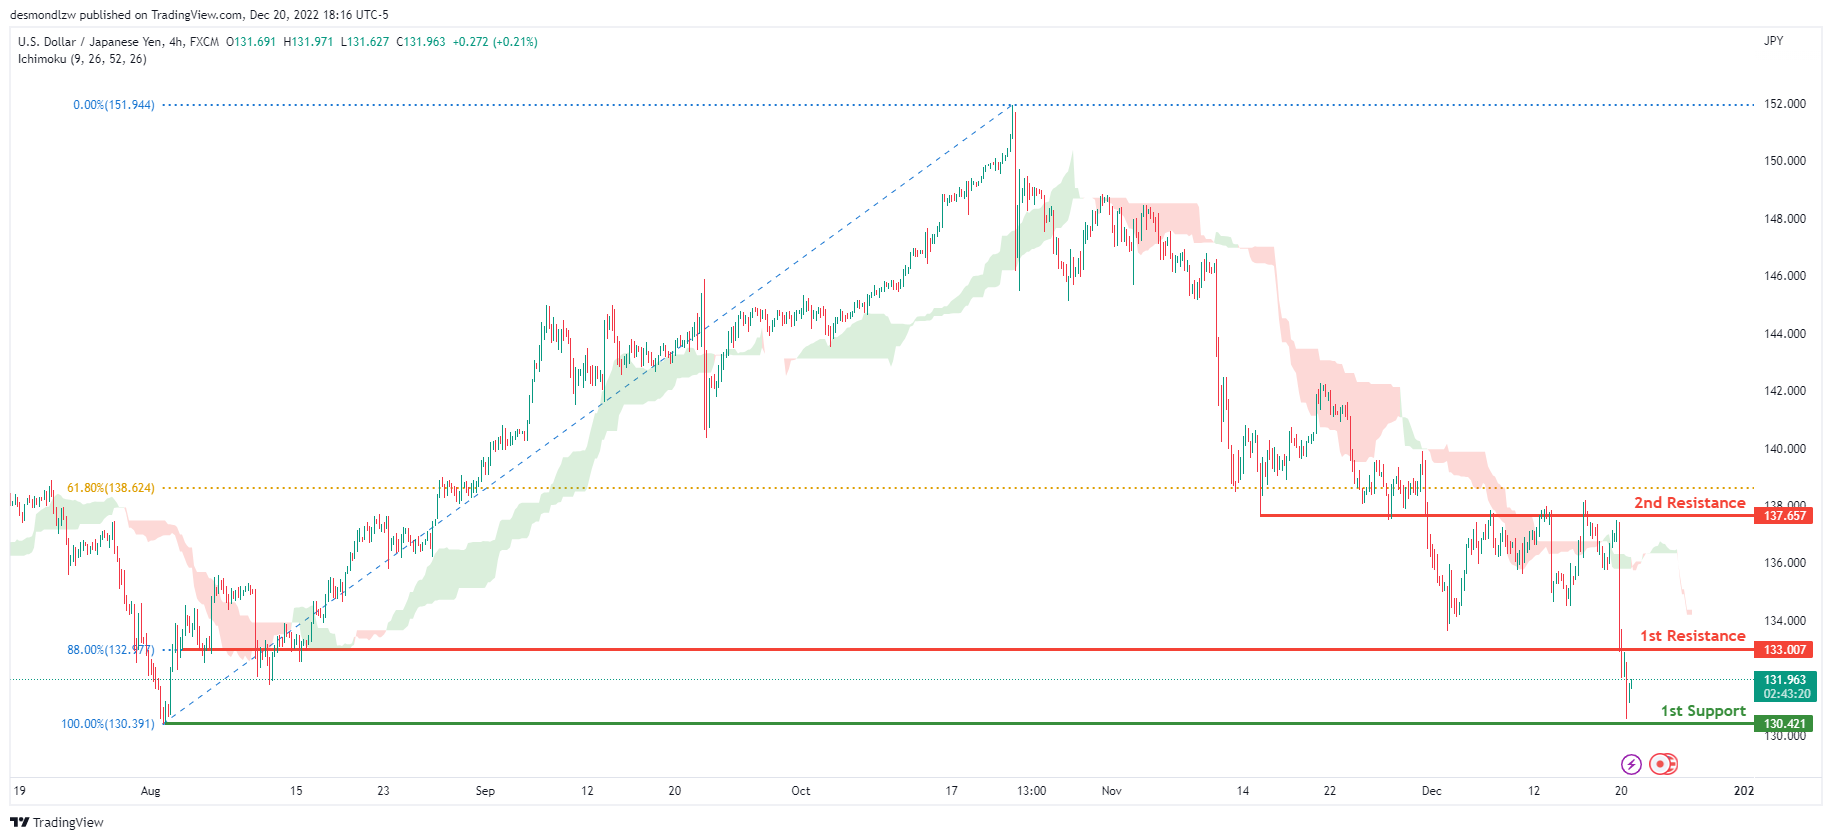
Looking at the H4 chart, my overall bias for USDJPY is bearish due to the current price being below the Ichimoku cloud, indicating a bearish market. If this bearish momentum continues, expect price to possibly head towards the 1st support at 130.421, where the previous swing low is located. In an alternate scenario, price could possibly head back up towards the 1st resistance level at 133.007 where the 88% Fibonacci line is.
Areas of consideration:
- H4 time frame, 1st resistance at 137.657
- H4 time frame, 2nd resistance at 140.356
- H4 time frame, 1st support at 133.007
DXY:
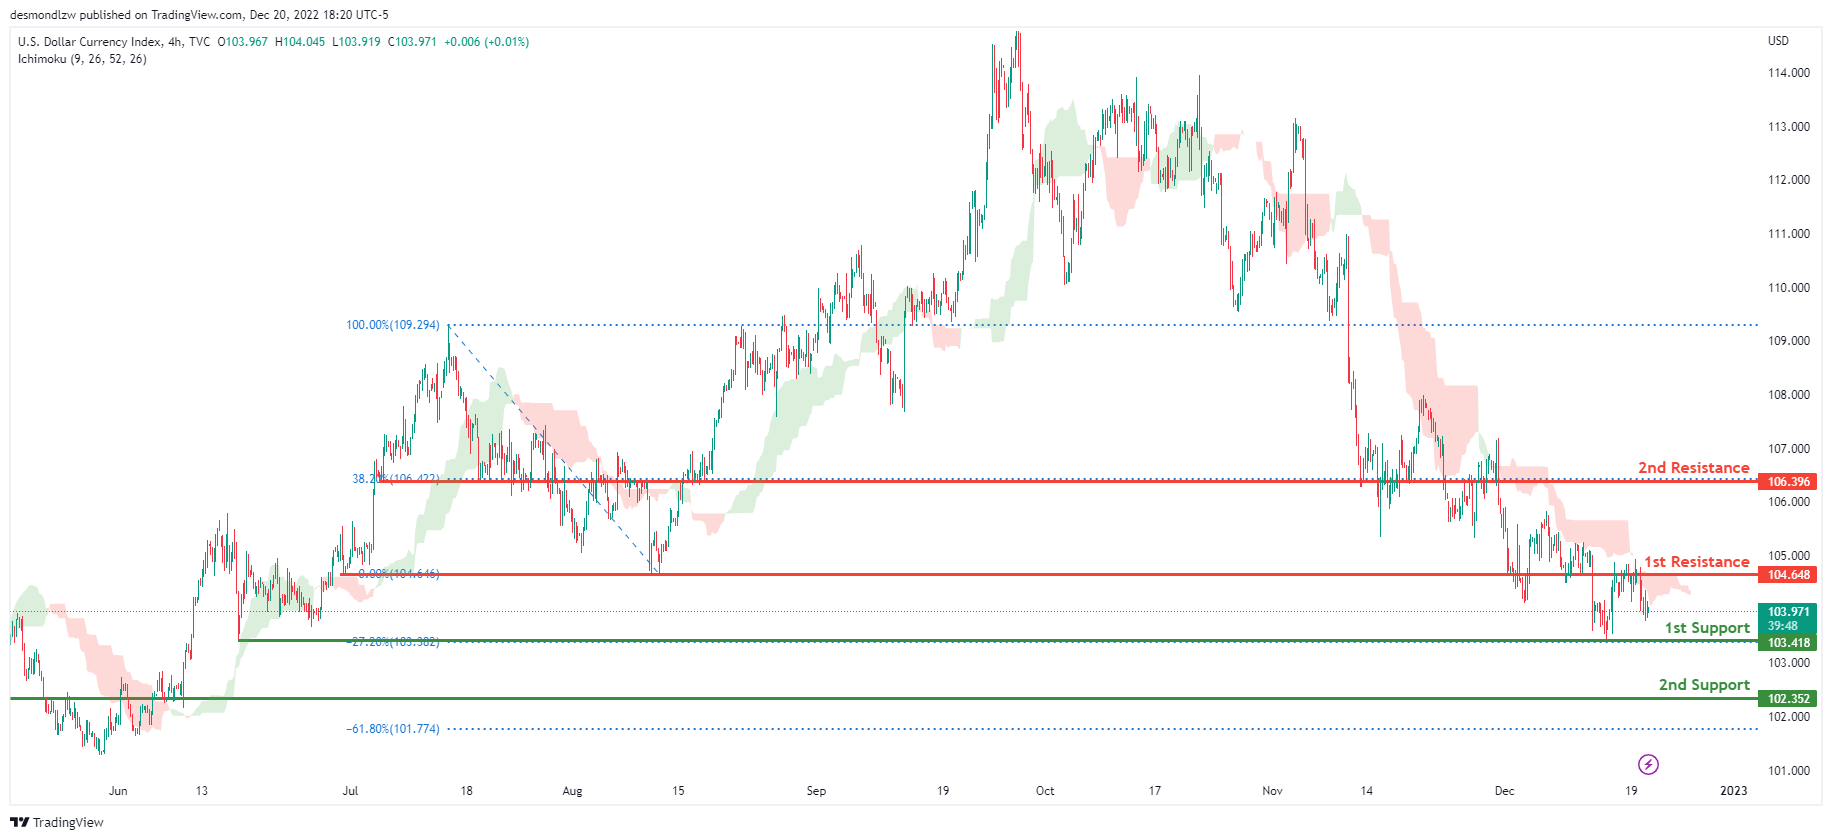
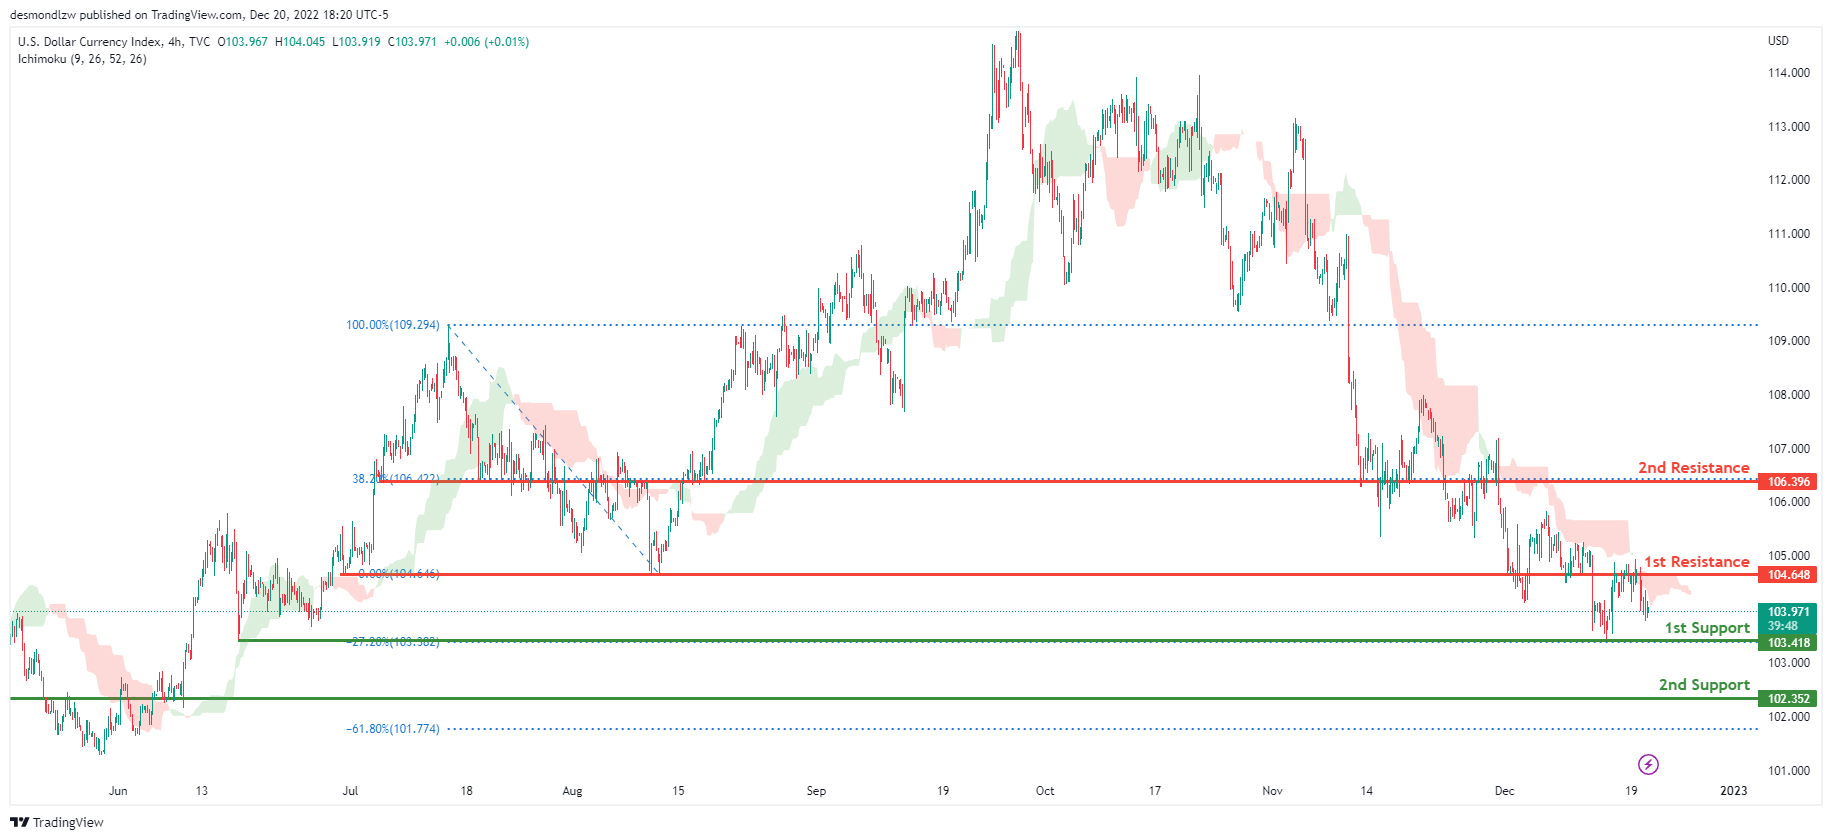
On the H4 chart, the overall bias for DXY is bearish. To add confluence to this, the price is below the Ichimoku cloud which indicates a bearish market. If this bearish momentum continues, expect the price to possibly break the 1st support line at 103.418, where the -27.2% Fibonacci expansion line is before heading towards the 2nd support at 102.352, where the -61.8% Fibonacci expansion line is. In an alternative scenario, price could head back up and break the 1st resistance line resistance at 104.648, where the previous swing low is before heading towards the 2nd resistance at 106.396, where the 38.2% Fibonacci line is.
Areas of consideration:
- H4 time frame, 1st resistance at 104.648
- H4 time frame, 1st support at 103.418
- H4 time frame, 2nd support at 102.352
EUR/USD:
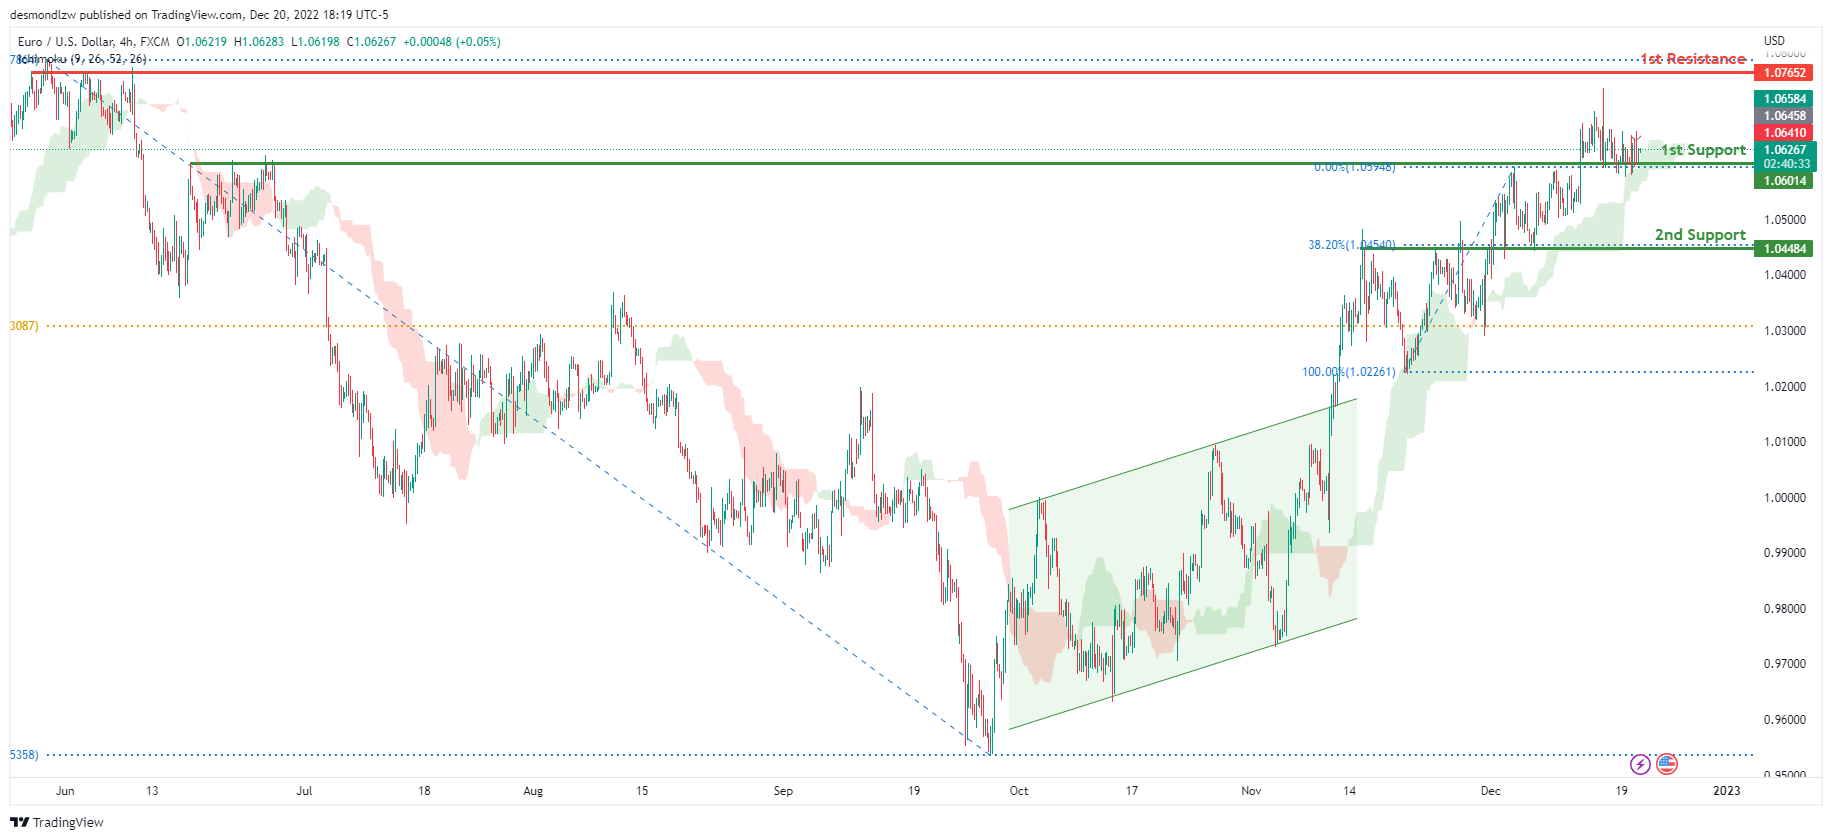
Looking at the H4 chart, my overall bias for EURUSD is bullish due to the current price being above the Ichimoku cloud, indicating a bullish market. To add confluence to this bias, price has also broken above the ascending bullish channel. If this bullish momentum continues, expect the price to possibly head towards the 1st resistance at 1.07652, where the previous swing high is. In an alternate scenario, price could possibly head back down to break the 1st support level at 1.06014, where the previous swing high and 78.6% Fibonacci line are located before heading towards the 2nd support at 1.04484, where the 38.2% Fibonacci line is.
Areas of consideration :
- H4 1st resistance at 1.07652
- H4 1st support at 1.06014
- H4 2nd support at 1.04484
GBP/USD:
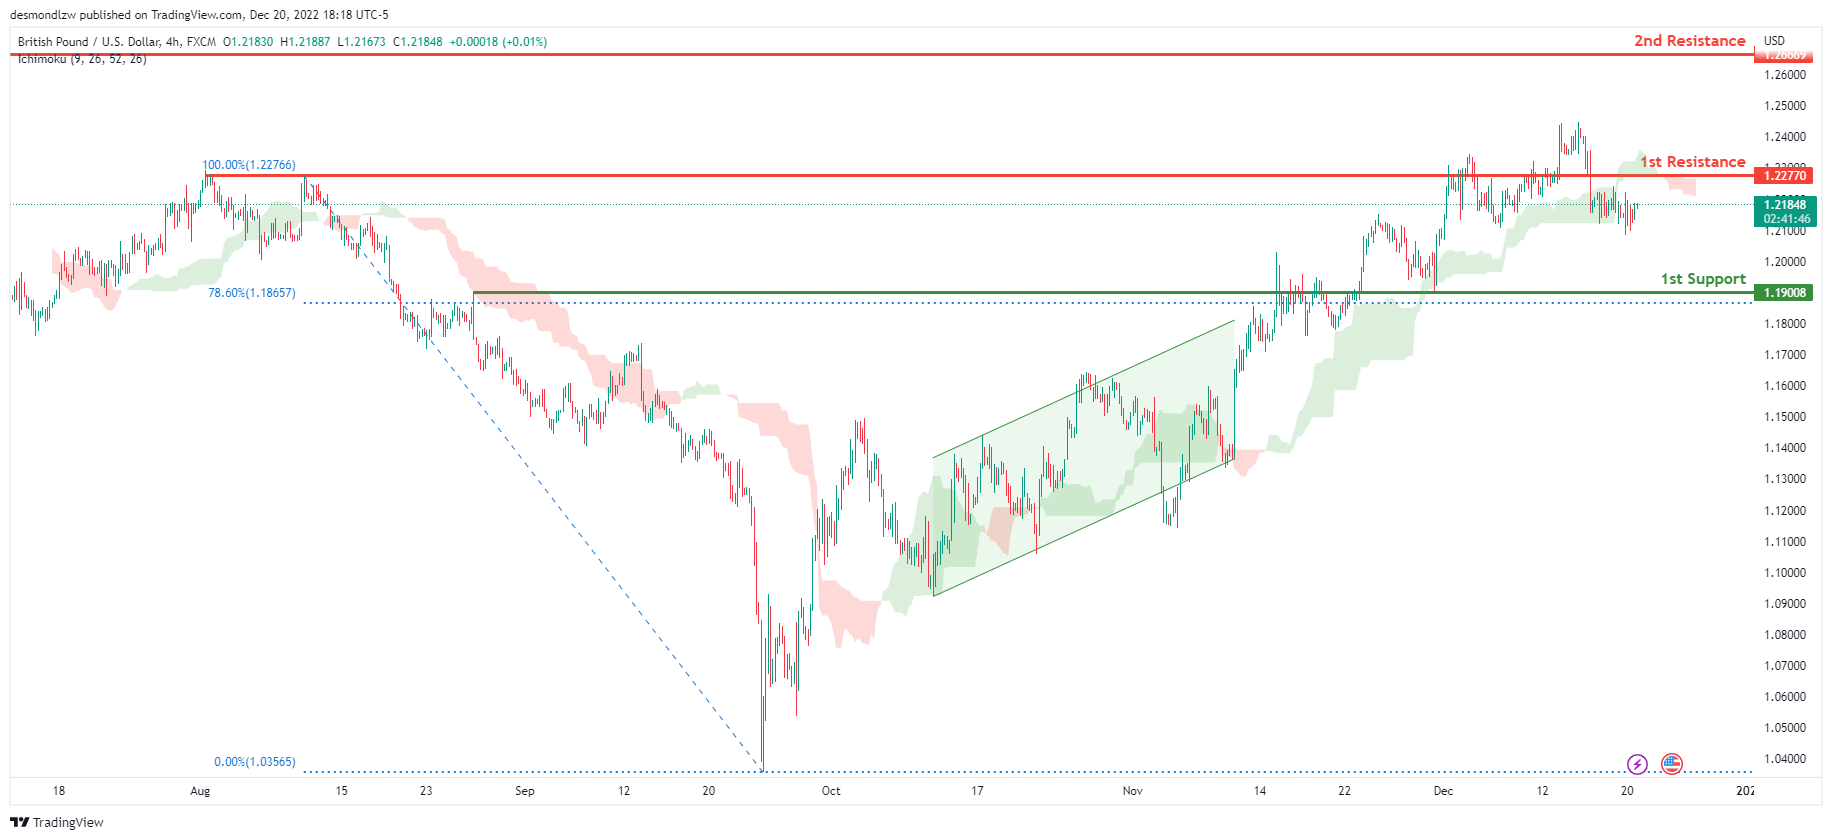
Looking at the H4 chart, my overall bias for GBPUSD is bearish due to the current price being below the Ichimoku cloud, indicating a bearish market. If this bearish momentum continues, expect price to possibly head towards the 1st support at 1.19008, where the 78.6% Fibonacci line is. In an alternate scenario, price could possibly head back up towards the 1st resistance level at 1.22770, where the previous swing high is.
Areas of consideration:
- H4 1st resistance at 1.22770
- H4 1st support at 1.19008
USD/CHF:
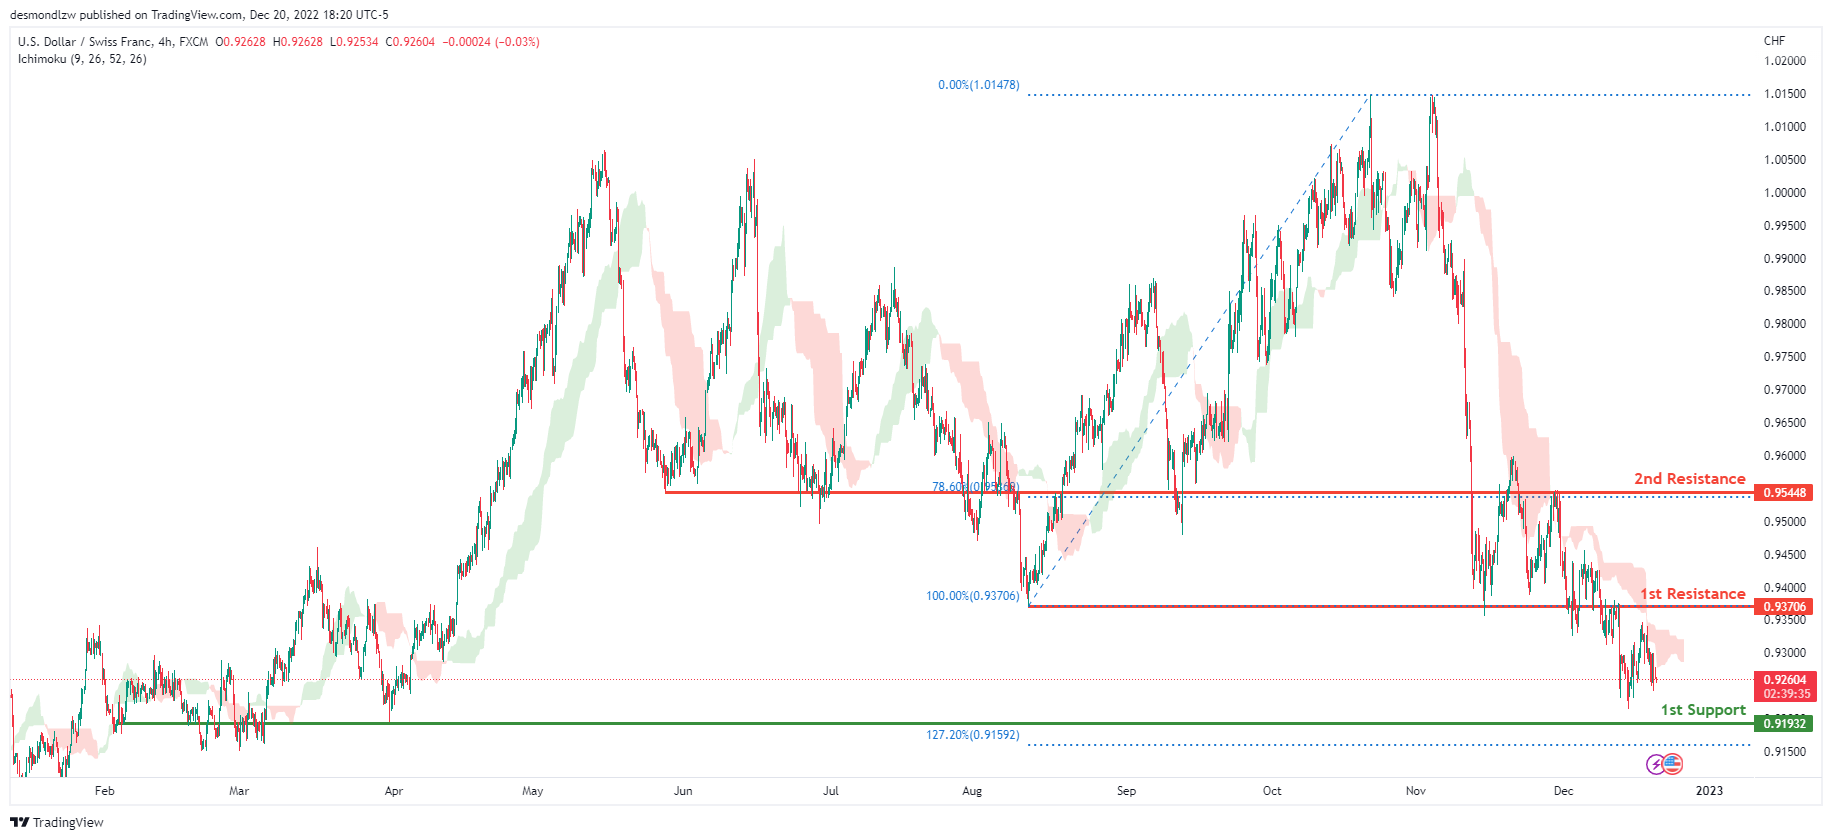
The overall bias for USDCHF on the H4 chart is bearish. In addition, the price is below the Ichimoku cloud, indicating a bearish market. If the current bearish trend continues, expect the price to head back down towards the 1st support line at 0.91932, where the previous swing low and 12.72% Fibonacci extension line is . In an alternative scenario, price could possibly head up towards the 1st resistance at 0.93706, where the previous swing low is .
Areas of consideration
- H4 1st support at 0.91932
- H4 1st resistance at 0.93706
XAU/USD (GOLD):
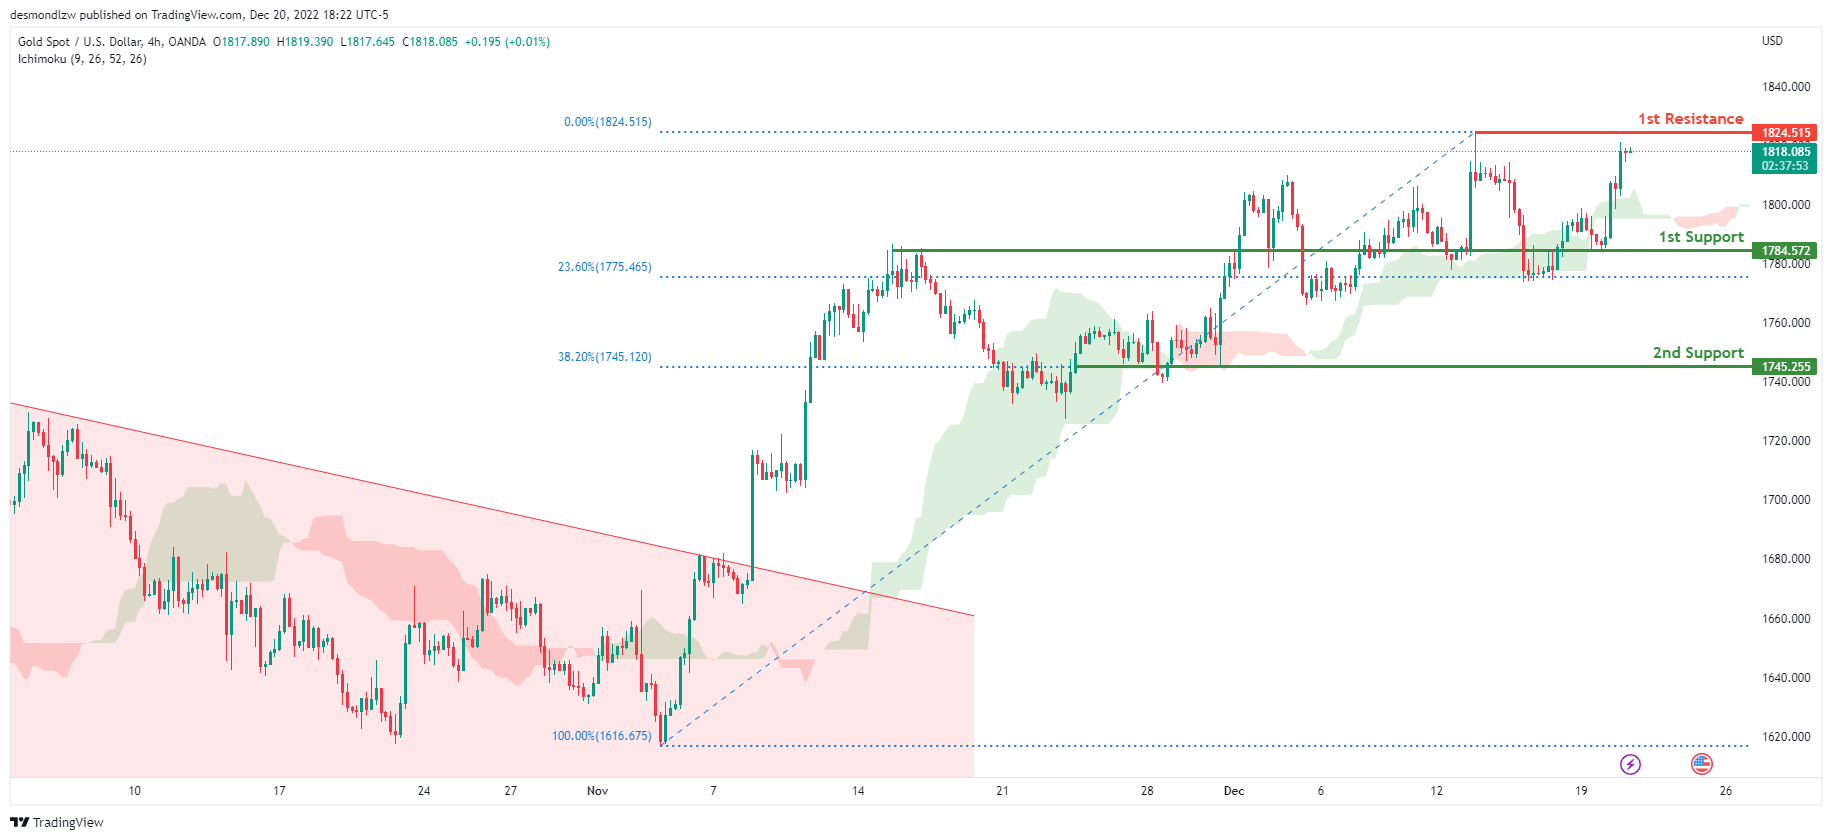
Looking at the H4 chart, my overall bias for XAUUSD is bullish due to the current price being above the Ichimoku cloud, indicating a bullish market. If this bullish momentum continues, expect the price to continue heading towards the 1st resistance at 1824.515 where the recent high is. In an alternative scenario, price could possibly head back down to break the 1st support at 1784.572, where the previous high is before heading towards the 2nd support at 1745.255, where the 38.2% Fibonacci line is.
Areas of consideration:
- H4 time frame, 1st resistance at 1824.515
- H4 time frame, 1st support at 1784.572
- H4 time frame, 2nd support at 1745.255
AUD/USD:
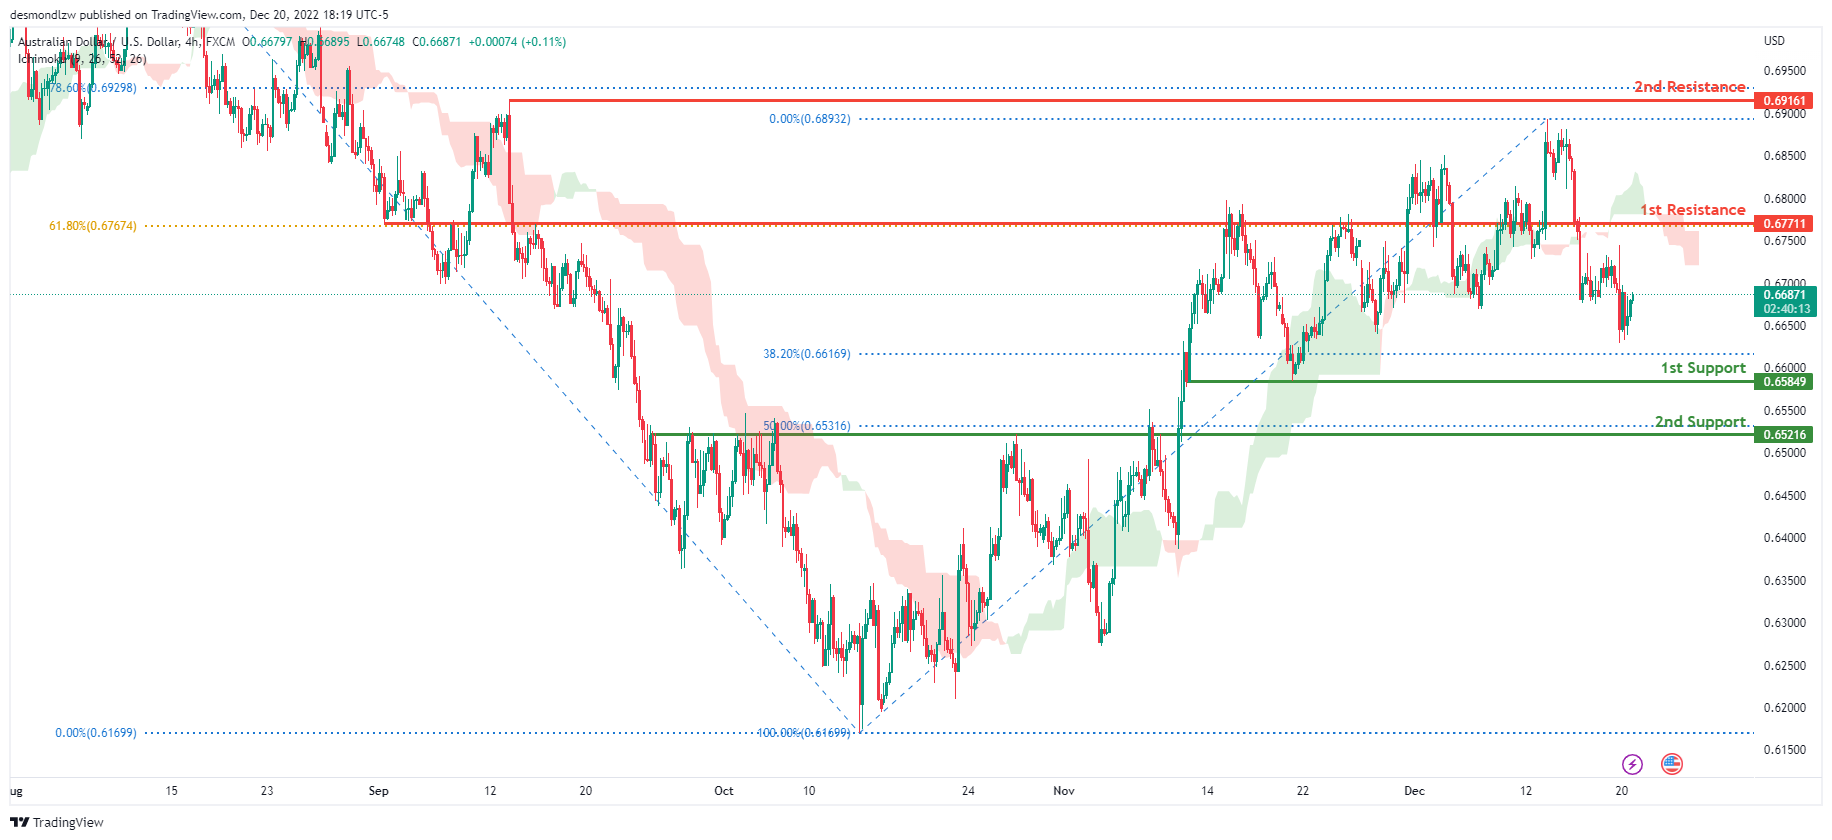
Looking at the H4 chart, my overall bias for AUDUSD is bearish due to the current price being below the Ichimoku cloud, indicating a bearish market. If this bearish momentum continues, expect the price to continue heading towards the 1st support at 0.65849, where the 78.6% Fibonacci line is. In an alternative scenario, price could possibly head back up towards the 1st resistance at 0.67711, where the 61.8% Fibonacci line is
Areas of consideration
- H4, 1st resistance at 0.67711
- H4, 1st support at 0.65849
NZD/USD:
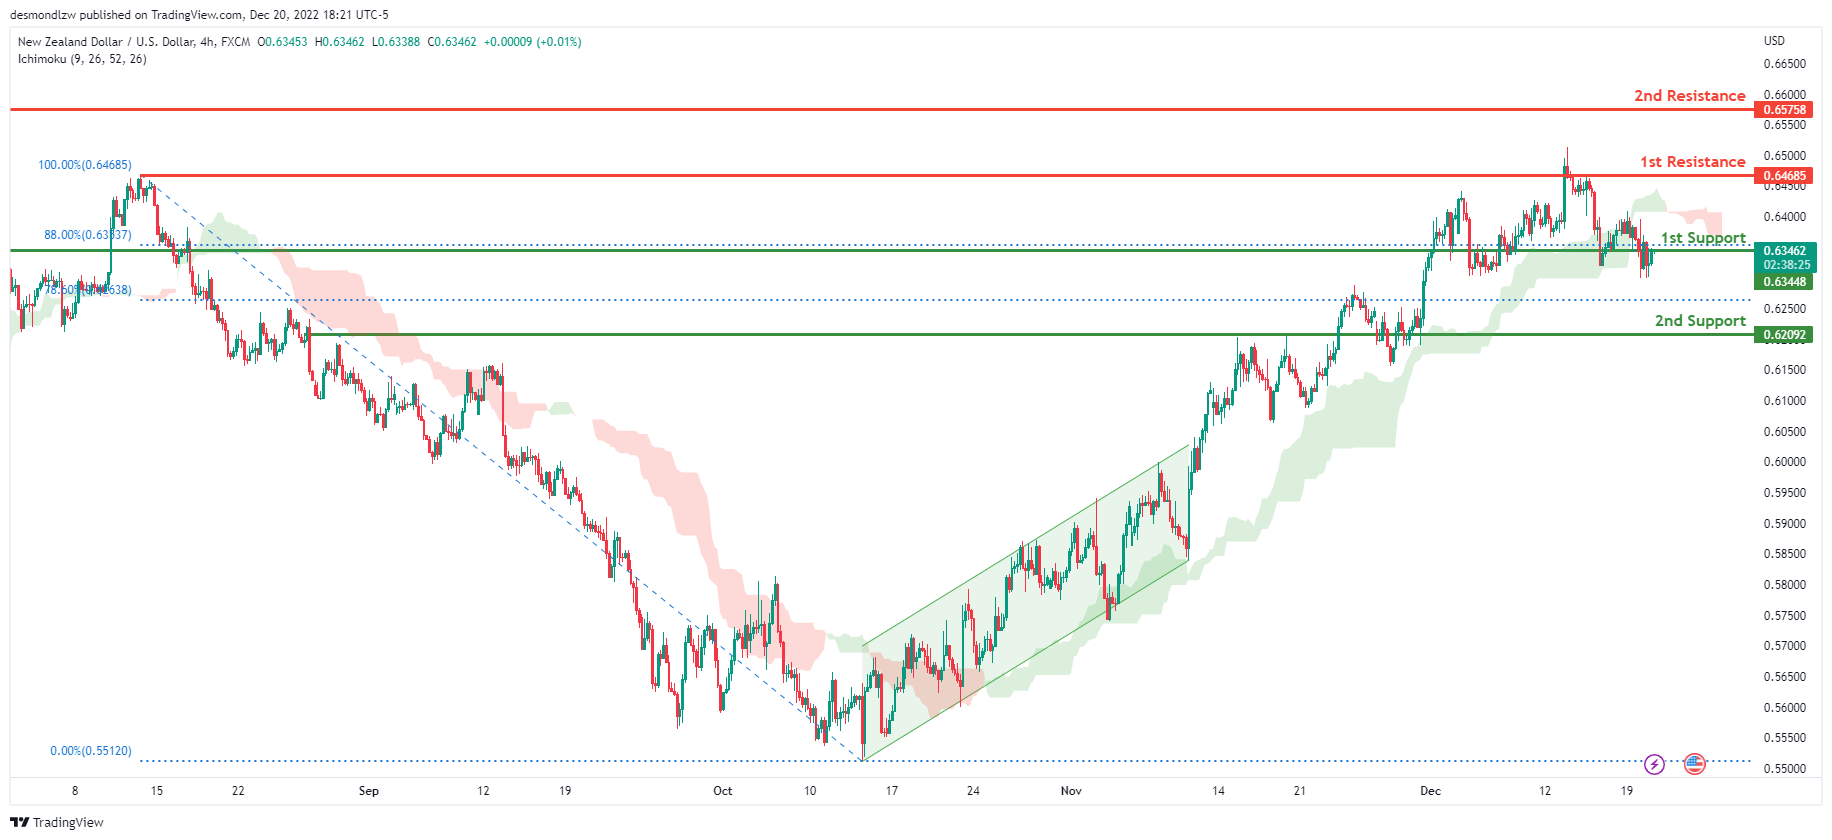
Looking at the H4 chart, my overall bias for NZDUSD is bullish due to the current price being above the Ichimoku cloud, indicating a bullish market.
To add confluence to this bias, price has broken out of the ascending channel. If this bullish momentum continues, expect the price to possibly break the 1st resistance line at 0.64685, where the previous swing high is before heading towards the 2nd resistance at 0.65758, where the previous swing high is. Alternatively, the price may head back down breaking the 1st support at 0.63448, where the 88% Fibonacci line is before heading towards the 2nd support line at 0.62092, where the 78.6% Fibonacci line is.
Areas of consideration:
- H4 time frame, 1st resistance at 0.64685
- H4 time frame, 2nd resistance at 0.65758
- H4 time frame, 1st support at 0.63448
- H4 time frame, 2nd support at 0.62092
USD/CAD:
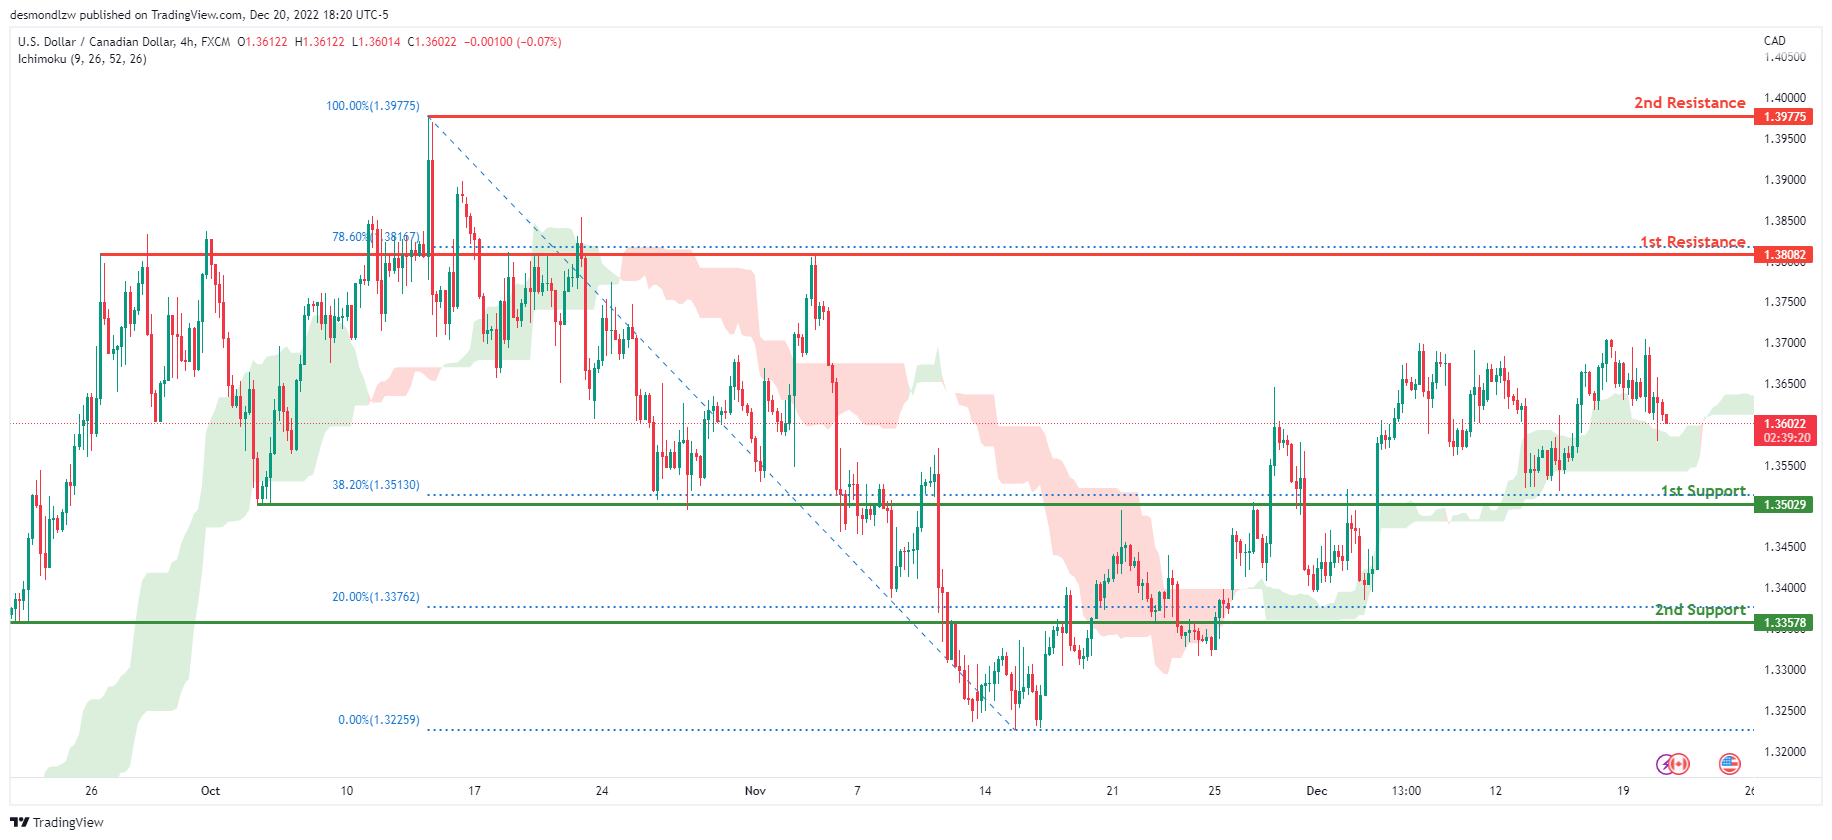
On the H4 chart, the overall bias for USDCAD is bullish. To add confluence to this, the price is crossing above the Ichimoku cloud which indicates a bullish market. If this bullish momentum continues, expect the price to head towards 1st resistance line at 1.38082, where the 78.6% Fibonacci line is. In an alternative scenario, price could head back down to retest the 1st support at 1.35029, where the 38.2% Fibonacci line is.
Areas of consideration:
- H4 time frame, 1st resistance at 1.38082
- H4 time frame, 2nd resistance at 1.39775
- H4 time frame, 1st support at 1.35029
OIL:
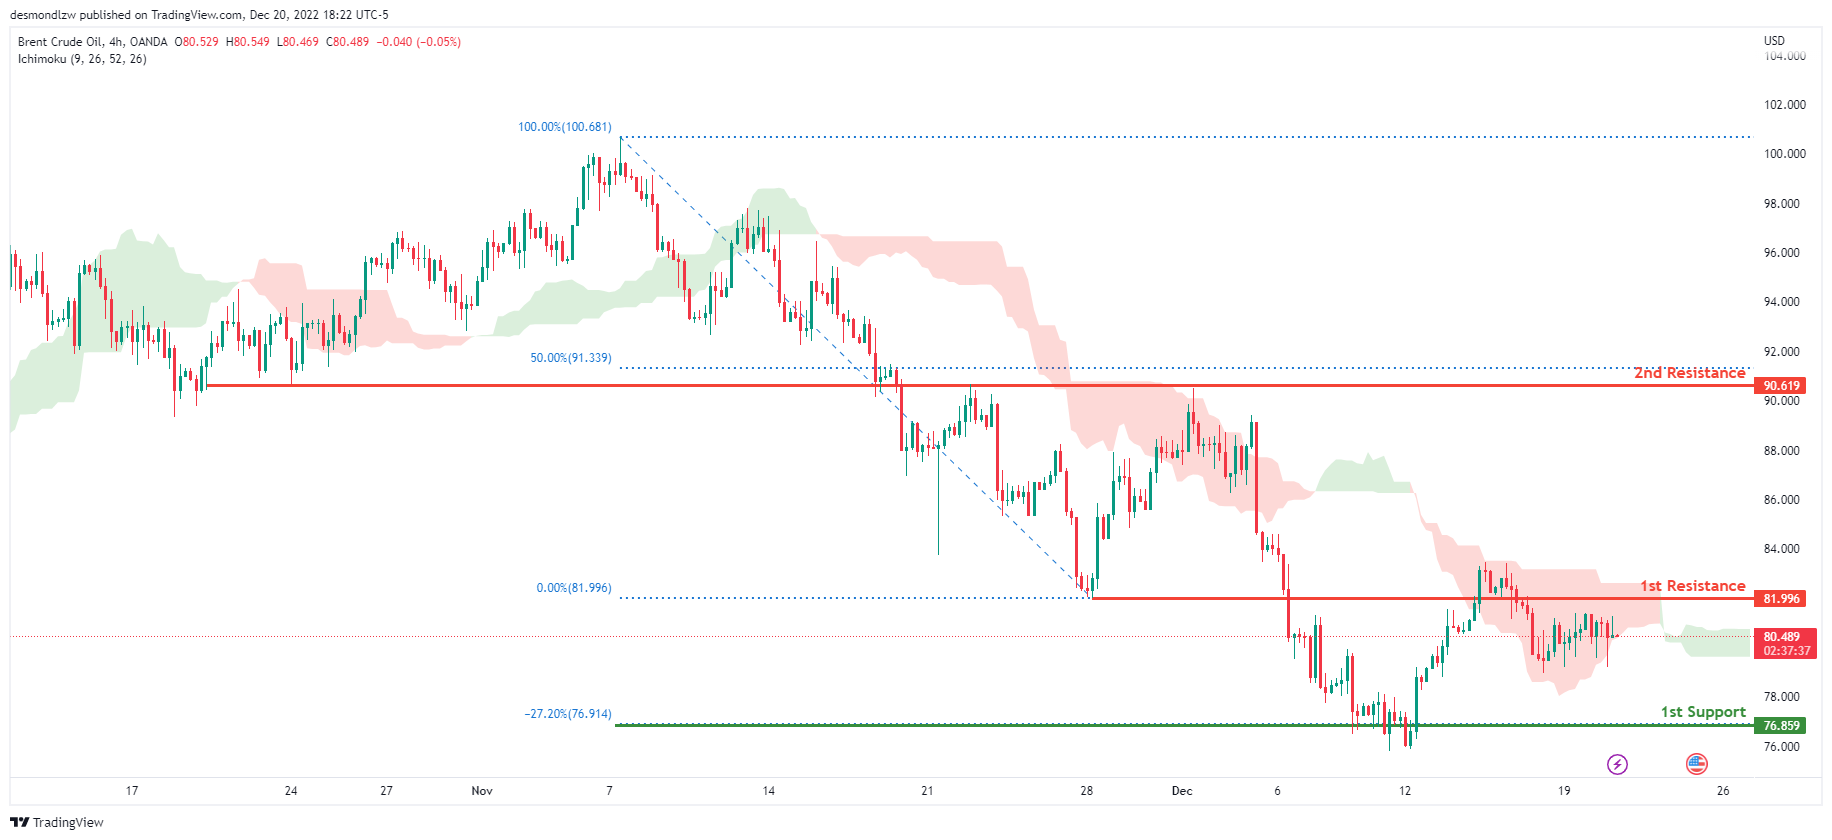
Looking at the H4 chart, my overall bias for BCOUSD is bearish due to the current price crossing below the Ichimoku cloud, indicating a bearish market. If this bearish momentum continues, expect the price to possibly head towards the 1st support line at 76.859, where the -27.2% Fibonacci expansion line is located. In an alternate scenario, price could possibly break the 1st resistance at 81.996, where the previous low is located., before heading towards the 2nd resistance at 90.619, where the 50% Fibonacci line is.
Areas of consideration:
- H4 time frame, 1st resistance at 81.996
- H4 time frame, 2nd resistance at 90.619
- H4 time frame, 1st support at 76.859
Dow Jones Industrial Average:
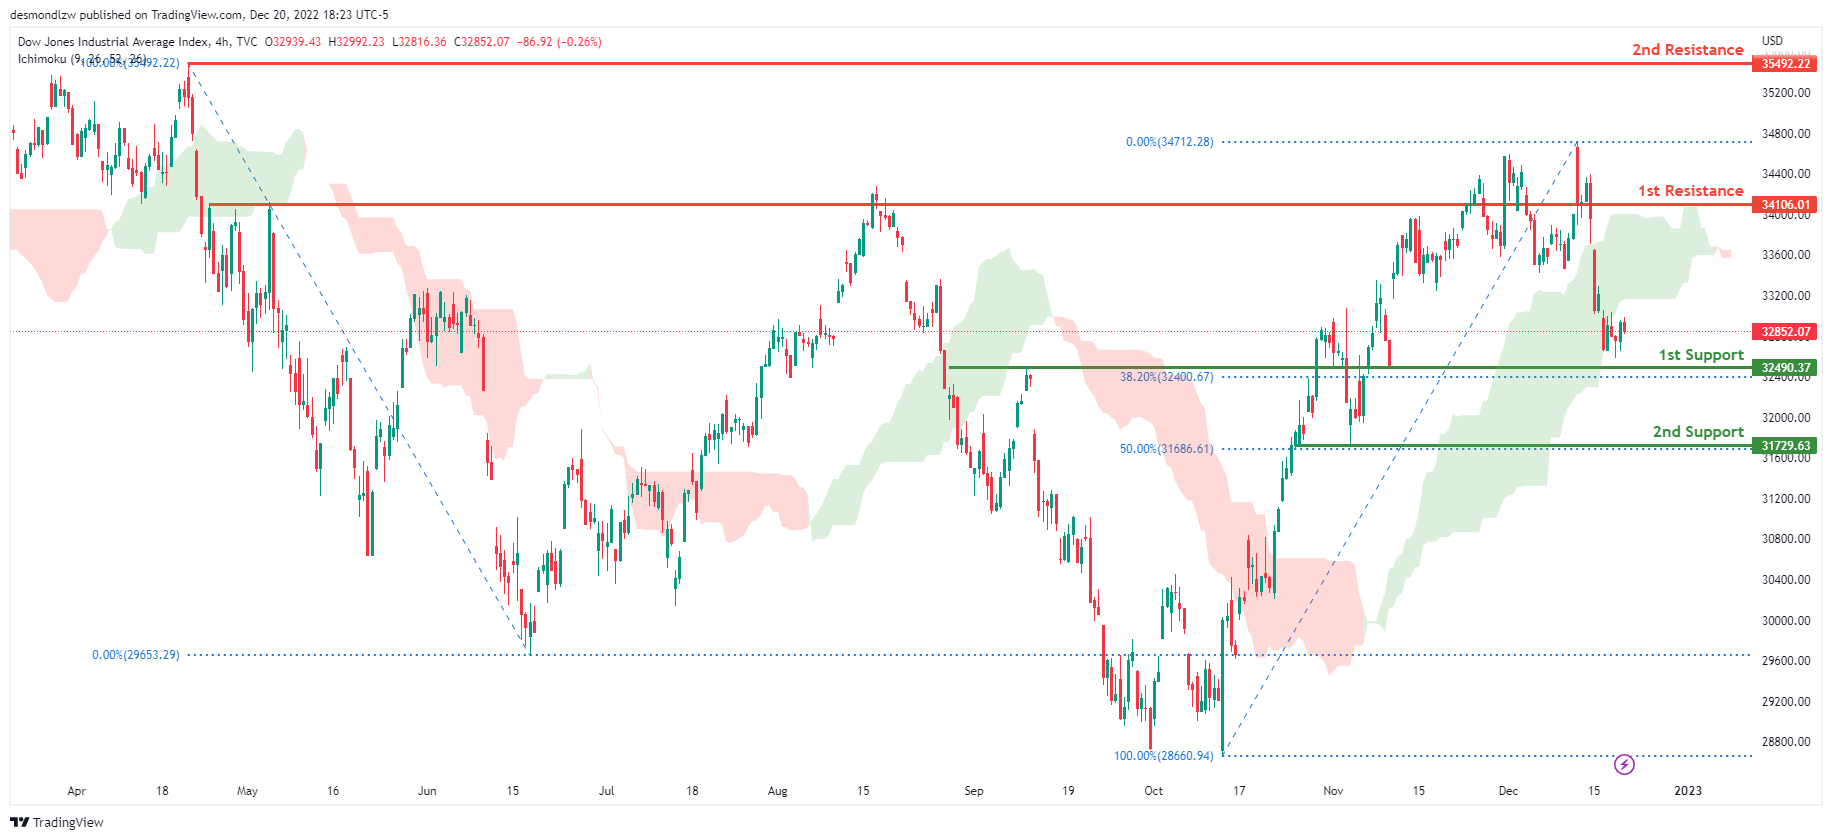
On the H4 chart, the overall bias for DJI is bearish . To add confluence to this, the price is crossing below the Ichimoku cloud which indicates a bearish market. If this bearish momentum continues, expect the price to head back down towards the 1st support at 32490.37, where the 61.8% Fibonacci line is. In an alternative scenario, price could possibly break the 1st resistance line at 34106.01, where the previous swing high is before heading towards the 2nd resistance line at 35492.22, where the previous swing high is.
Areas of consideration:
- H4 time frame, 1st support at 32490.37
- H4 time frame, 1st Resistance at 34106.01
- H4 time frame, 2nd Resistance at 35492.22
DAX:
Looking at the H4 chart, my overall bias for DAX is bearish due to the current price being below the Ichimoku cloud, indicating a bearish market. If this bearish momentum continues, expect price to break the 1st support at 13941 where the previous swing high is before heading towards the 2nd support at 13057, where the 61.8% Fibonacci line is. In an alternative scenario, price could possibly head back up to retest the 1st resistance at 14709, where the previous swing high is.
Areas of consideration:
- H4 time frame, 1st resistance is at 14709
- H4 time frame, 1st support is at 13941
- H4 time frame, 2nd support is at 13057
ETHUSD:
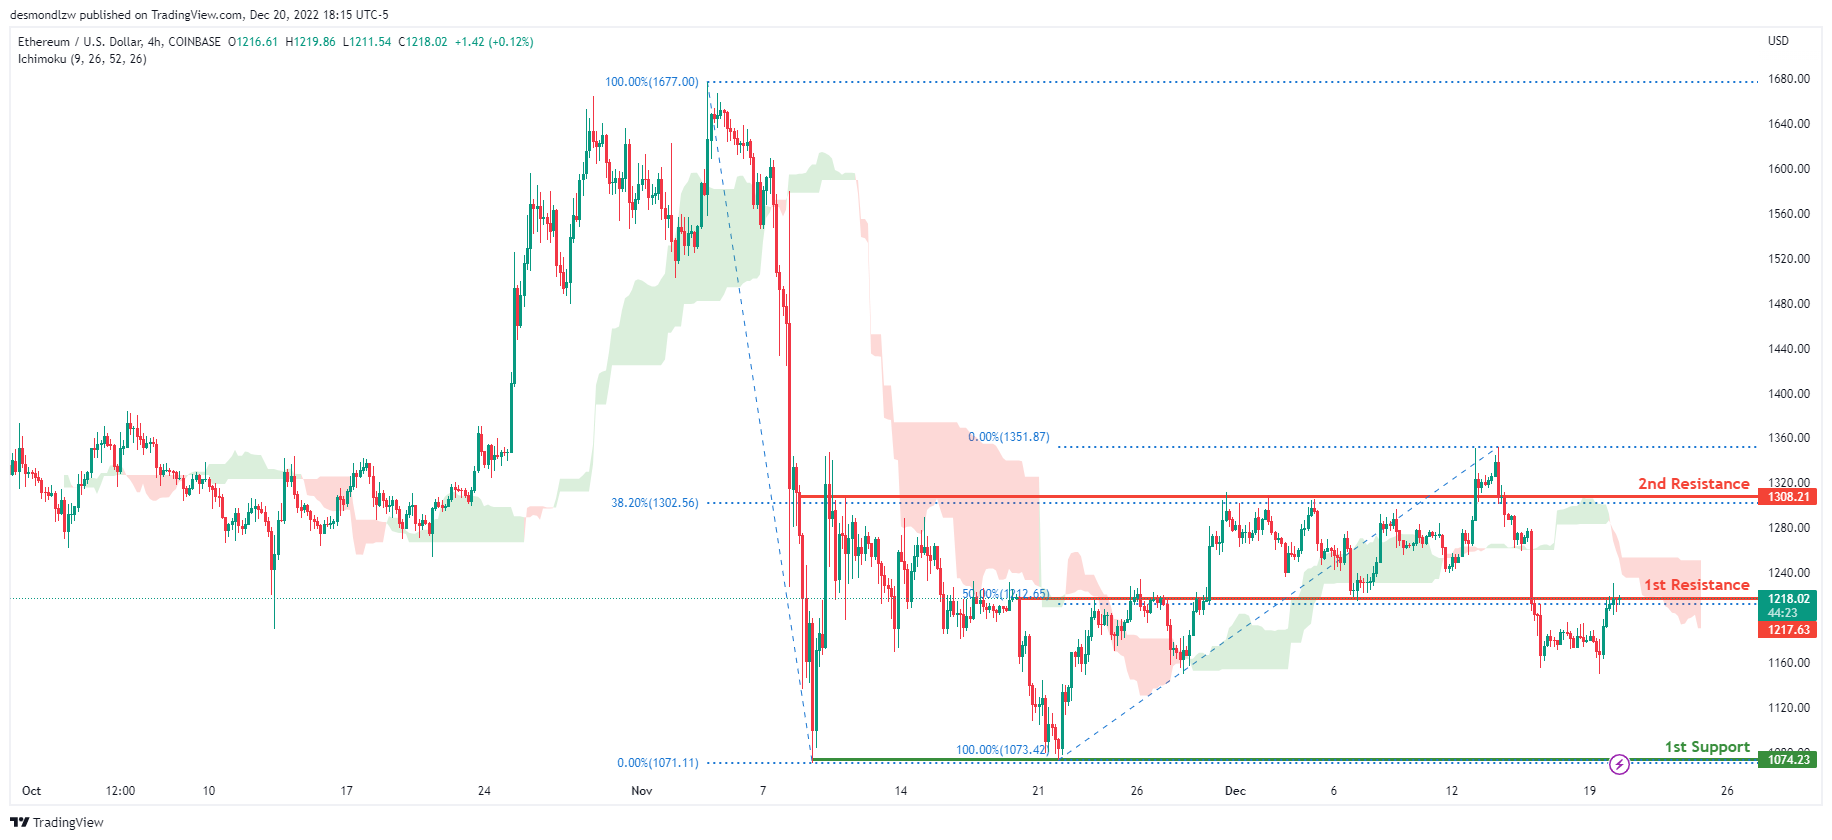
Looking at the H4 chart, my overall bias for ETHUSD is bearish due to the current price crossing below the Ichimoku cloud, indicating a bearish market. If this bearish momentum continues, expect price to head towards the 1st support at 1074.23, where the previous swing low is. In an alternative scenario, price could head back up to retest the 1st resistance at 1217.63, where the 50% Fibonacci line is.
Areas of consideration:
- H4 time frame, 1st resistance of 1217.63
- H4 time frame, 1st support at 1074.23
BTCUSD:
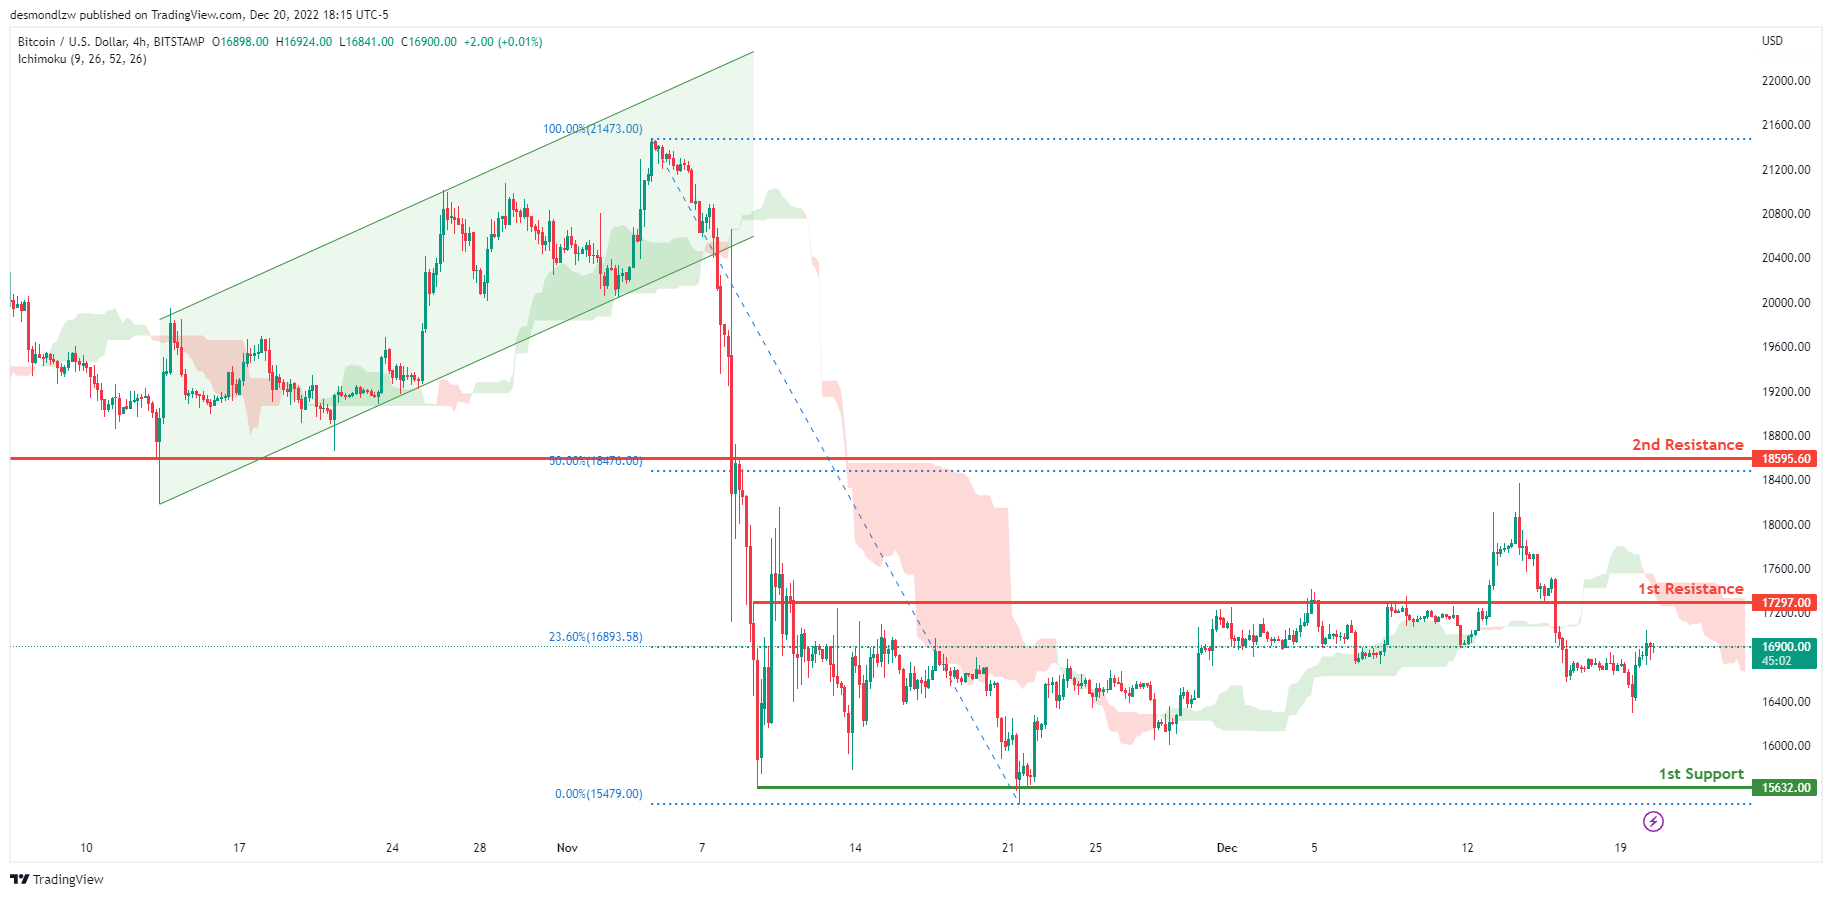
Looking at the H4 chart, my overall bias for BTCUSD is bearish due to the current price being below the Ichimoku cloud, indicating a bearish market. Expecting price to possibly continue heading towards the 1st support at 15632.00, where the previous swing low is. In an alternative scenario, price could possibly head up towards the 1st resistance at 17297.00, where the 23.6% Fibonacci line is.
Areas of consideration:
- H4 time frame, 1st resistance 17297.00
- H4 time frame, 1st support at 15632.00
S&P 500:
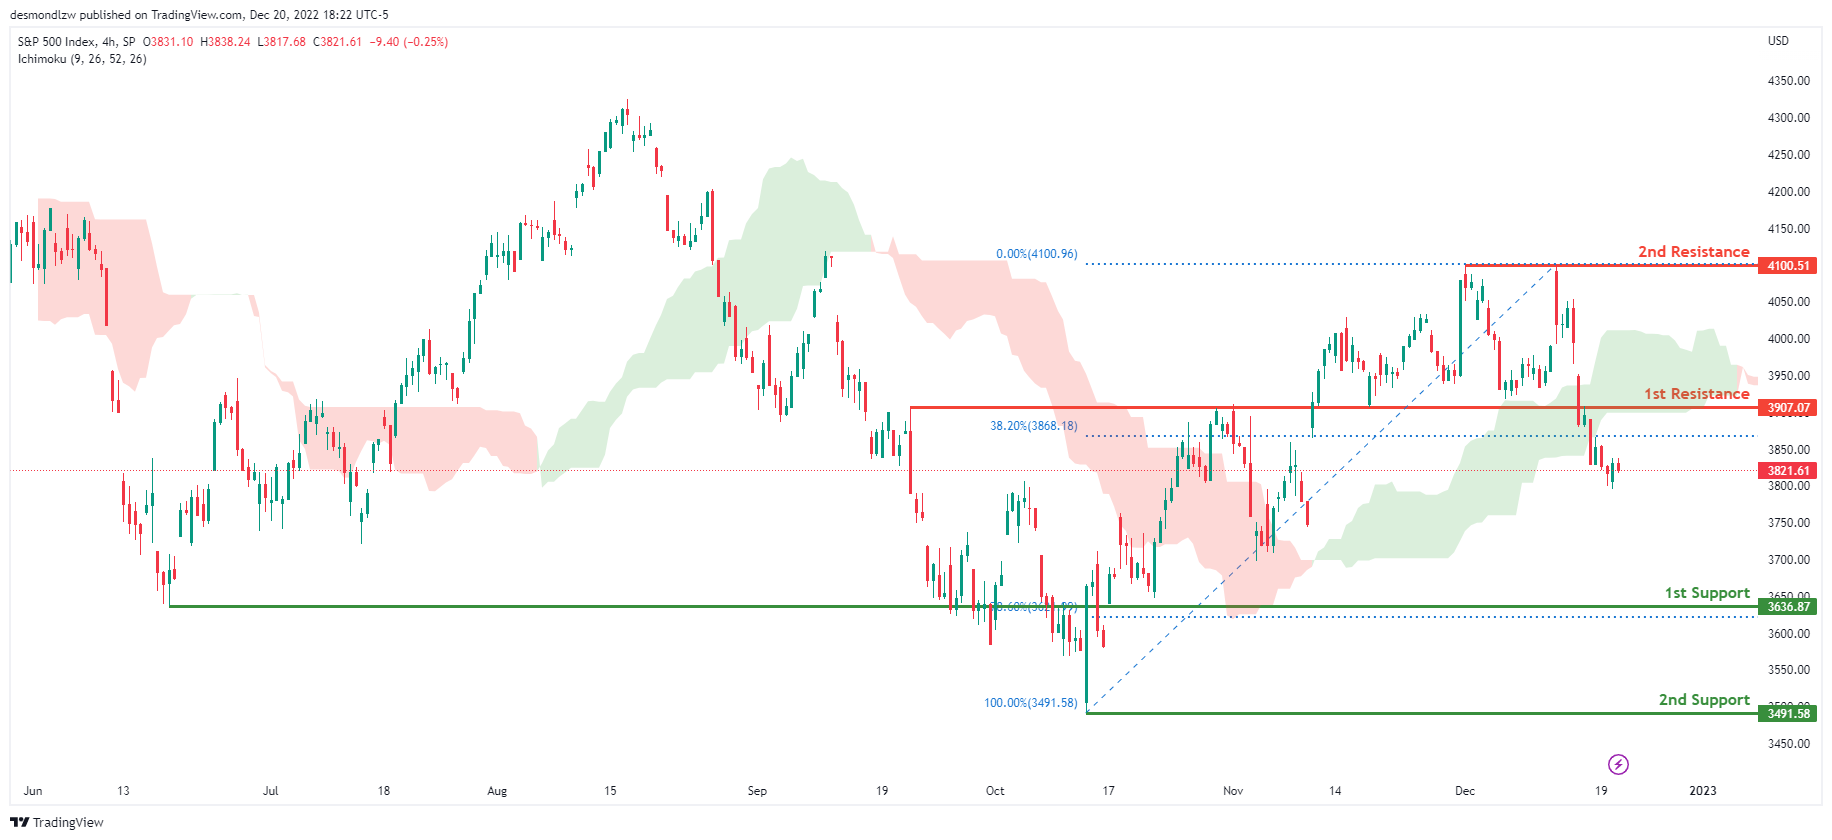
Looking at the H4 chart, my overall bias for S&P500 is bearish due to the current price being below the Ichimoku cloud, indicating a bearish market. If this bearish momentum continues, expect price to continue heading towards the 1st support at 3636.87, where the 78.6% Fibonacci line is. In an alternative scenario, price could possibly head back up to retest the 1st resistance at 3907.07, where the 38.2% Fibonacci line is.
Areas of consideration:
- H4 time frame, 1st support at 3636.87
- H4 time frame, 1st resistance at 3907.07
Australia leading index consistent with below trend growth well into 2023
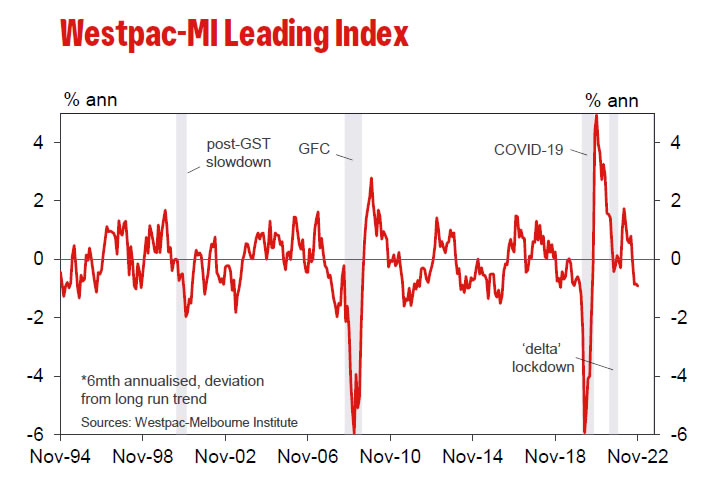
Australia Westpac-MI leading index dropped from -0.84% to -0.92% in November. Growth rate was, thus, in negative territory for the fourth consecutive month. The data is consistent with below trend growth well into 2023. Drivers of weakness are the RBA interest rate and commodity prices.
Westpac expects another 25bps rate hike by RBA in February, "give the outlook for wages; inflation and economic growth". It expects wages and inflation challenges to persist through early months of 2023, requiring "further increase of 25bps in both March and May.
IMF: BoJ YCC adjustment a sensible step
Ranil Salgado, the IMF's mission chief to Japan, said that "with uncertainty around the inflation outlook, the Bank of Japan's adjustment of yield curve control settings is a sensible step including given concerns about bond market functioning."
"Providing clearer communications on the conditions for adjusting the monetary policy framework would help anchor market expectations and strengthen the credibility of the Bank of Japan's commitment to achieve its inflation target," he said.
BoJ announced to raise the cap on 10-year JGB yield from 0.25% to 0.50% yesterday, to " correct distortions in the yield curve".
FTSE Elliott Wave Zigzag Decline in Progress
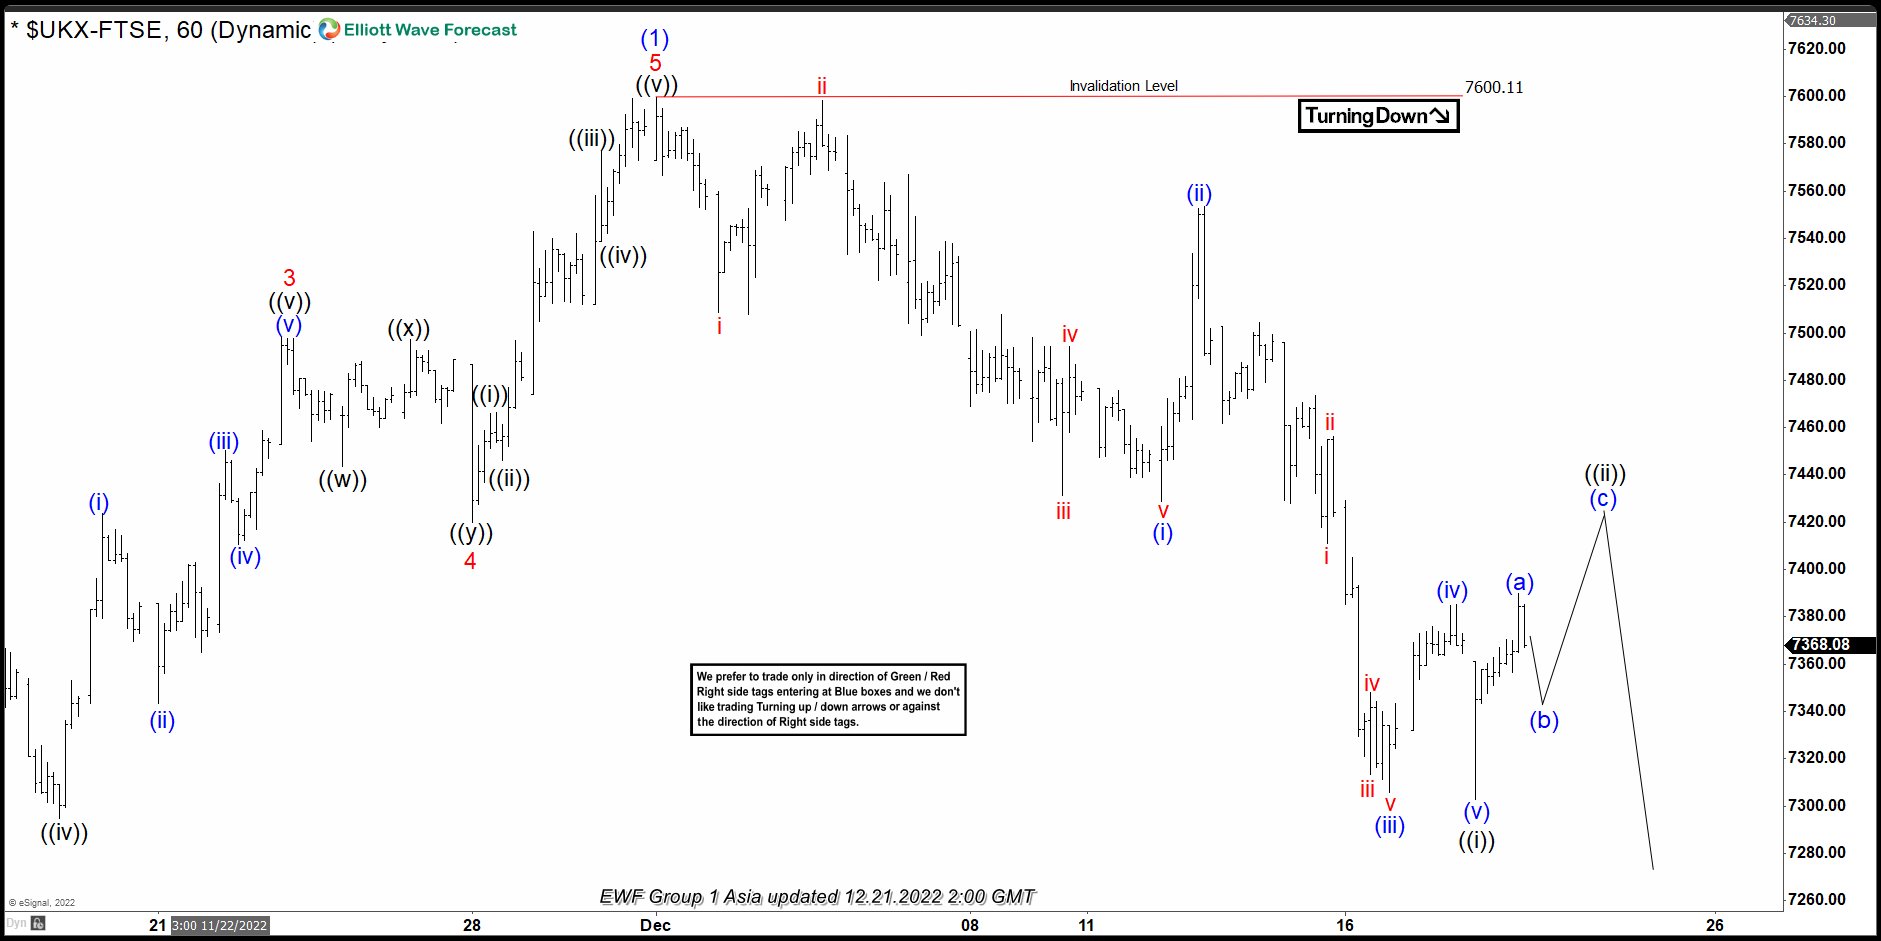
Cycle from 10.13.2022 low in FTSE ended at 7600.11 on 12.1.2022 as wave (1). Subdivision of wave (1) unfolded as a 5 waves impulse structure. Up from 10.13.2020 low, wave 1 ended at 7017.4 and pullback in wave 2 ended at 6864.13. The Index extends higher again in wave 3 towards 7498.34, and pullback in wave 4 ended at 7420. Final leg wave 5 ended at 7599.70 which completed wave (1).
Wave (2) pullback is currently in progress as a zigzag Elliott Wave structure. Down from wave (1), wave (i) ended at 7429 and rally in wave (ii) ended at 7553.36. Index extends lower in wave (iii) towards 7305.72, rally in wave (iv) ended at 7385.38 and final leg lower wave (v) ended at 7302.82. This completed wave ((i)) of A. Index should now rally in wave ((ii)) of A to correct cycle from 12.1.2022 high before the decline resumes. Subdivision of wave ((ii)) is proposed to be in a zigzag in lesser degree. Up from wave ((i)), first leg wave (a) ended at 7389.92. Expect Index to pullback in wave (b), then extends higher again in wave (c) to complete wave ((ii)) before the decline resumes. Near term, as far as pivot at 7500.11 high stays intact, expect rally to fail in 3, 7, or 11 swing for further downside.
FTSE 60 Minutes Elliott Wave Chart
PCE Inflation Unlikely to Bring Festive Cheer to the Dollar
The latest stats on personal income and spending, as well as the all-important PCE inflation figures will hit the markets on Friday before traders abandon their desks for the long holiday weekend. The data could set the tone until the end of the year, with a negative surprise in the Fed’s favourite price indicator potentially boosting risk assets as investors continue to question the steepness of policymakers’ projected rate path. The US dollar, however, would be in danger of further erasing its year-to-date gains in such a scenario.
Inflationary pressures are easing
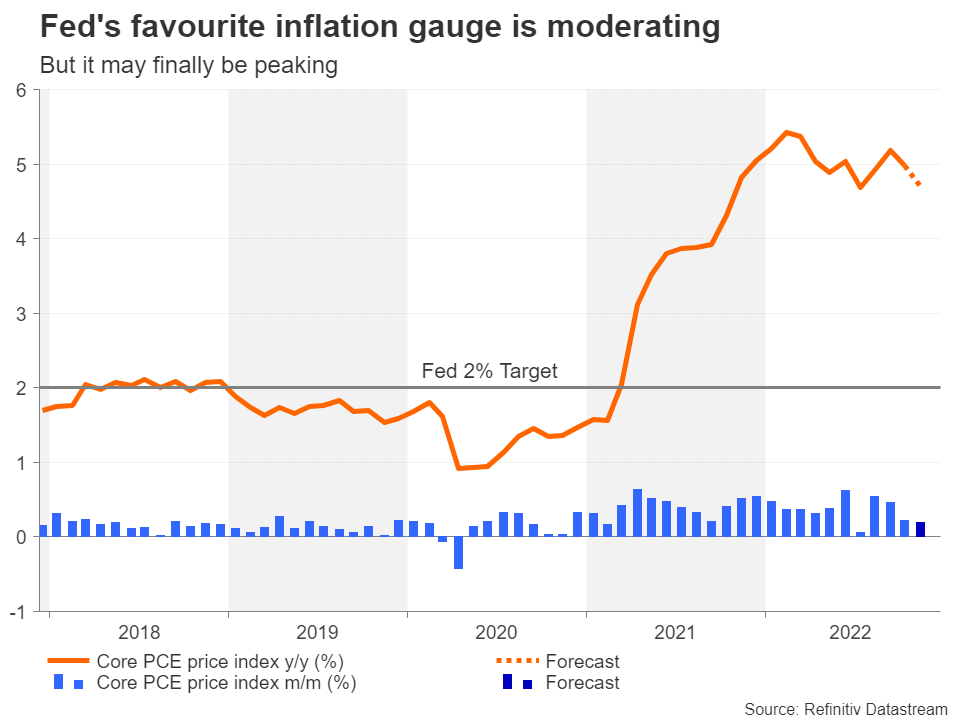
Inflation by all measures in the United States appears to have finally entered a downward phase, including the core PCE price index, which the Fed puts more weight on for achieving its price stability goal. However, it’s probably also accurate to describe this turnaround as still being in its ‘infancy’. Moreover, with the annual growth in both the headline and core rates so elevated far above the 2% target, the Fed is not about to go easy with its tightening campaign.
But markets no longer seem to be ‘buying’ the Fed’s latest hawkish rhetoric, not so much because they don’t believe its resolve to tame inflation, but because they fear that the current path is already too aggressive and will push the US economy into recession, forcing a policy reversal. Should Friday’s set of numbers follow the recent trend and be on the soft side, investors are likely to be emboldened in their belief that the Fed will be compelled to begin cutting rates in the second half of 2023.
Hopes for further moderation in core PCE
According to the forecasts, there shouldn’t be any upticks in the incoming data. The core PCE price index is expected to have risen by 0.2% month-on-month in November, bringing the annual rate down to 4.7% from 5.0% in the prior month.
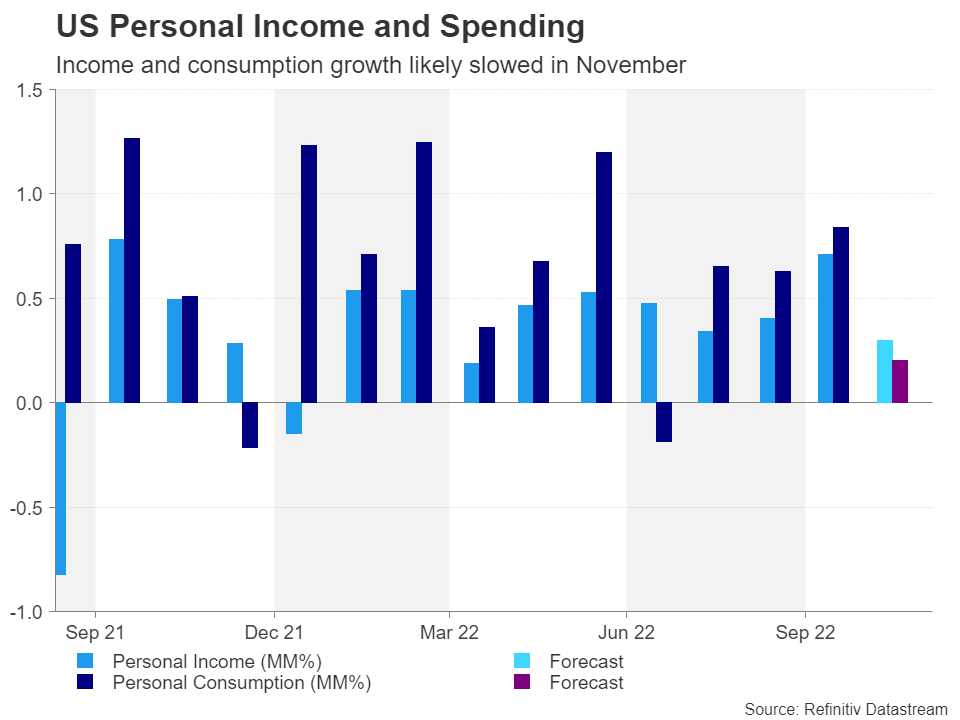
Looking at the personal income and spending numbers, the former likely expanded by 0.3% m/m, decelerating from 0.7% in October, while consumption is also expected to have slowed over the month, rising by 0.2% versus a prior 0.8% gain.
Other data will include durable goods orders, which are forecast to have dropped by 0.6% m/m during November after increasing by 1.1% previously.
Dollar at risk of suffering further losses
The US dollar could face renewed downside pressure if the figures are overall underwhelming or even badly miss expectations. Against the euro, the greenback could weaken towards levels last seen in late May.
At the moment, the euro is hovering around the $1.06 mark as it consolidates after hitting a six-month peak of $1.0735 last week. A leap towards the $1.0790-$1.0800 resistance area is possible if the data disappoint. The uptrend could extend further, towards $1.0945, which is the 50% Fibonacci retracement of the January 2021-September 2022 downtrend, should the core PCE print substantially fall short of the estimates.
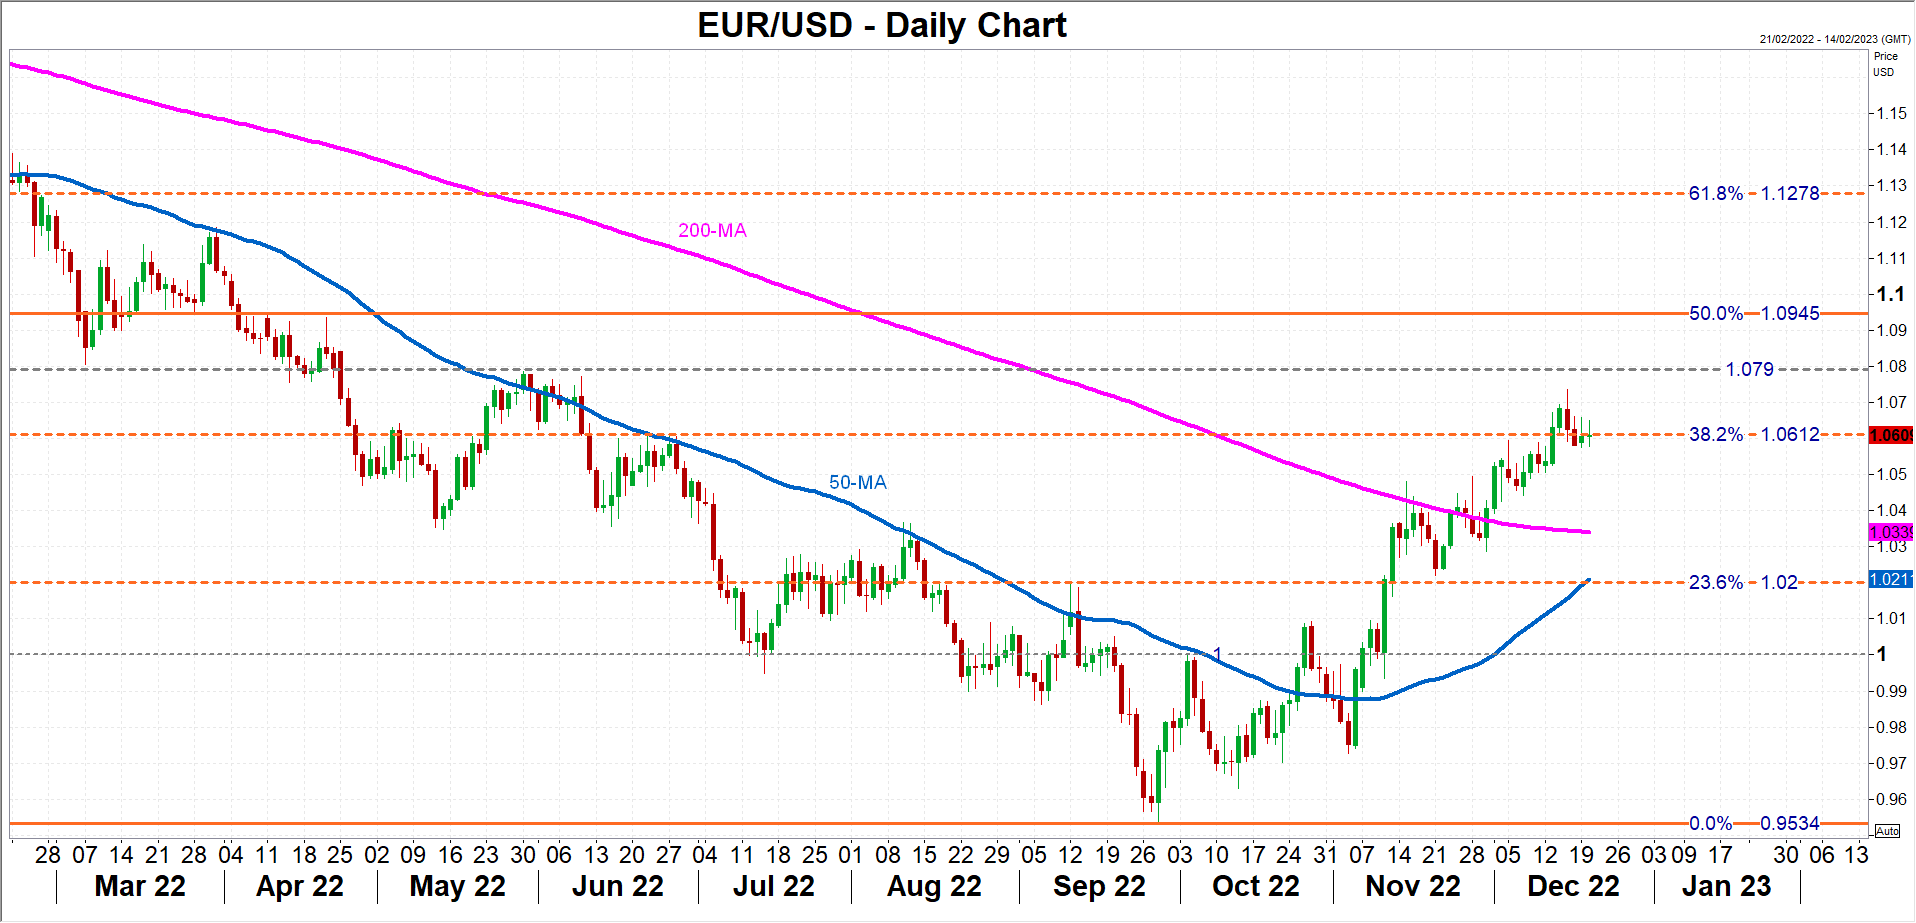
However, with markets already on edge about how far the Fed will go in raising interest rates, any positive surprises in the PCE inflation readings might revive dollar bulls, pushing the euro lower towards its 200-day moving average around $1.0340.
Limited upside for the dollar
It’s important to note here, though, that even if the dollar were to get a short-term boost from a strong batch of data, it’s longer-term bullish outlook is increasingly under question. The Fed has potentially reached peak hawkishness, while some other major central banks may continue to hike rates well after the Fed pauses.
In addition, markets are less hopeful that the Fed will be able to achieve a soft landing for the US economy. Hence, the dollar appears to be losing some of the advantages that gave it the upper hand for much of 2021 and 2022.
Gold Price Aims New Monthly High, Yen Rallies
Key Highlights
- Gold price started a fresh increase above the $1,780 resistance.
- A major bullish trend line is forming with support near $1,785 on the 4-hours chart.
- USD/JPY declined heavily and the Japanese yen gained against most its peers.
- Canada’s CPI could increase 7.4% in Nov 2022 (YoY), up from 6.9%.
Gold Price Technical Analysis
Gold price formed a base above the $1,770 level against the US Dollar. The price started a steady increase above the $1,778 and $1,780 levels.
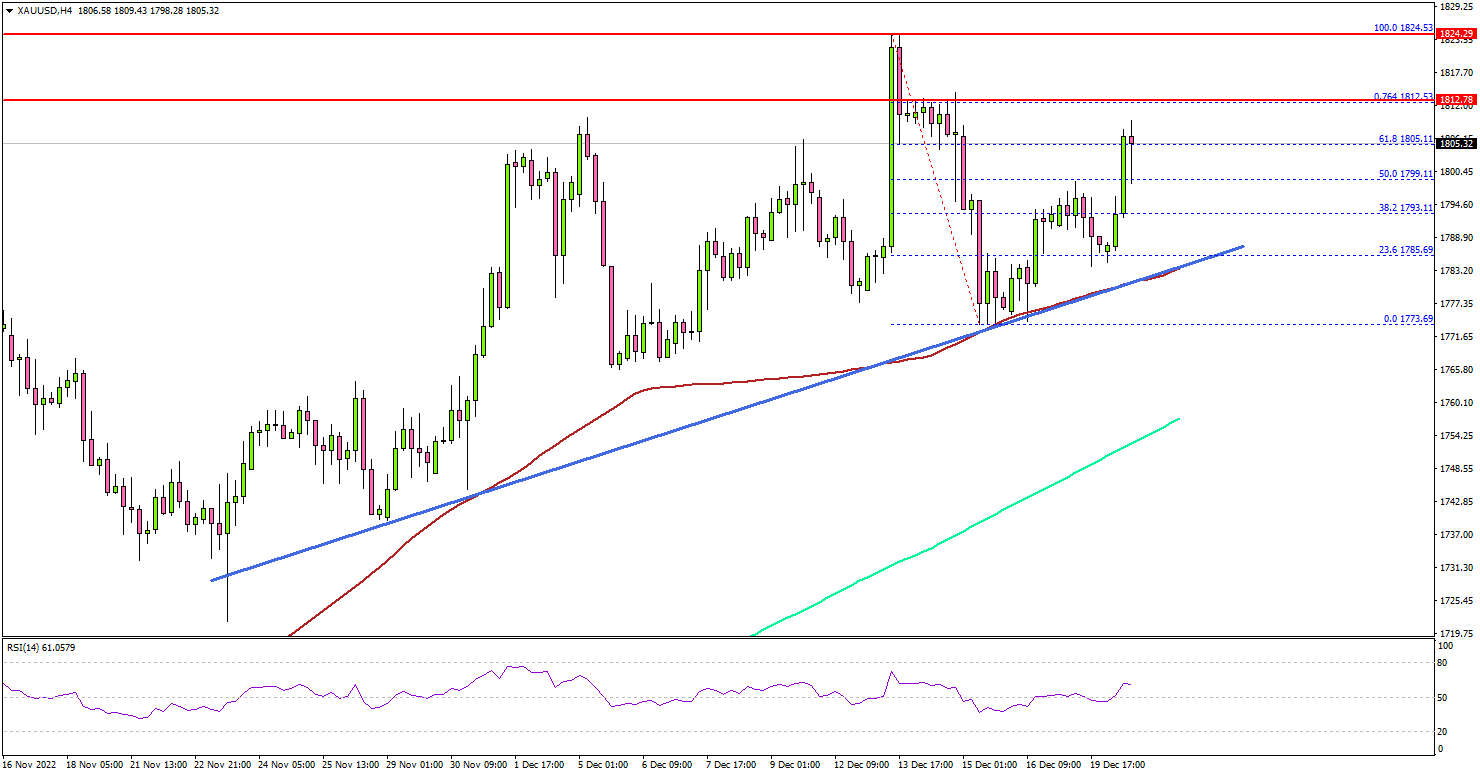
The 4-hours chart of XAU/USD indicates that the price gained pace above the $1,785 resistance zone. The price even moved above the $1,800 level and settled well above the 100 simple moving average (red, 4-hours) plus the 200 simple moving average (green, 4-hours).
There was a clear move above the 50% Fib retracement level of the downward move from the $1,824 swing high to $1,773 low. On the upside, the price might face sellers near the $1,812 level.
The next major resistance is near the $1,825 level. Any more gains might send the price towards the $1,840 resistance level, above which gold price might revisit the $1,850 resistance.
On the downside, an initial support is near the $1,790 level. There is also a major bullish trend line forming with support near $1,785 on the same chart.
The next major support is near the $1,780 level. The main support is near $1,772, below which gold price might struggle to stay above the $1,760 zone.
Looking at USD/JPY, there was a sharp decline below the 135.00 support and it seems like the Japanese yen buyers are aiming more downsides in the near term.
Economic Releases to Watch Today
- Canadian Consumer Price Index for Nov 2022 (MoM) – Forecast +0.4%, versus +0.7% previous.
- Canadian Consumer Price Index for Nov 2022 (YoY) – Forecast +7.4%, versus +6.9% previous.
- US Existing Home Sales for Nov 2022 (MoM) - Forecast 0%, versus -5.9% previous.