Sample Category Title
AUDJPY Tumbles Below Key Support Zone of 91.00
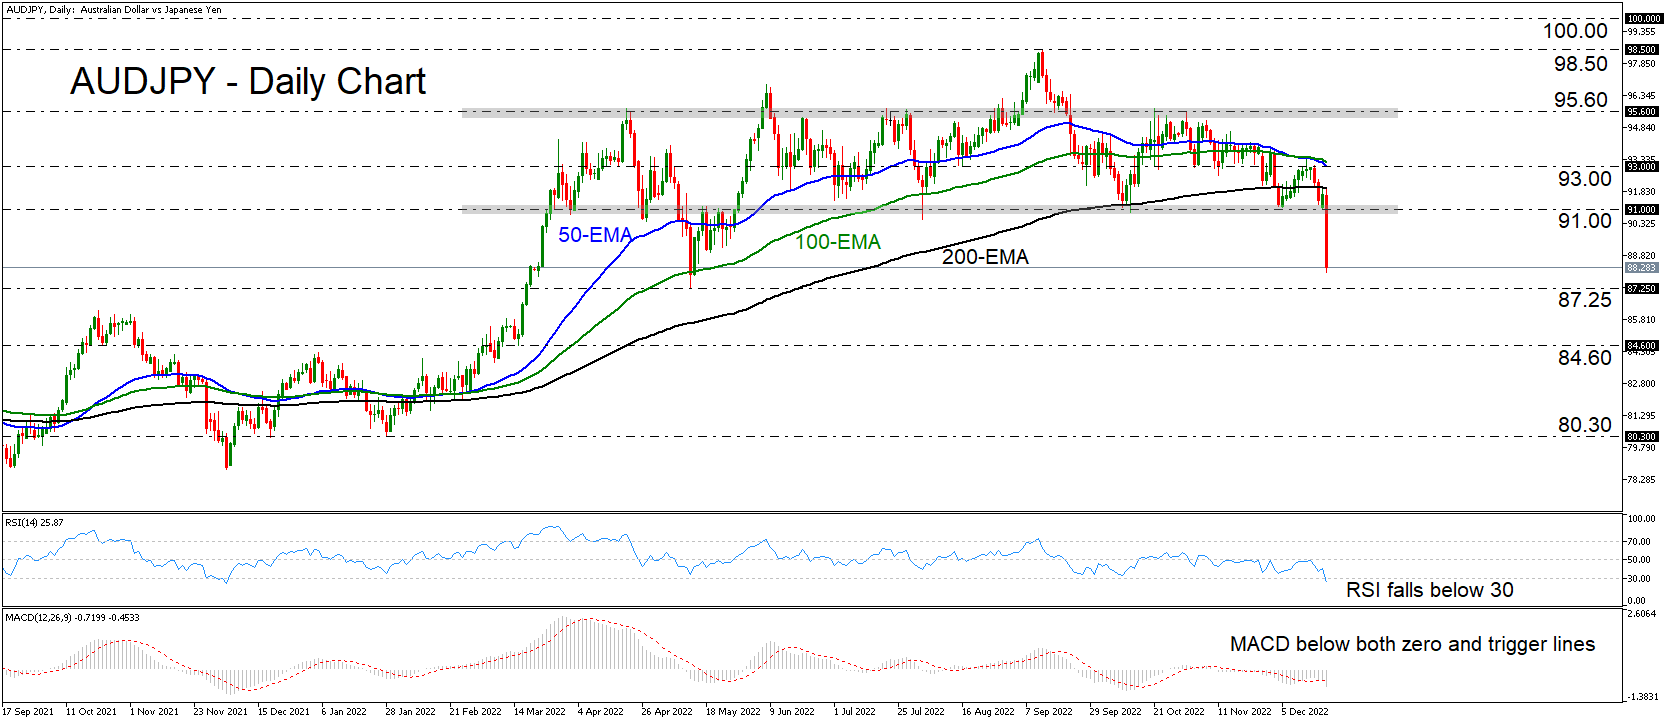
AUDJPY fell sharply on Tuesday after the BoJ raised the cap on 10-year bond yields. The pair broke below the key support (now turned into resistance) territory of 91.00, which had been stopping it from drifting lower since July. Up until now, AUDJPY is nearly 4.5% lower, which combined with the break below 91.00 suggests that the bears are back in the driver’s seat.
The daily oscillators are adding to that narrative by detecting strong bearish momentum. The RSI fell below its 30 line, while the MACD is lying below both its zero and trigger lines, pointing down as well.
If the bears are willing to stay in charge, they could eventually challenge the low of May 12 at 87.25, the break of which could extend the slide towards the 84.60 barrier, marked by the low of March 15. If there are no buyers to be found there either, the bears may get encouraged to dive all the way down to the 80.30 territory, marked as support by the low of January 27.
On the upside, a break above 95.60 may be needed to paint a bullish picture. That barrier served as strong resistance on multiple occasions this year. So, its break may result in advances towards the almost 8-year high of 98.50, hit on September 13, or the psychological round figure of 100.00.
To recap, AUDJPY tumbled on the BoJ decision, breaking the key support territory of 91.00. This confirmed a lower low and suggests that more declines may be in store for the foreseeable future.
EURJPY Plummets after BoJ Surprises, 200-day SMA Caps Losses
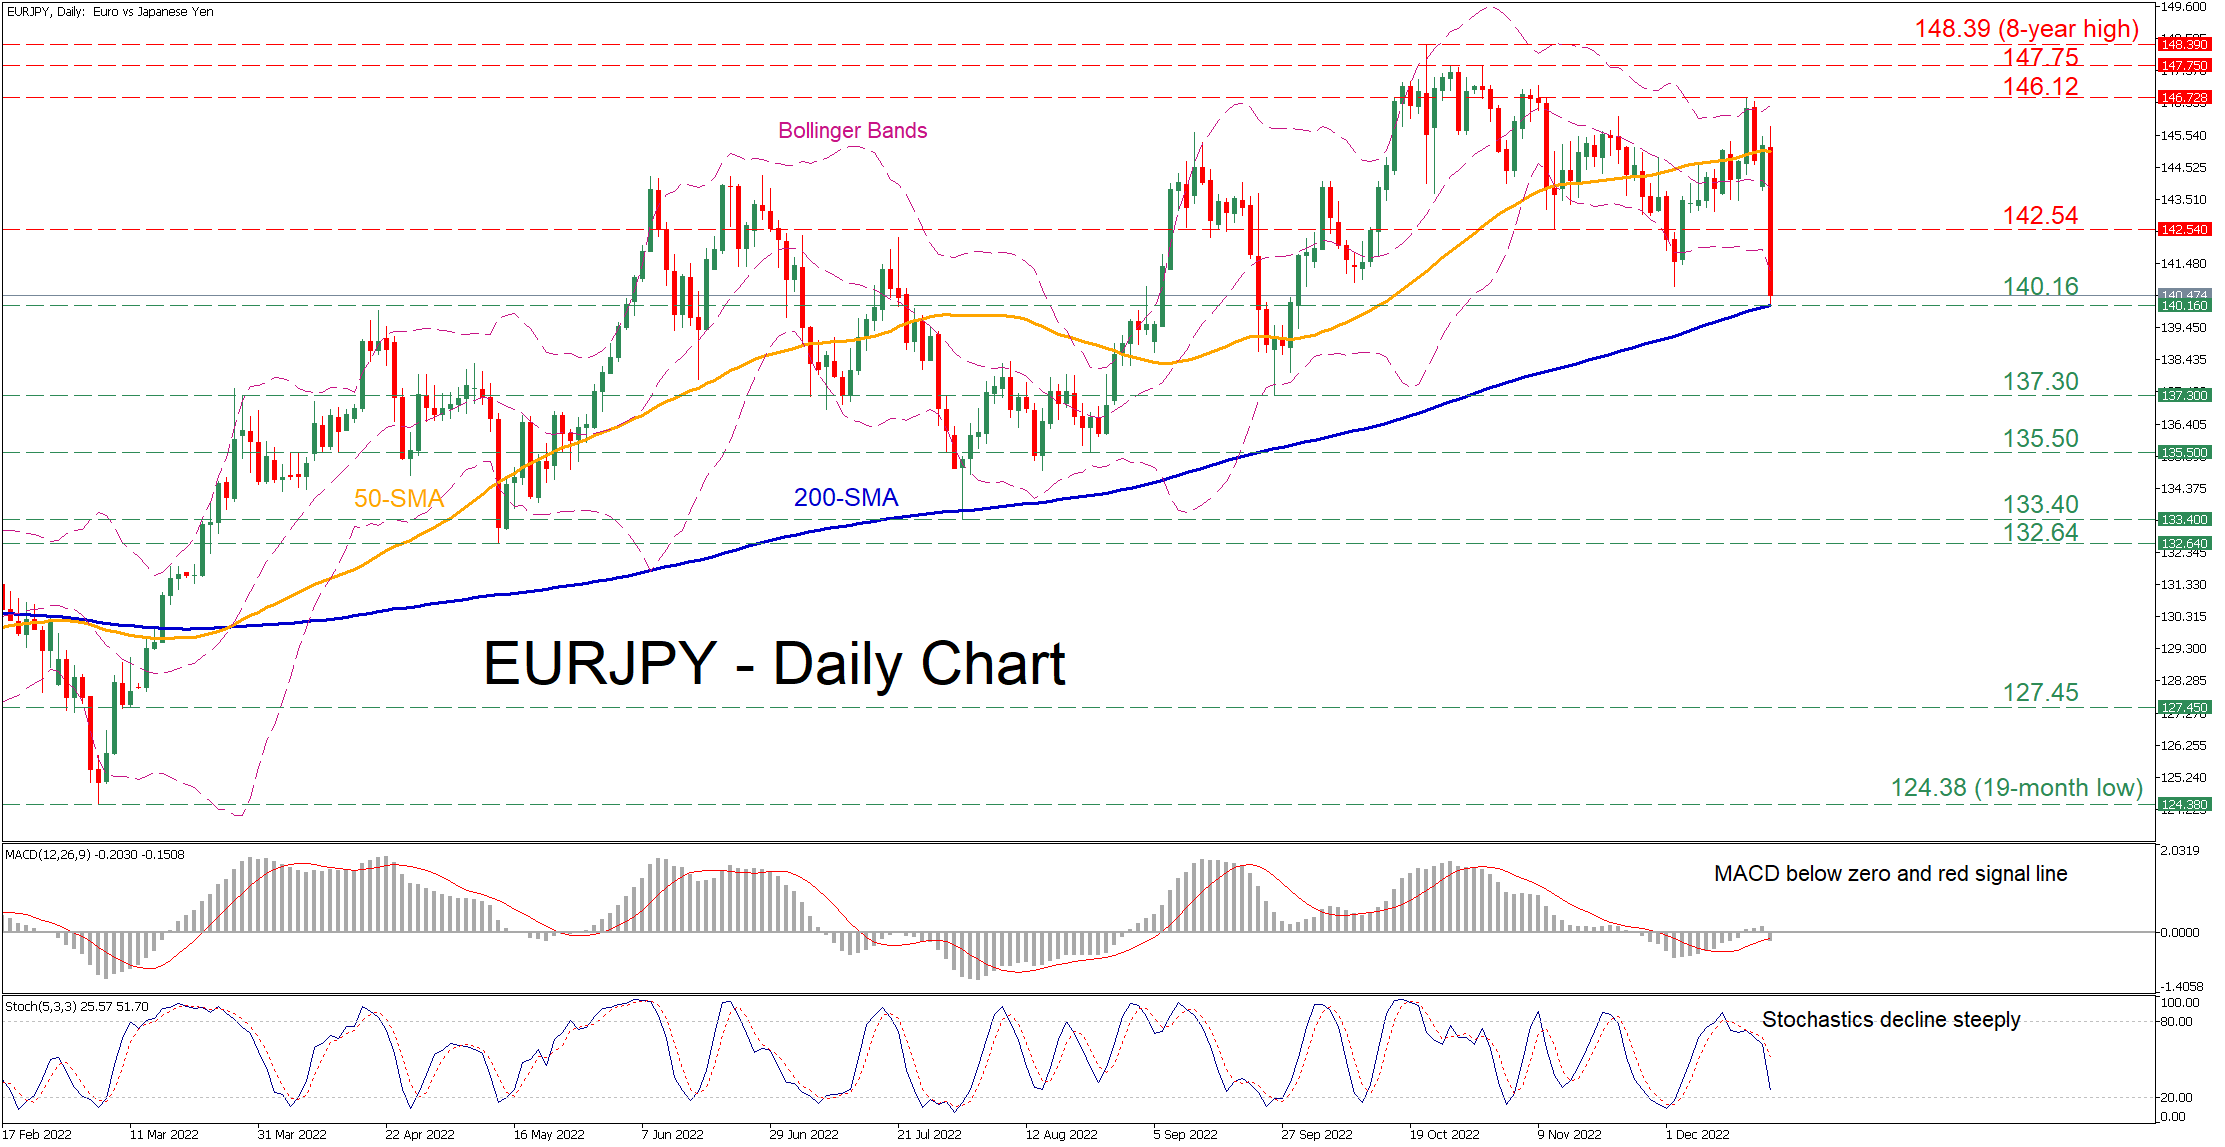
EURJPY had been on a steady short-term recovery before experiencing a massive decline on the back of the BoJ’s latest decision to widen the band of its Yield Curve Control policy. For now, the retreat has come to a halt at the crucial 200-day simple moving average (SMA, but downside pressures persist.
The momentum indicators currently suggest that bearish forces are strengthening. Specifically, the MACD histogram has retreated below both zero and its red signal line, while the stochastic oscillator is descending steeply near the 20-ovesold zone.
If the decline resumes, initial support could be met at the 200-day SMA, currently at 146.10. Diving beneath that region, the price could descend towards the September low of 137.30 before 135.50 comes under examination. Failing to halt there, further declines could cease at the August bottom of 133.40.
On the flipside, should the pair correct higher and erase part of its downward spike, the 142.54 support could now act as resistance. A violation of that zone could shift the attention to 146.12 before the bulls aim at the 147.75 barrier. Jumping above the latter, the pair may then challenge the eight-year high of 148.39.
In brief, EURJPY declined significantly on the aftermath of the BoJ’s latest policy decision but found support at the 200-day SMA. Hence, if the crucial floor holds its ground, the pair is likely to exhibit an upside correction.
USDJPY Crashes on BoJ Surprise Tweak
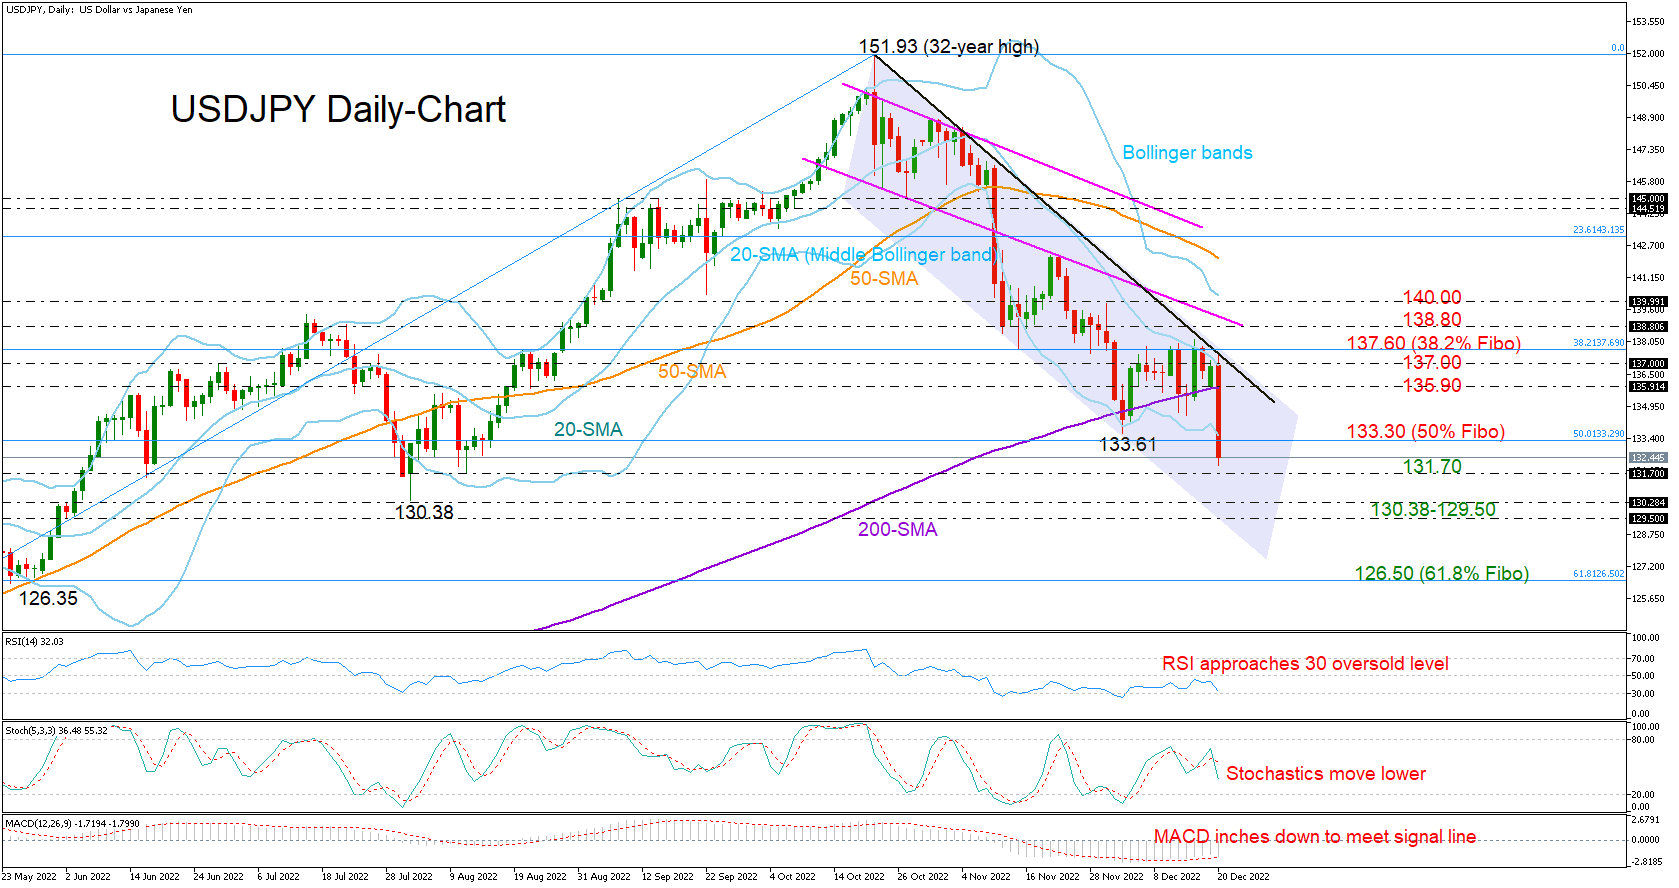
USDJPY crashed to a four-month low of 132.26 in the wake of an unexpected hawkish tweak in the BoJ’s yield curve control early on Tuesday.
From a technical perspective, the bearish action was the outcome of the rejection near the key descending trendline and the 20-day simple moving average (SMA) at 137.00. With the price tumbling below the 200-day SMA for the first time in almost a year, traders will wait and see whether selling pressures will persist in the coming sessions.
The stochastics and the RSI have yet to confirm oversold conditions, signaling further depreciation in the market. Yet, with the price flirting with the lower Bollinger band, this initial sell-off may not last for long, especially as the crucial floor of 131.70 remains in sight. Failure to bounce here could worsen the bearish wave, shifting the spotlight to the August low of 130.38 and then to the 129.50 barrier. Moving lower, the pair may head for the 61.8% Fibonacci retracement of the March-October uptrend at 126.50. Note that May’s decline stopped around the same location.
Alternatively, a bounce back above the 50% Fibonacci of 133.29 could motivate an upside correction towards the 200-day SMA at 135.90. If the bulls win the battle with the resistance trendline at 137.00 and snap the 38.2% Fibonacci of 137.70 too, the recovery may continue towards the channel’s broken lower trendline seen at 138.80. The 140.00 mark could be the next target.
In brief, the short-term outlook for USDJPY has further darkened following the latest freefall in the price. We cannot rule out some stabilization, though a meaningful rally could be a tough job as several obstacles lay ahead.
Dow Jones 30 Seeks Support
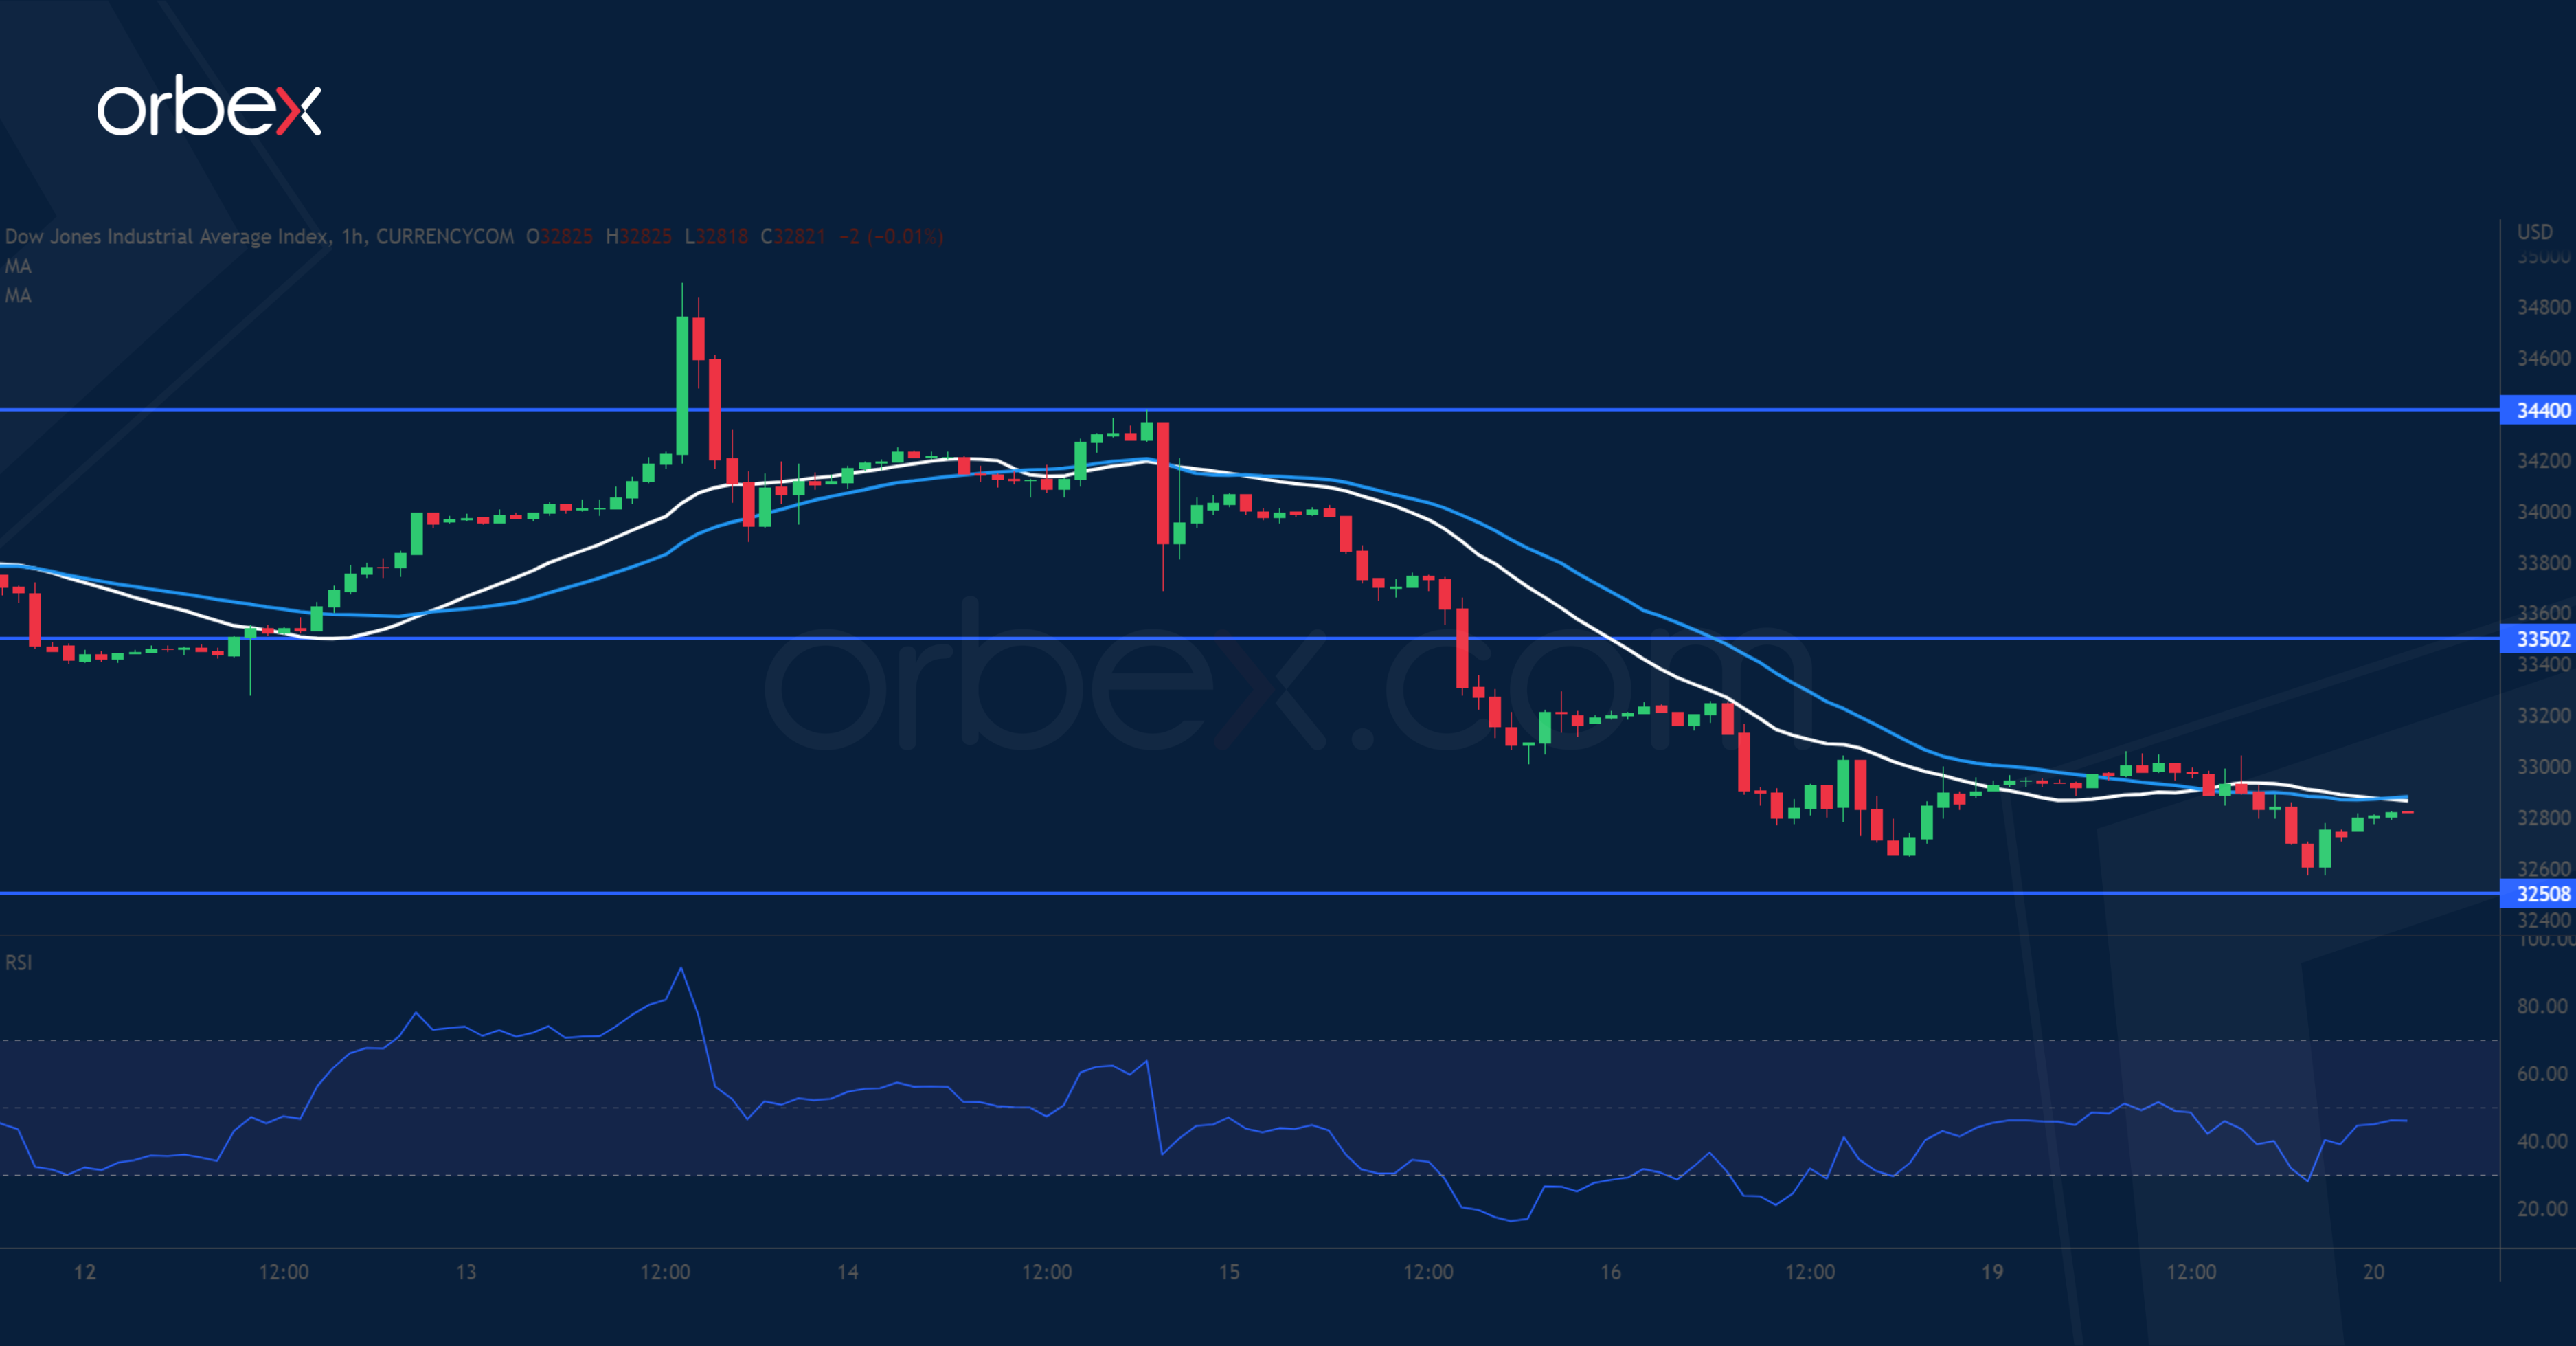
The Dow Jones 30 falls as investors offload risk assets over the prospect of further rate hikes. Last week’s reversal has dented the short-term mood, forcing leverage positions to abandon 33400 and lifting volatility. The index is looking to secure a foothold at 32500 which is a 38.2% Fibonacci retracement of the rally from October. The 50% level and daily low at 31800 is critical in keeping the recovery intact in the medium-term. On the upside, 33500 then 34100 are two obstacles to clear before the uptrend could resume.
AUD/USD Tests Major Support
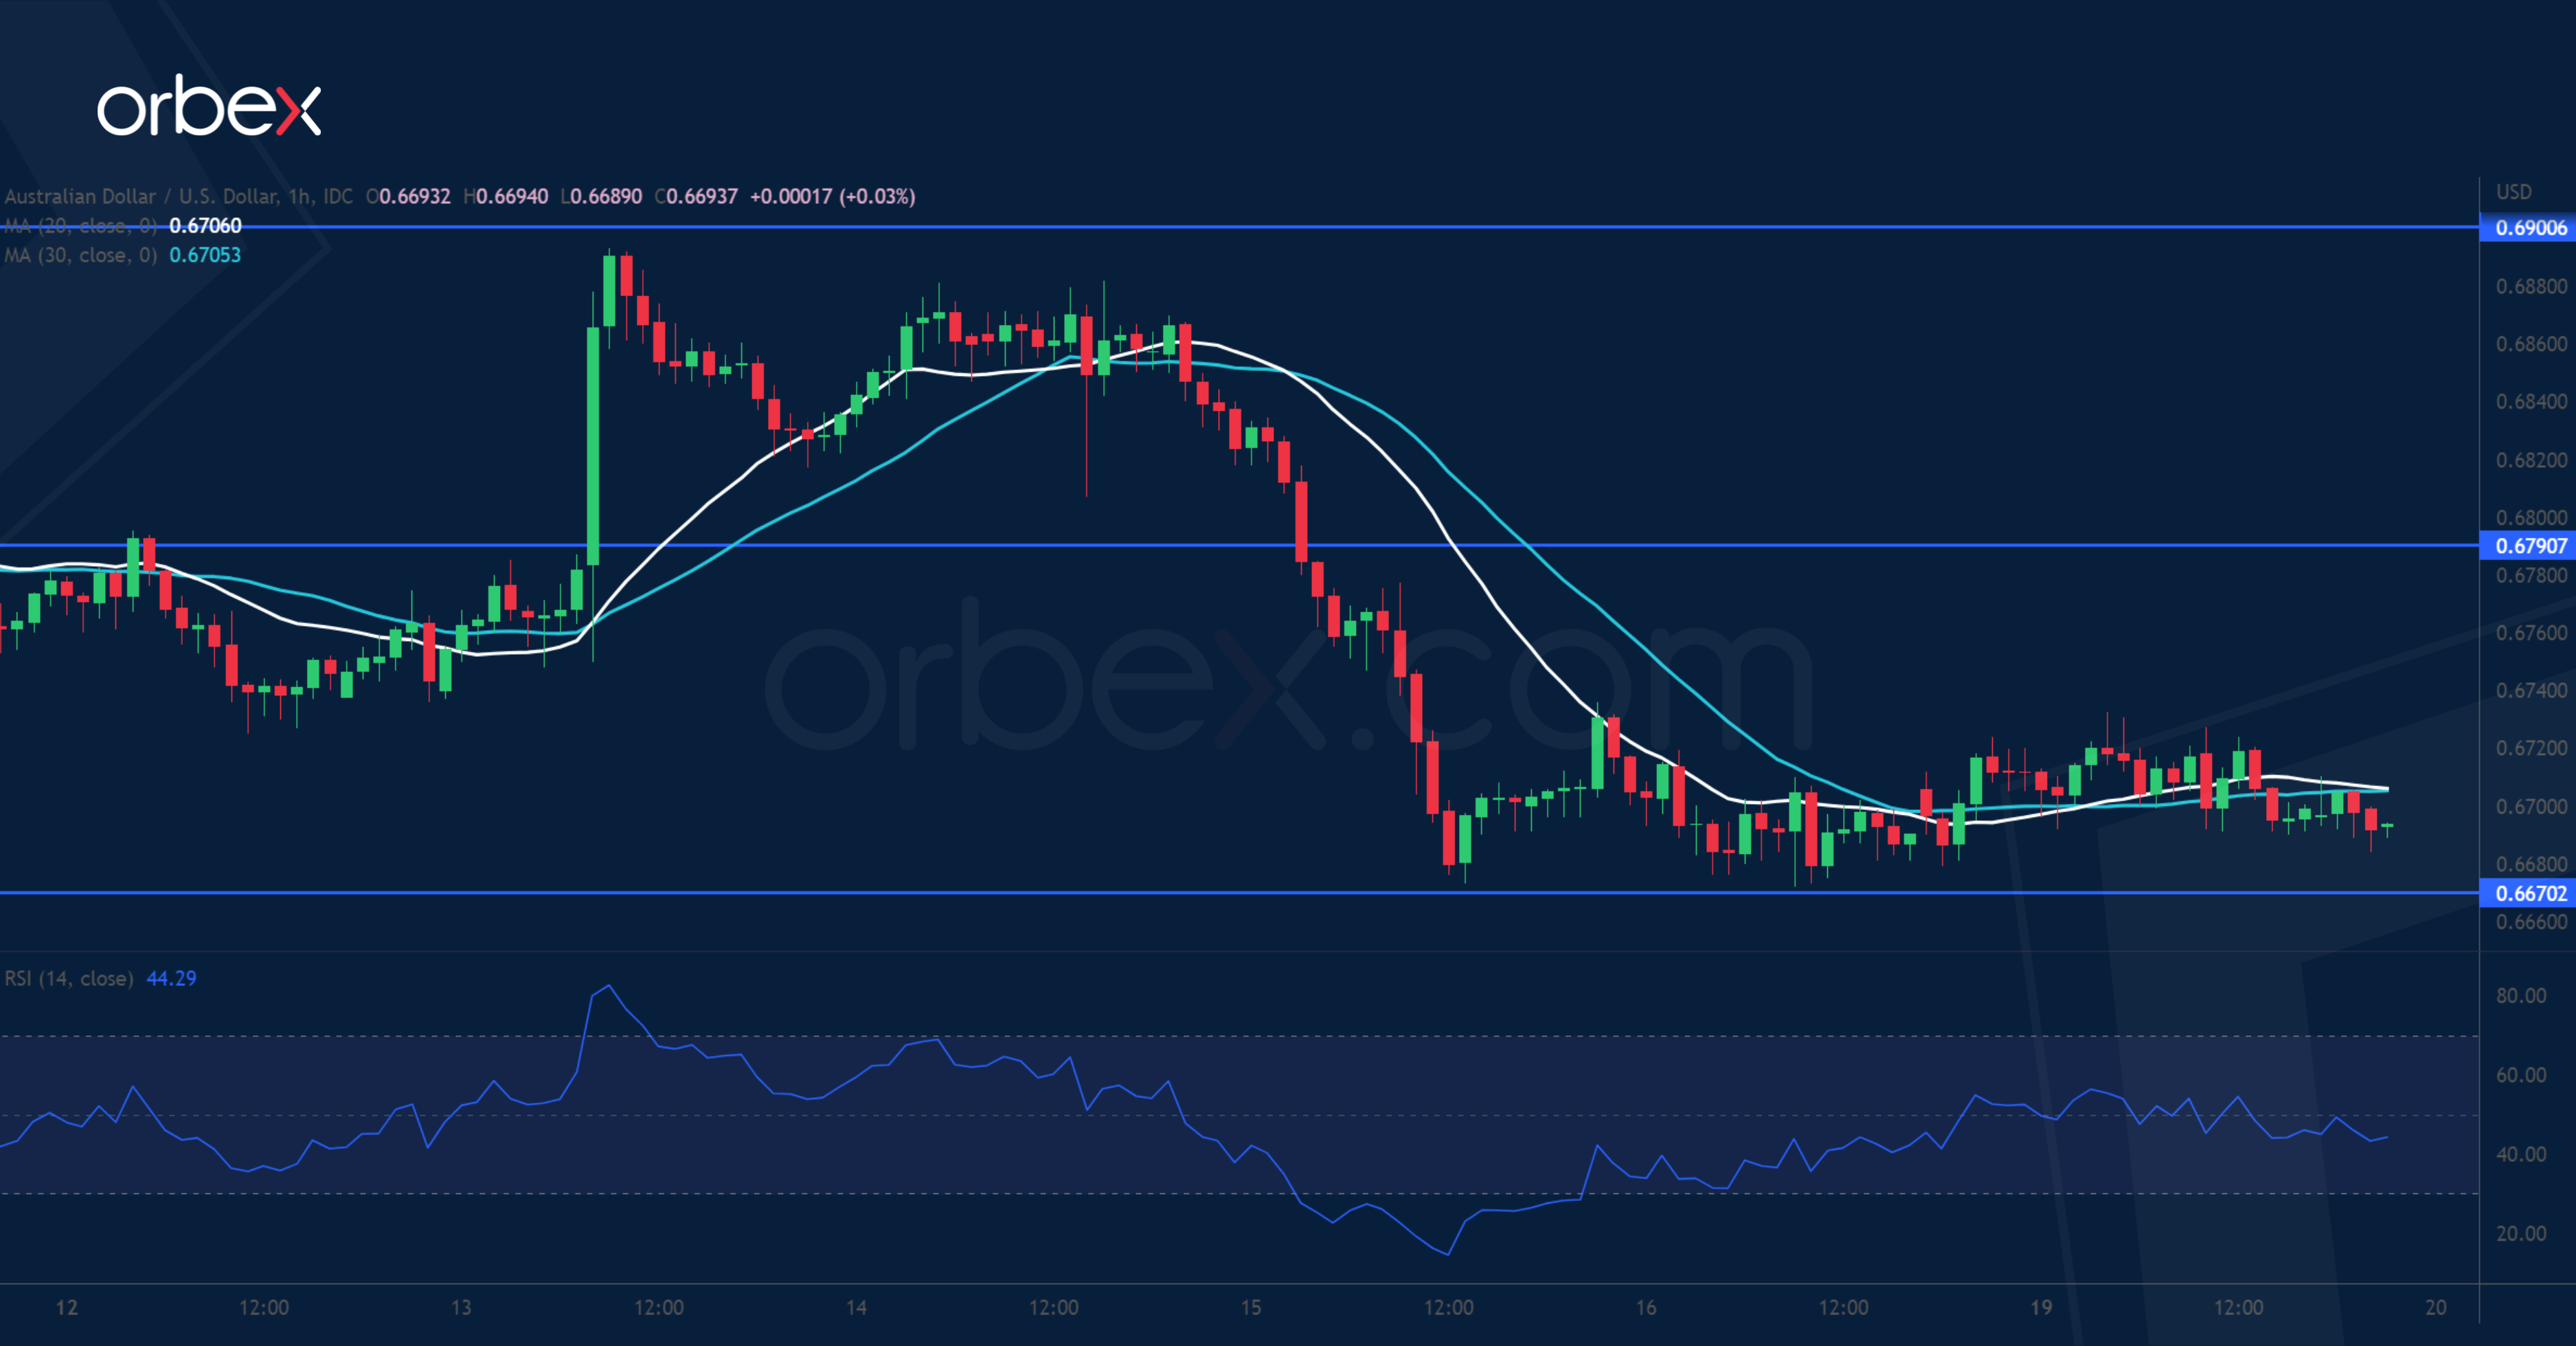
The Australian dollar slips as the RBA minutes hints at a possible pause in rate hikes. The pair has so far struggled to clear 0.6900 at the origin of the September sell-off. A combination of profit-taking and fresh selling has weighed on the aussie. A push under 0.6750 may have dampened the enthusiasm, putting the recent lows around 0.6670 at test. The bulls must lift offers in the newly formed supply zone around 0.6790 before they could regain control. Otherwise, a fall below said support could trigger a broader liquidation.
EUR/USD Consolidates Gains
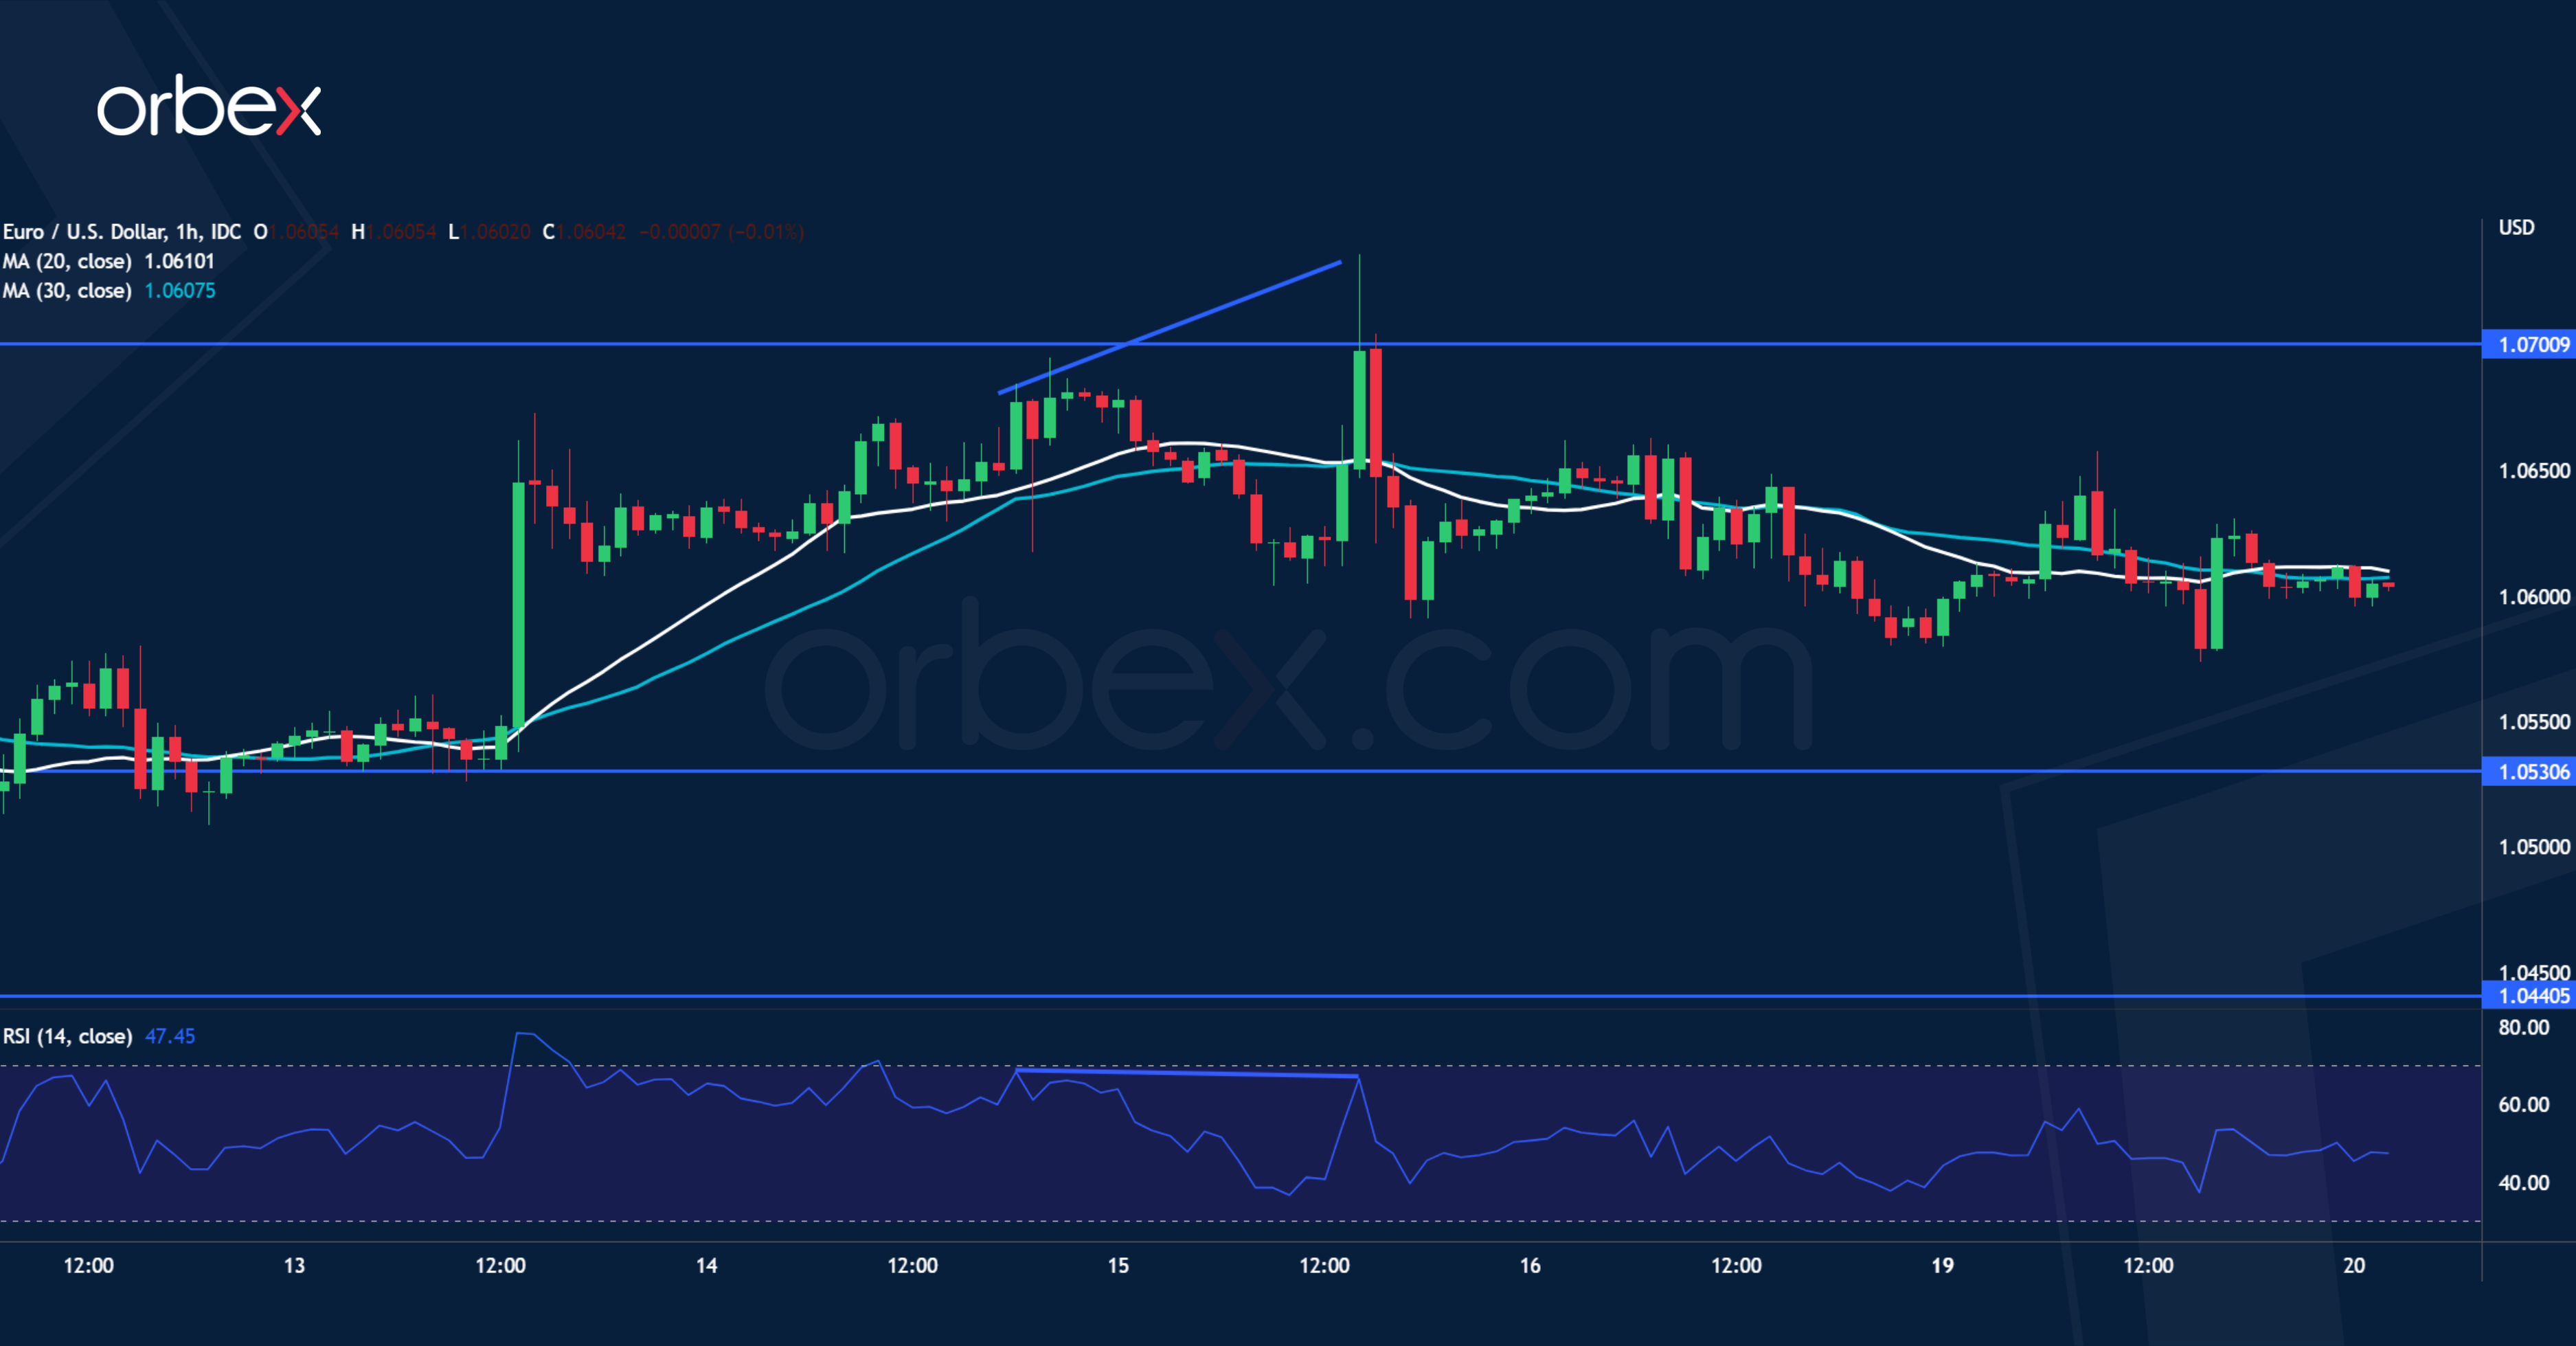
The euro found support after ECB officials pledged to keep raising interest rates. The pair came under pressure near last June’s high of 1.0780. A RSI divergence shows a deceleration in the upward momentum and could be significant in this supply zone. After traders took some chips off the table, new buying interests will need to follow through to maintain the single currency’s edge. 1.0530 is a key level to make that happen or the price could tumble below 1.0440. A rally back above 1.0700 would keep the bulls in play.
BoJ Kuroda: Yield cap raised to correction distortions in yield curve
BoJ Governor Haruhiko Kuroda said in the post meeting press conference, "Overseas market volatility has heightened from around spring ... While we have kept the 10-year bond yield from exceeding the 0.25% cap, this has caused some distortions in the shape of the yield curve. We, therefore, decided that now was the appropriate timing to correct such distortions and enhance market functions." That's led to the decision today to raise the cap from 0.25% to 0.50%.
"Consumer inflation has hit 3.6% mainly through rising import costs from a weak yen. Furthermore, inflation expectations are heightening. This is pushing down real interest rates and enhancing the stimulus effect on the economy. As such, while we've (widened the band) to correct distortions in the yield curve, the move won't diminish the effect of YCC," he added.
But Kuroda also indicated, "I don't think we need to review YCC or quantitative easing for the time being." "It's premature to debate specifics on changing the monetary policy framework or an exit from easy policy. When achievement of our target comes into sight, the BOJ's policy board will hold discussions on an exit strategy and offer communication to markets," he said.
BOJ Makes Surprise Change to YCC Policy
Market movers today
Today, the German Producer Prices will be released for November. Consensus is looking for a second consecutive m/m decline, which would naturally signal good news for the German economy together with the yesterday's more upbeat Ifo. Flash Consumer Confidence will be released for the broader euro area as well.
US housing starts will also be released for November, consensus is looking for a further decline in line with NAHB indicator released yesterday. That being said, the modest uptick in NAHB 6M expectations combined with US mortgage rates now below November highs could send an early positive signal for the US housing market as well.
On the central bank front, the National Bank of Hungary is expected to maintain policy rates unchanged. ECB's Kazimir will also be on the wires today.
The 60 second overview
Japan: Bank of Japan surprised market by changing its yield curve control policy. It widened the upper part of the fluctuation band to 0.50%, while keeping the target of 0.00%. The move led to a jump in 10Y Japanese government bond yield above 0.40% and a drop in USD/JPY to around 133.
EU: EU finally settled on a natural gas price cap, the so-called gas market correction mechanism, which put a EUR180/Mwh ceiling over European natural gas price from 15 February and one year forward. The spot natural gas price benchmark was EUR107/Mwh yesterday.
Iran: UN nuclear officials were reported to have visited Iran Sunday for talks over future corporation and Iran reports it plans to meet EU officials in Jordan soon. It may bring talks over an Iran nuclear deal back to life, although it is likely up to the US whether it will end with a deal that will ease sanctions on Iran.
FI: Italian yields came under pressure yesterday extending the underperformance following the ECB meeting last week, in what was generally a rates up trading session. ECB's VP de Guindos confirmed the hawkish tones from Lagarde last week, which added some 4-5bp to the peak policy rate of 3.24% (€STR). Curves bear steepened with 30y Germany adding 8bp yesterday.
FX: It has been an unusually quiet start to the week in FX markets with Majors spanning moves of little more than +/- 0.5%. EUR/USD remains close to 1.06 while EUR/SEK and EUR/NOK are trading around 11.00 and 10.50, respectively.
Credit: Credit markets traded mostly sideways yesterday, seeking to come to terms with the recent hawkish rhetoric from the ECB and squaring this with the recent widenings in spread. Both primary and secondary activity is quite low as many investors are closing down for the year. Itraxx main widened 1.6bp to 97bp while Xover tightened 1bp to 505.6bæ
USD/JPY Daily Outlook
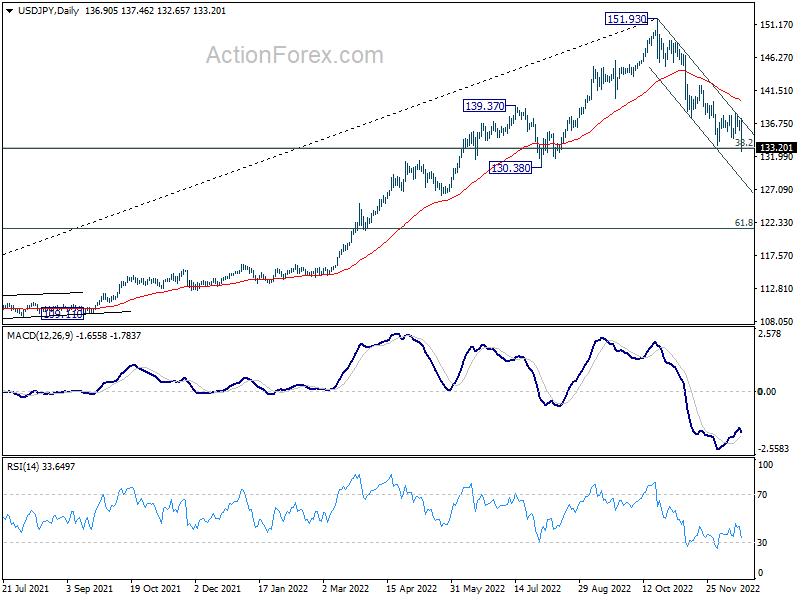
Daily Pivots: (S1) 136.05; (P) 136.61; (R1) 137.46; More...
USD/JPY's decline from 151.93 resumed by breaking through 133.61 support, and intraday bias is back on the downside. Immediate focus is now on 55 week EMA (now at 131.76). Decisive break there will pave the way to next fibonacci level at 121.43. For now, risk will stay on the downside as long as 138.16 resistance holds, in case of recovery.
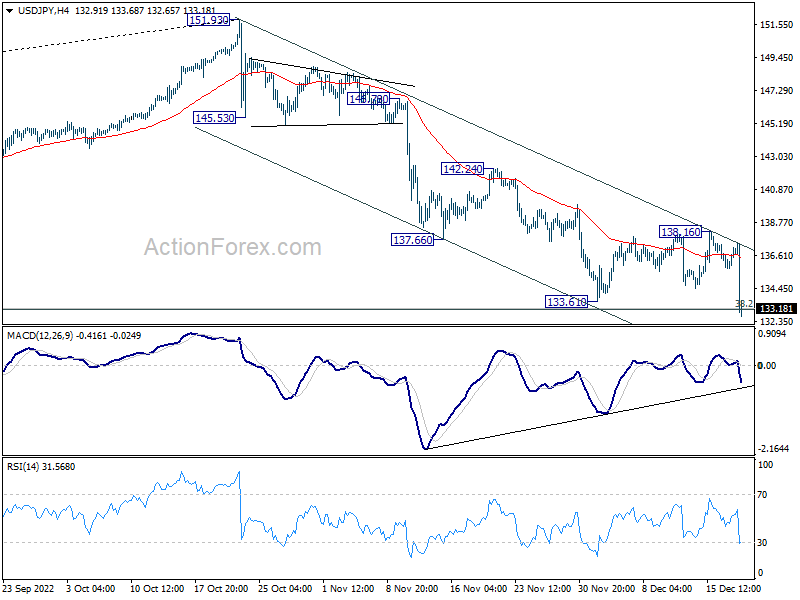
In the bigger picture, price actions from 151.93 medium term could be just a corrective pattern to up trend from 102.58 (2021 low). Strong support from 38.2% retracement of 102.58 to 151.93 at 133.07 and 55 week EMA (now at 131.76) will set the range for such corrective pattern. However, sustained break of 55 week EMA will pave the way to 61.8% retracement at 121.43.
USD/CHF Daily Outlook
Daily Pivots: (S1) 0.9265; (P) 0.9307; (R1) 0.9328; More...
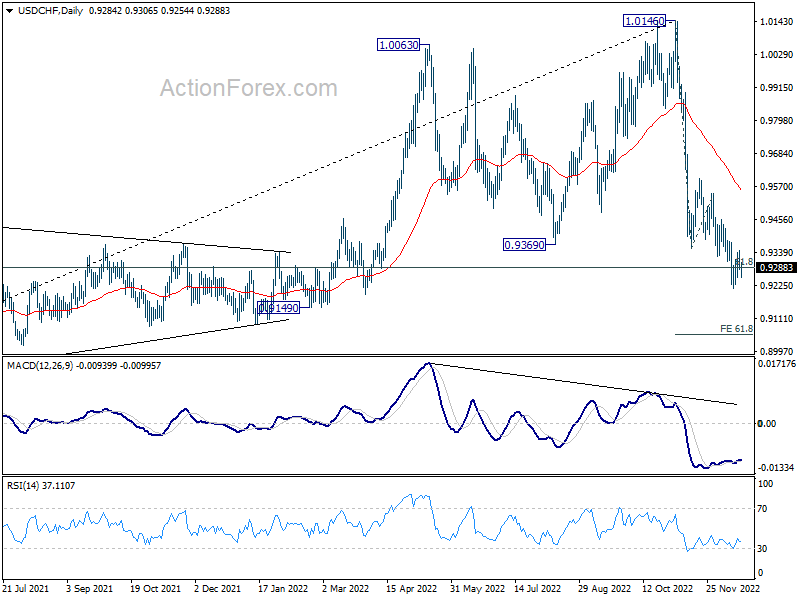
Intraday bias in USD/CHF remains neutral at this point. On the downside, break of 0.9214 will resume the fall and target 61.8% projection of 1.0146 to 0.9355 from 0.9545 at 0.9056. However, break of 0.9378 resistance will indicate short term bottoming and turn bias back to the upside for 0.9545 resistance instead.
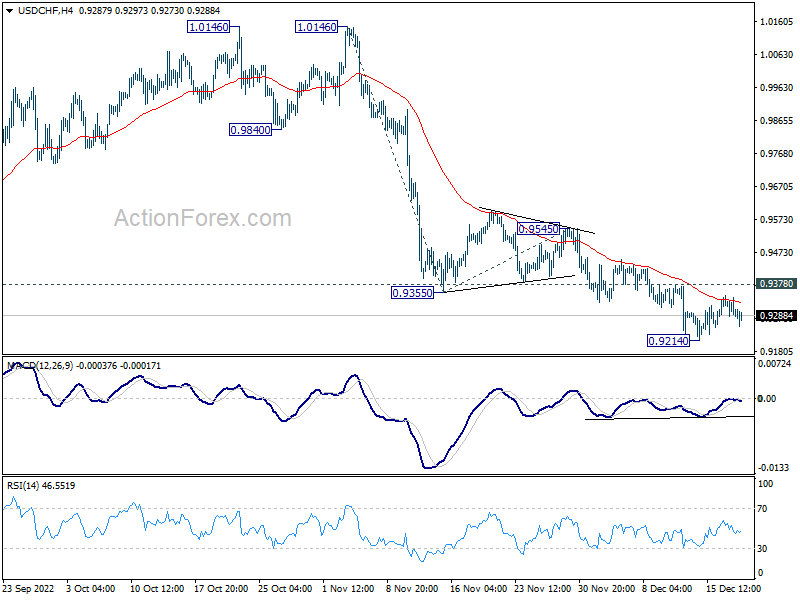
In the bigger picture, rise from 0.8756 (2021 low) has completed at 1.0146, well ahead of 1.0342 long term resistance (2016 high). Based on current downside momentum, fall from 1.0146 might be a medium term down trend itself. Sustained break of 61.8% retracement of 0.8756 to 1.0146 at 0.9287 will pave the way to 0.8756. In any case, risk will stay on the downside as long as 0.9545 resistance holds.