Sample Category Title
Elliott Wave View: S&P 500 (SPX) Expect Short Term Weakness To Continue
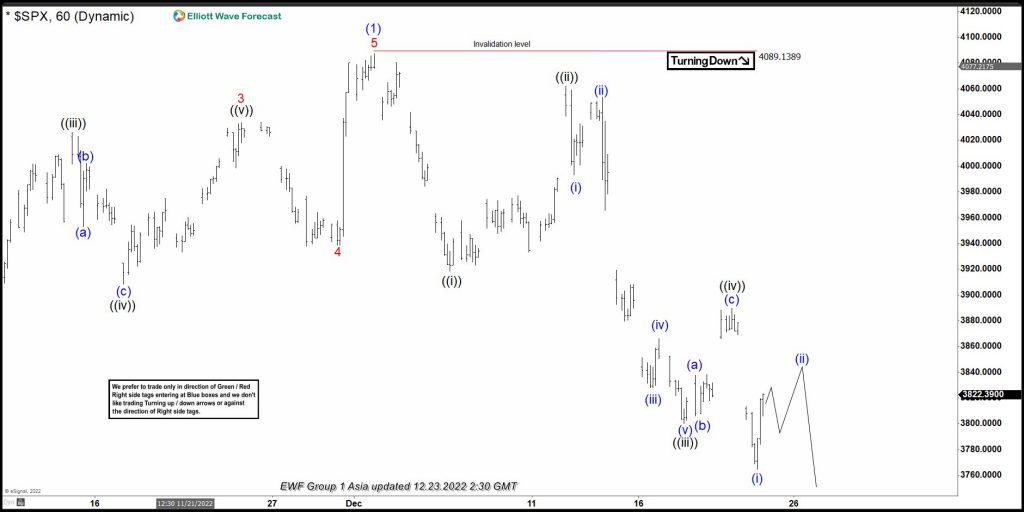
Short term, Elliott wave view in S&P 500 (SPX) showing 5 swing sequence lower from 12.01.2022 peak of 4087.3 as the part of correction lower in (2) against 10.13.2022 low. Ideally, (2) expects to unfold in 3, 7 or 11 swings and should hold above 10.13.2022 low to turning higher. Below 4087.3 high, it starts correcting lower in proposed wave (2) down. It favored ended ((i)) of A at 3918.39 low and ((ii)) at 4061.89 high. Wave ((ii)) was 0.854 Fibonacci retracement of ((i)). Below there, it extend the weakness in ((iii)), which ended at 3800.04 low. Wave ((iv)) bounced off there and finished at 3889.82 high slightly below 0.382 Fibonacci retracement. Below there, it breaks the ((iii)) low confirming ((v)) in progress and reached the minimum extension area.
Below ((iv)) high, it ended (i) of ((v)) at 3764.49 low. Currently, it is bouncing in (ii), which expects to fail in 3 or 7 swings below ((iv)) to see further weakness in (iii). Ideally as long as price remains below ((iv)) low, it can extend at least for two more lows to finish ((v)) as A wave in (2) correction. Alternatively, if it breaks above ((iv)) high, then ((v)) as A leg should already be in placed at 3764.49 low. While above there, it should bounce in B wave and expect to fail in 3, 7 or 11 swings against 12.01.2022 high before downside resumes later in C leg.
SPX 60 Minutes Elliott Wave Chart
Negative Sentiment in the Markets ahead of X-mas
Market movers today
Japanese inflation data for November was as expected, but at a high level of 3.7% y/y. Hence, this supports the tightening move from BoJ earlier this week.
There is PPI data from Finland, France and Spain as well as personal income and durable goods numbers from US. The data should have limited impact on the markets.
The 60 second overview
Japanese inflation rose at the fastest pace since 1981. This is supportive for BoJ after their move on the YCC. It is likely to fuel expectations that BoJ could move again in 2023, if inflation does not decline.
CPI excl. fresh food rose 3.7% y/y in November. This was as expected by economists. The rise in headline inflation was lower than expected.
Asian equity markets is following the negative trend from the US markets yesterday and are posting losses across the region this morning. The move is driven by Tech stocks in both US and Asia, it is fuelled by the expectations that the Federal Reserve will continue tightening, after better than expected data from the US yesterday. The data showed that the job market remain resilient and the GDP for Q3 was revised upwards.
FI: The stronger than expected US economic data also sent US Treasury yields higher yesterday. In the European market yields also rose, but the BTPS-Bund spread continue to remain range bound even as Italy has to sell EUR 310-320bn in bonds next year. The estimate is actually lower than the estimate for 2022, which was EUR 325-330bn. However, Italy sold EUR 285bn in 2022 given the proceeds from NGEU of some EUR 45bn. Italy will also receive significant support from NGEU in 2023, and thus the sale of bonds is likely to be lower than the estimate.
FX: Yesterday's session was primarily characterised by modest USD strength and a setback to cyclically sensitive currencies. EUR/USD has moved back below 1.06 while EUR/NOK and EUR/SEK are back close to 10.50 and 11.10, respectively. EUR/GBP is back above 0.88 for the first time since mid November.
Credit: The credit markets were slightly negative yesterday with Itraxx main finishing the day 0.7bp wider ending in 95.1bp and Xover being some 7.8bp wider ending at 485.4bp. With the exception of a slew of investors rebalancing up to year-end, the activity in the credit markets remained low and is expected to remain so throughout the rest of the year. The low primary activity seen in the latter part of December could bode for a rather busy start to 2023.
USD/CAD Daily Outlook
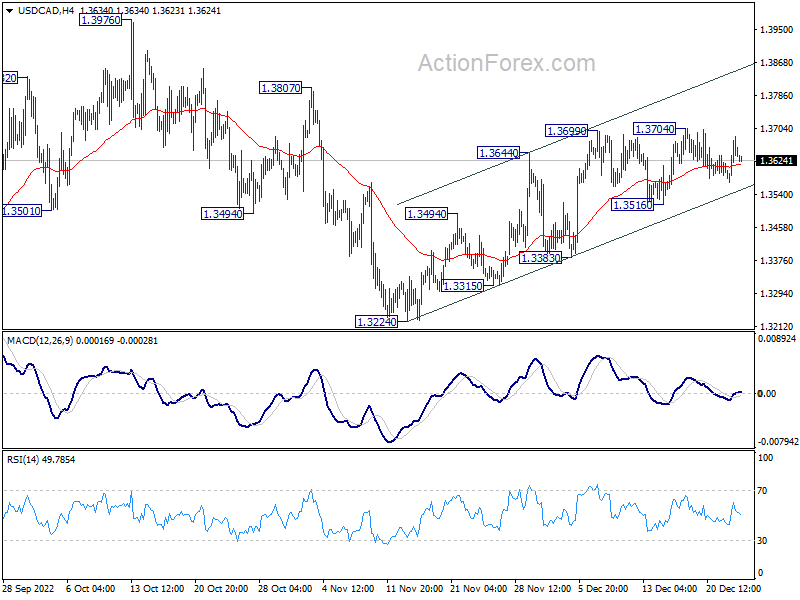
Daily Pivots: (S1) 1.3589; (P) 1.3634; (R1) 1.3697; More....
Range trading continues in USD/CAD and intraday bias stays neutral. Further rally is still in favor as long as 1.3516 support holds. Break of 1.3704 will resume the rebound from 1.3224 to 1.3807 resistance. Break there will bring retest of 1.3976 high. On the downside, however, break of 1.3516 support will suggest that the rebound has completed, and turn bias back to the downside.
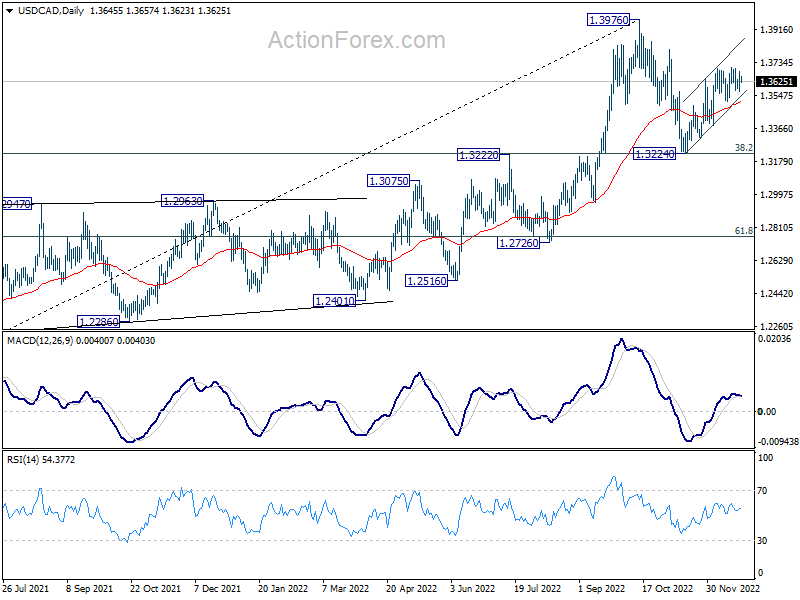
In the bigger picture, as long as 1.3222 cluster support (38.2% retracement of 1.2005 to 1.3976 at 1.3223) holds, larger up trend from 1.2005 (2021 low) is still expected to resume through 1.3976 high at a later stage. However, firm break of 1.3222/3 will indicate that the trend might have reversed. Deeper fall would be seen to next cluster support at 1.2726 (61.8% retracement at 1.2758).
AUD/USD Daily Report
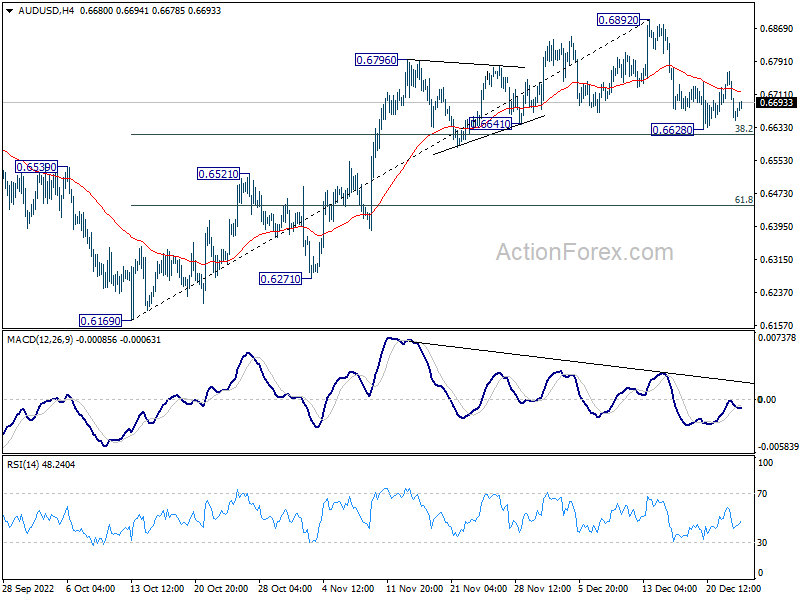
Daily Pivots: (S1) 0.6626; (P) 0.6696; (R1) 0.6743; More...
Intraday bias in turned neutral against first. On the downside, sustained break of 38.2% retracement of 0.6169 to 0.6892 at 0.6616 will indicate rejection by 0.66871 fibonacci level. Deeper fall should then be seen to 61.8% retracement at 0.6445. On the upside, break of 0.6892 will resume the rally from 0.6169.
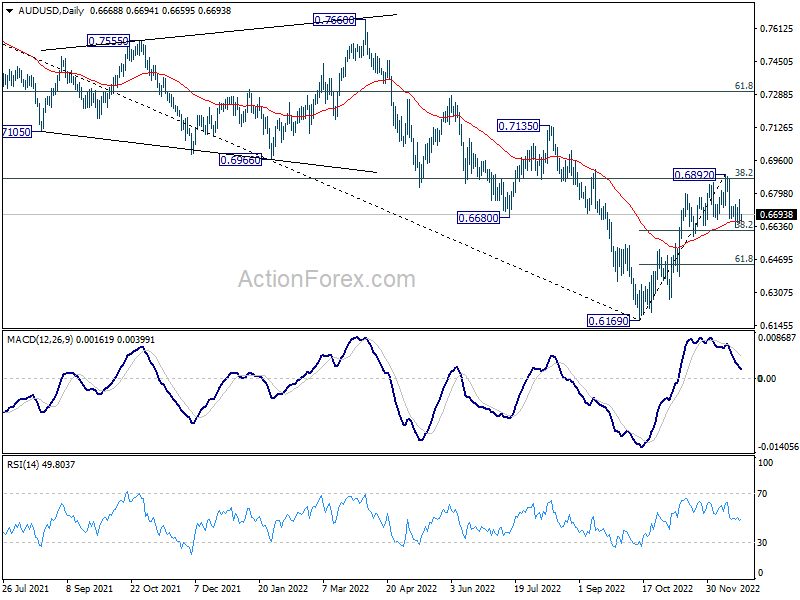
In the bigger picture, it's still unsure if price actions from 0.6169 medium term bottom are developing into a corrective pattern or trend reversal. Rejection by 38.2% retracement of 0.8006 to 0.6169 at 0.6871 will maintain medium term bearishness for another fall through 0.6169 at a later stage. However, firm break of 0.6871, and sustained trading above 55 week EMA (now at 0.6900) will raise the chance of the start of a bullish up trend.
USD/JPY Daily Outlook
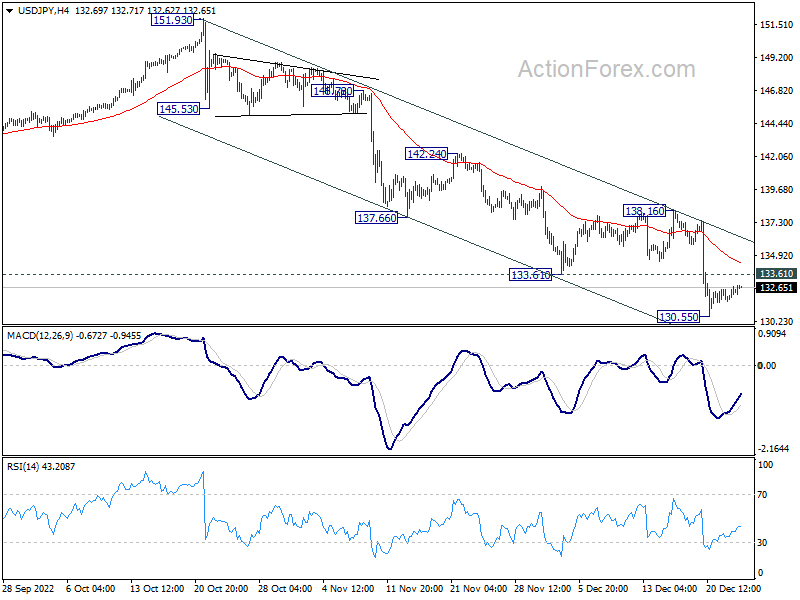
Daily Pivots: (S1) 131.78; (P) 132.24; (R1) 132.85; More...
USD/JPY is still bounded in tight range above 130.55 and intraday bias remains neutral. Immediate focus remains on 55 week EMA (now at 131.76). Decisive break there will pave the way to next fibonacci level at 121.43. On the upside, above 133.61 support turned resistance will turn intraday bias back to the upside for 138.16 resistance.
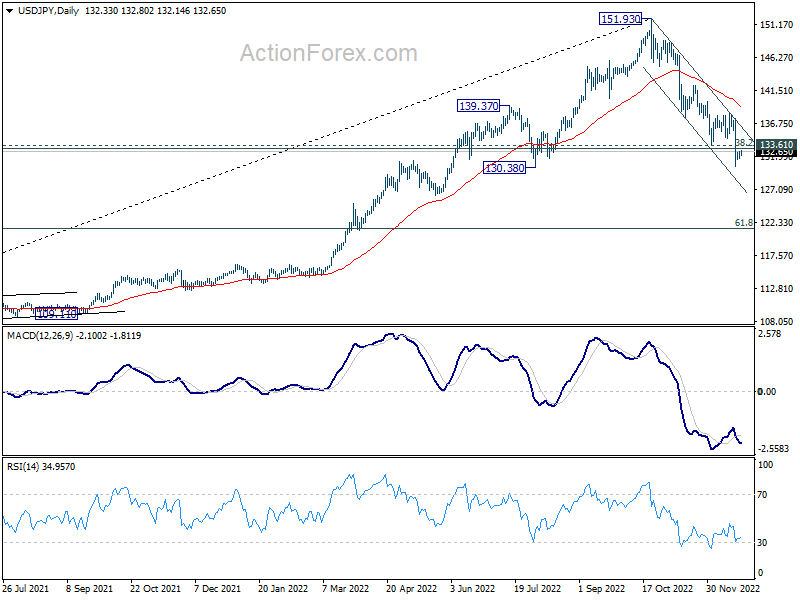
In the bigger picture, price actions from 151.93 medium term could be just a corrective pattern to up trend from 102.58 (2021 low). Strong support from 38.2% retracement of 102.58 to 151.93 at 133.07 and 55 week EMA (now at 131.76) will set the range for such corrective pattern. However, sustained break of 55 week EMA will pave the way to 61.8% retracement at 121.43.
USD/CHF Daily Outlook
Daily Pivots: (S1) 0.9250; (P) 0.9286; (R1) 0.9344; More...
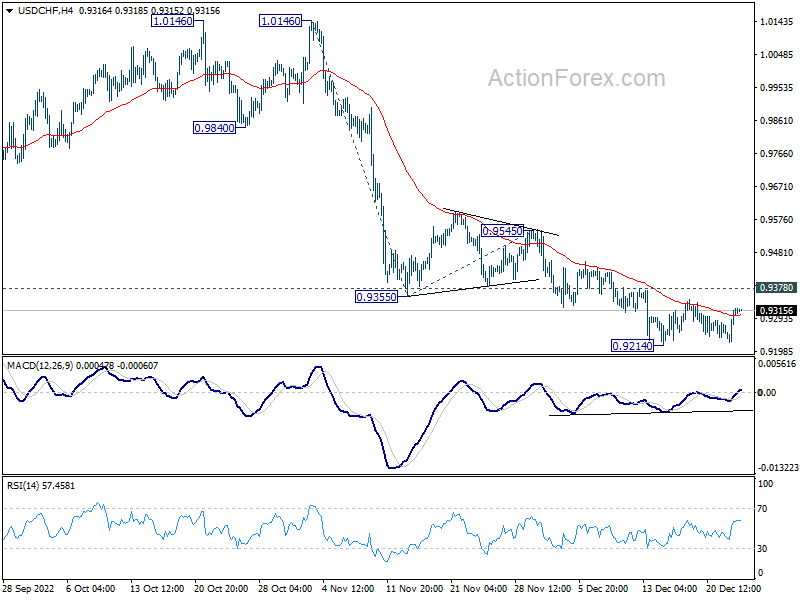
Range trading continues in USD/CHF and intraday bias remains neutral for the moment. Further decline is in favor with 0.9378 resistance intact. On the downside, break of 0.9214 will resume the fall and target 61.8% projection of 1.0146 to 0.9355 from 0.9545 at 0.9056. However, break of 0.9378 resistance will indicate short term bottoming and turn bias back to the upside for 0.9545 resistance instead.
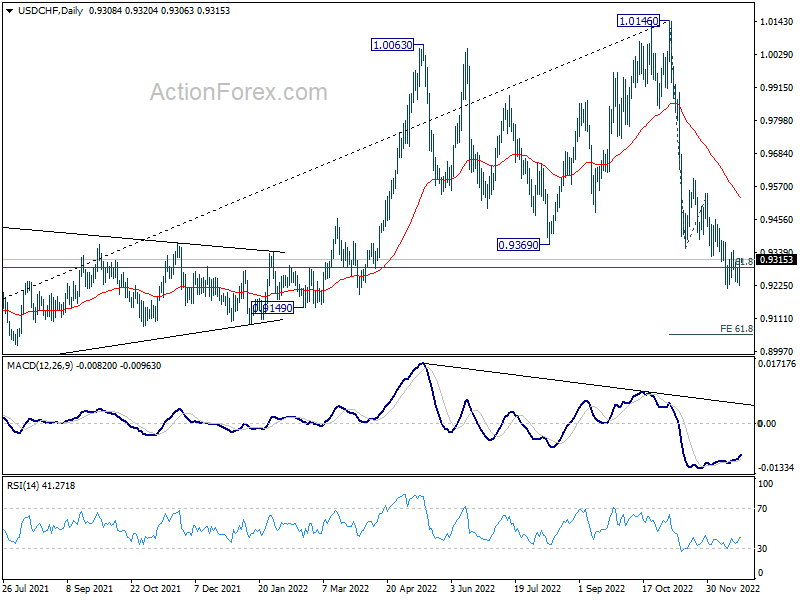
In the bigger picture, rise from 0.8756 (2021 low) has completed at 1.0146, well ahead of 1.0342 long term resistance (2016 high). Based on current downside momentum, fall from 1.0146 might be a medium term down trend itself. Sustained break of 61.8% retracement of 0.8756 to 1.0146 at 0.9287 will pave the way to 0.8756. In any case, risk will stay on the downside as long as 0.9545 resistance holds.
GBP/USD Daily Outlook
Daily Pivots: (S1) 1.1974; (P) 1.2061; (R1) 1.2129; More...
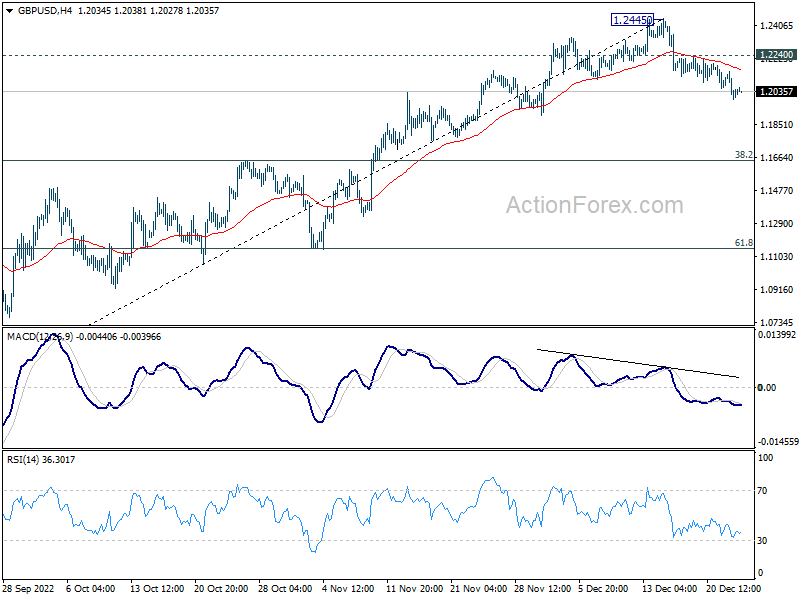
No change in GBP/USD's outlook. Intraday bias stays on the downside as fall form 1.2445 is in progress for 55 day EMA (now at 1.1900). Firm break there will target 38.2% retracement of 1.0351 to 1.2445 at 1.1645. On the upside, break of 1.2240 minor resistance will turn bias back to the upside for retesting 1.2445 instead.
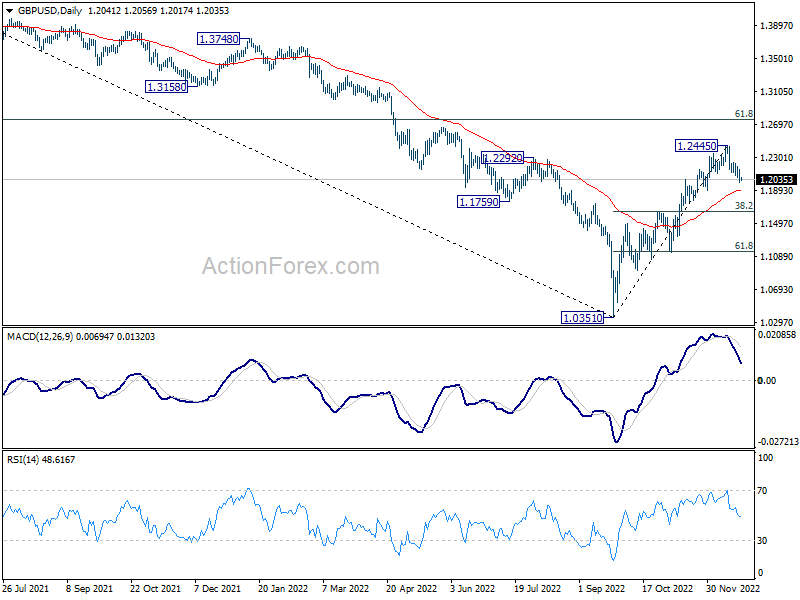
In the bigger picture, rise from 1.0351 medium term bottom is at least correcting whole down trend from 1.4248 (2021 high). Further rise is expected as long as 1.1644 resistance turned support holds. Next target is 61.8% retracement of 1.4248 to 1.0351 at 1.2759. Sustained break there will pave the way back to 1.4248. This will remain the favored case as long as 55 day EMA (now at 1.1900) holds.
EUR/USD Daily Outlook
Daily Pivots: (S1) 1.0562; (P) 1.0611; (R1) 1.0648; More...
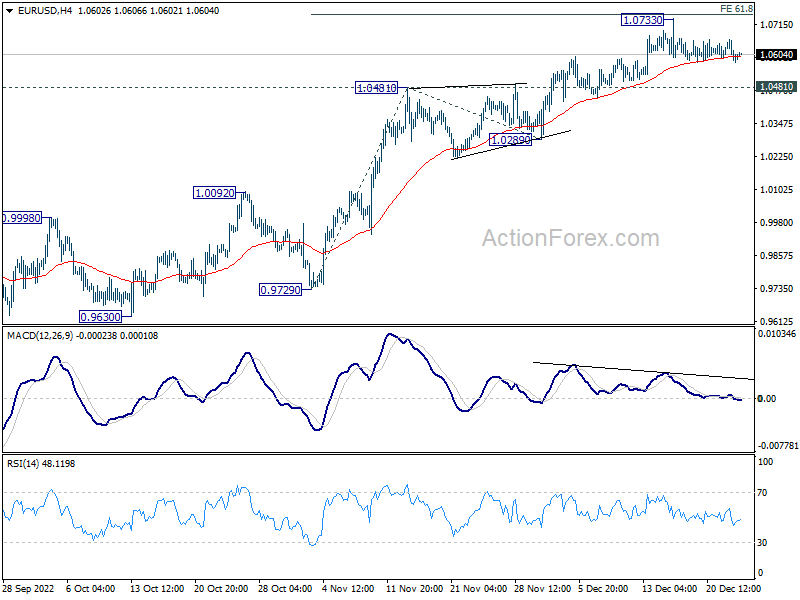
Intraday bias in EUR/USD stays neutral as range trading continues. Further rally is expected as long as 1.0481 resistance turned support holds. Firm break of 61.8% projection of 0.9729 to 1.0481 from 1.0289 at 1.0754 will pave the way to 100% projection at 1.1041. However, firm break of 1.0481 will confirm short term topping and bring deeper fall to 1.0289 support.
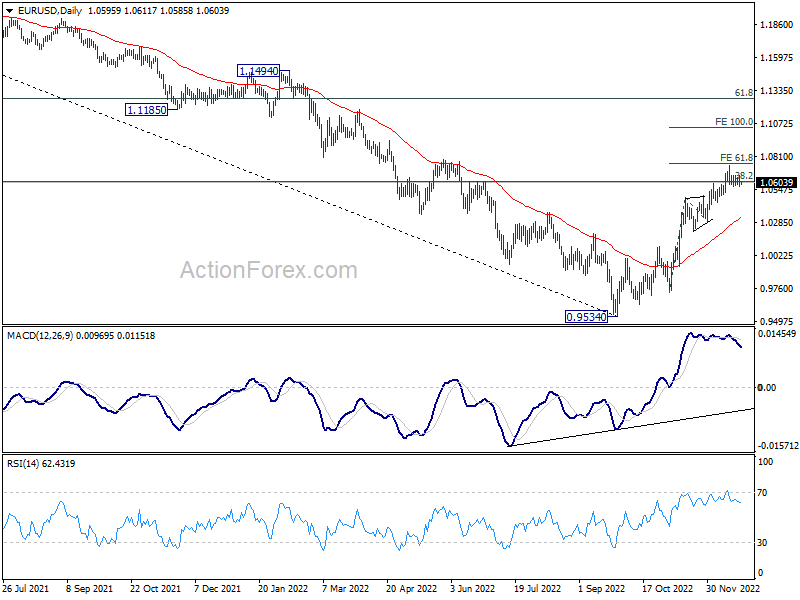
In the bigger picture, focus stays on 38.2% retracement of 1.2348 (2021 high) to 0.9534 at 1.0609. Rejection by 1.0609 will suggest that price actions from 0.9534 medium term bottom are developing into a corrective pattern. Thus, medium bearishness is retained for another fall through 0.9534 at a later stage. However, sustained break of 1.0609 will raise the chance of trend reversal and target 61.8% retracement at 1.1273.
Dollar Mixed as Markets Tread Water
Trading is rather subdued in pre-holiday markets today. Yen was softer in Asian session but remains the strongest one for the week, maintaining most of post-BoJ gains. There was little reaction to CPI data from Japan. Canadian Dollar is the second strongest followed by Swiss France. On the other hand, New Zealand Dollar is the worst, followed by Sterling and then Aussie. Dollar and Euro are mixed, and they're stuck in range against each other too.
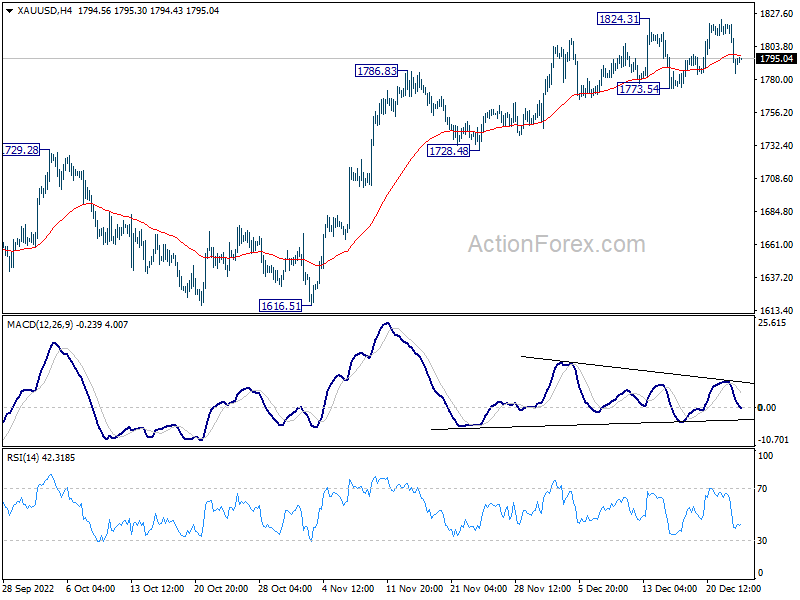
Technically, Gold was rejected by 1824.31 resistance and dropped notably. Still, it's stuck in familiar range for now. Further rise is mildly in favor as long as 1773.54 support holds. Break of 1824.31 will resume whole rally from 1616.51. However, break of 1773.54 should at latest bring deeper decline back to 1728.48 support. Gold's breakout could be used signal or confirmation to EUR/USD's.
In Asia, Nikkei dropped -0.94%. Hong Kong HSI is down -0.47%. China Shanghai SSE is down -0.24%. Singapore Strait Times is down -0.49%. Japan 10-year JGB yield is down -0.0025 at 0.396. Overnight, DOW dropped -1.05%. S&P 500 dropped -1.45%. NASDAQ dropped -2.18%. 10-year yield dropped -0.015 to 3.669.
Japan CPI core rose to 3.7% yoy, highest in 40 yrs
Japan CPI core (all item ex fresh food) accelerate further from 3.6% yoy to 3.7% yoy in November, matched expectations. That's also the highest level in more than 40 years since 1981.
CPI core-core (all time ex fresh food and energy), also rose from 2.5% yoy to 2.8% yoy, above expectation of 2.7% yoy. Headline all item CPI ticked up from 3.7% yoy to 3.8% yoy, above expectation of 3.7% yoy.
Looking ahead
US personal income and spending with PCE inflation, durable goods orders, and new home sales will be featured in US session. Canada will release GDP.
EUR/USD Daily Outlook
Daily Pivots: (S1) 1.0562; (P) 1.0611; (R1) 1.0648; More...
Intraday bias in EUR/USD stays neutral as range trading continues. Further rally is expected as long as 1.0481 resistance turned support holds. Firm break of 61.8% projection of 0.9729 to 1.0481 from 1.0289 at 1.0754 will pave the way to 100% projection at 1.1041. However, firm break of 1.0481 will confirm short term topping and bring deeper fall to 1.0289 support.
In the bigger picture, focus stays on 38.2% retracement of 1.2348 (2021 high) to 0.9534 at 1.0609. Rejection by 1.0609 will suggest that price actions from 0.9534 medium term bottom are developing into a corrective pattern. Thus, medium bearishness is retained for another fall through 0.9534 at a later stage. However, sustained break of 1.0609 will raise the chance of trend reversal and target 61.8% retracement at 1.1273.
Economic Indicators Update
| GMT | Ccy | Events | Actual | Forecast | Previous | Revised |
|---|---|---|---|---|---|---|
| 23:30 | JPY | National CPI Core Y/Y Nov | 3.70% | 3.70% | 3.60% | |
| 23:50 | JPY | BoJ Minutes | ||||
| 13:30 | CAD | GDP M/M Oct | 0.10% | 0.10% | ||
| 13:30 | USD | Personal Income M/M Nov | 0.20% | 0.70% | ||
| 13:30 | USD | Personal Spending Nov | 0.20% | 0.80% | ||
| 13:30 | USD | PCE Price Index M/M Nov | 0.30% | 0.30% | ||
| 13:30 | USD | PCE Price Index Y/Y Nov | 5.30% | 6.00% | ||
| 13:30 | USD | Core PCE Price Index M/M Nov | 0.40% | 0.20% | ||
| 13:30 | USD | Core PCE Price Index Y/Y Nov | 4.60% | 5.00% | ||
| 13:30 | USD | Durable Goods Orders Nov | -0.70% | 1.10% | ||
| 13:30 | USD | Durable Goods Orders ex Transportation Nov | 0.10% | 0.50% | ||
| 15:00 | USD | New Home Sales Nov | 600K | 632K | ||
| 15:00 | USD | Michigan Consumer Sentiment Index Dec F | 59.1 | 59.1 |
Technical Outlook and Review
USD/JPY:
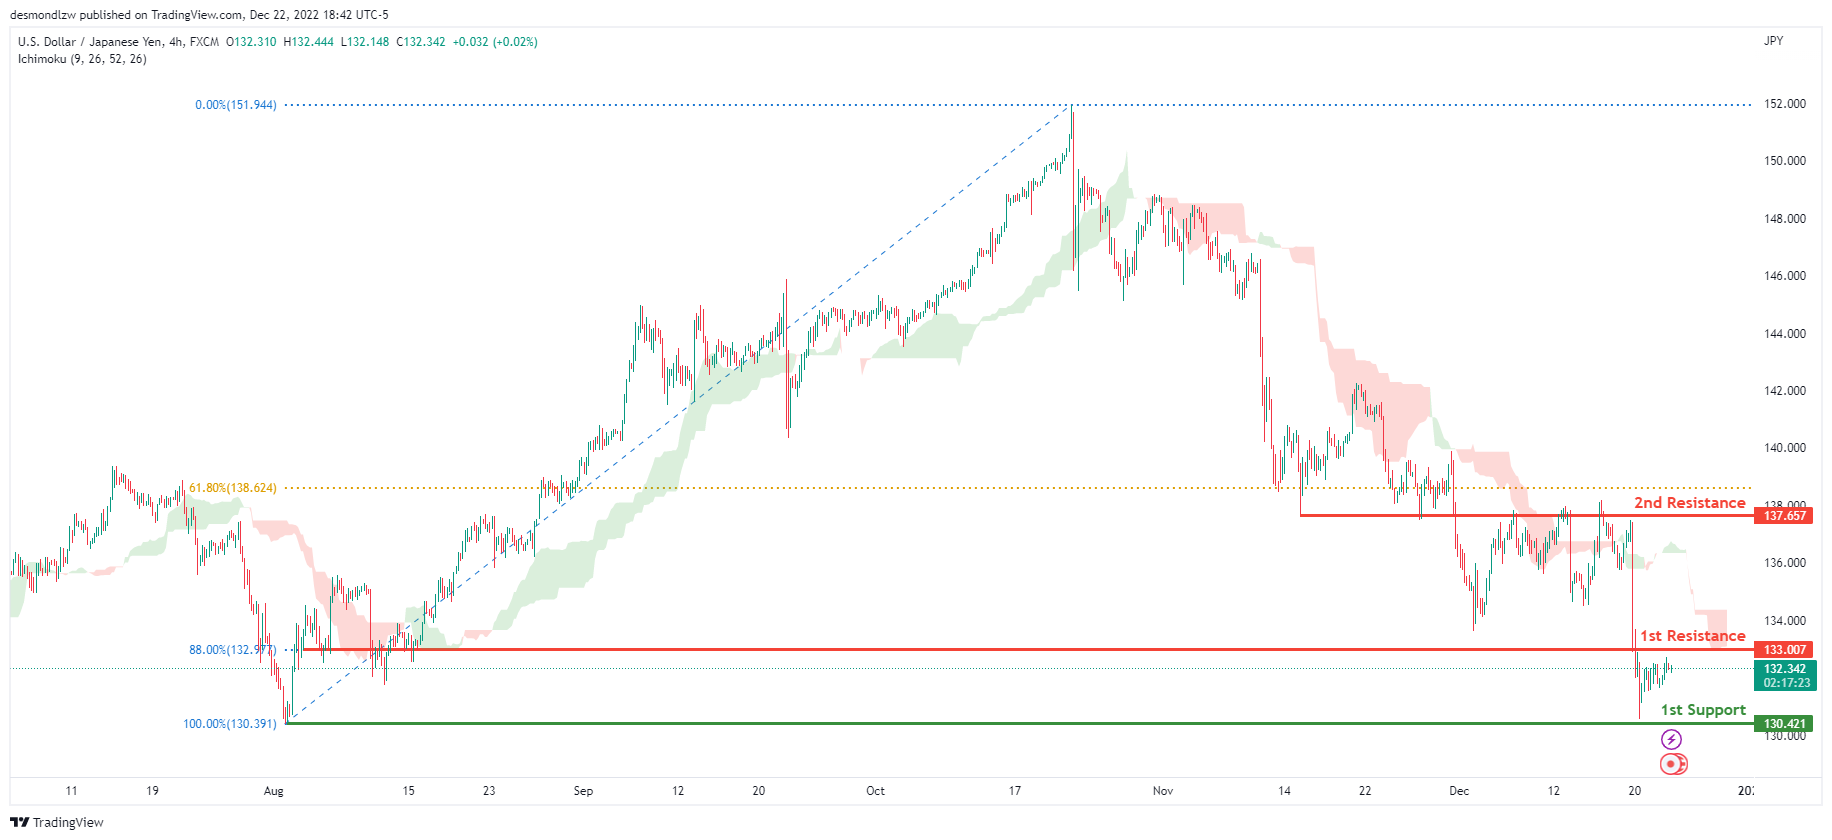
Looking at the H4 chart, my overall bias for USDJPY is bearish due to the current price being below the Ichimoku cloud, indicating a bearish market. If this bearish momentum continues, expect price to possibly head towards the 1st support at 130.421, where the previous swing low is located. In an alternate scenario, price could possibly head back up towards the 1st resistance level at 133.007 where the 88% Fibonacci line is.
Areas of consideration:
- H4 time frame, 1st resistance at 137.657
- H4 time frame, 2nd resistance at 140.356
- H4 time frame, 1st support at 133.007
DXY:
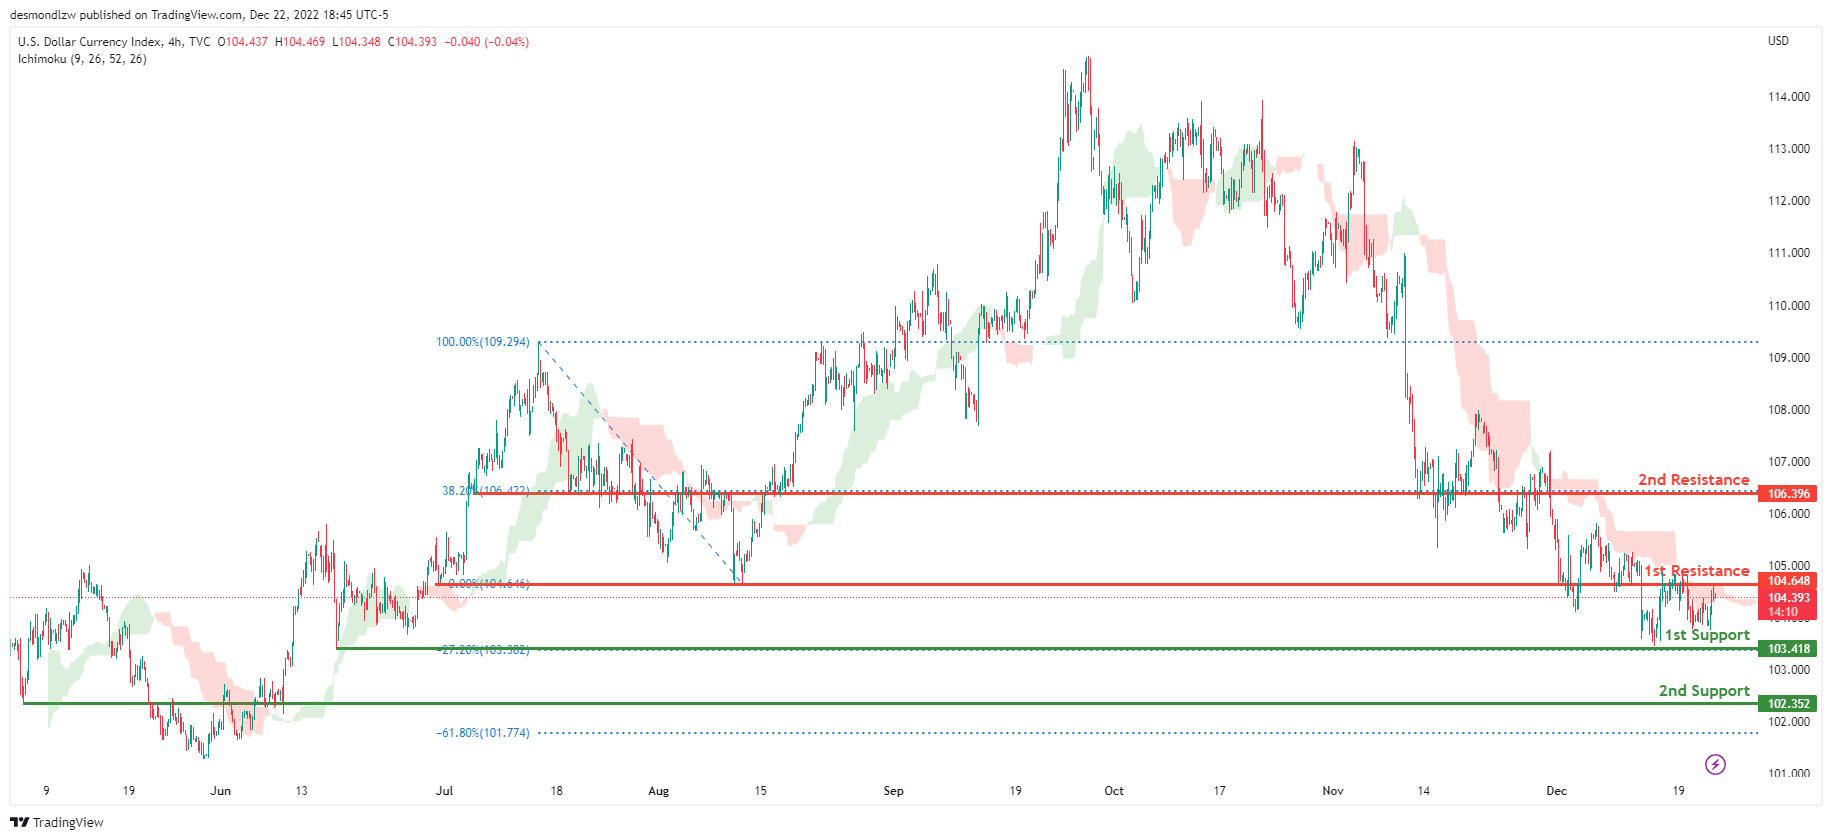
On the H4 chart, the overall bias for DXY is bearish. To add confluence to this, the price is below the Ichimoku cloud which indicates a bearish market. If this bearish momentum continues, expect the price to possibly break the 1st support line at 103.418, where the -27.2% Fibonacci expansion line is before heading towards the 2nd support at 102.352, where the -61.8% Fibonacci expansion line is. In an alternative scenario, price could head back up and break the 1st resistance line resistance at 104.648, where the previous swing low is before heading towards the 2nd resistance at 106.396, where the 38.2% Fibonacci line is.
Areas of consideration:
- H4 time frame, 1st resistance at 104.648
- H4 time frame, 1st support at 103.418
- H4 time frame, 2nd support at 102.352
EUR/USD:
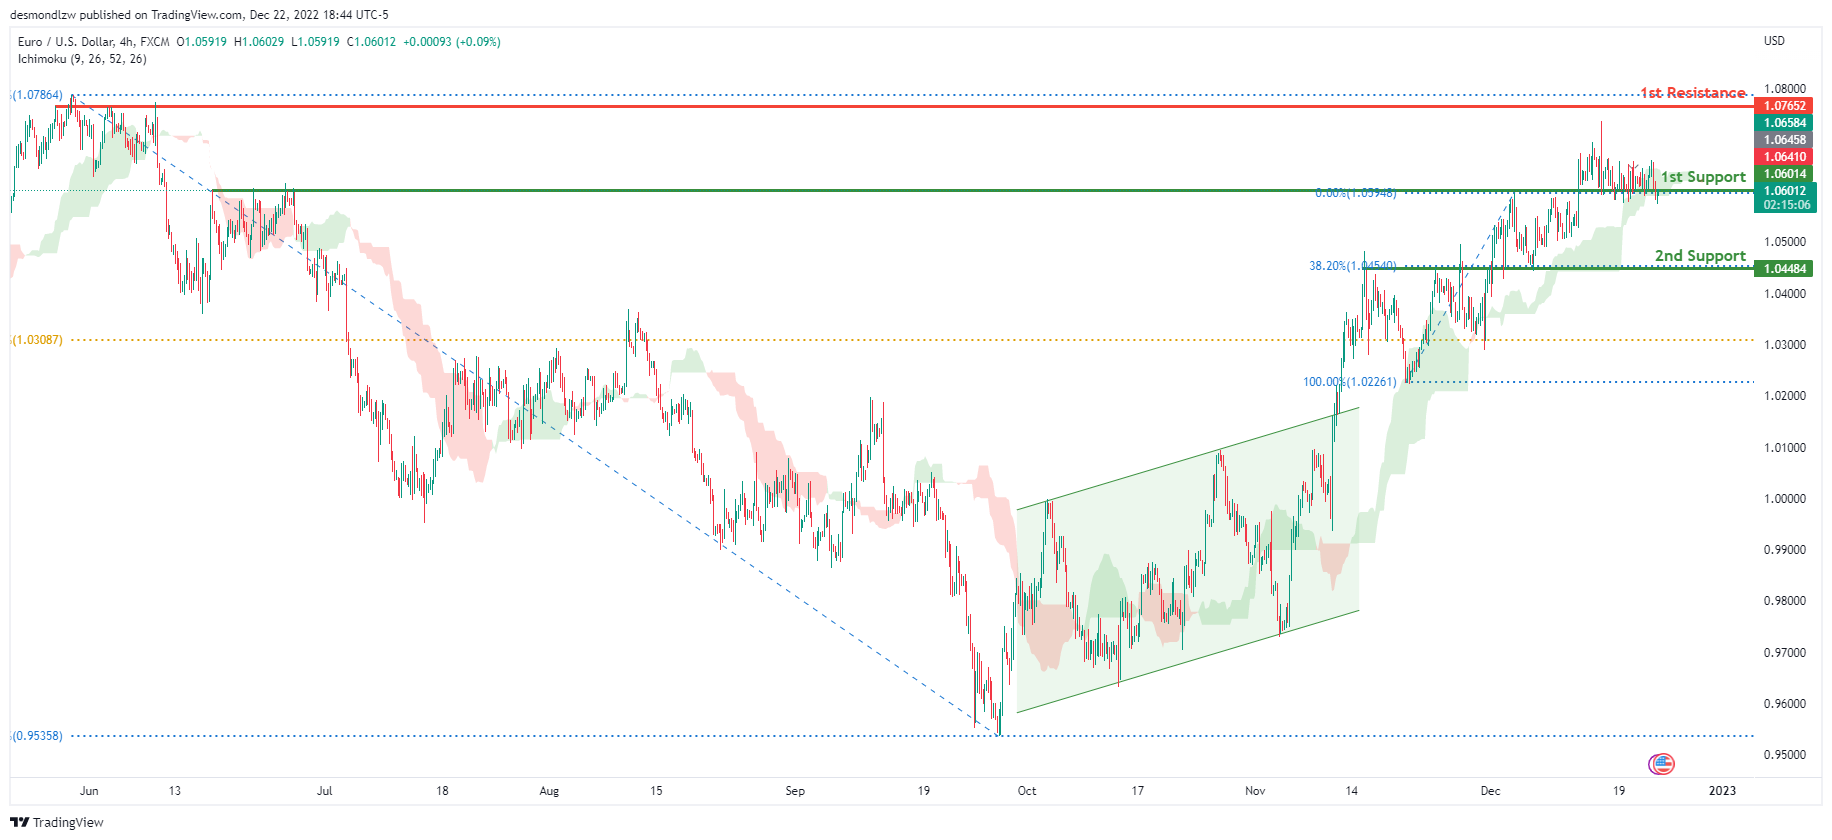
Looking at the H4 chart, my overall bias for EURUSD is bullish due to the current price being above the Ichimoku cloud, indicating a bullish market. To add confluence to this bias, price has also broken above the ascending bullish channel. If this bullish momentum continues, expect the price to possibly head towards the 1st resistance at 1.07652, where the previous swing high is. In an alternate scenario, price could possibly head back down to break the 1st support level at 1.06014, where the previous swing high and 78.6% Fibonacci line are located before heading towards the 2nd support at 1.04484, where the 38.2% Fibonacci line is.
Areas of consideration :
- H4 1st resistance at 1.07652
- H4 1st support at 1.06014
- H4 2nd support at 1.04484
GBP/USD:
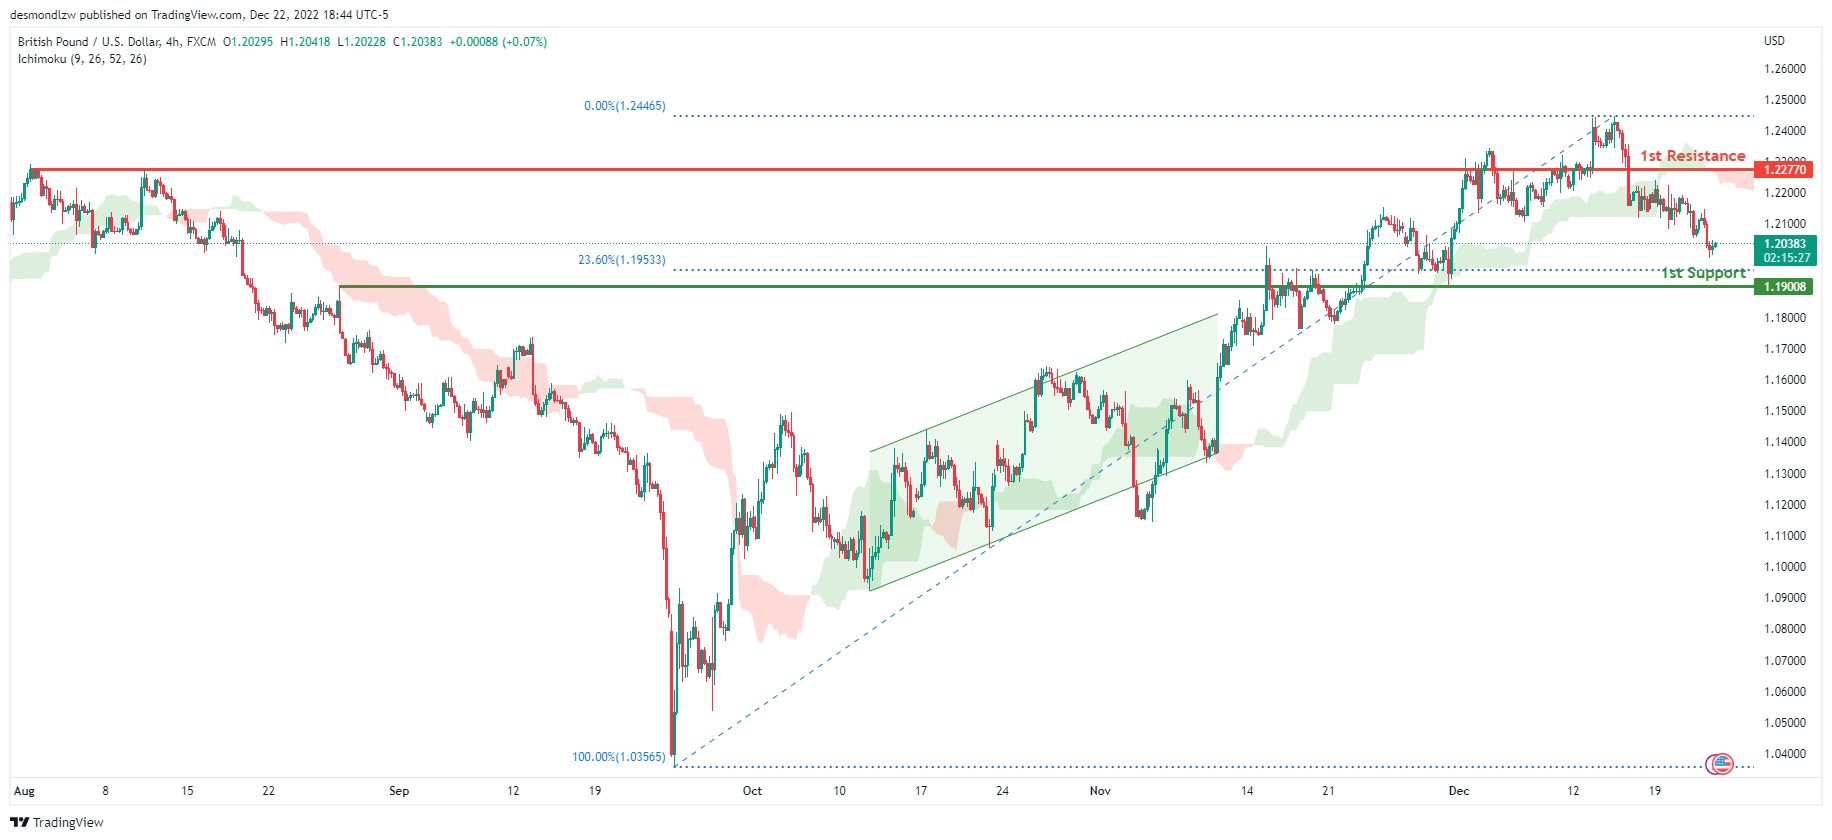
Looking at the H4 chart, my overall bias for GBPUSD is bearish due to the current price being below the Ichimoku cloud, indicating a bearish market. If this bearish momentum continues, expect price to possibly continue heading towards the 1st support at 1.19008, where the 23.6% Fibonacci line is. In an alternate scenario, price could possibly head back up to retest the 1st resistance level at 1.22770, where the previous swing high is.
Areas of consideration:
- H4 1st resistance at 1.22770
- H4 1st support at 1.19008
USD/CHF:
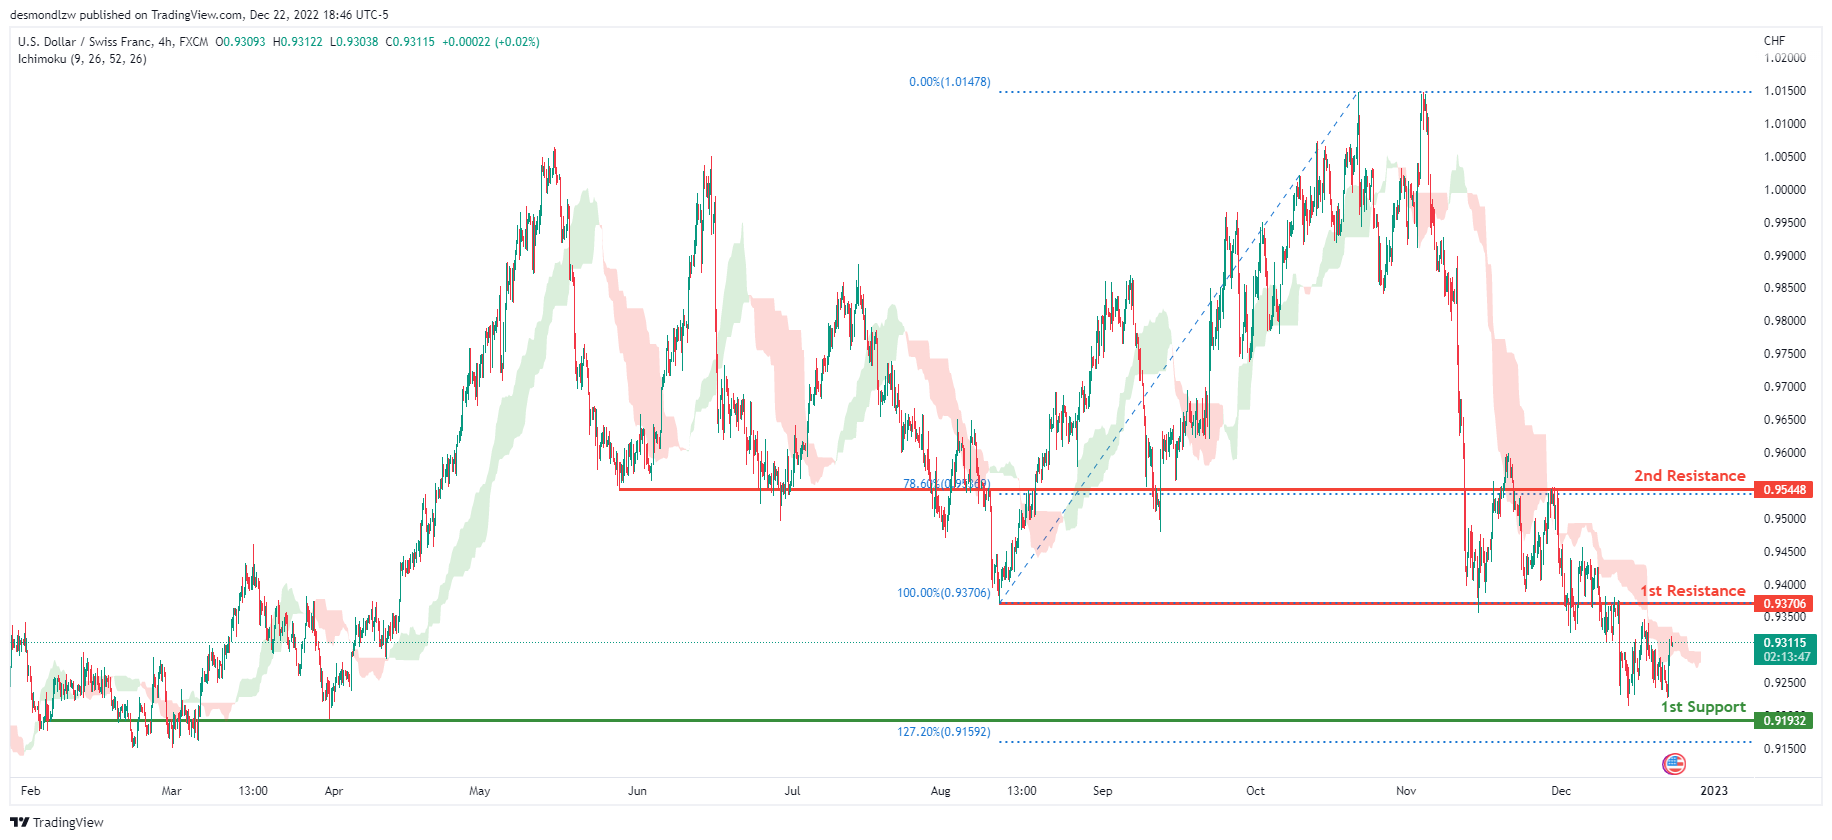
The overall bias for USDCHF on the H4 chart is bearish. In addition, the price is crossing below the Ichimoku cloud, indicating a bearish market. If the current bearish trend continues, expect the price to head back down towards the 1st support line at 0.91932, where the previous swing low and 12.72% Fibonacci extension line is . In an alternative scenario, price could possibly head up towards the 1st resistance at 0.93706, where the previous swing low is .
Areas of consideration
- H4 1st support at 0.91932
- H4 1st resistance at 0.93706
XAU/USD (GOLD):
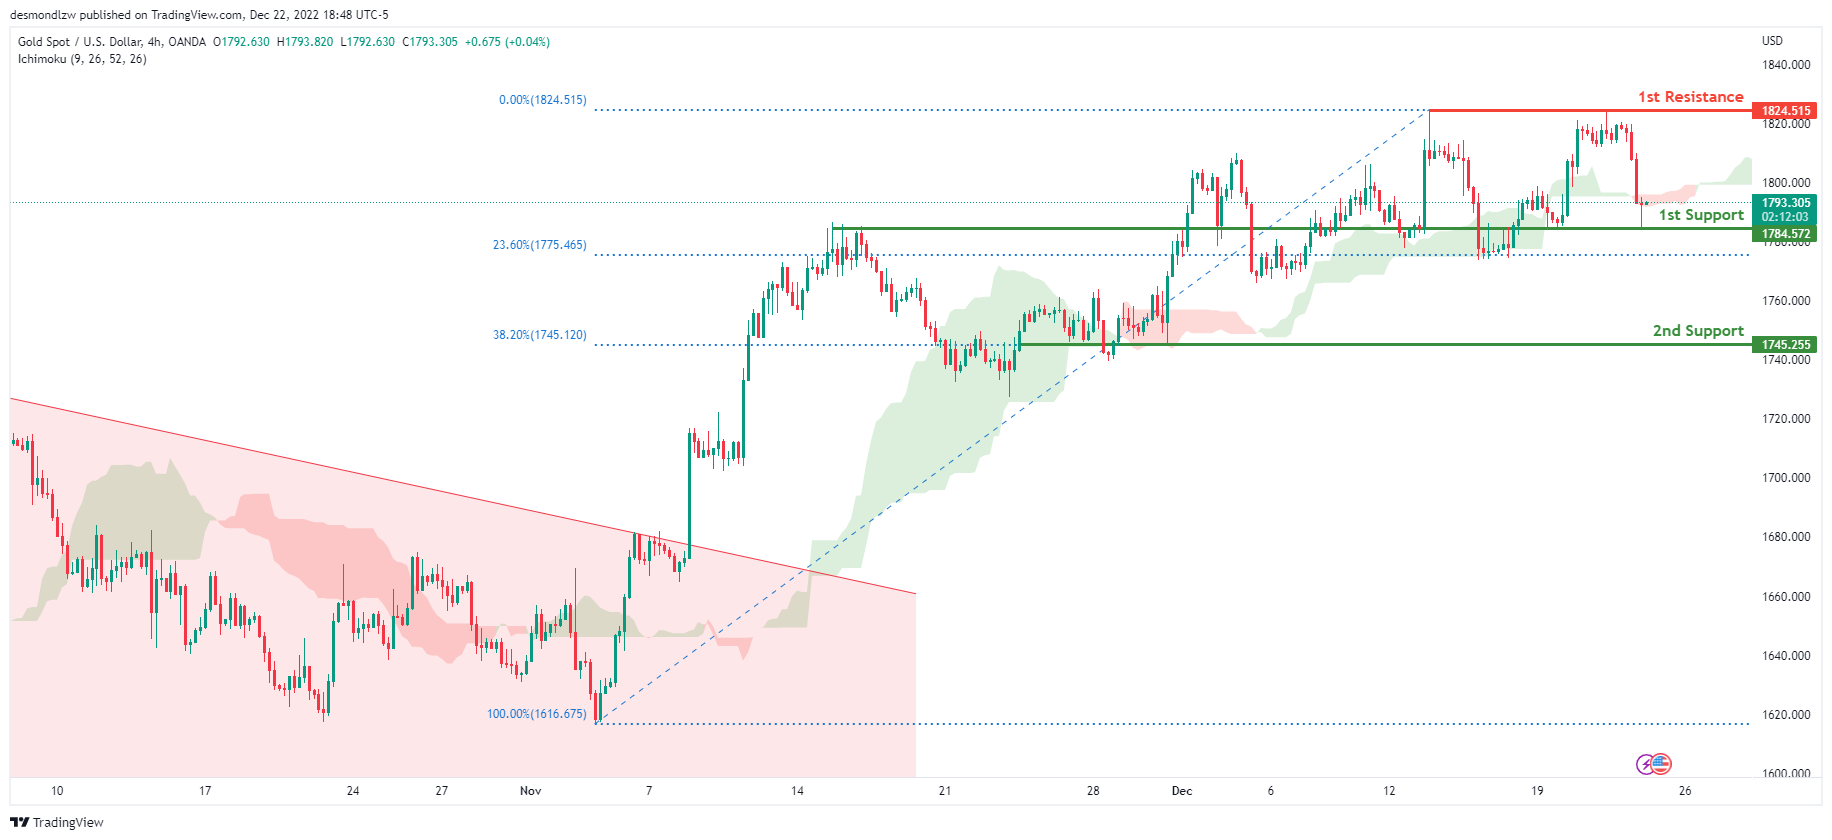
Looking at the H4 chart, my overall bias for XAUUSD is bullish due to the current price crossing above the Ichimoku cloud, indicating a bullish market. If this bullish momentum continues, expect the price to continue heading towards the 1st resistance at 1824.515 where the recent high is. In an alternative scenario, price could possibly head back down to break the 1st support at 1784.572, where the previous high is before heading towards the 2nd support at 1745.255, where the 38.2% Fibonacci line is.
Areas of consideration:
- H4 time frame, 1st resistance at 1824.515
- H4 time frame, 1st support at 1784.572
- H4 time frame, 2nd support at 1745.255
AUD/USD:
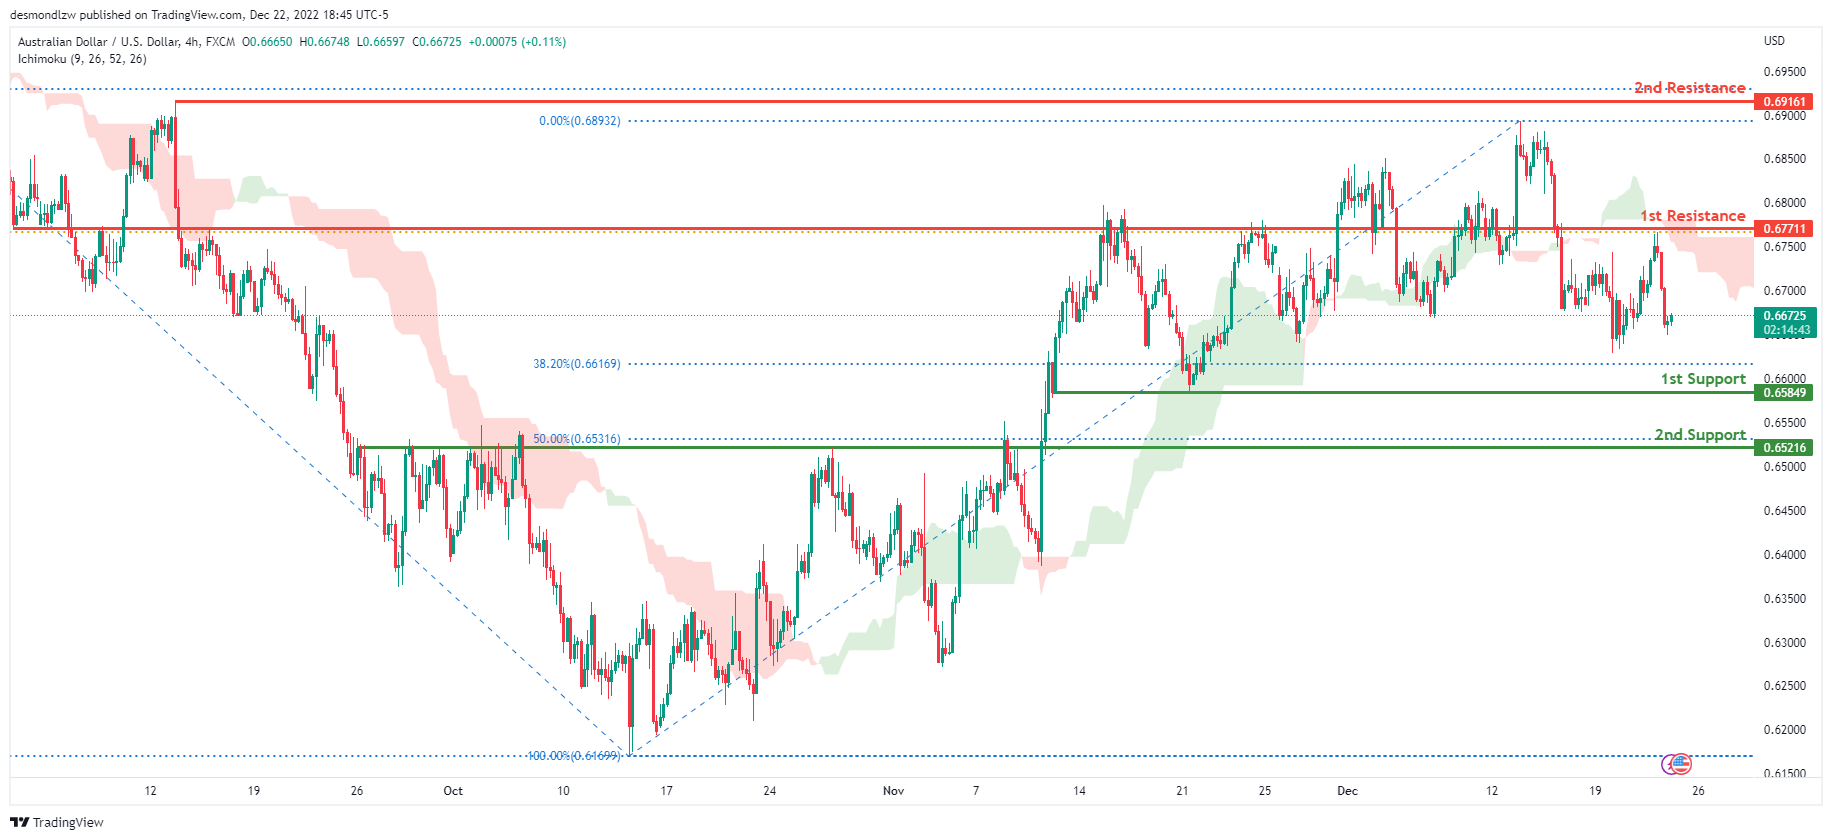
Looking at the H4 chart, my overall bias for AUDUSD is bearish due to the current price being below the Ichimoku cloud, indicating a bearish market. If this bearish momentum continues, expect the price to continue heading towards the 1st support at 0.65849, where the 78.6% Fibonacci line is. In an alternative scenario, price could possibly head back up towards the 1st resistance at 0.67711, where the 61.8% Fibonacci line is
Areas of consideration
- H4, 1st resistance at 0.67711
- H4, 1st support at 0.65849
NZD/USD:
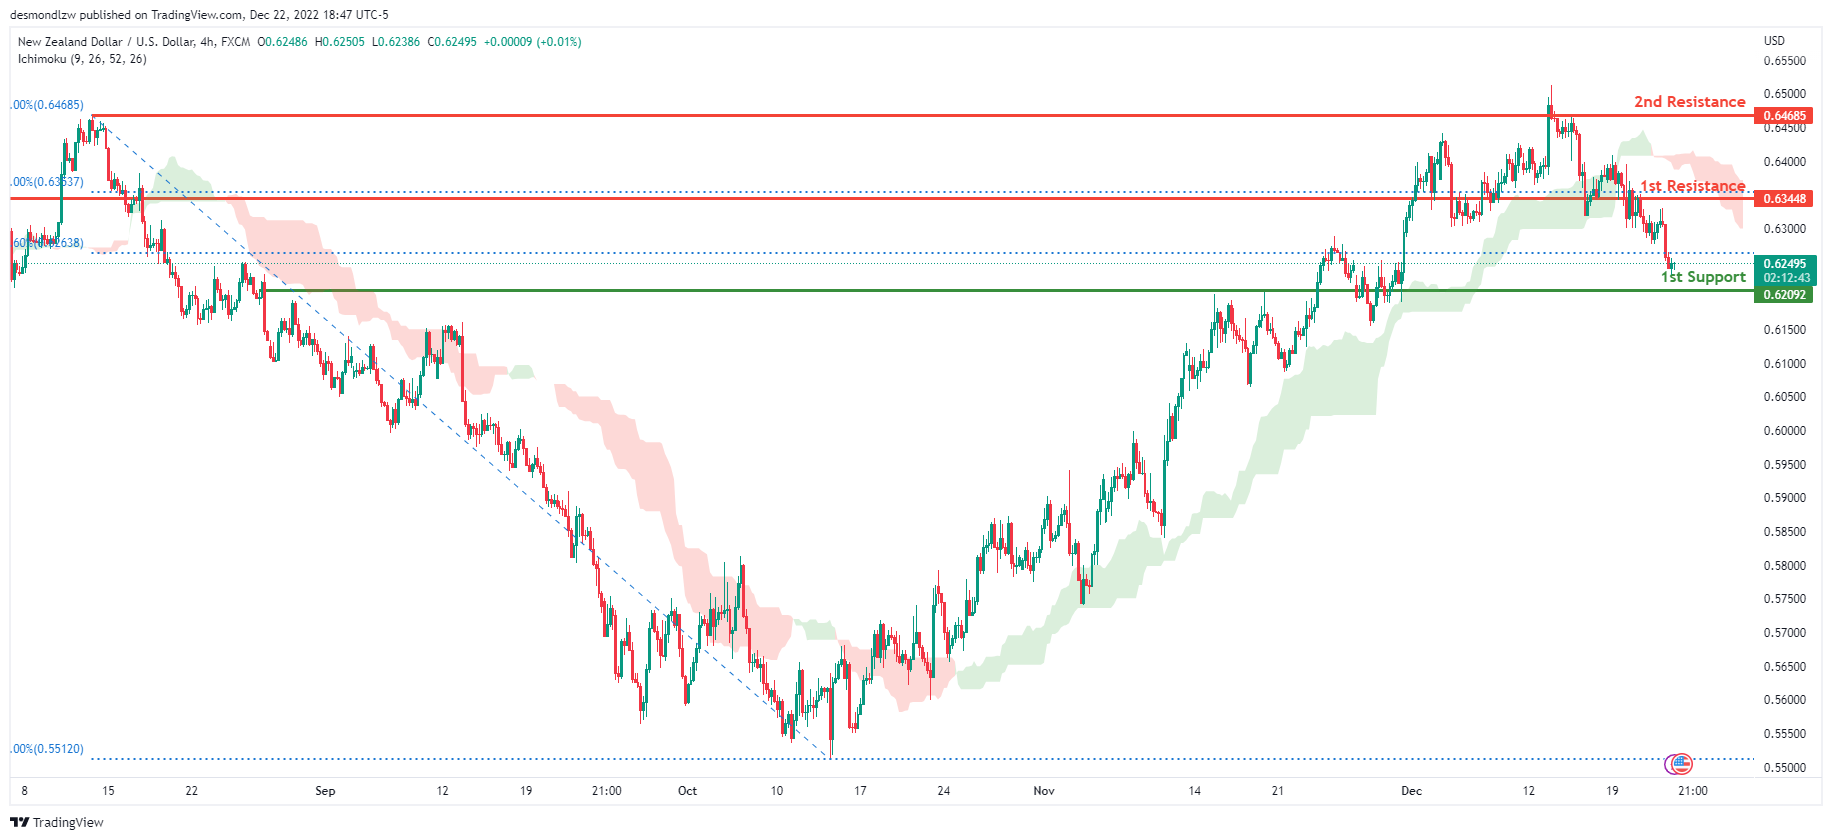
Looking at the H4 chart, my overall bias for NZDUSD is bearish due to the current price being below the Ichimoku cloud, indicating a bearish market. If this bearish momentum continues, expect price to possibly continue heading towards the 1st support at 0.62092, where the 78.6% Fibonacci line is. In an alternate scenario, price could possibly head back up towards the 1st resistance level at 0.63448, where the 88% Fibonacci line is.
Areas of consideration:
- H4 time frame, 1st resistance at 0.63448
- H4 time frame, 1st support at 0.62092
USD/CAD:
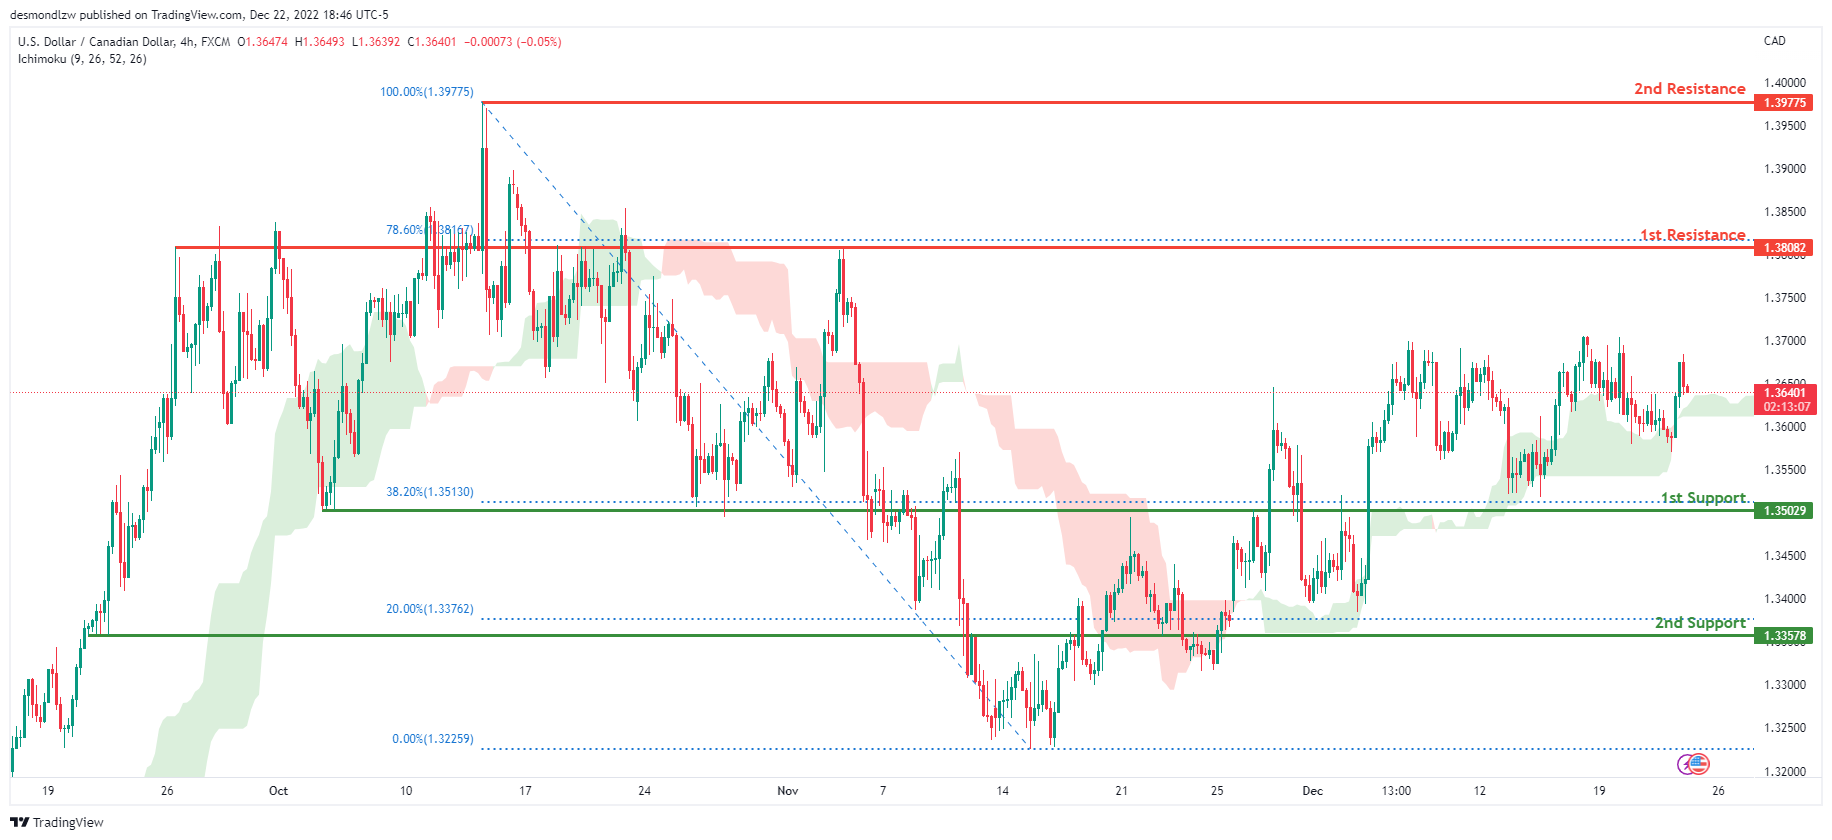
On the H4 chart, the overall bias for USDCAD is bullish. To add confluence to this, the price is crossing above the Ichimoku cloud which indicates a bullish market. If this bullish momentum continues, expect the price to head towards 1st resistance line at 1.38082, where the 78.6% Fibonacci line is. In an alternative scenario, price could head back down to retest the 1st support at 1.35029, where the 38.2% Fibonacci line is.
Areas of consideration:
- H4 time frame, 1st resistance at 1.38082
- H4 time frame, 2nd resistance at 1.39775
- H4 time frame, 1st support at 1.35029
OIL:
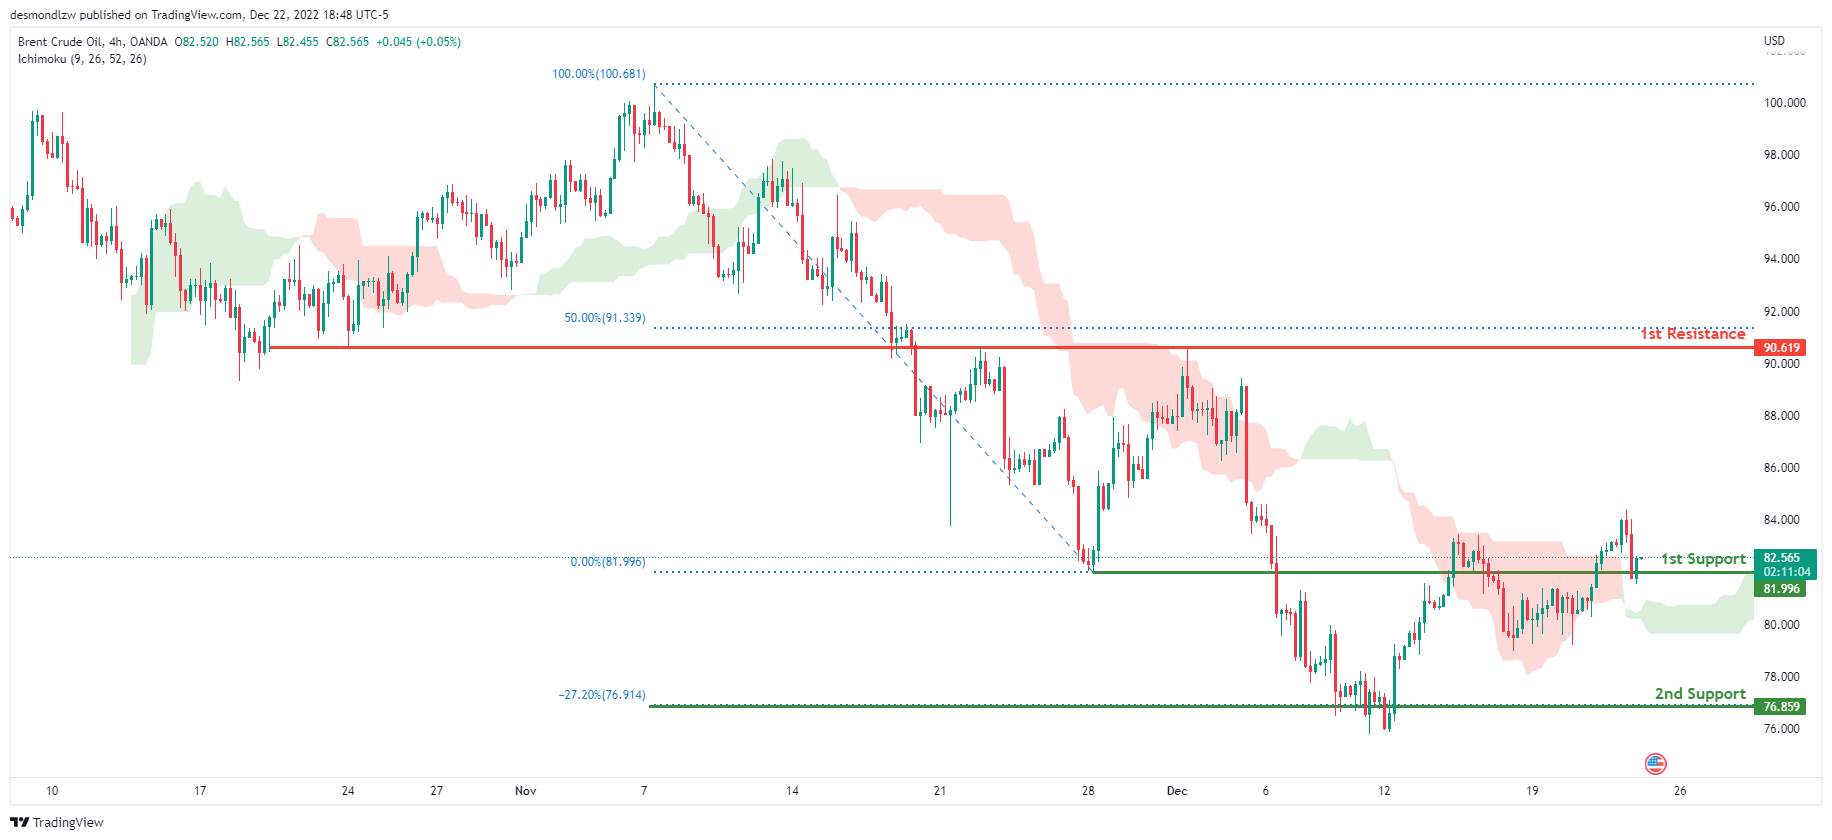
Looking at the H4 chart, my overall bias for BCOUSD is bullish due to the current price being above the Ichimoku cloud, indicating a bullish market. If this bullish momentum continues, expect the price to possibly head towards the 1st resistance at 90.619, where the 50% Fibonacci line is. In an alternate scenario, price could possibly head back down to retest the 1st support level at 81.996, where the previous low is located.
Areas of consideration:
- H4 time frame, 1st resistance at 90.619
- H4 time frame, 1st support at 81.996
Dow Jones Industrial Average:
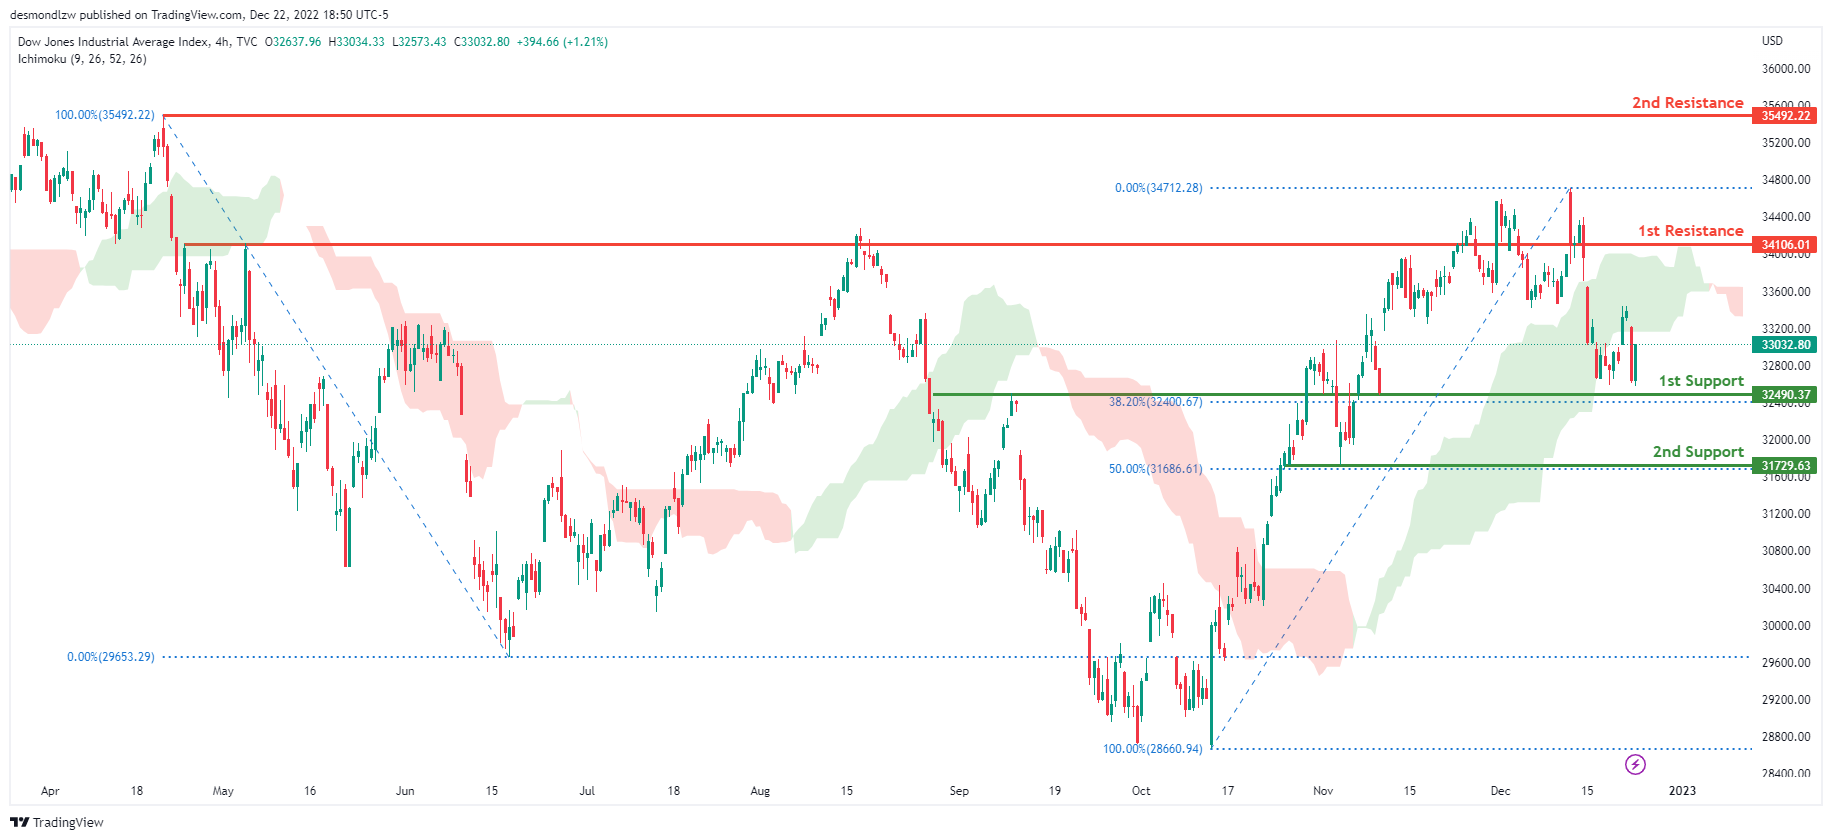
On the H4 chart, the overall bias for DJI is bearish . To add confluence to this, the price is crossing below the Ichimoku cloud which indicates a bearish market. If this bearish momentum continues, expect the price to head back down towards the 1st support at 32490.37, where the 61.8% Fibonacci line is. In an alternative scenario, price could possibly break the 1st resistance line at 34106.01, where the previous swing high is before heading towards the 2nd resistance line at 35492.22, where the previous swing high is.
Areas of consideration:
- H4 time frame, 1st support at 32490.37
- H4 time frame, 1st Resistance at 34106.01
- H4 time frame, 2nd Resistance at 35492.22
DAX:
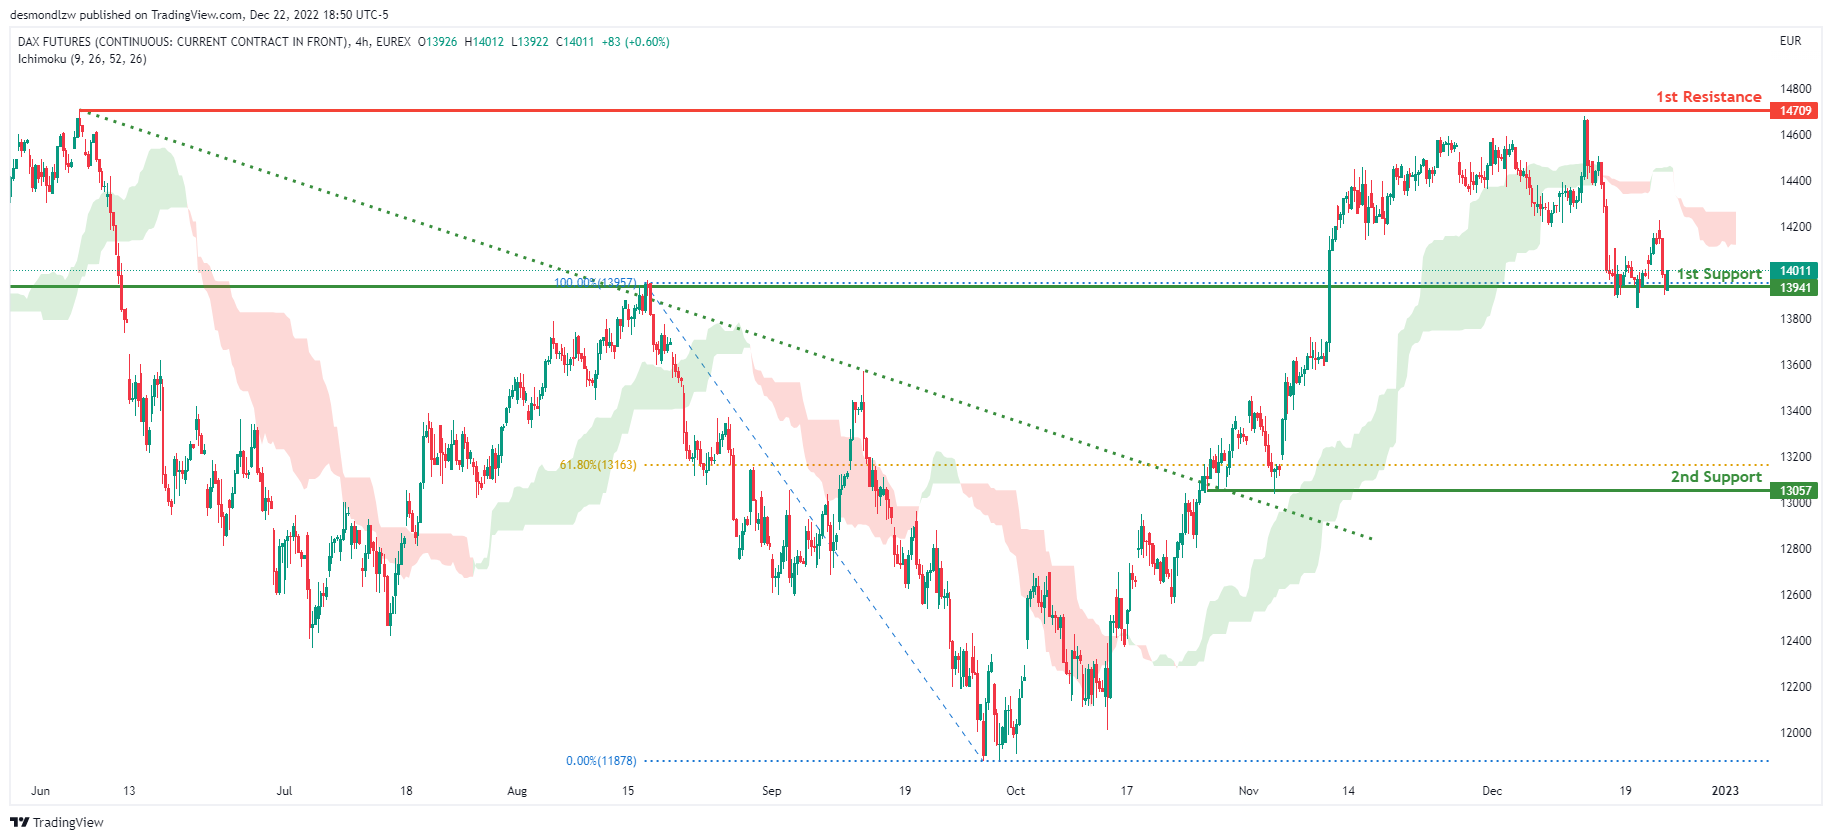
Looking at the H4 chart, my overall bias for DAX is bearish due to the current price being below the Ichimoku cloud, indicating a bearish market. If this bearish momentum continues, expect price to break the 1st support at 13941 where the previous swing high is before heading towards the 2nd support at 13057, where the 61.8% Fibonacci line is. In an alternative scenario, price could possibly head back up to retest the 1st resistance at 14709, where the previous swing high is.
Areas of consideration:
- H4 time frame, 1st resistance is at 14709
- H4 time frame, 1st support is at 13941
- H4 time frame, 2nd support is at 13057
ETHUSD:
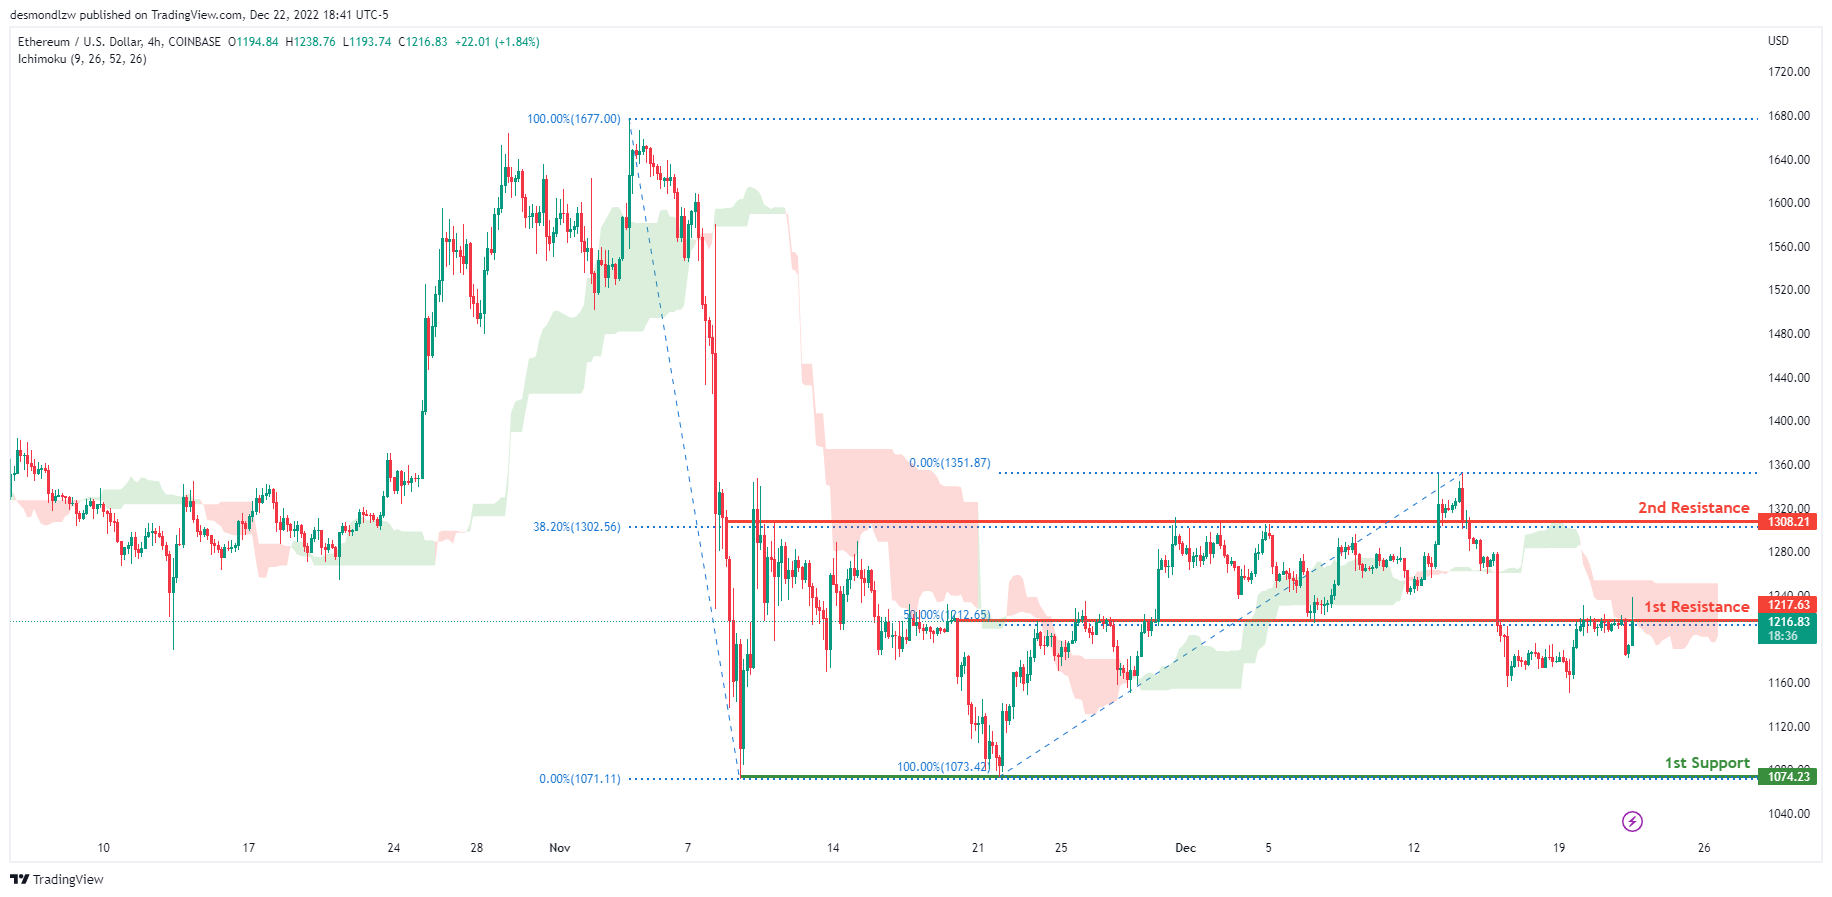
Looking at the H4 chart, my overall bias for ETHUSD is bearish due to the current price crossing below the Ichimoku cloud, indicating a bearish market. If this bearish momentum continues, expect price to head towards the 1st support at 1074.23, where the previous swing low is. In an alternative scenario, price could head back up to break the 1st resistance at 1217.63, where the 50% Fibonacci line is, before heading towards the 2nd resistance at 1308.21, where the 38.2% Fibonacci line is.
Areas of consideration:
- H4 time frame, 1st resistance of 1217.63
- H4 time frame, 2nd resistance of 1308.21
- H4 time frame, 1st support at 1074.23
BTCUSD:
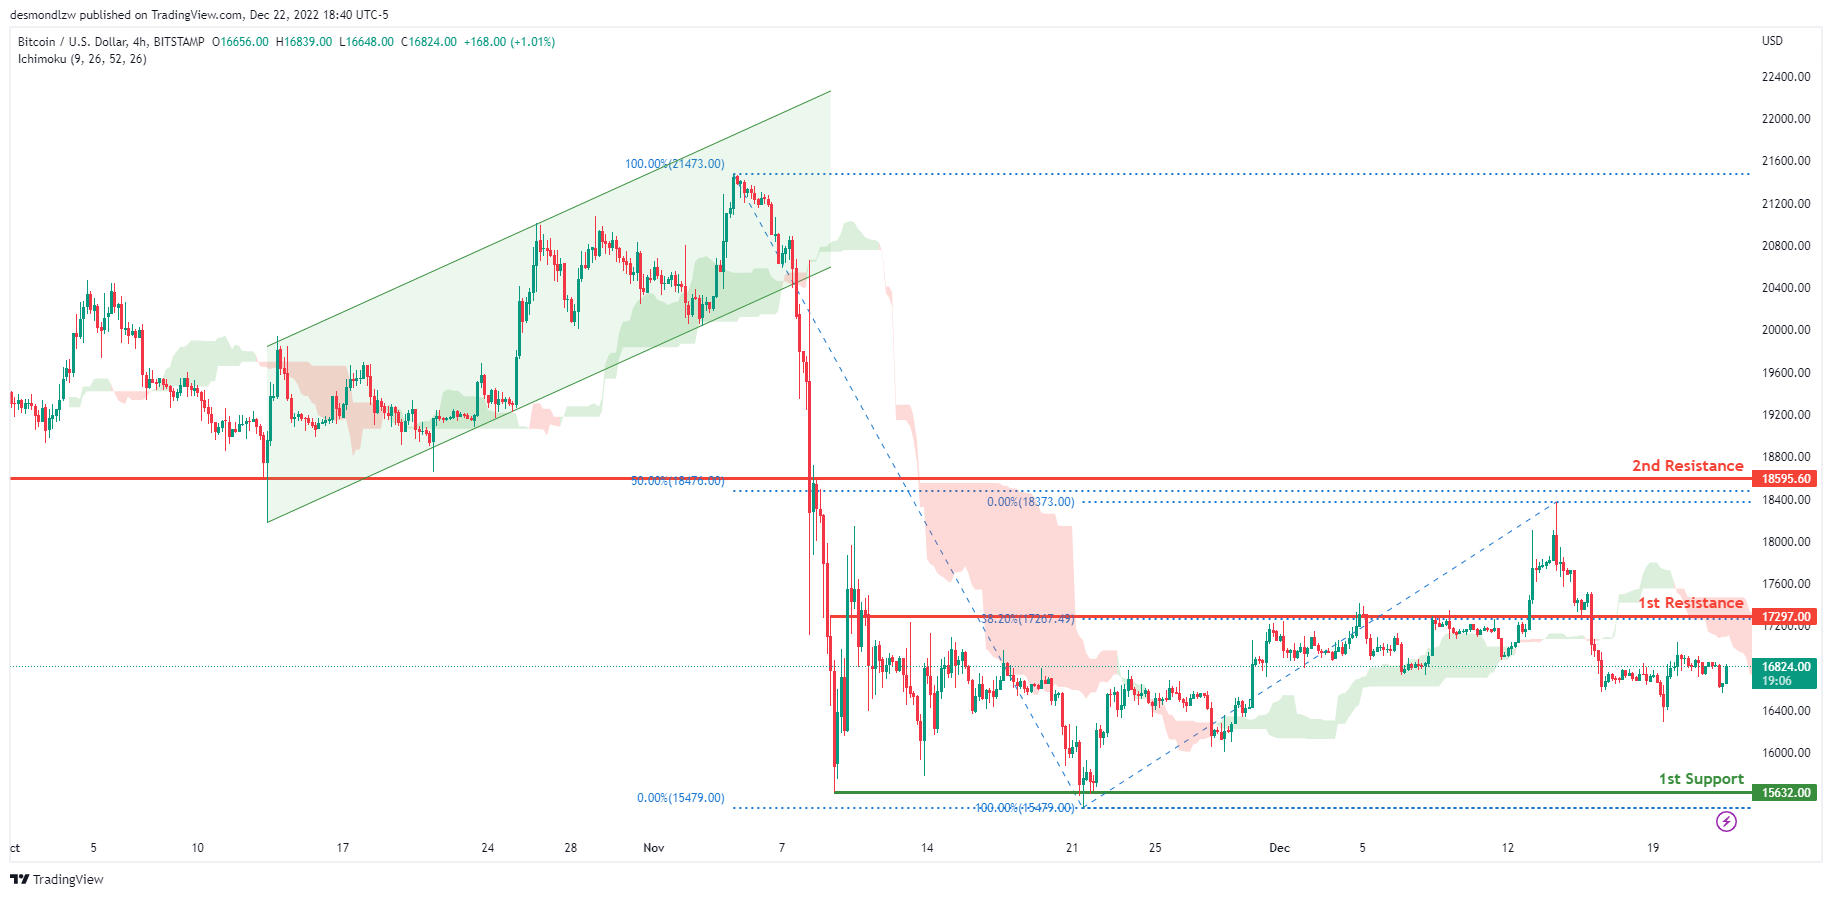
Looking at the H4 chart, my overall bias for BTCUSD is bearish due to the current price being below the Ichimoku cloud, indicating a bearish market. If this bearish momentum continues, expect price to possibly continue heading towards the 1st support at 15632.00, where the previous swing low is. In an alternative scenario, price could possibly head up towards the 1st resistance at 17297.00, where the 38.2% Fibonacci line is.
Areas of consideration:
- H4 time frame, 1st resistance 17297.00
- H4 time frame, 1st support at 15632.00
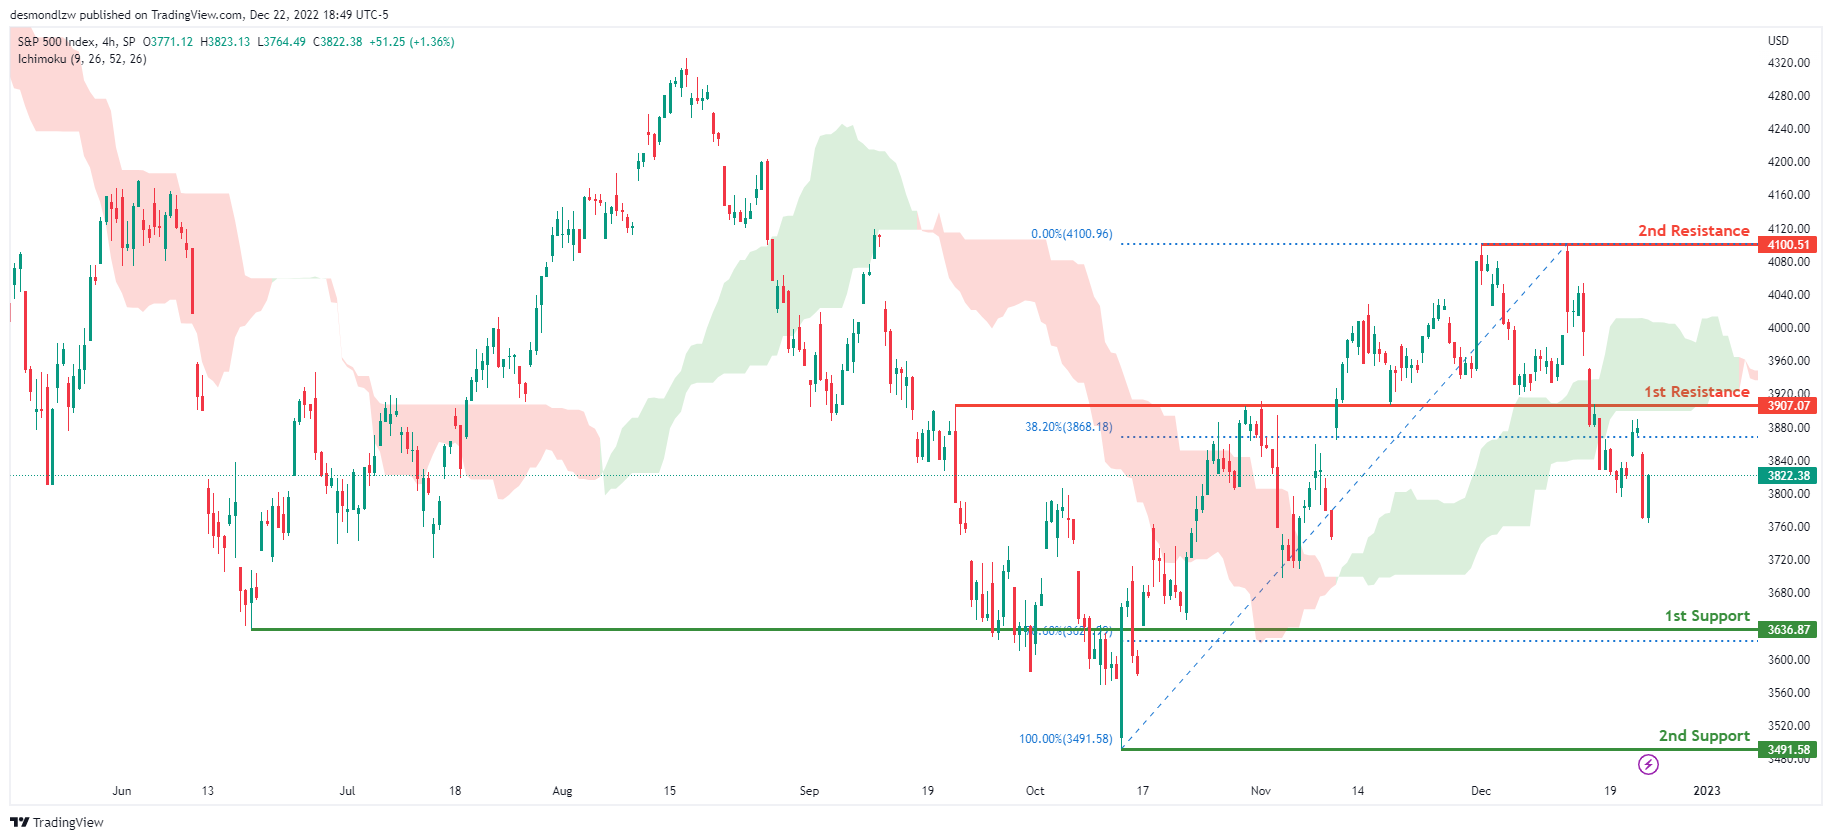
S&P 500:
Looking at the H4 chart, my overall bias for S&P500 is bearish due to the current price being below the Ichimoku cloud, indicating a bearish market. If this bearish momentum continues, expect the price to continue heading towards the 1st support at 3636.87, where the 78.6% Fibonacci line is. In an alternative scenario, price could possibly head back up to retest the 1st resistance at 3907.07, where the 38.2% Fibonacci line is.
Areas of consideration:
- H4 time frame, 1st support at 3636.87
- H4 time frame, 1st resistance at 3907.07