Sample Category Title
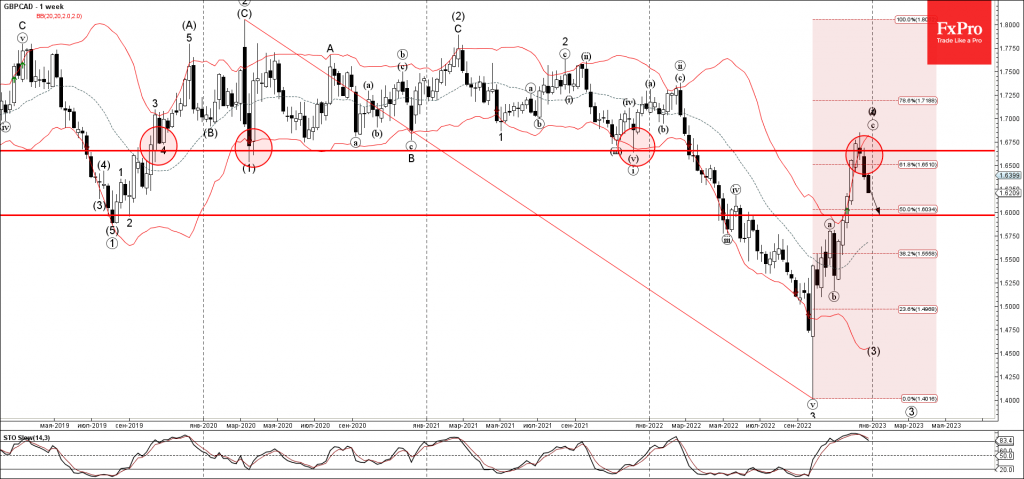
GBPCAD Wave Analysis
- GBPCAD reversed from resistance level 1.6655
- Likely to fall to support level 1.6000
GBPCAD continues to fall inside the weekly downward retracement which started earlier from the key resistance level 1.6655 (former multi-year support level which has been reversing the price from the end of 2019).
The downward reversal from the resistance level 1.6655 previously formed the weekly Evening Star candlesticks reversal pattern.
Given the still overbought weekly Stochastic, GBPCAD can be expected to fall further toward the next round support level 1.6000.
Brent Crude Oil Wave Analysis
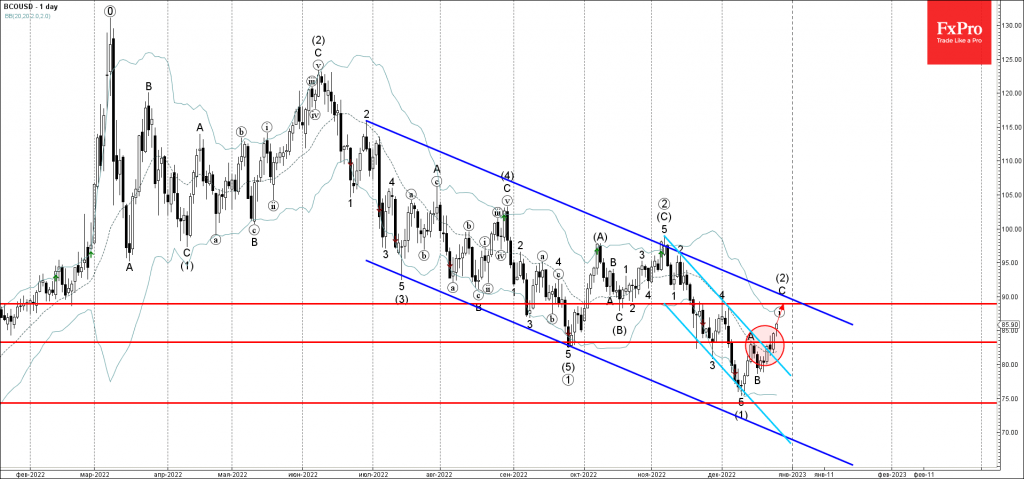
- Brent Crude oil rising inside impulse wave C
- Likely to test resistance level 88.95
Brent Crude oil continues to rise inside the C-wave of the intermediate ABC correction (2) which previously broke the resistance level 83.30 intersecting with the daily down channel from November.
The breakout of the resistance level 83.30 added to the bullish pressure on Brent Crude oil –accelerating the active impulse wave C.
Brent Crude oil can be expected to rise further toward the next round resistance level 88.95 (top of wave 4 from the end of last year).
Gold Price Gains Traction on Relaxing China Covid Curbs, Weaker Dollar
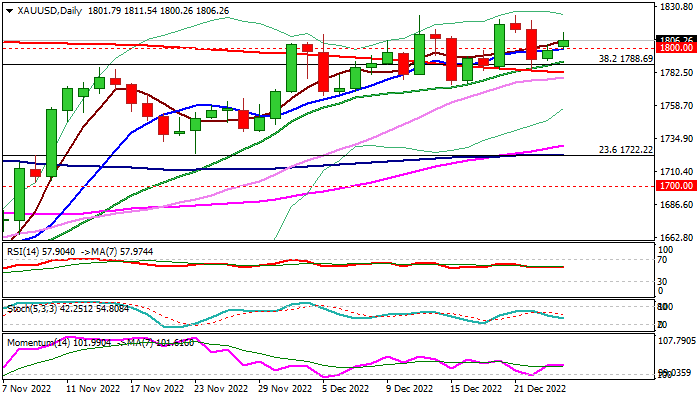
Gold price is establishing above psychological $1800 barrier and moving within the upper part of over three-week range.
Weaker dollar on renewed risk appetite, after China relaxed its Covid restriction, provide fresh boost to gold price on Tuesday.
Fresh strength generates an initial signal that bulls are gaining traction and ready to resume after the action was stuck in a consolidation during past three weeks (triple weekly Doji candle).
Daily studies show rising bullish momentum and 20/200 DMA golden cross underpinning the action, which needs a weekly close above the range top ($1824) to confirm bullish continuation and expose next targets at $1842 (50% retracement of $2070/$1614) and $1855 base of weekly Ichimoku cloud).
Broken $1800 level (reinforced by 10DMA) reverted to support, which should ideally keep the downside protected and maintain fresh bullish bias and guard pivotal supports at $1788 (broken Fibo 38.2%) and $1782 (200DMA).
Res: 1811; 1824; 1842; 1855
Sup: 1800; 1788; 1782; 1773
EUR/USD Mid-Day Outlook
Daily Pivots: (S1) 1.0615; (P) 1.0628; (R1) 1.0652; More...
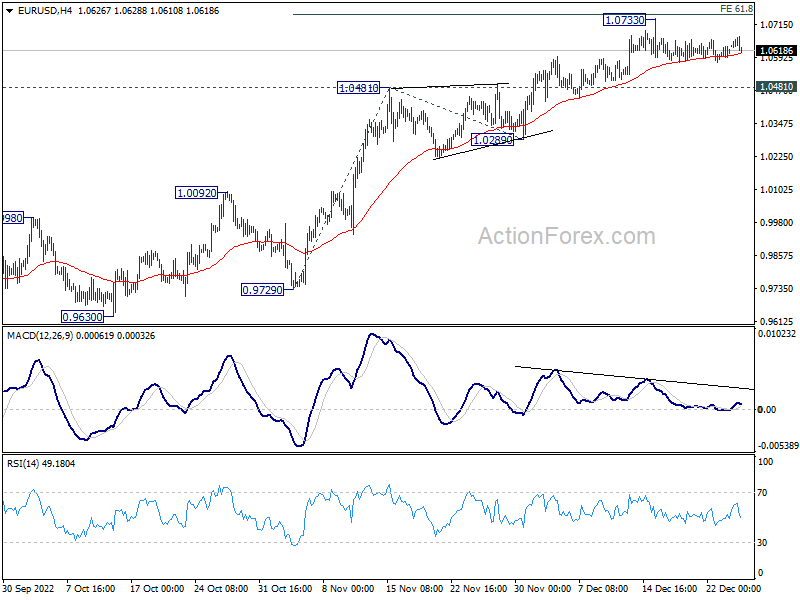
No change in EUR/USD's outlook as range trading continues. Further rally is expected as long as 1.0481 resistance turned support holds. Firm break of 61.8% projection of 0.9729 to 1.0481 from 1.0289 at 1.0754 will pave the way to 100% projection at 1.1041. However, firm break of 1.0481 will confirm short term topping and bring deeper fall to 1.0289 support.
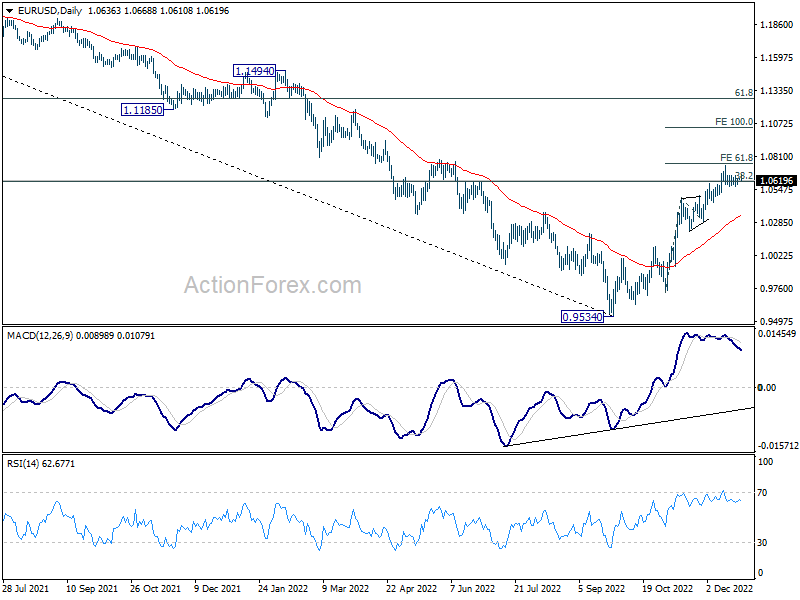
In the bigger picture, focus stays on 38.2% retracement of 1.2348 (2021 high) to 0.9534 at 1.0609. Rejection by 1.0609 will suggest that price actions from 0.9534 medium term bottom are developing into a corrective pattern. Thus, medium bearishness is retained for another fall through 0.9534 at a later stage. However, sustained break of 1.0609 will raise the chance of trend reversal and target 61.8% retracement at 1.1273.
GBP/USD Mid-Day Outlook
Daily Pivots: (S1) 1.2053; (P) 1.2068; (R1) 1.2085; More...
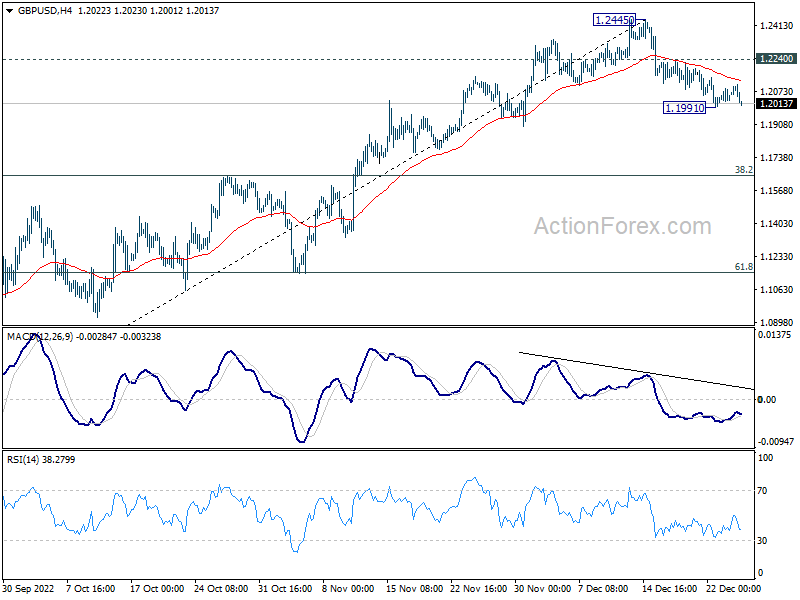
Intraday bias in GBP/USD stays neutral at this point. On the downside, break of 1.1991 will resume the fall from 1.2445 to 55 day EMA (now at 1.1915). Firm break there will target 38.2% retracement of 1.0351 to 1.2445 at 1.1645. On the upside, break of 1.2240 minor resistance will turn bias back to the upside for retesting 1.2445 instead.
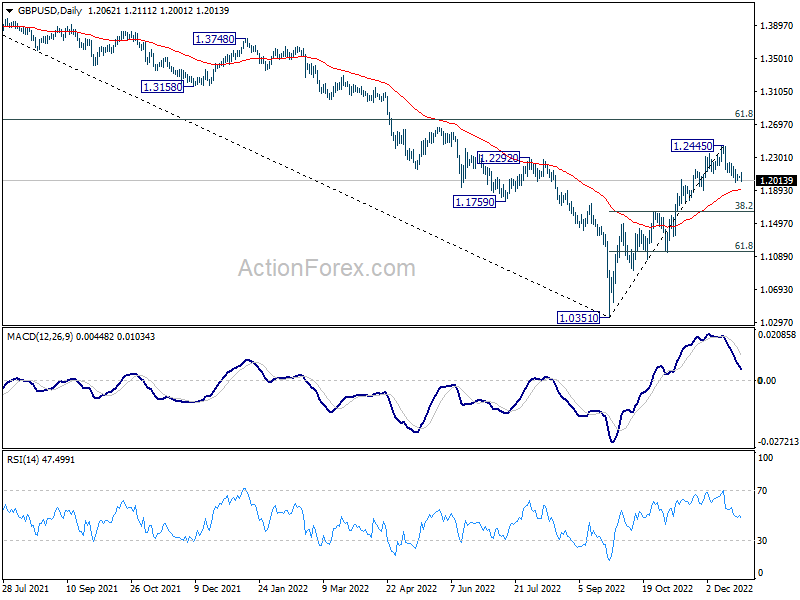
In the bigger picture, rise from 1.0351 medium term bottom is at least correcting whole down trend from 1.4248 (2021 high). Further rise is expected as long as 1.1644 resistance turned support holds. Next target is 61.8% retracement of 1.4248 to 1.0351 at 1.2759. Sustained break there will pave the way back to 1.4248. This will remain the favored case as long as 55 day EMA (now at 1.1915) holds.
USD/CHF Mid-Day Outlook
Daily Pivots: (S1) 0.9306; (P) 0.9326; (R1) 0.9343; More...
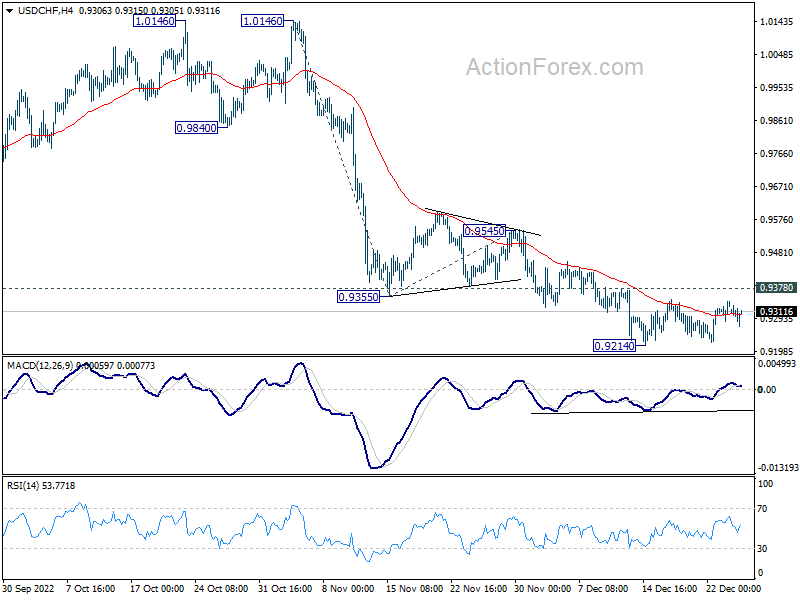
Intraday bias in USD/CHF remains neutral for the moment, and further decline is in favor with 0.9378 resistance intact. On the downside, break of 0.9214 will resume the fall and target 61.8% projection of 1.0146 to 0.9355 from 0.9545 at 0.9056. However, break of 0.9378 resistance will indicate short term bottoming and turn bias back to the upside for 0.9545 resistance instead.
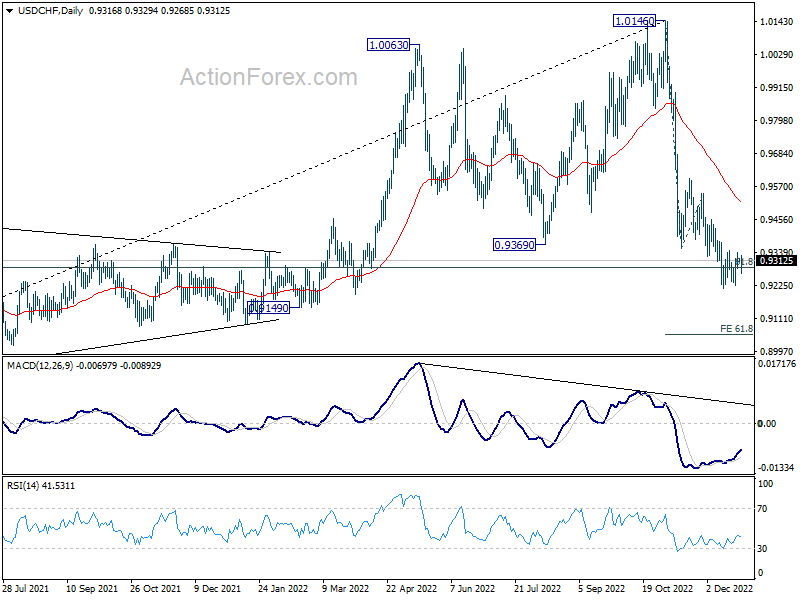
In the bigger picture, rise from 0.8756 (2021 low) has completed at 1.0146, well ahead of 1.0342 long term resistance (2016 high). Based on current downside momentum, fall from 1.0146 might be a medium term down trend itself. Sustained break of 61.8% retracement of 0.8756 to 1.0146 at 0.9287 will pave the way to 0.8756. In any case, risk will stay on the downside as long as 0.9545 resistance holds.
USD/JPY Mid-Day Outlook
Daily Pivots: (S1) 132.36; (P) 132.80; (R1) 133.33; More...
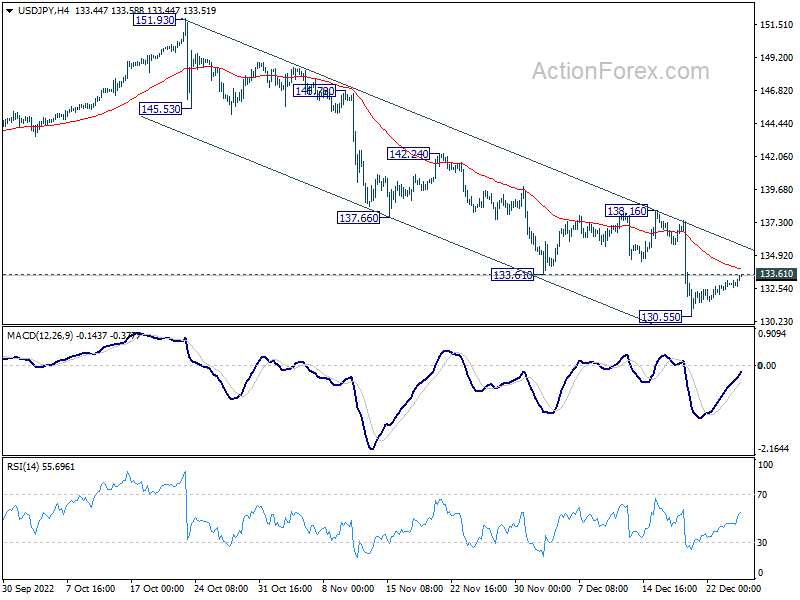
Intraday bias in USD/JPY stays neutral first . On the upside, firm break of 133.61 support turned resistance will indicate short term bottoming, after defending 55 week EMA (now at 131.78). Bias will be back on the upside for 138.16 resistance. However, sustained break of 55 week EMA will pave the way to next fibonacci level at 121.43.
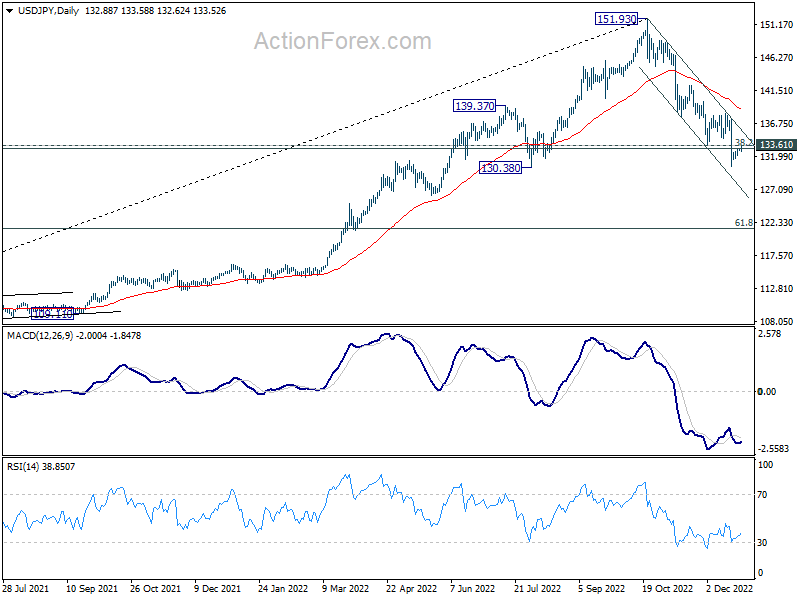
In the bigger picture, price actions from 151.93 medium term could be just a corrective pattern to up trend from 102.58 (2021 low). Strong support from 38.2% retracement of 102.58 to 151.93 at 133.07 and 55 week EMA (now at 131.76) will set the range for such corrective pattern. However, sustained break of 55 week EMA will pave the way to 61.8% retracement at 121.43.
EUR/GBP Mid-Day Outlook
Daily Pivots: (S1) 0.8796; (P) 0.8806; (R1) 0.8823; More...
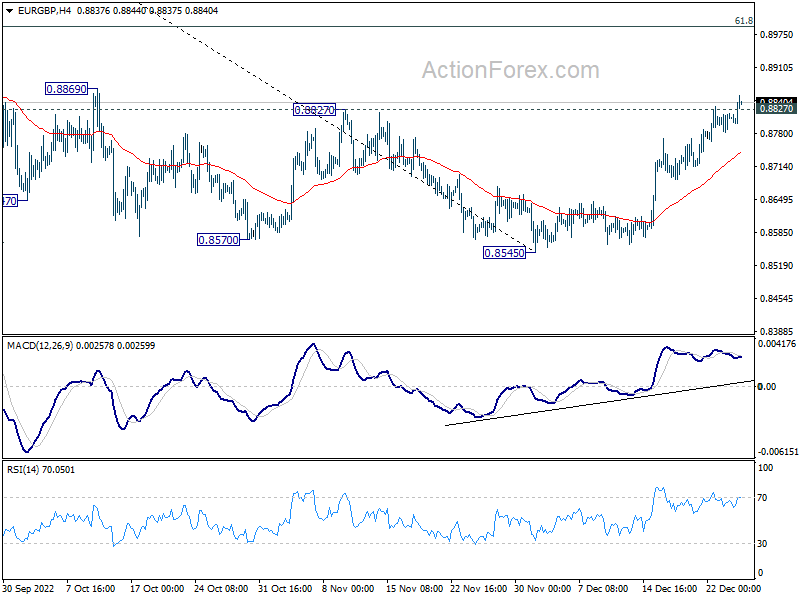
EUR/GBP's break of 0.8827 resistance argues that whole decline from 0.9267 has completed. Intraday bias is now back on the upside. Further rally would be seen to 61.8% retracement of 0.9276 to 0.8545 at 0.8997 and possibly above. For now, this will remain the favored case as long as 4 hour 55 EMA (now at 0.8744) holds.
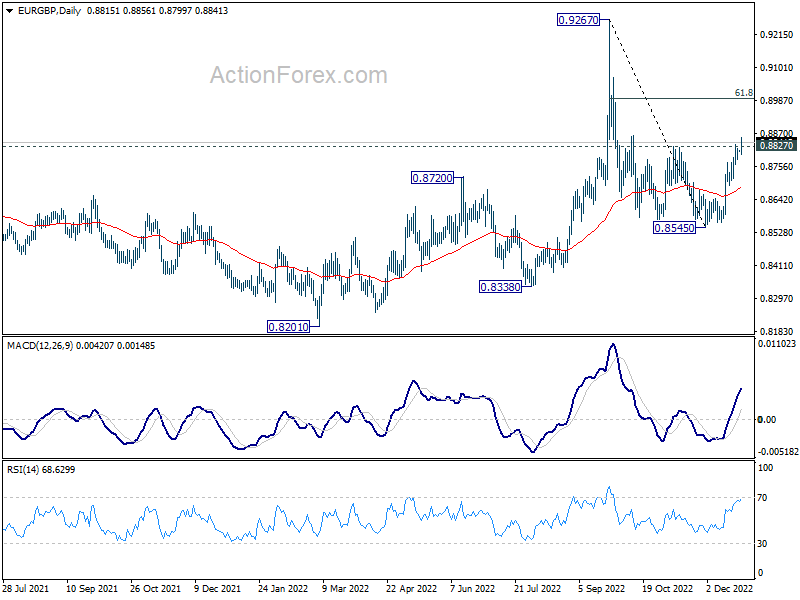
In the bigger picture, fall from 0.9267 is seen as a down leg inside long term range pattern. Deeper fall could be seen towards 0.8201/8338 support zone. But strong support should be seen there to bring reversal. Nevertheless, firm break of 0.8827 resistance will turn favor to the case that such decline is merely a correction in the up trend from 0.8201. That is, further rally would be seen at a later stage through 0.9267.
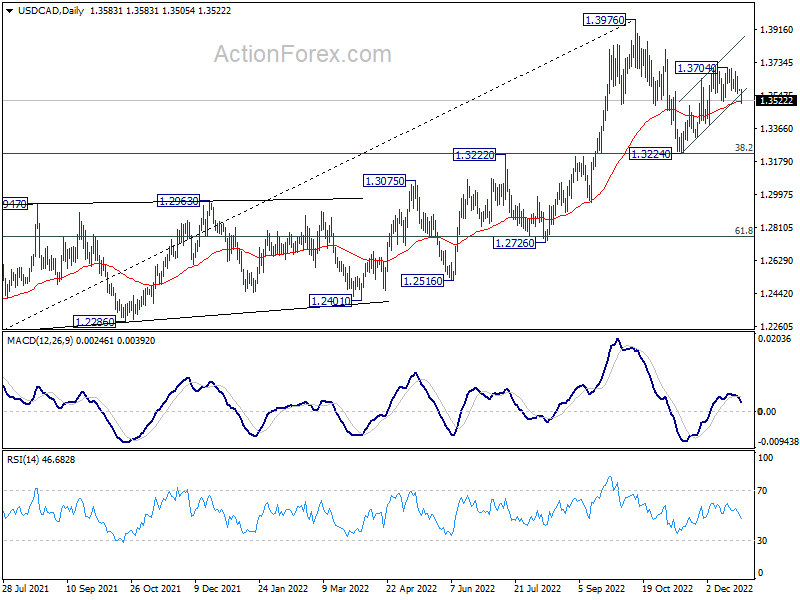
USD/CAD Mid-Day Outlook
Daily Pivots: (S1) 1.3560; (P) 1.3599; (R1) 1.3622; More....
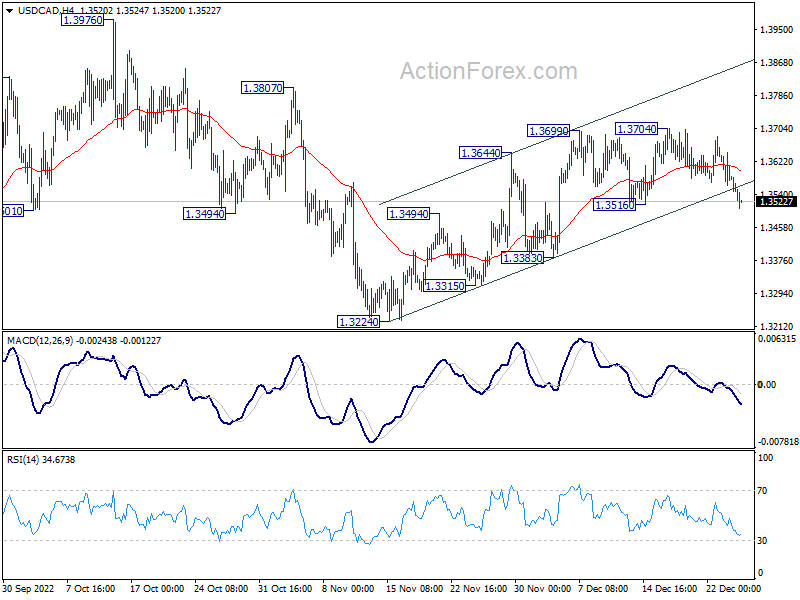
USD/CAD's break of 1.3516 support argues that corrective recovery from 1.3224 might have finished at 1.3704 already. Intraday bias is now back on the downside for 1.3383 support first. Break there will target 1.3222/3 key support zone again. On the upside, break of 1.3704 will resume the rebound towards 1.3976 high instead.
In the bigger picture, as long as 1.3222 cluster support (38.2% retracement of 1.2005 to 1.3976 at 1.3223) holds, larger up trend from 1.2005 (2021 low) is still expected to resume through 1.3976 high at a later stage. However, firm break of 1.3222/3 will indicate that the trend might have reversed. Deeper fall would be seen to next cluster support at 1.2726 (61.8% retracement at 1.2758).