Sample Category Title
GBP/USD: Bears Headed for the Previous Low
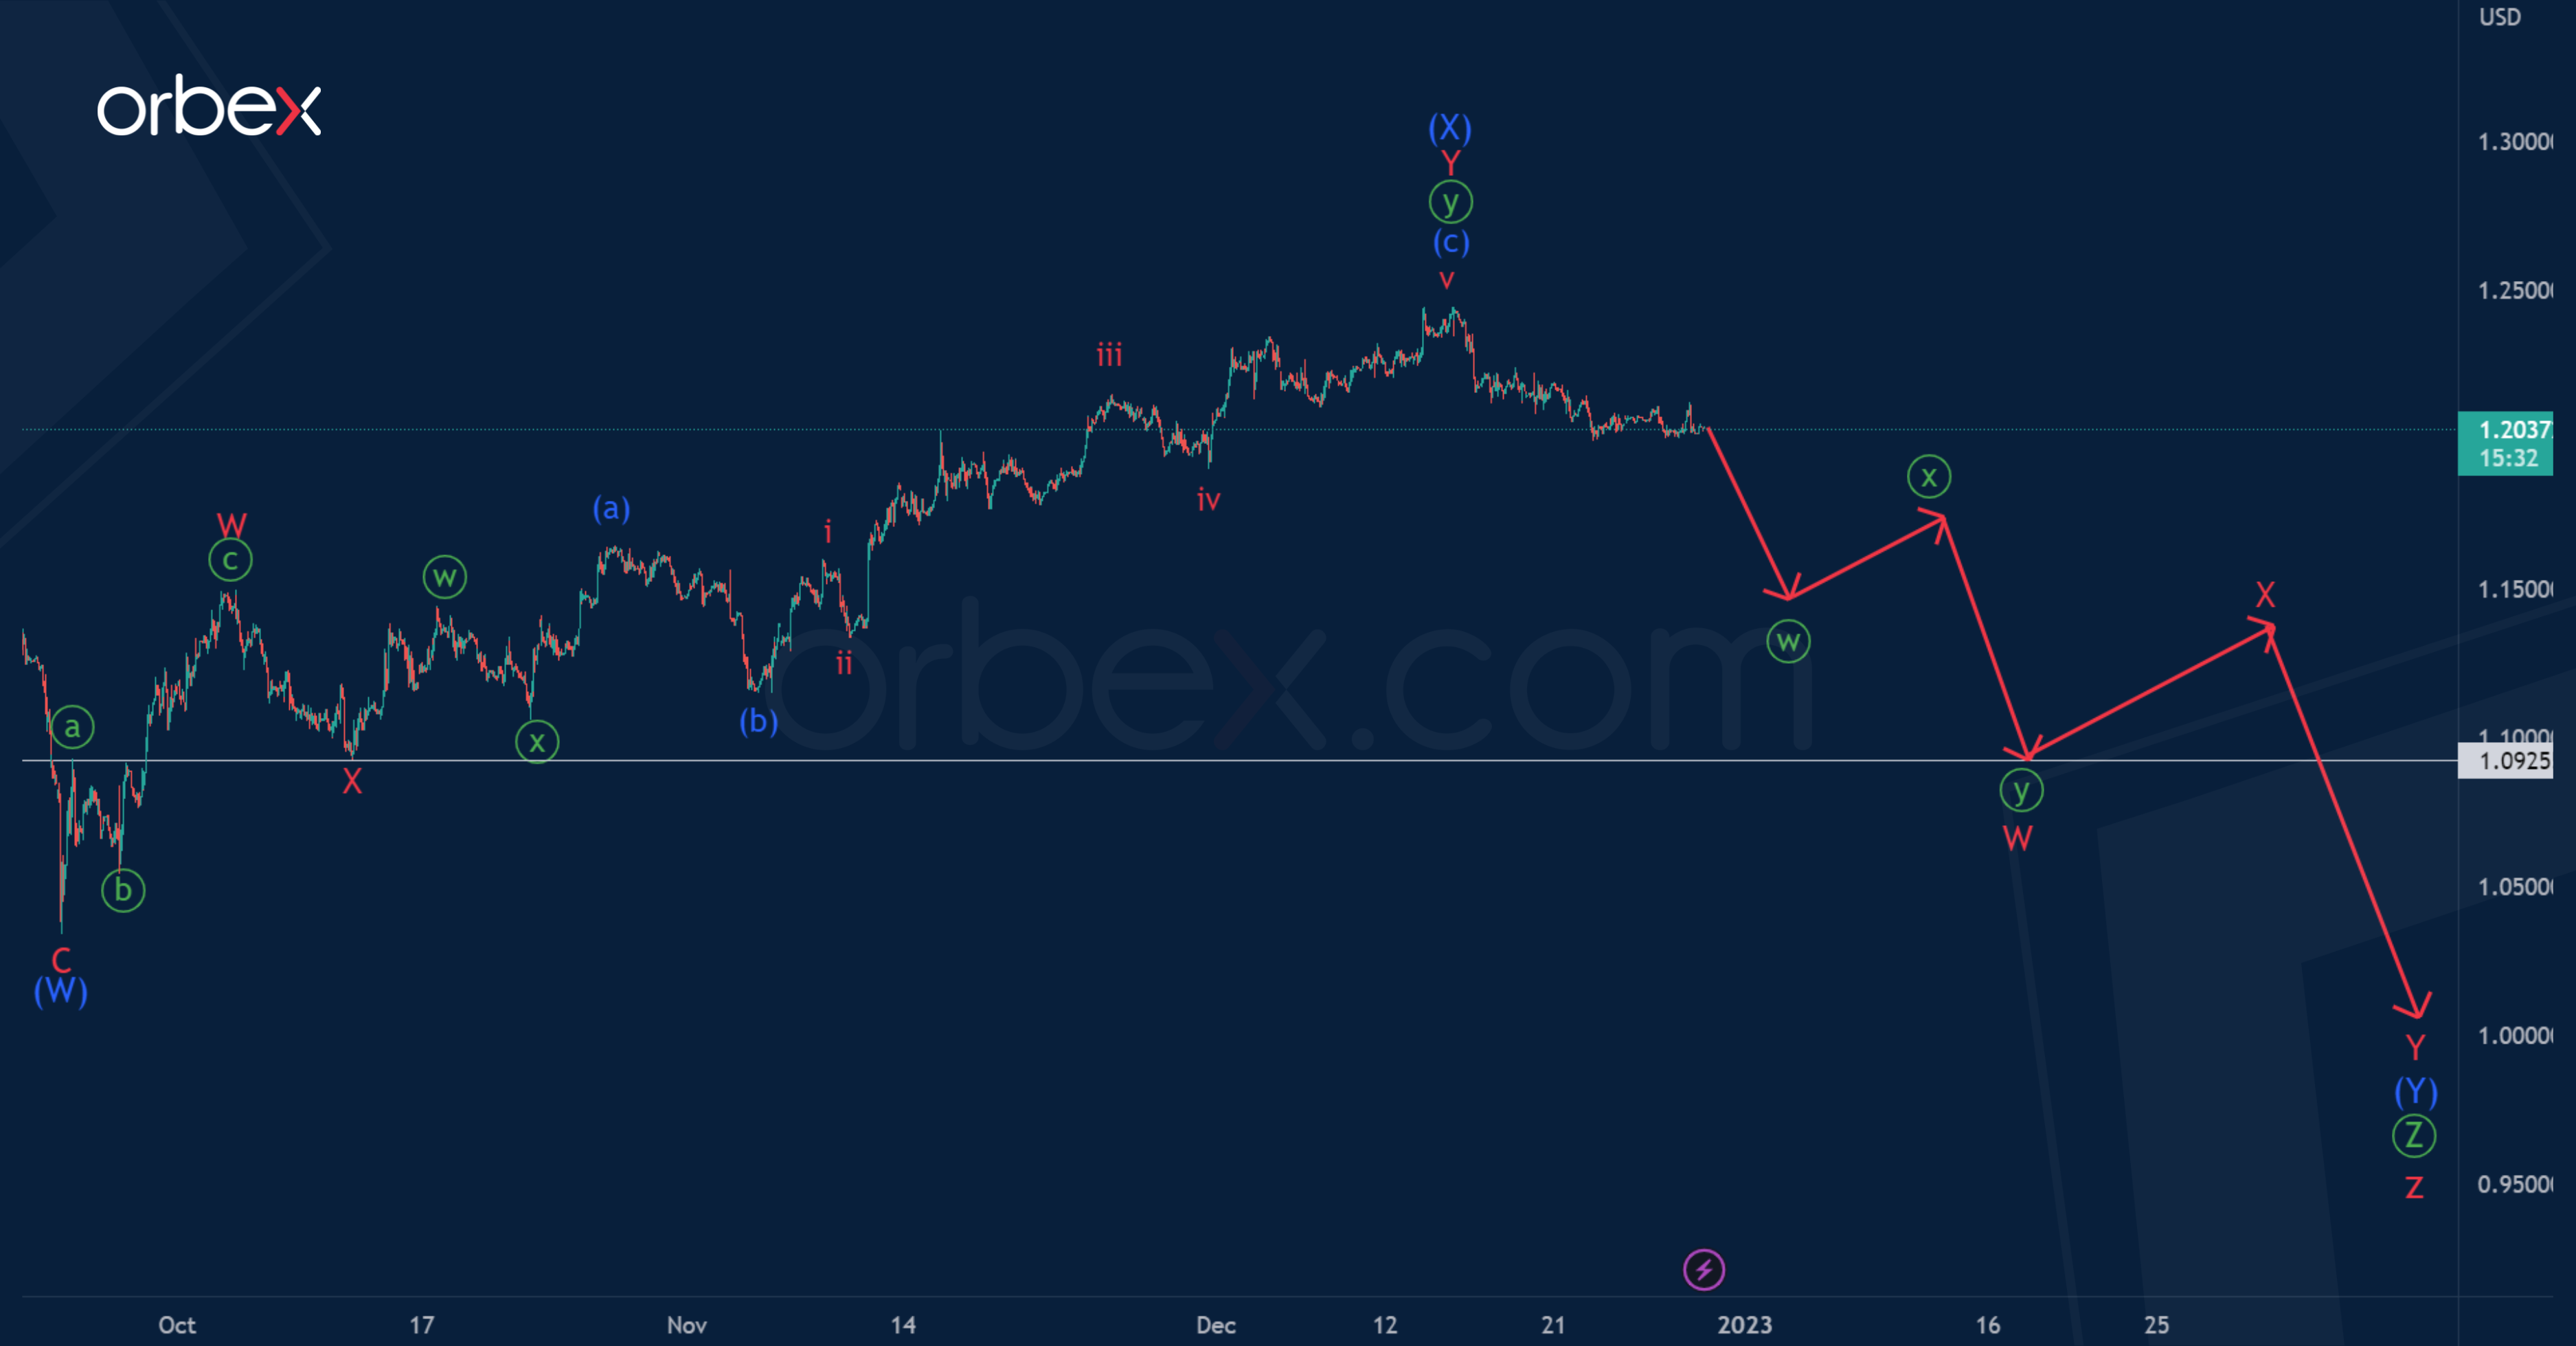
Three weeks ago, we talked about the GBPUSD pair, according to which a global corrective trend is forming – a triple zigzag w-x-y-x-z, as part of which the market builds the final actionary wave z of the cycle degree.
The wave z most likely takes the form of a primary triple zigzag Ⓦ-Ⓧ-Ⓨ-Ⓧ-Ⓩ. It is possible that a bearish trend is currently developing in the primary wave Ⓩ, which may take the form of an intermediate double zigzag pattern (W)-(X)-(Y). The formation of the intervening wave (X) has recently ended. The last sub-wave (Y) is likely to take the form of a double zigzag W-X-Y.
The end of the first actionary wave W is expected at a minimum of 1.095.
Alternatively, it is assumed that the cycle wave z could be fully completed in the form of a primary triple zigzag.
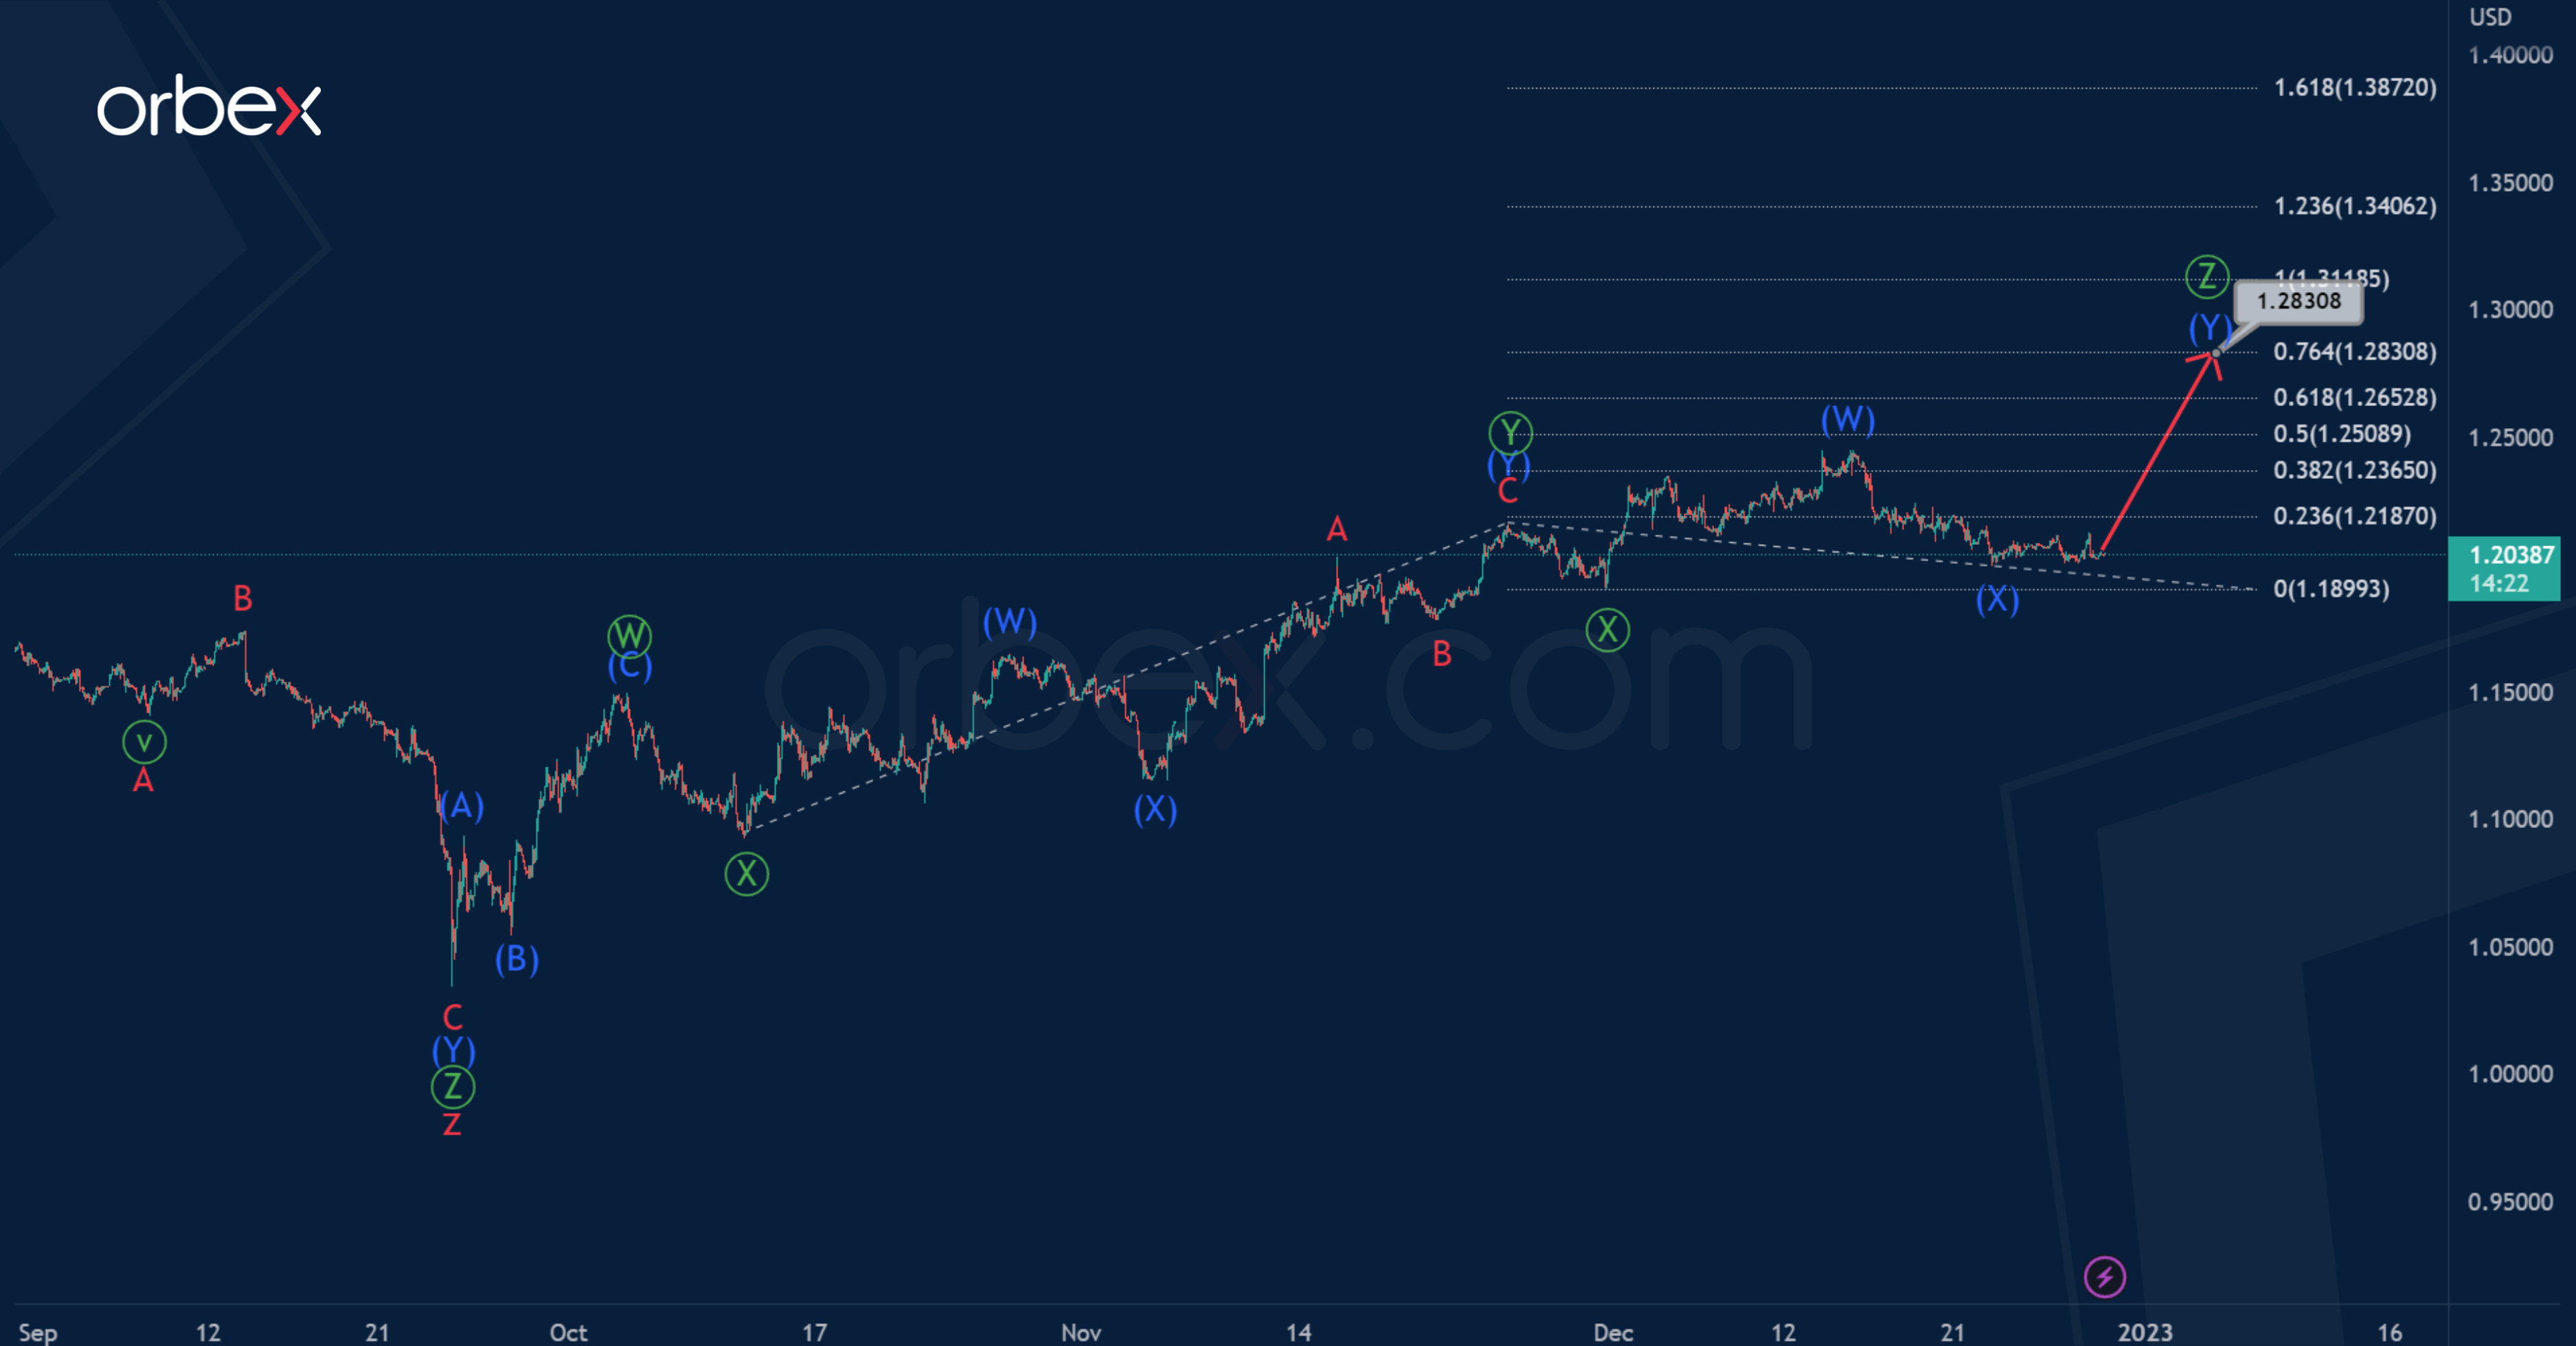
Thus, we see that since the end of September, bulls have started to move the price up in a new trend.
Perhaps we are seeing the formation of a primary triple zigzag Ⓦ-Ⓧ-Ⓨ-Ⓧ-Ⓩ, where the first four parts are already formed.
In the last section of the chart, the final actionary wave Ⓩ is formed. Most likely, it will be at 76.4% of wave Ⓨ, and will end near the level of 1.283.
WTI Oil: Bull-Trap and Reversal Pattern Warn of Deeper Pullback
The WTI oil remains at the back foot for the third consecutive day and extends weakness in early European trading on Thursday.
The latest reports showed fresh surge in Covid cases in China, just days after the government eased its strict policies that darkened the outlook and optimism about faster demand recovery.
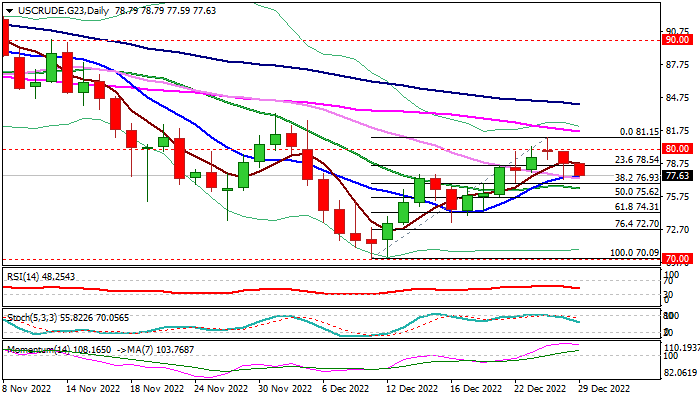
The two-legged recovery from Dec 9 $70.09 low (the lowest in one year) failed to sustain break through pivotal barriers at $80.00/$80.20 (psychological / Fibo 76.4% of $83.32/$70.09 bear-leg), leaving a bull-trap pattern and generating an initial signal of reversal.
Subsequent acceleration lower completed Doji evening star reversal pattern on daily chart, which added to negative signals.
Technical studies on daily chart contribute to weakening near-term structure as bullish momentum is fading and stochastic is heading south after forming a bearish divergence and emerging from overbought territory.
Fresh bears face pivotal supports at: $77.25 (daily Tenkan-sen); $76.93 (Fibo 38.2% of $70.09/$81.15) and $76.70 (daily Kijun-sen) where headwinds could be anticipated, but firm break would open way for deeper fall.
On the other hand, failure to break these supports would point to a healthy correction of recovery from $70.09 and keep larger bulls in play for renewed attack at $80.00/$80.20 pivots.
Res: 78.54; 78.79; 80.00; 81.15
Sup: 77.25; 76.93; 76.70; 75.62
US Oil Tests Key Resistance
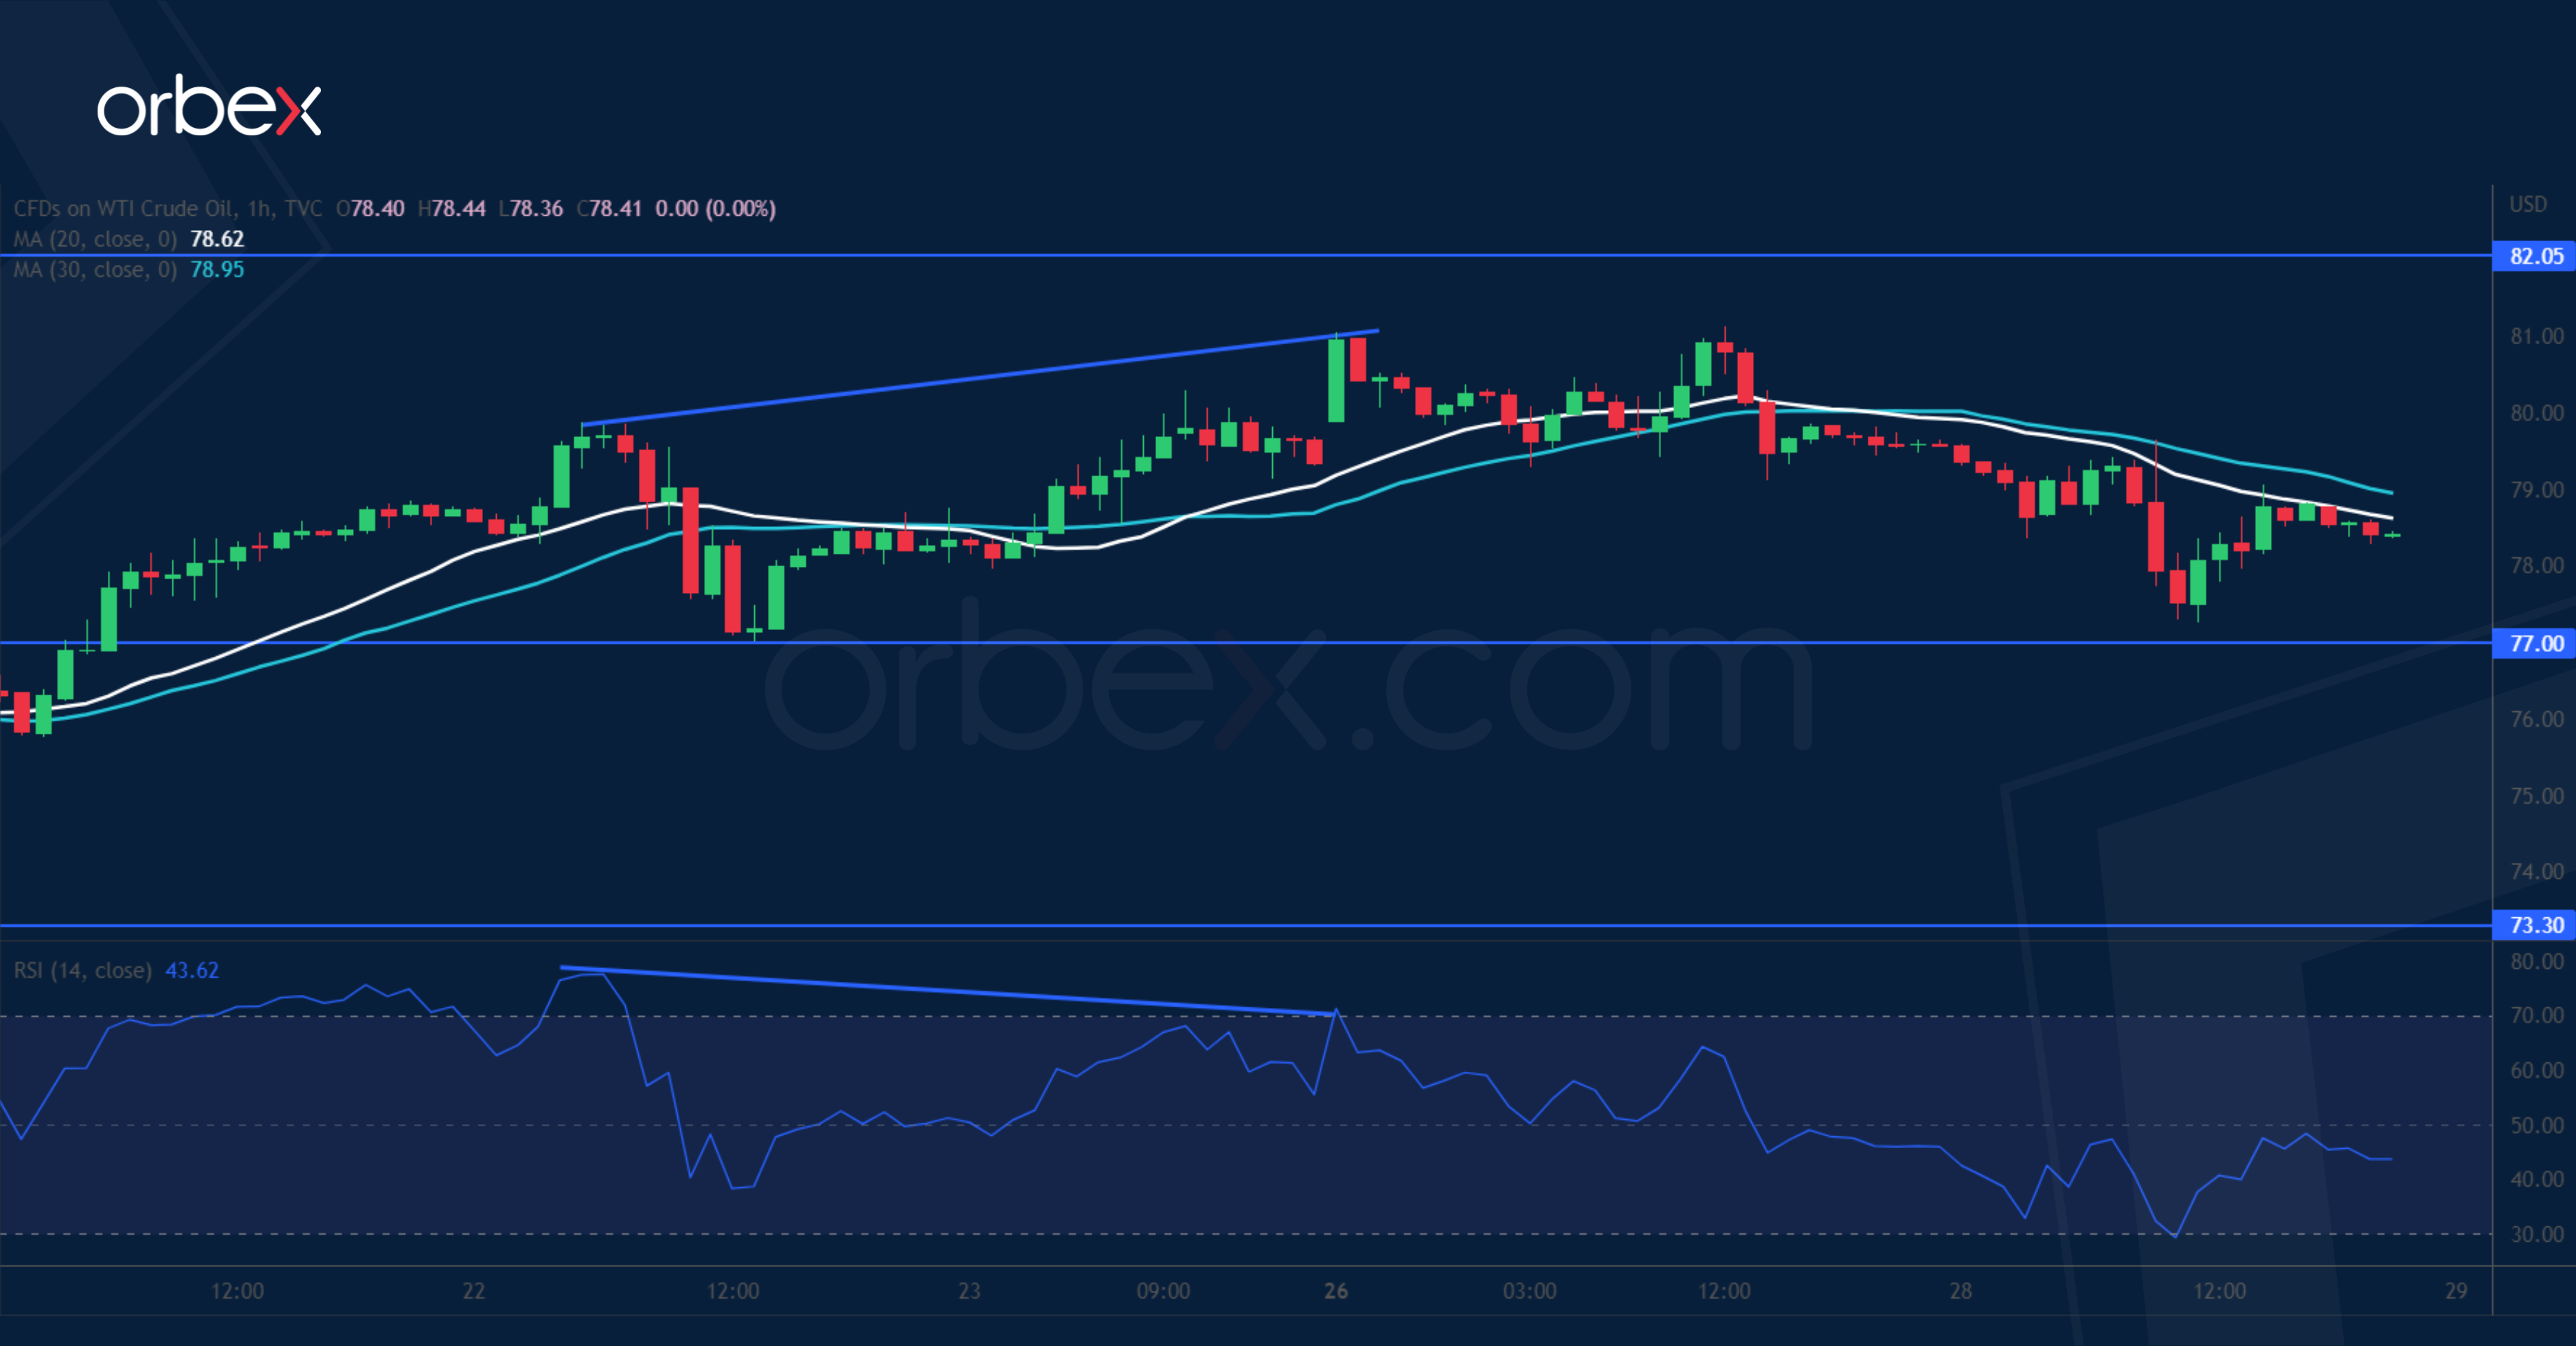
WTI crude steadies as Russia bans countries that abide by the Western price cap. On the daily chart, the commodity would remain in a downtrend unless it manages to break free of 82.00. A bearish RSI divergence suggests slowing momentum as the price tests this major supply area. The resistance-turned-support at 77.00 is the level to assess the strength of follow-through. Its break would make the price vulnerable to a new round of sell-off, possibly towards the recent low and psychological level of 70.00.
XAU/USD Grinds Rising Trend Line
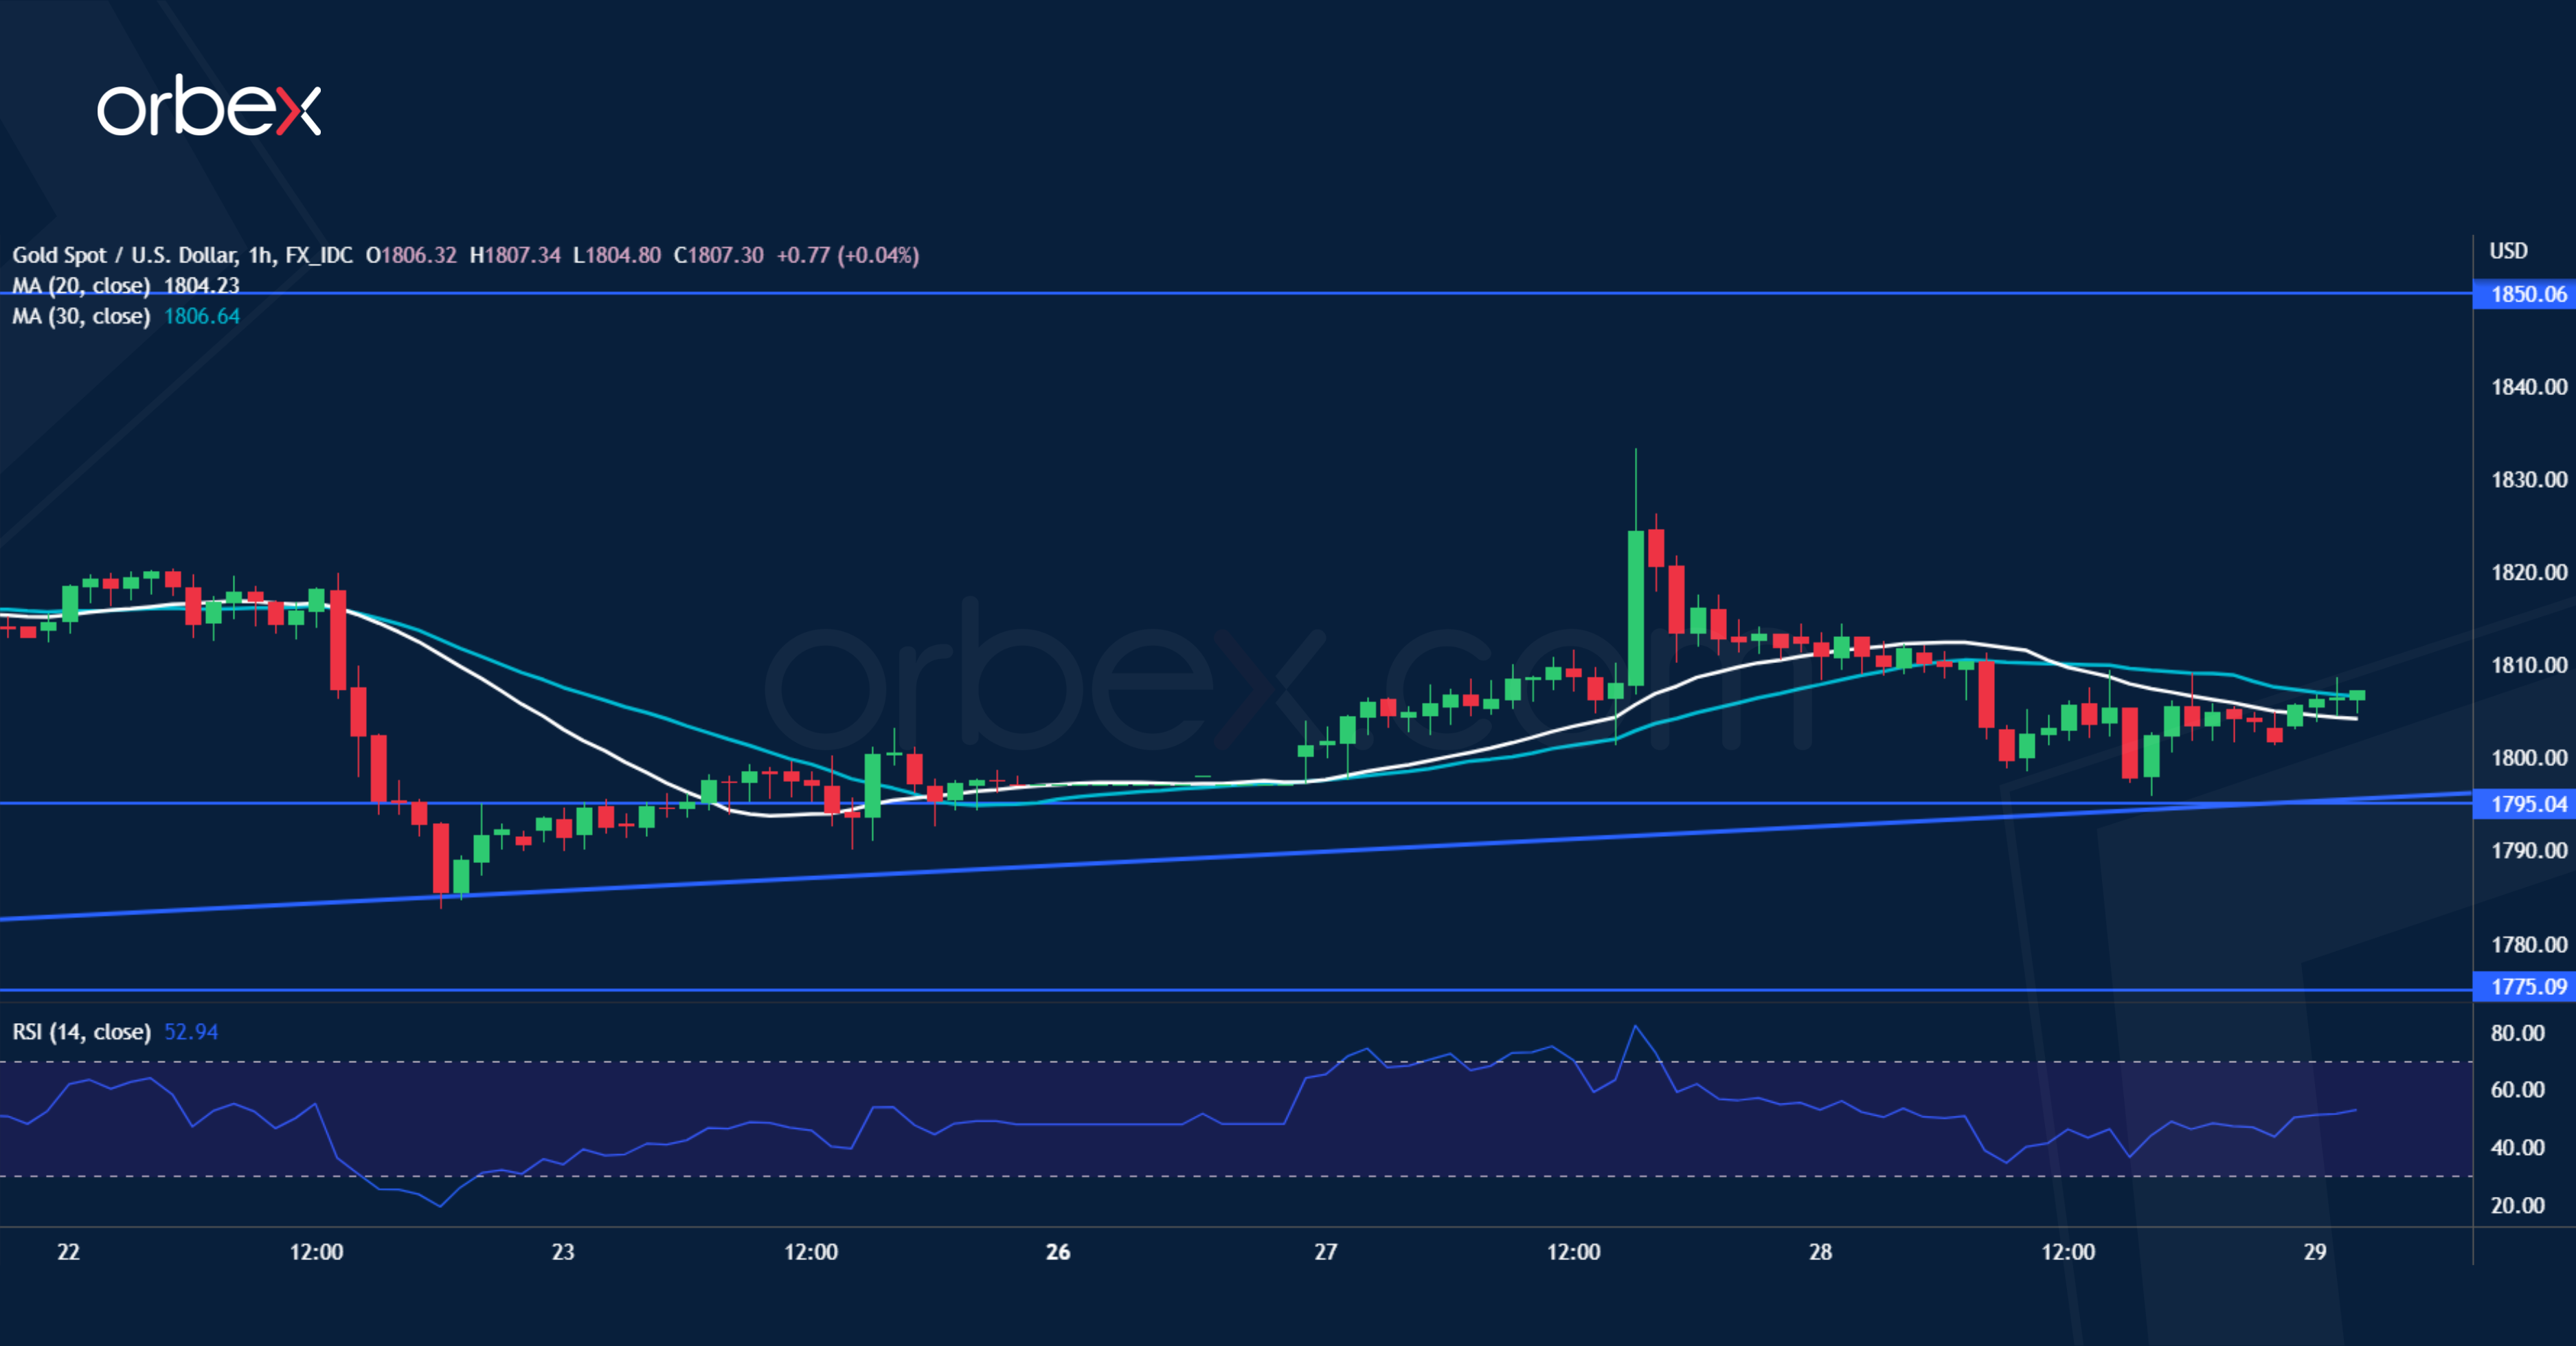
Bullion remains sideways as the US dollar attempts to claw back losses near year’s end. On the daily chart, the price has been inching up along the 20-day moving average. A rising trend line from early November also offers support to the price action on the hourly time frame. A pop above the recent double top (1823) indicates a strong bullish pressure, but a bounce off the congestion area (1795) formed by the trend line and the base of the bullish breakout is key in keeping the rally going, with 1850 as the next target.
GBP/USD Seeks Support
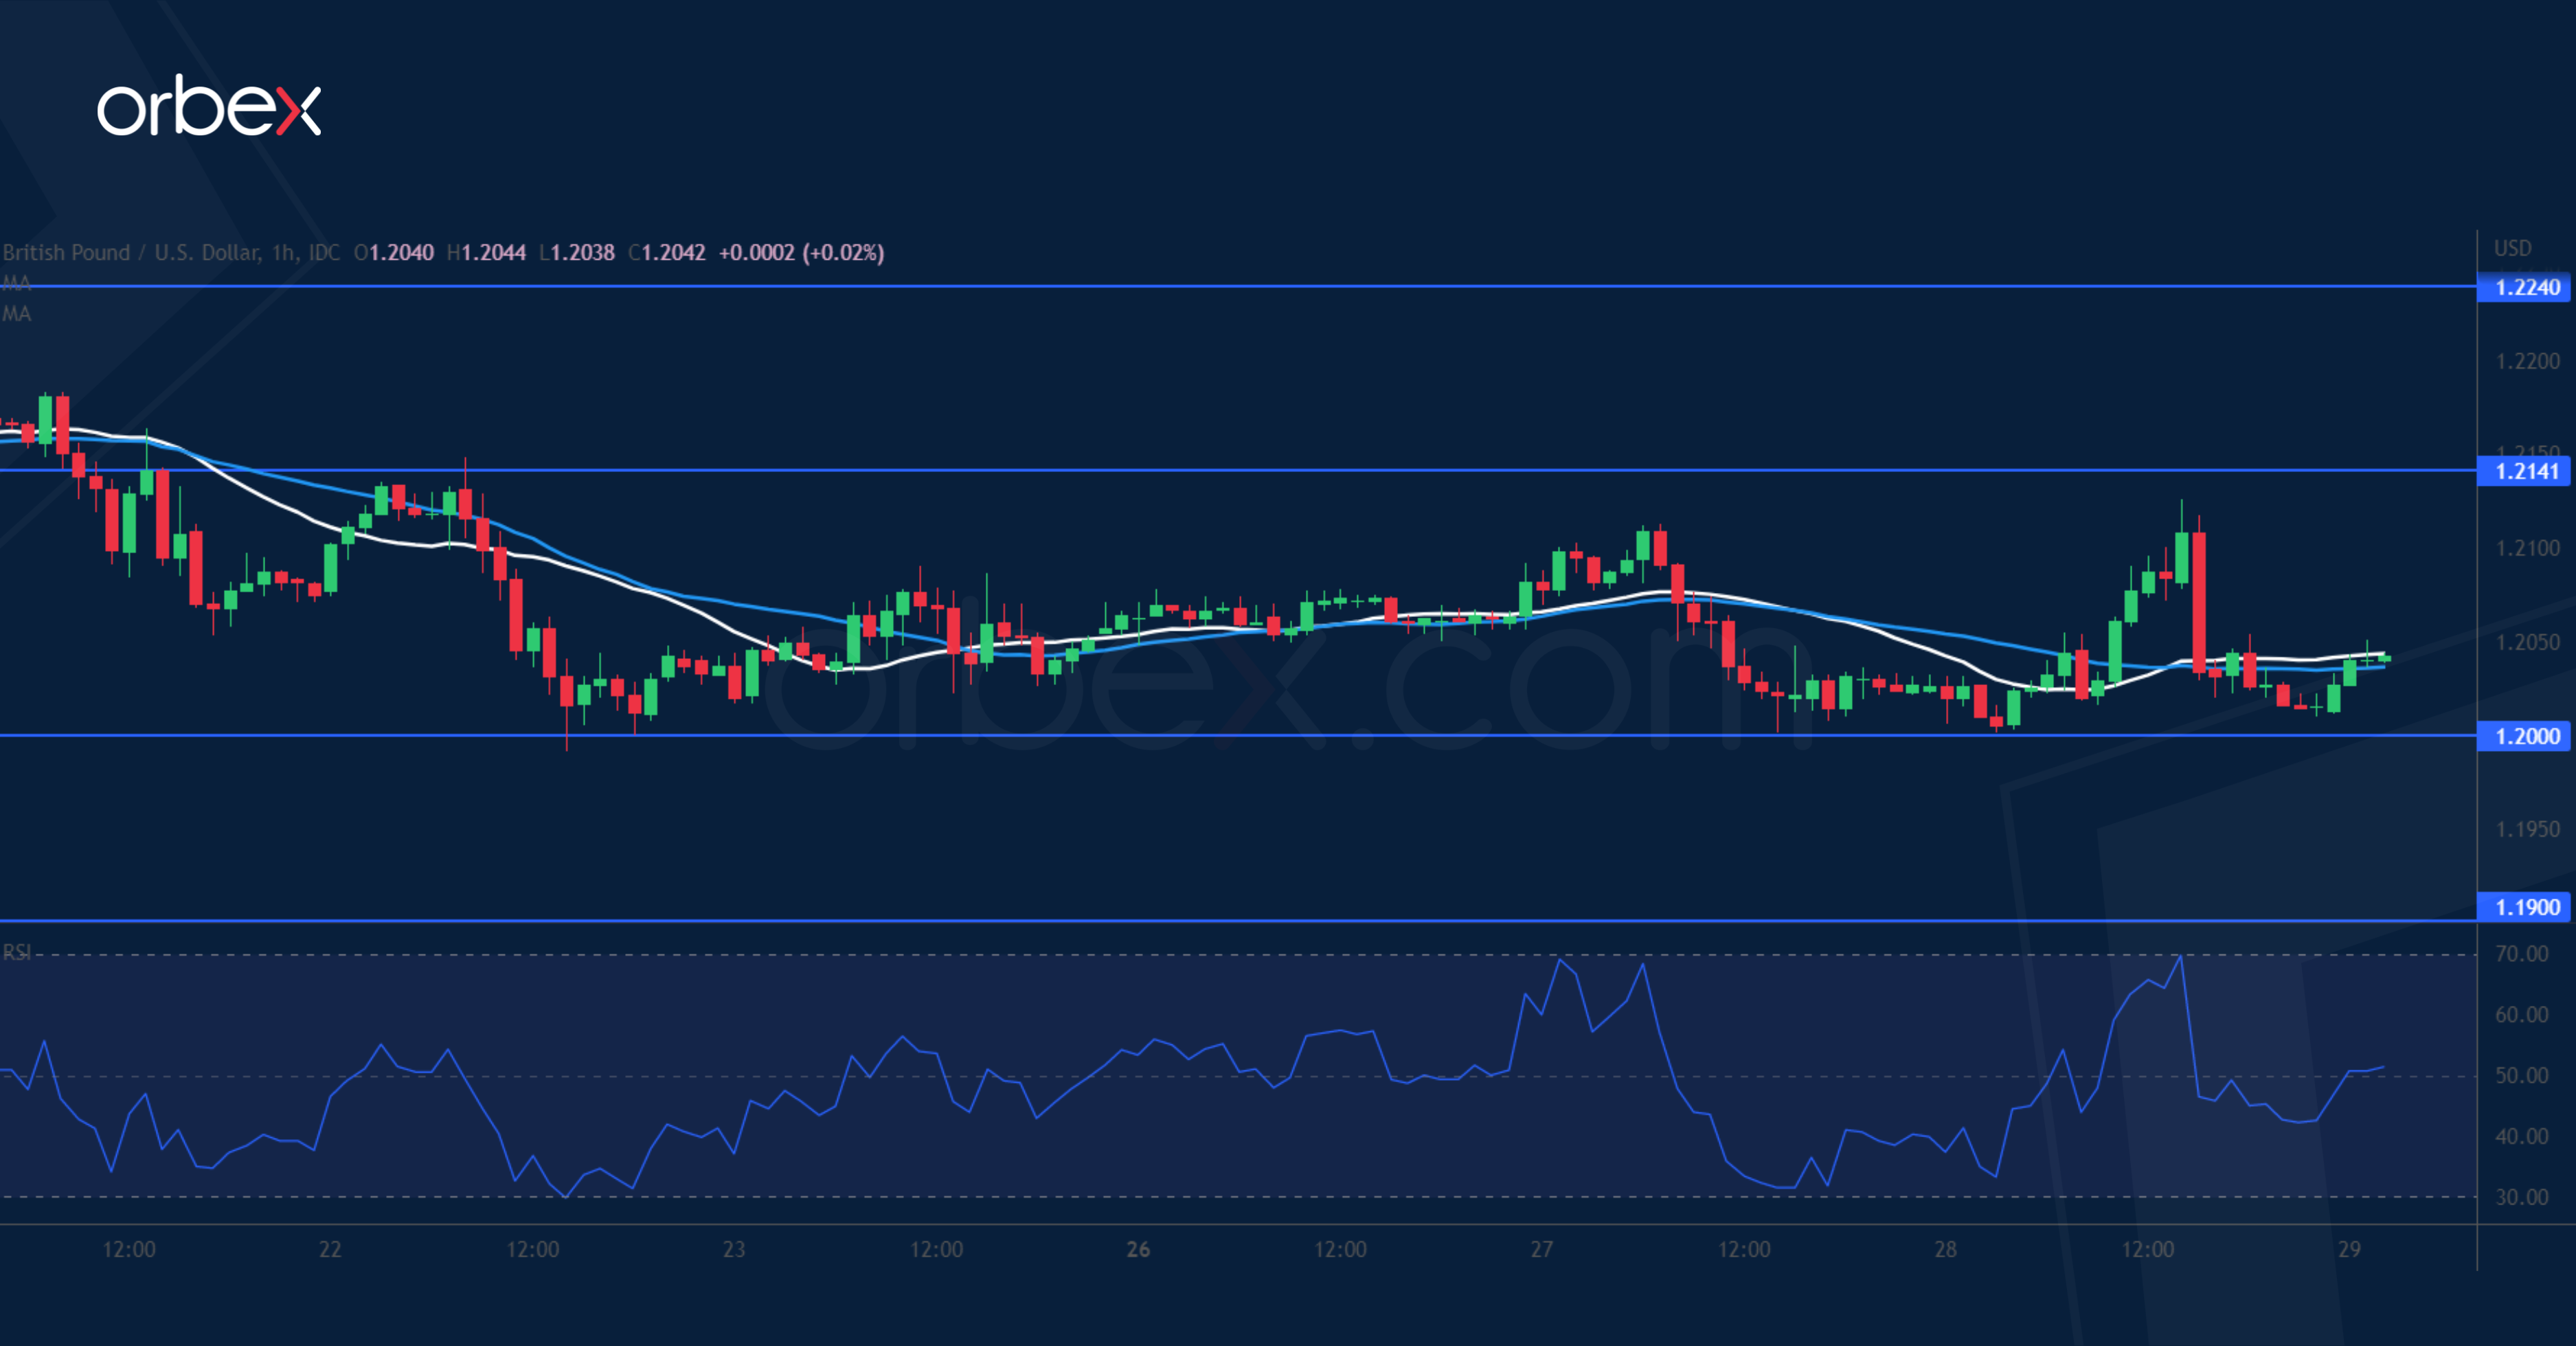
The pound struggles as market sentiment remains cautious with thin liquidity. The pair is still looking to hold onto its gains after clearing last August’s high of 1.2280. Even though short-term buyers have bailed out, the psychological level of 1.2000 has seen an inflow of buying interests. But only a close above 1.2140 would signal confidence in Sterling and help turn the market mood around. 1.1190 is a critical level to keep the directional bias upward in the weeks to come, and its break could trigger a deeper correction.
FTSE 100 to Close the Year in the Positive, While S&P500 Lost a Fifth of its Value
The good news with China’s reopening is that it should boost global growth.
The bad news with China’s reopening is that it will not only boost global growth, but also energy and commodity prices - hence inflation, the interest rate hikes from central banks and potentially the global Covid cases – which could then give birth to a new, and a dangerous Covid variant, which would, in return, bring the restrictive Covid measures back on the table, and hammer growth.
Note that the reasoning stops here right now, the risky markets are painted in the red, but we could eventually go one step further and say that if the Chinese reopening hits the global health situation – hence the economy badly, the central banks could become softer on their rate hike strategies. But no one is cheery enough to see silver lining anywhere.
This year really needs to end, now!
So, Wednesday was marked by further selloff across European and US markets. The S&P500 slid 1.20% and closed below the 50% Fibonacci retracement on the latest rally. The index gave back half of gains collected from October to November. Trend and momentum indicators, and more importantly market sentiment remain supportive of a deeper dive to meet the major 61.8% Fibonacci retracement, at 3724 mark.
Likewise, Nasdaq lost another 1.32%, and the dips don’t look like anyone wants to grab them right now.
In Europe, the DAX struggles to keep its head above the 50-DMA, near 13925.
Across the Channel, despite political shenanigans and Brexit’s knock-on effects, high inflation and the cost-of-living crisis, Britain’s 100 biggest companies are preparing to close the year with small gains, while the S&P500 has lost more than a fifth of its value.
Why?
First, the British companies had to compensate for the weakening sterling this year – but that’s also true for the DAX, for example, but the DAX is also preparing to end the year around 15% lower. So, it’s not only an FX story.
Second, and the most relevant, the fact that the FTSE 100 is heavily crowded in energy and mining stocks is what made the FTSE 100 perform so well this year. The two biggest market caps in the index, which make up to 20% of the index, Antofagasta and Fresnillo – both mining stocks, are preparing to close the year in the positive.
Antofagasta is up by 20% ytd, while Fresnillo, which is a goldminer and suffered from subdued gold prices this year is still up by 6% a day before the trading year ends.
Other energy companies like BP and Shell are up by 40%.
Plus, British big caps make most of their revenues in terms of US dollars; a good thing for a year when sterling lost up to 23% against the greenback at some point and is still down around 10% right now.
And I believe that the FTSE 100’s outperformance could stretch into the new year. If the Chinese reopening brings along another bump in inflation due to higher energy and commodity prices, the FTSE 100 could continue offering a good shelter to those willing to hedge against an energy-led global inflation to temper the negative effects.
Of course, the biggest British companies do not reflect the underlying British economy, so the FTSE 100’s good performance won’t change the fact that smaller, and domestic focused companies will likely continue to suffer from high inflation, recession and perhaps another year of political turmoil as a cherry on top.
EUR/USD Daily Outlook
Daily Pivots: (S1) 1.0588; (P) 1.0632; (R1) 1.0656; More...
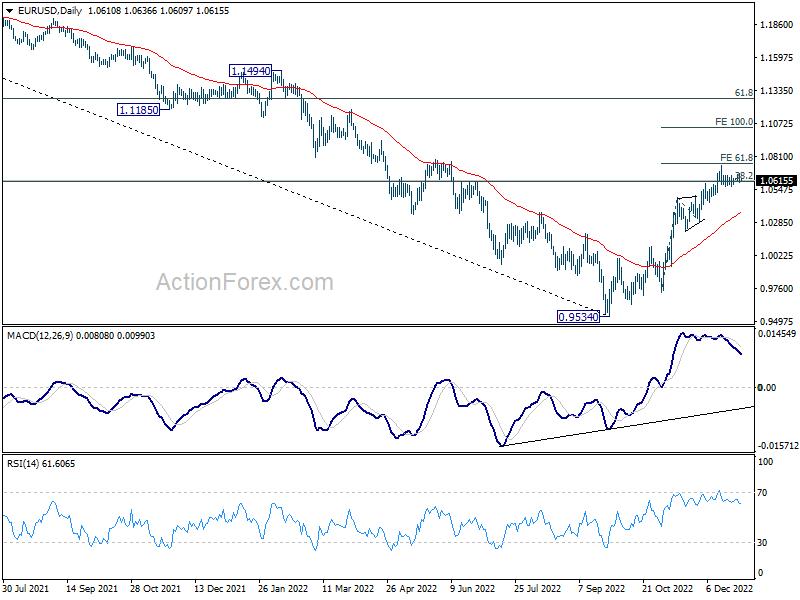
No change in EUR/USD's outlook as consolidation is extending. Further rally is expected as long as 1.0481 resistance turned support holds. Firm break of 61.8% projection of 0.9729 to 1.0481 from 1.0289 at 1.0754 will pave the way to 100% projection at 1.1041. However, firm break of 1.0481 will confirm short term topping and bring deeper fall to 1.0289 support.
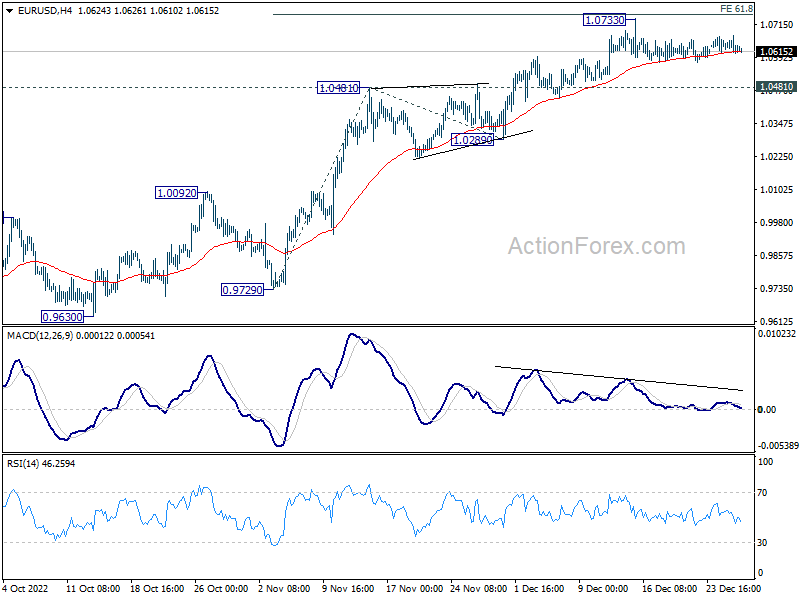
In the bigger picture, focus stays on 38.2% retracement of 1.2348 (2021 high) to 0.9534 at 1.0609. Rejection by 1.0609 will suggest that price actions from 0.9534 medium term bottom are developing into a corrective pattern. Thus, medium bearishness is retained for another fall through 0.9534 at a later stage. However, sustained break of 1.0609 will raise the chance of trend reversal and target 61.8% retracement at 1.1273.
GBP/USD Daily Outlook
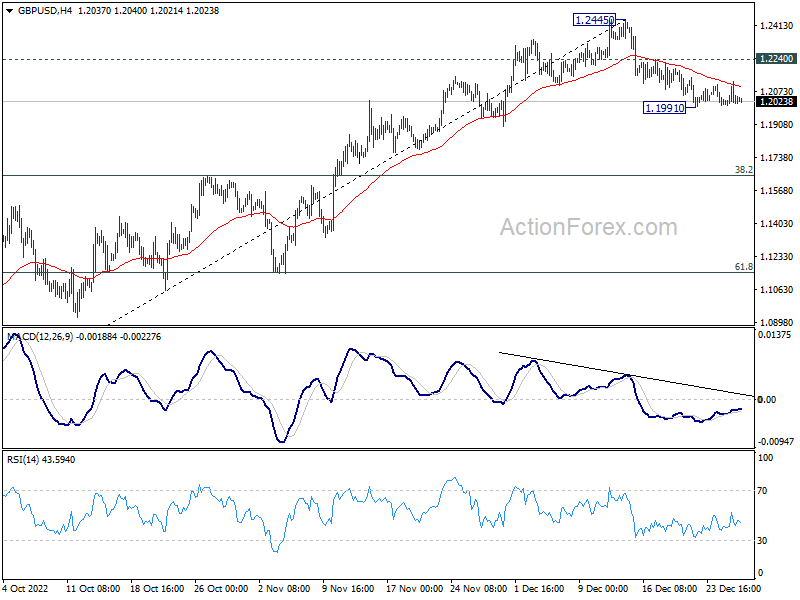
Daily Pivots: (S1) 1.1973; (P) 1.2049; (R1) 1.2096; More...
Intraday bias in GBP/USD stays neutral at this point. On the downside, break of 1.1991 will resume the fall from 1.2445 to 55 day EMA (now at 1.1916). Firm break there will target 38.2% retracement of 1.0351 to 1.2445 at 1.1645. On the upside, break of 1.2240 minor resistance will turn bias back to the upside for retesting 1.2445 instead.
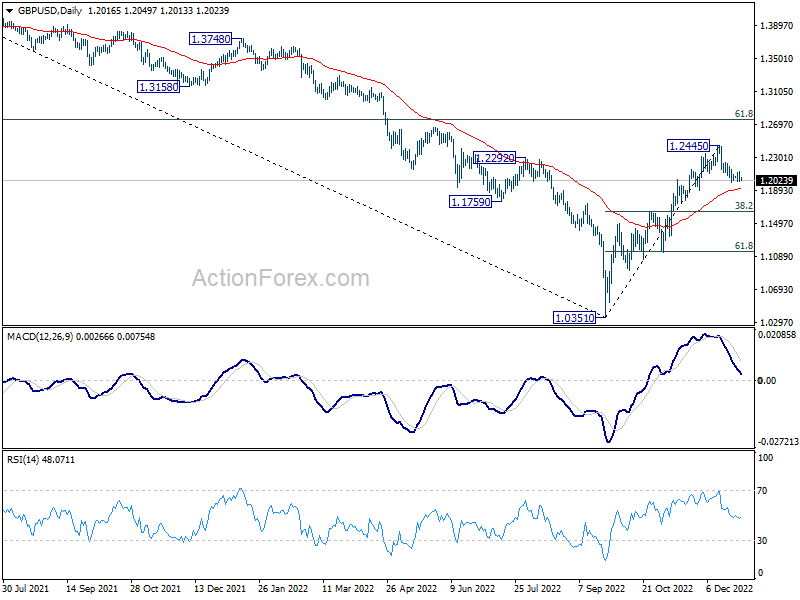
In the bigger picture, rise from 1.0351 medium term bottom is at least correcting whole down trend from 1.4248 (2021 high). Further rise is expected as long as 1.1644 resistance turned support holds. Next target is 61.8% retracement of 1.4248 to 1.0351 at 1.2759. Sustained break there will pave the way back to 1.4248. This will remain the favored case as long as 55 day EMA (now at 1.1916) holds.
USD/CHF Daily Outlook
Daily Pivots: (S1) 0.9254; (P) 0.9281; (R1) 0.9315; More...
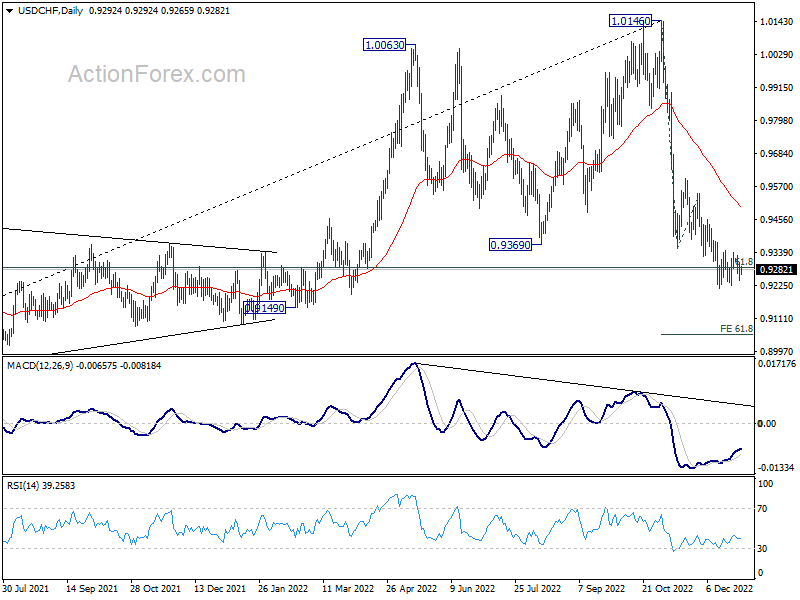
Intraday bias in USD/CHF remains neutral as range trading is still in progress. Further decline is in favor with 0.9378 resistance intact. On the downside, break of 0.9214 will resume the fall and target 61.8% projection of 1.0146 to 0.9355 from 0.9545 at 0.9056. However, break of 0.9378 resistance will indicate short term bottoming and turn bias back to the upside for 0.9545 resistance instead.
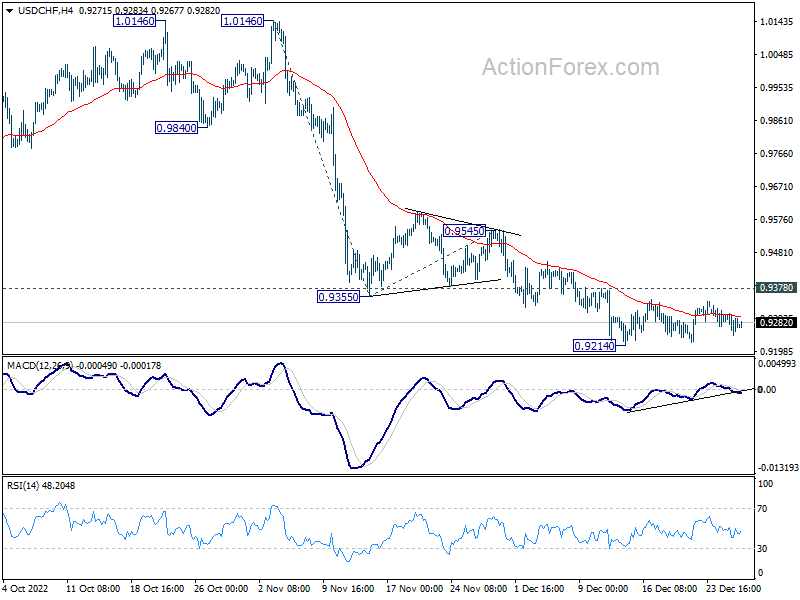
In the bigger picture, rise from 0.8756 (2021 low) has completed at 1.0146, well ahead of 1.0342 long term resistance (2016 high). Based on current downside momentum, fall from 1.0146 might be a medium term down trend itself. Sustained break of 61.8% retracement of 0.8756 to 1.0146 at 0.9287 will pave the way to 0.8756. In any case, risk will stay on the downside as long as 0.9545 resistance holds.
USD/CAD Daily Outlook
Daily Pivots: (S1) 1.3524; (P) 1.3568; (R1) 1.3650; More....
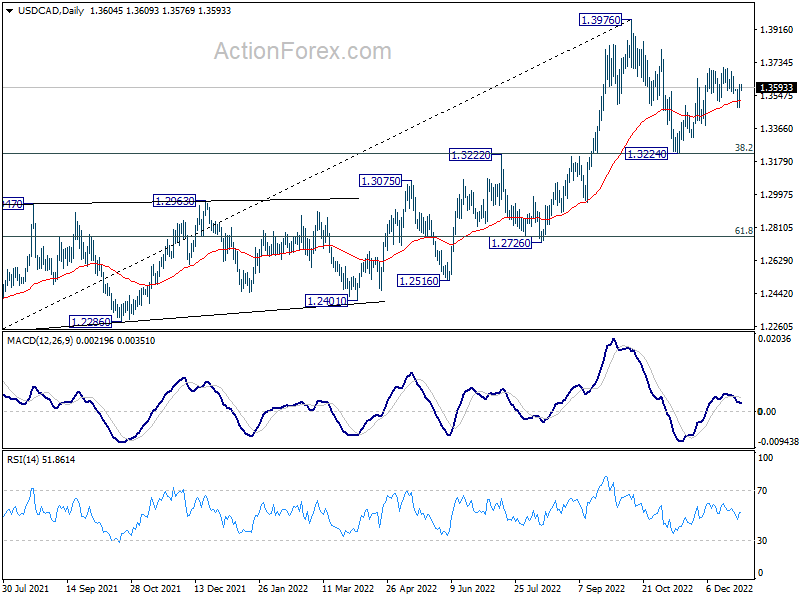
USD/CAD recovered quickly after dipping to 1.3483 and intraday bias is turned neutral first. On the upside, break of 1.3704 will resume the rebound form 1.3224 to retest 1.3976 high. On the downside, break of 1.3483 will turn bias back to the downside for 1.3224 support zone.
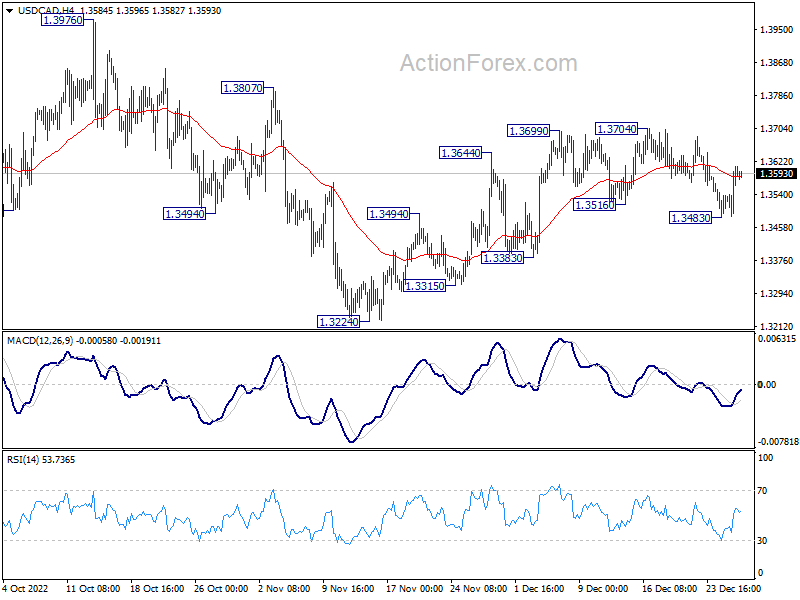
In the bigger picture, as long as 1.3222 cluster support (38.2% retracement of 1.2005 to 1.3976 at 1.3223) holds, larger up trend from 1.2005 (2021 low) is still expected to resume through 1.3976 high at a later stage. However, firm break of 1.3222/3 will indicate that the trend might have reversed. Deeper fall would be seen to next cluster support at 1.2726 (61.8% retracement at 1.2758).