Sample Category Title
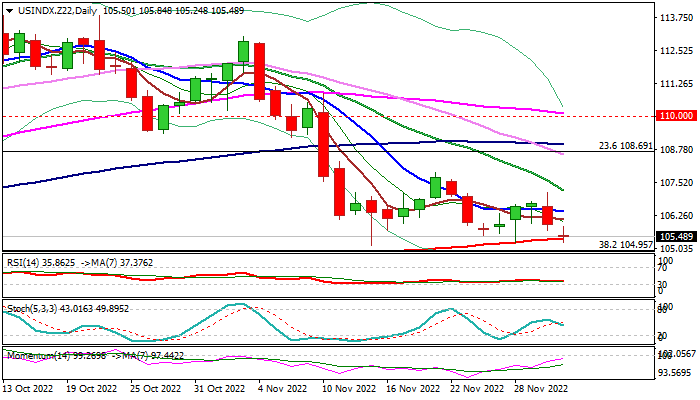
US initial jobless claims dropped back to 225k
US initial jobless claims dropped -16k to 225k in the week ending November 26, below expectation of 245k. Four-week moving average of initial claims rose 2k to 229k.
Continuing claims rose 57k to 1608k in the week ending November 19. Four-week moving average of continuing claims rose 30k to 1539k.
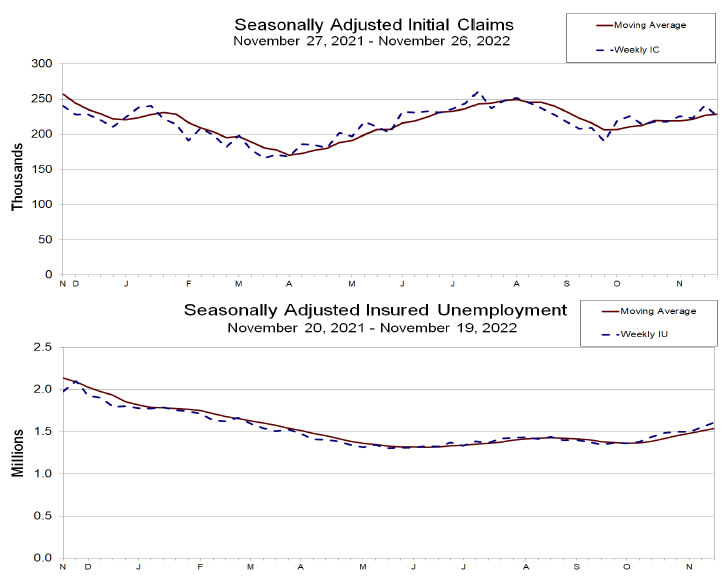
US PCE slowed to 6.0% yoy in Oct, core PCE down to 5.0% yoy
US personal income rose 0.7% mom to USD 155.3B in October, above expectation of 0.4% mom. Personal spending rose 0.8% mom to USD 147.9B, matched expectations.
For the month, PCE price index rose 0.3% mom, below expectation of 0.5% mom. PCE core (excluding food and energy) rose 0.2% mom, below expectation of 0.4% mom.
From the same month ago, PCE price index slowed from 6.3% yoy to 6.0% yoy, below expectation of 6.0% yoy. PCE core price index slowed from 5.2% yoy to 5.0% yoy, matched expectations. Prices for goods rose 7.2% yoy and prices for services rose 5.4% yoy. Food prices rose 11.6% yoy and energy prices rose 18.4% yoy.
Silver Bulls Roar Back; Meet Key Resistance
Silver staged an exciting rally to re-enter the 22.00 region on the back of Powell’s dovish tone on Wednesday.
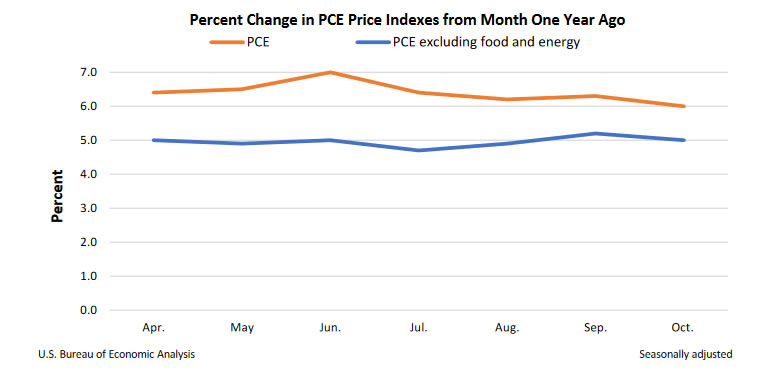
The 50% Fibonacci retracement of the 26.93-17.54 downtrend at 22.25 is again under the spotlight, pushing the market back to losses after the pickup to a new high of 22.39 early on Thursday. Yet, the bulls may have some extra fuel in the tank according to the RSI and the MACD. The former has recently recouped some ground above its 50 neutral mark, while the latter keeps gaining positive momentum, currently set to climb above its red signal line.
If the wall at 22.25 collapses, the bulls will gear up for the 23.00 psychological mark. Breaching the latter, the rally could continue towards the 61.8% Fibonacci of 23.95.
In the event of a downside reversal, the price may initially seek support between 21.60 and 21.35, where the 20- and 200-day simple moving averages (SMAs) are placed. The 38.2% Fibonacci of 21.12 may cement that floor, delaying an extension to the previous low of 20.56. Otherwise, the decline could stretch towards the 50-day SMA, bringing the 23.6% Fibonacci of 19.75 in sight too.
In short, silver is currently testing an important resistance region at 22.25, a break of which is required to activate fresh buying.
US 30 Index Unlocks New More-than-7-month High
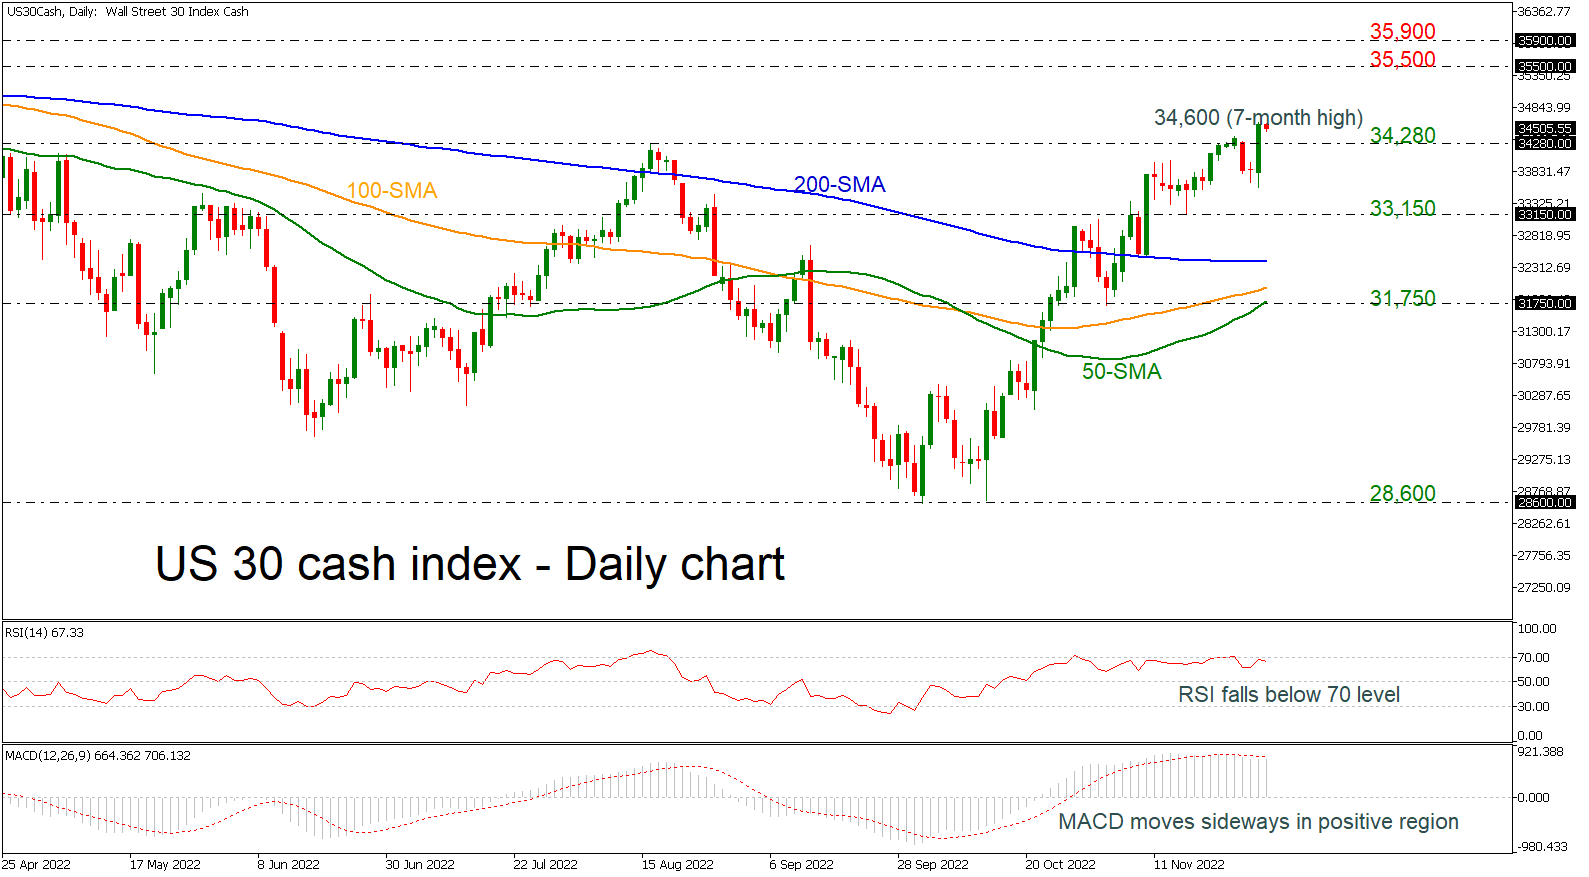
The US 30 cash index posted a notable bullish day yesterday, jumping above a key level of 34,280, adding to the optimism for further positive movements. The index hit a fresh more-than-seven-month high of 34,600; however, the technical oscillators are currently suggesting a bearish correction. The RSI touched the overbought region and dived lower, while the MACD is holding beneath its trigger line.
Should the price manage to reinforce the upside move, the next resistance could come around 35,500, registered on April 17. A break above this line would take the market towards the 35,900 resistance, taken from the peak on February 6.
However, if prices are unable to break the recent high in the next few sessions, the risk would shift back to the downside, with the 34,280 immediate support coming into focus as well as the 33,150 barrier. A drop below this area would test the 200-day simple moving average (SMA) at 32,400 ahead of the 100- and 50-day SMAs at 32,000 and 31,750 respectively. The next hurdle to watch lower down is 28,600 that will switch the outlook to bearish again.
In a nutshell, the index is bullish after the bounce off 28,600 in the short-term and any moves above the next resistance levels may change the broader picture to positive as well.
Platinum Wave Analysis
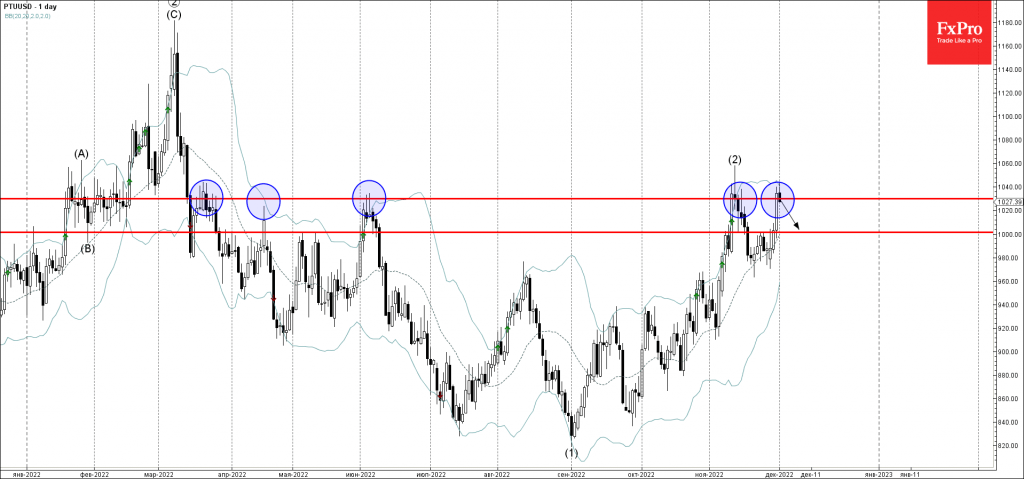
- Platinum reversed from powerful resistance 1030.00
- Likely to fall to support level 1000.00
Platinum today reversed down from the powerful, multi-month resistance level 1030.00 (which has been reversing the price from the end of March).
The resistance zone near the resistance level 1030.00 was strengthened by the upper daily Bollinger Band.
Platinum can be expected to fall further toward the next round support level 1000.00 (former minor resistance from the end of November, acting as the support after it was broken earlier).
AUDNZD Wave Analysis
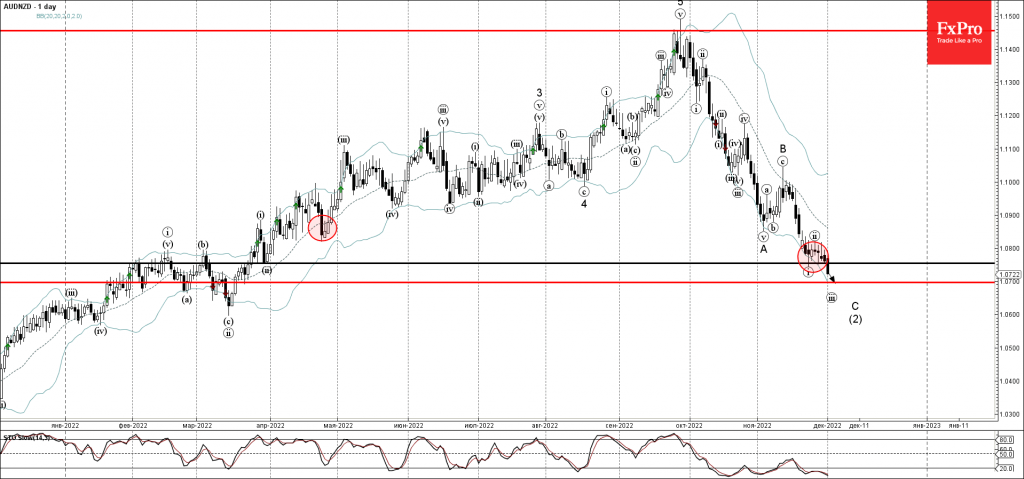
- AUDNZD broke support level 1.0755
- Likely to fall to support level 1.0700
AUDNZD under the bearish pressure after the earlier breakout of the key support level 1.0755 (which has been reversing the price from May).
The breakout of the support level 1.0755 accelerated the impulse wave (iii) of the medium-term downward impulse wave C from the middle of November.
AUDNZD can be expected to fall further toward the next support level 1.0700 (target for the completion of the active impulse wave (iii)).
NZDUSD Wave Analysis
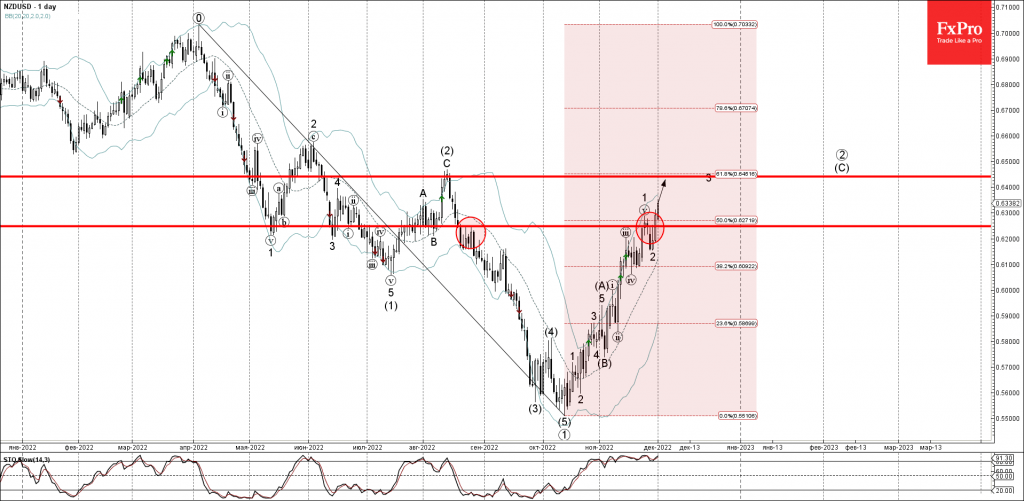
- NZDUSD broke key resistance level 0.6250
- Likely to rise to resistance level 0.6440
NZDUSD recently broke the key resistance level 0.6250 (which has been reversing the price from August), intersecting with the 50% Fibonacci correction of the downward impulse from April.
The breakout of the resistance level 0.6250 accelerated the impulse wave 3 of the impulse sequence (C) from the start of November.
NZDUSD can be expected to rise further toward the next resistance level 0.6440 (multi-month high from August, target for the completion of the active impulse wave 3).
EUR/USD: Euro Keeps Firm Tone on Weaker Dollar, Improved Economic Data
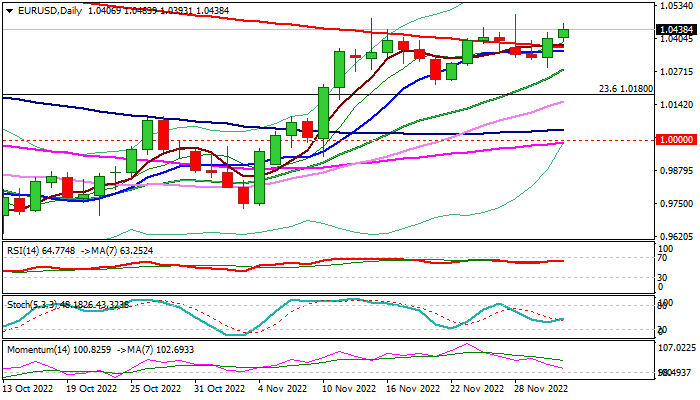
The Euro extends higher in early Thursday as the risk sentiment was boosted by comments from Fed Powell who signaled a lower pace of rate hikes in the near future.
The single currency keeps firm tone following Wednesday’s 0.76% advance, underpinned by stronger than expected easing in inflation and slight improvement Eurozone manufacturing sector.
Daily studies are mixed, with bullish signal generated on Wednesday’s break above converged 10/200/100 DMA’s, countered by recent long upper shadows on daily candles and strong fall of bullish momentum.
On the other hand, large bullish monthly candle of November underpins and brightens the outlook.
Bulls eye immediate barriers at 1.0481/96 (Nov 15/28 spile highs, reinforced by upper 20-week Bollinger band, which guards key resistance at 1.0578 (Fibo 38.2% of 1.2266/0.9535), with break here to generate reversal signal.
Repeated close above 200DMA (1.0369) to keep immediate bulls in play, though larger bullish structure would remain intact while the action stays above 1.0281/22 (rising 20DMA / Nov 21 higher low).
Res: 1.0496; 1.0578; 1.0620; 1.0700.
Sup: 1.0393; 1.0369; 1.0281; 1.0222.
Australian Dollar Flies after Powell Speech
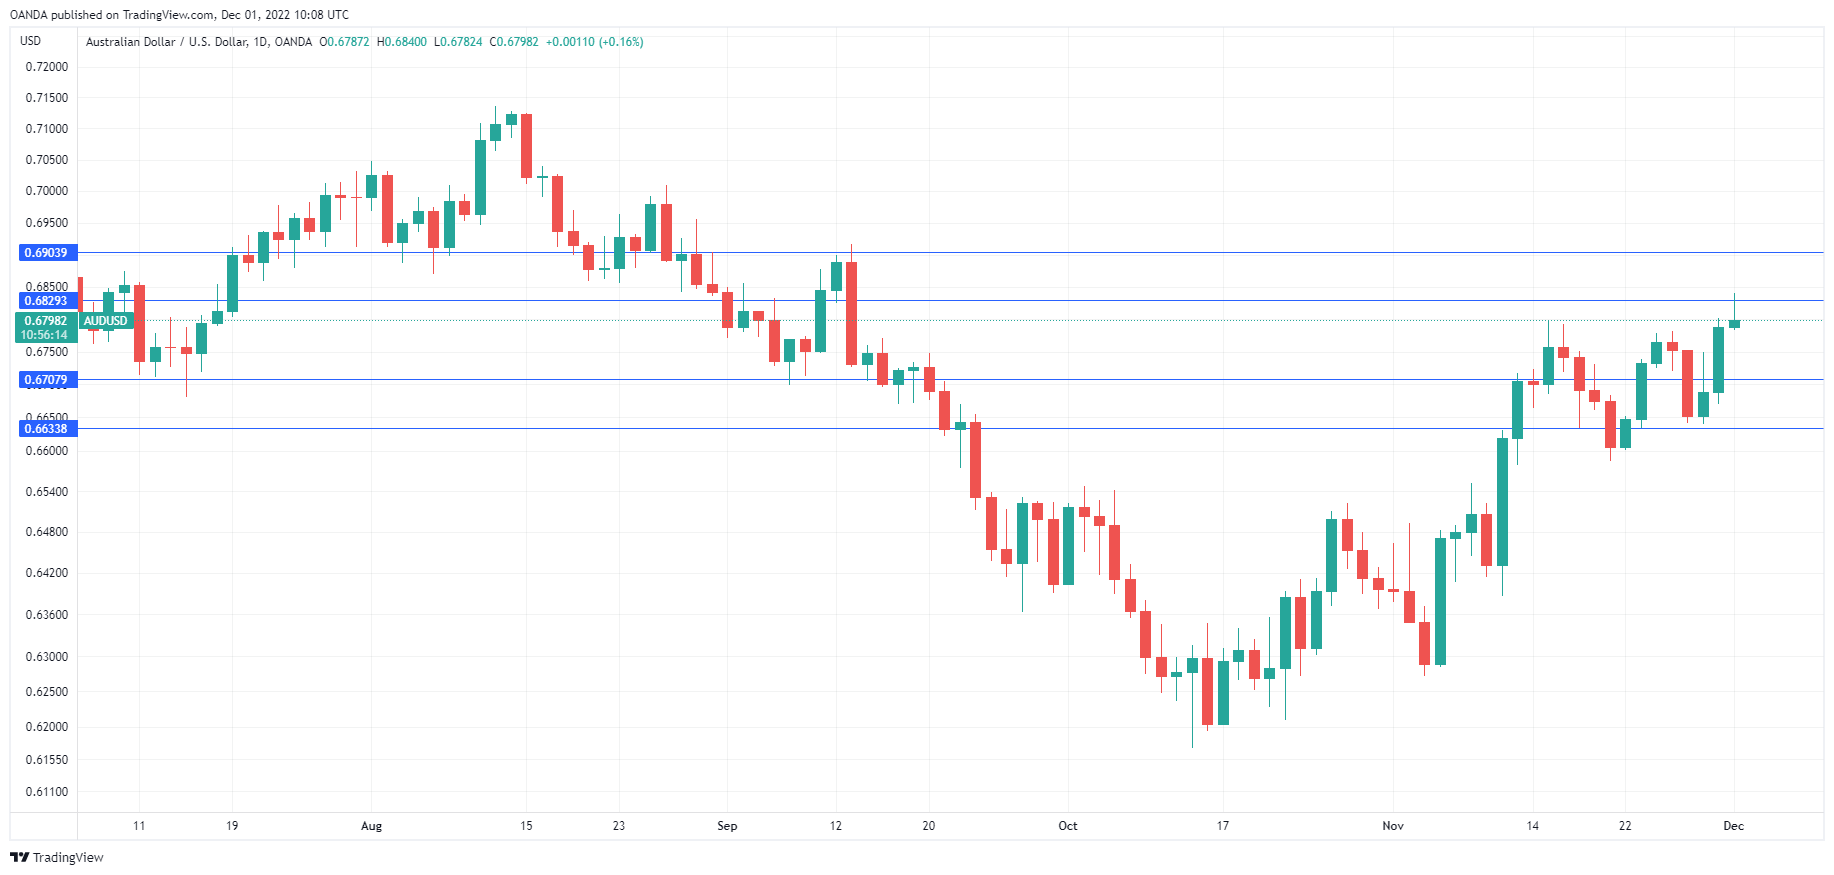
AUD/USD continues to power upwards and hit 10-week highs earlier today. The Australian dollar climbed 1.5% on Wednesday and has edged higher today. In the European session, AUD/USD is trading at 0.6796, up 0.14%.
US dollar slides after Powell speech
Fed Chair Jerome Powell spoke on Wednesday and gave the markets what they wanted to hear with regard to the December rate hike. Powell strongly hinted that the Fed would slow the pace of rate increases at the December 14th meeting, after four successive 75-bp hikes. Powell said that slowing down at this point “is a good way to balance the risks”, as the Fed Chair is trying to slow the economy while avoiding a recession. The markets duly responded by pricing in a 50-bp rate hike at 80%, up sharply from 65% prior to Powell’s remarks. This sent financial markets higher, while the US dollar was broadly lower.
Investors focussed on Powell’s hint that rate hikes will slow at the next meeting, choosing to ignore his comments that rates could rise higher than previously expected and for a prolonged period in order to curb stubborn inflation. The likely easing to 50 bp was a green light for the markets, and what is down the road can be worried about another time.
In Australia, Private Capital Expenditure disappointed in Q3 with a reading of -0.6%. This was below the Q2 reading of 0.0% and way off the consensus of 1.5%. The RBA meets on December 6th after having eased on rate hikes, with two straight increases of 25-bp. The cash rate is currently at 2.85%, and there is a good chance that the RBA will again raise rates by 25 bp next week, as it looks to fight inflation while guiding the economy to a soft landing.
AUD/USD Technical
- AUD/USD is testing resistance at 0.6829. Above, there is resistance at 0.6903
- There is support at 0.6707 and 0.6633
Dollar Index: Dollar Under Fresh Pressure from Less Hawkish than Expected Powell
The dollar index stabilized in early European trading on Thursday, after a gap lower opening and dip to two-week low, as less hawkish than expected remarks from Fed Chair Powell on Wednesday, soured the sentiment.
Powell signaled that the central bank is likely to slow the pace in policy tightening, following a series of jumbo hikes in recent meetings, but repeated that the Fed will continue to raise interest rates in attempts to put high inflation under control and push it towards 2% target.
He also pointed to necessary adjustment to new economic conditions as higher borrowing cost is expected to last for some time, due to slow reaction of inflation to the central bank’s measures and lower supply in labor market.
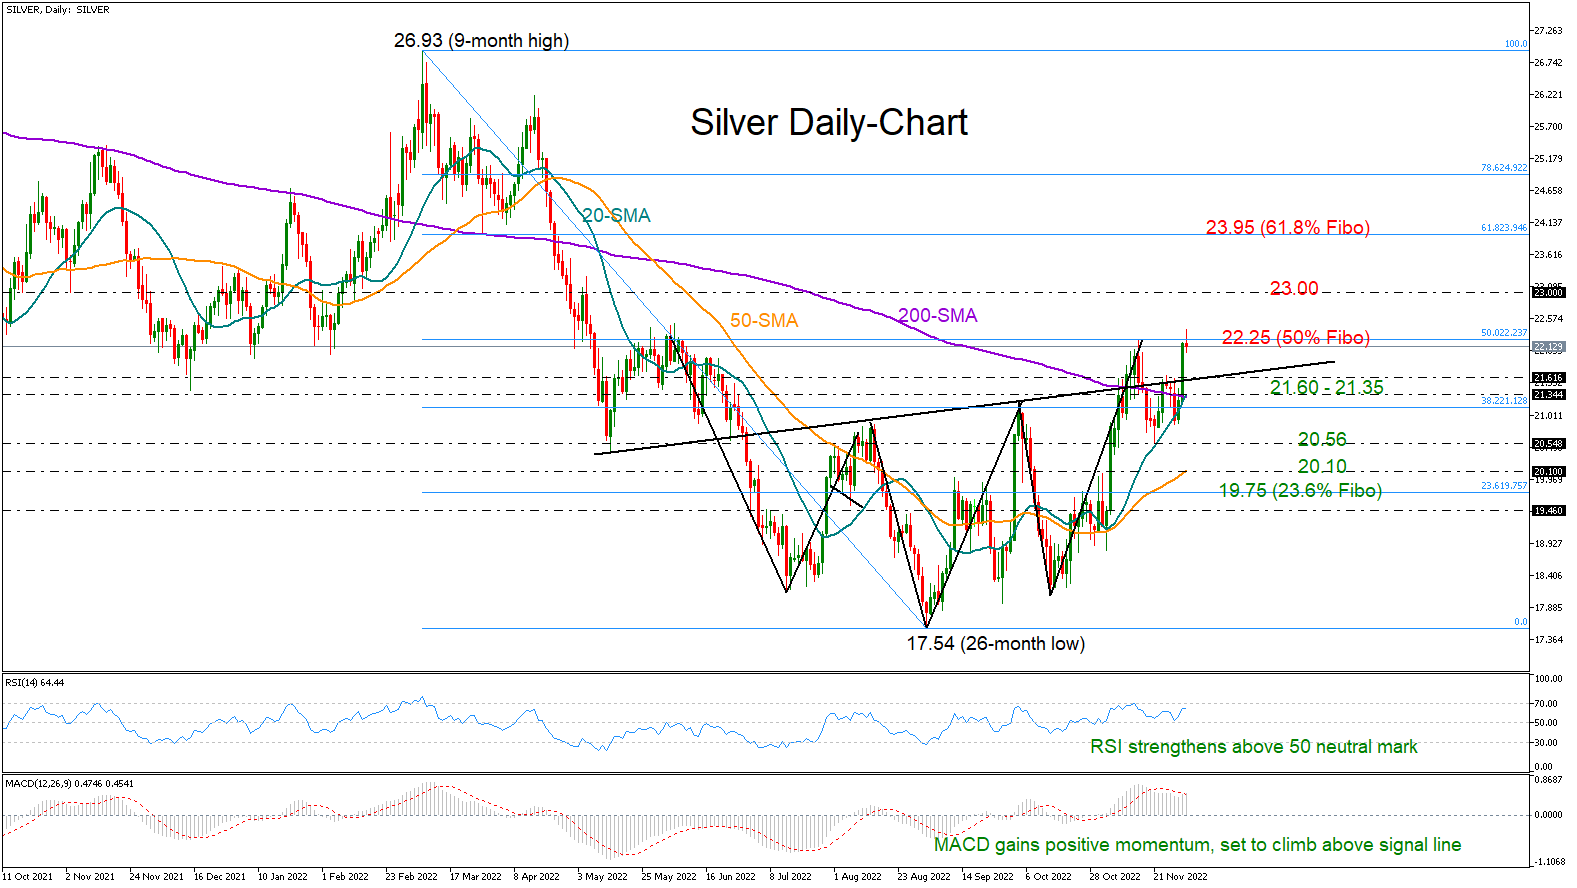
Fresh weakness cracked the upper boundary of strong support zone at 105.41/104.95 (defined by 200DMA and Fibo 38.2% of 89.15/114.72 rally) where larger bears continue to face headwinds.
Prevailing bearish tone from Powell’s remarks adds to negative daily technical studies (MA’s in bearish setup, RSI / stochastic heading south, partially countered by rising momentum, although the indicator is still in negative territory).
Stronger bearish signal comes from monthly chart, as the dollar index ended trading in November with a massive losses of nearly 5% (the biggest monthly fall since May 2009), forming reversal pattern, with the action being heavily weighed by large bearish monthly candle.
Near-term focus remains shifted to the downside, although the action may hold in extended consolidation before fresh push lower.
Clear break of pivotal 105.41/104.95 support zone, would open way for deeper correction of 89.15/114.72 uptrend and expose targets at 102.94 (55WMA) and 101.94 (50% retracement).
Near-term range should remain capped under pivotal resistances at 107.22 (20DMA) and 107.88 (Nov 21 high) to keep larger bears intact.
Res: 105.84; 106.40; 107.22; 107.88.
Sup: 105.15; 104.96; 104.49; 103.18.