

Sample Category Title
USD/JPY Daily Outlook
Daily Pivots: (S1) 134.34; (P) 136.22; (R1) 137.24; More...
Intraday bias in USD/JPY remains on the downside as fall from 151.94 is in progress. Next target is 133.07 medium term fibonacci level. Some support could be seen there to bring recovery. Break of 137.66 support turned resistance will turn intraday bias neutral first. However, near term risk will stay on the downside as long as 142.24 resistance holds, even in case of recovery.
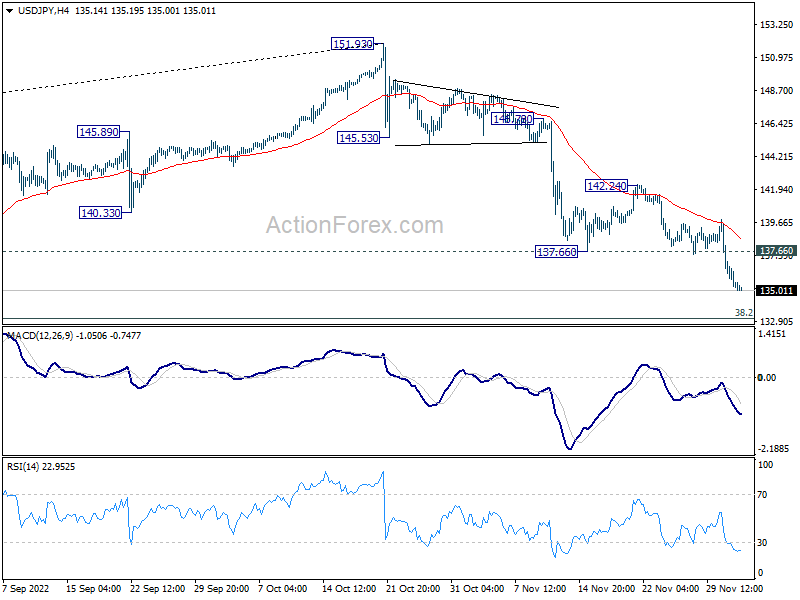
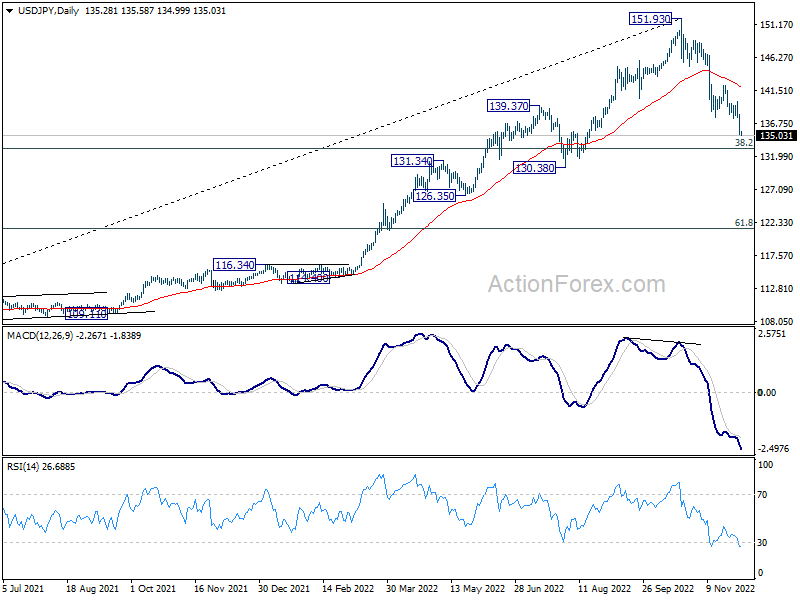
In the bigger picture, a medium term top should be formed at 151.93. Fall from there is correcting larger up trend from 102.58. It's too early to call for bearish trend reversal. But even as a corrective move, such decline should target 38.2% retracement of 102.58 to 151.93 at 133.07, or further to 55 week EMA (now at 131.51).
Yen Outperforms on Falling US Yields, Focus Turns to NFP
Yen is apparently the biggest winner against the broadly pressured Dollar. Steep declines in US and European benchmark yield gave the Japanese currency much support. Euro is currently the better performer among European majors. Canadian Dollar clearly lags behind other commodity currencies. The greenback will now look into this non-farm payroll data today, which might not carry as much significance as earlier anticipated.
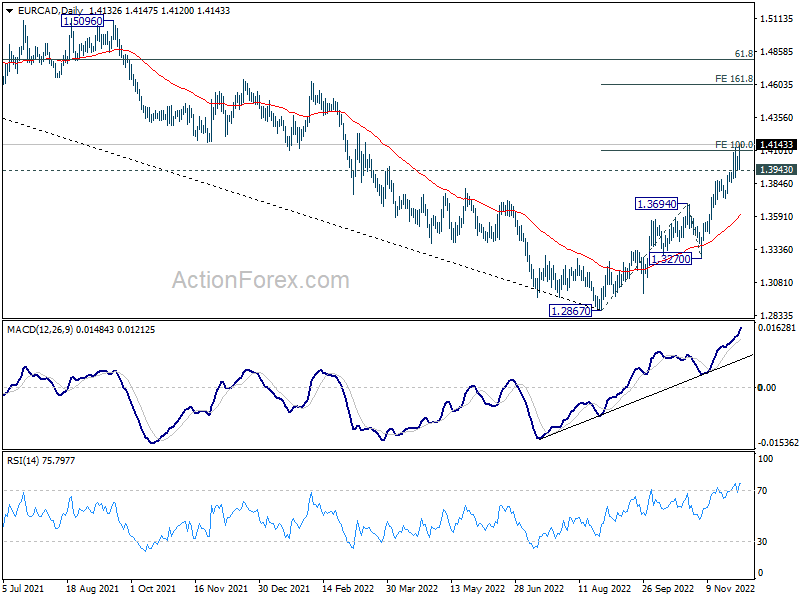
Canadian Dollar is also worth a watch today with Canadian job data featured. Technically, EUR/CAD's rise from 1.2867 resumed this week and edged higher to 1.4147 so far. Further rally is expected as long as 1.3943 support holds. Sustained trading above 100% projection of 1.2867 to 1.3694 from 1.3270 at 1.4097 could prompt more upside acceleration to 161.8% projection at 1.4608 in the near term. The tone for the move could be set today.
In Asia, Nikkei dropped -1.59%. Hong Kong HSI is down -0.07%. China Shanghai SSE is down -0.15%. Singapore Strait Times is down -0.77%. Japan 10-year JGB yield is up 0.0059 at 0.257. Overnight, DOW dropped -0.56%. S&P 500 dropped -0.09%. NASDAQ rose 0.13%. 10-year yield dropped -0.174 to 3.529.
BoJ Tamura called for review of monetary framework
BoJ board member Naoki Tamura told Asahi daily that a review of monetary framework should be conducted by the central bank. Such review could come "soon or at a somewhat later date". "Whether the BOJ needs to tweak its monetary policy will depend on the outcome of the review," he said.
Tamura also noted there was scope to review the feasibility of the 2% target, and consider it as a more flexible goal. "As long as the economy is achieving a virtuous cycle, I think it's okay even if inflation is at, say 1.8%" instead of 2%," he noted.
Fed Williams: Slowing rate hike is just stepping down one step
New York Fed President John Williams said yesterday in an interview that slowing the pace of rate hikes in December would simply mean "stepping down one step" in the effort to curb inflation.
"I still think we have a ways to go in terms of where the fed funds target is and where we need to get it to next year in order to get the sufficiently restrictive stance," he said.
"Inflation, first of all, is the number one problem we're facing in terms of monetary policy. It is far too high," Williams said. And, bring inflation back to 2% target will "take a good couple of years".
But he added: "I expect to see a pretty significant decline in inflation next year as supply chain issues improve, as we see the slowing economy, the economy getting into better balance."
NFP watched as 10-year yield tumbled
US non-farm payroll report is a major focus for today. Markets are expecting 200k job growth in the US in November. Unemployment rate is expected to be unchanged at 3.7%. Average hourly earnings is expected to rise 0.3% mom.
The significance of today's set of data might not be as high as earlier expected, after Fed Chair Jerome Powell's speech two days ago. Powell clearly indicated that it "makes sense" to start slowing the pace of rate hikes, as soon as this month. That is, a 50bps hike is pretty much a done deal.
What matter now are the terminal rate of the tightening cycle, and the time to stay there. A month's job data shouldn't alter the expectations on these two issues much.
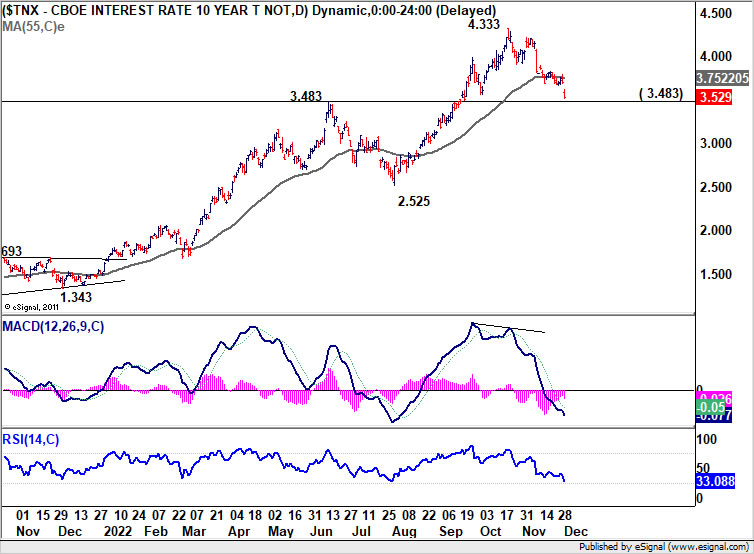
A key development to note is the surprised steep decline in 10-year yield overnight. The move away from 55 day EMA is clearly a bearish sign. But 3.483 might provide at least some interim support. Let's see today's NFP would trigger a recovery in TNX. If that happens, USD/JPY could also follow for a recovery.
Looking ahead
Germany trade balance and Eurozone PPI will be released in European session. In addition to US non-farm payroll, Canada will also release employment data.
USD/JPY Daily Outlook
Daily Pivots: (S1) 134.34; (P) 136.22; (R1) 137.24; More...
Intraday bias in USD/JPY remains on the downside as fall from 151.94 is in progress. Next target is 133.07 medium term fibonacci level. Some support could be seen there to bring recovery. Break of 137.66 support turned resistance will turn intraday bias neutral first. However, near term risk will stay on the downside as long as 142.24 resistance holds, even in case of recovery.
In the bigger picture, a medium term top should be formed at 151.93. Fall from there is correcting larger up trend from 102.58. It's too early to call for bearish trend reversal. But even as a corrective move, such decline should target 38.2% retracement of 102.58 to 151.93 at 133.07, or further to 55 week EMA (now at 131.51).
Economic Indicators Update
| GMT | Ccy | Events | Actual | Forecast | Previous | Revised |
|---|---|---|---|---|---|---|
| 21:45 | NZD | Terms of Trade Index Q3 | -3.40% | 1.50% | -2.40% | -2.30% |
| 23:50 | JPY | Monetary Base Y/Y Nov | -6.40% | -4.50% | -6.90% | |
| 07:00 | EUR | Germany Trade Balance (AUD) Oct | 4.3B | 3.7B | ||
| 10:00 | EUR | Eurozone PPI M/M Oct | 1.40% | 1.60% | ||
| 10:00 | EUR | Eurozone PPI Y/Y Oct | 39.30% | 41.90% | ||
| 13:30 | USD | Nonfarm Payrolls Nov | 200K | 261K | ||
| 13:30 | USD | Unemployment Rate Nov | 3.70% | 3.70% | ||
| 13:30 | USD | Average Hourly Earnings M/M Nov | 0.30% | 0.40% | ||
| 13:30 | CAD | Net Change in Employment Nov | 10.5K | 108.3K | ||
| 13:30 | CAD | Unemployment Rate Nov | 5.30% | 5.20% |
NFP watched as 10-year yield tumbled
US non-farm payroll report is a major focus for today. Markets are expecting 200k job growth in the US in November. Unemployment rate is expected to be unchanged at 3.7%. Average hourly earnings is expected to rise 0.3% mom.
The significance of today's set of data might not be as high as earlier expected, after Fed Chair Jerome Powell's speech two days ago. Powell clearly indicated that it "makes sense" to start slowing the pace of rate hikes, as soon as this month. That is, a 50bps hike is pretty much a done deal.
What matter now are the terminal rate of the tightening cycle, and the time to stay there. A month's job data shouldn't alter the expectations on these two issues much.
A key development to note is the surprised steep decline in 10-year yield overnight. The move away from 55 day EMA is clearly a bearish sign. But 3.483 might provide at least some interim support. Let's see today's NFP would trigger a recovery in TNX. If that happens, USD/JPY could also follow for a recovery.
Technical Outlook and Review
USD/JPY:
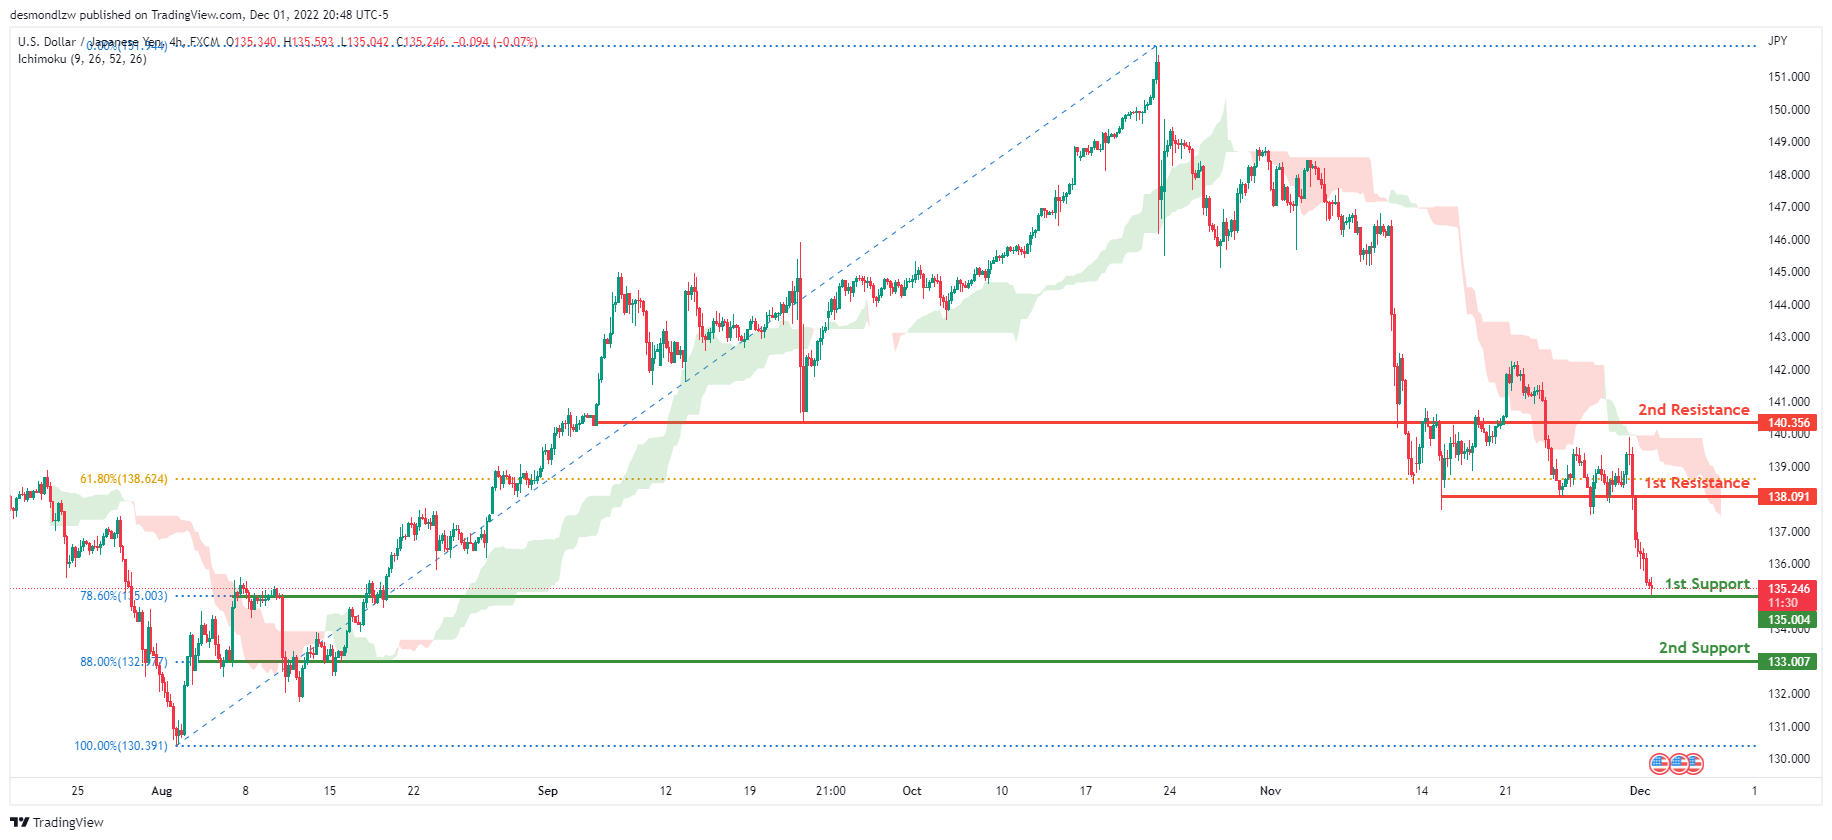
The current general bias for USDJPY on the H4 chart is bearish. To add confluence to this, the price is under the Ichimoku cloud which indicates a bearish market. If the bearish momentum continues, expect USDJPY to break the 1st support line at 135.004, where the 78.6% Fibonacci line is located, before heading towards the 2nd support at 133.007 where the 88% Fibonacci line is. In an alternative scenario, price could head back up to retest the 1st resistance line at 138.091, where the 61.8% Fibonacci line and previous low are located.
Areas of consideration:
- H4 time frame, 1st resistance at 138.091
- H4 time frame, 1st support at 135.004
- H4 time frame, 2nd support at 133.007
DXY:
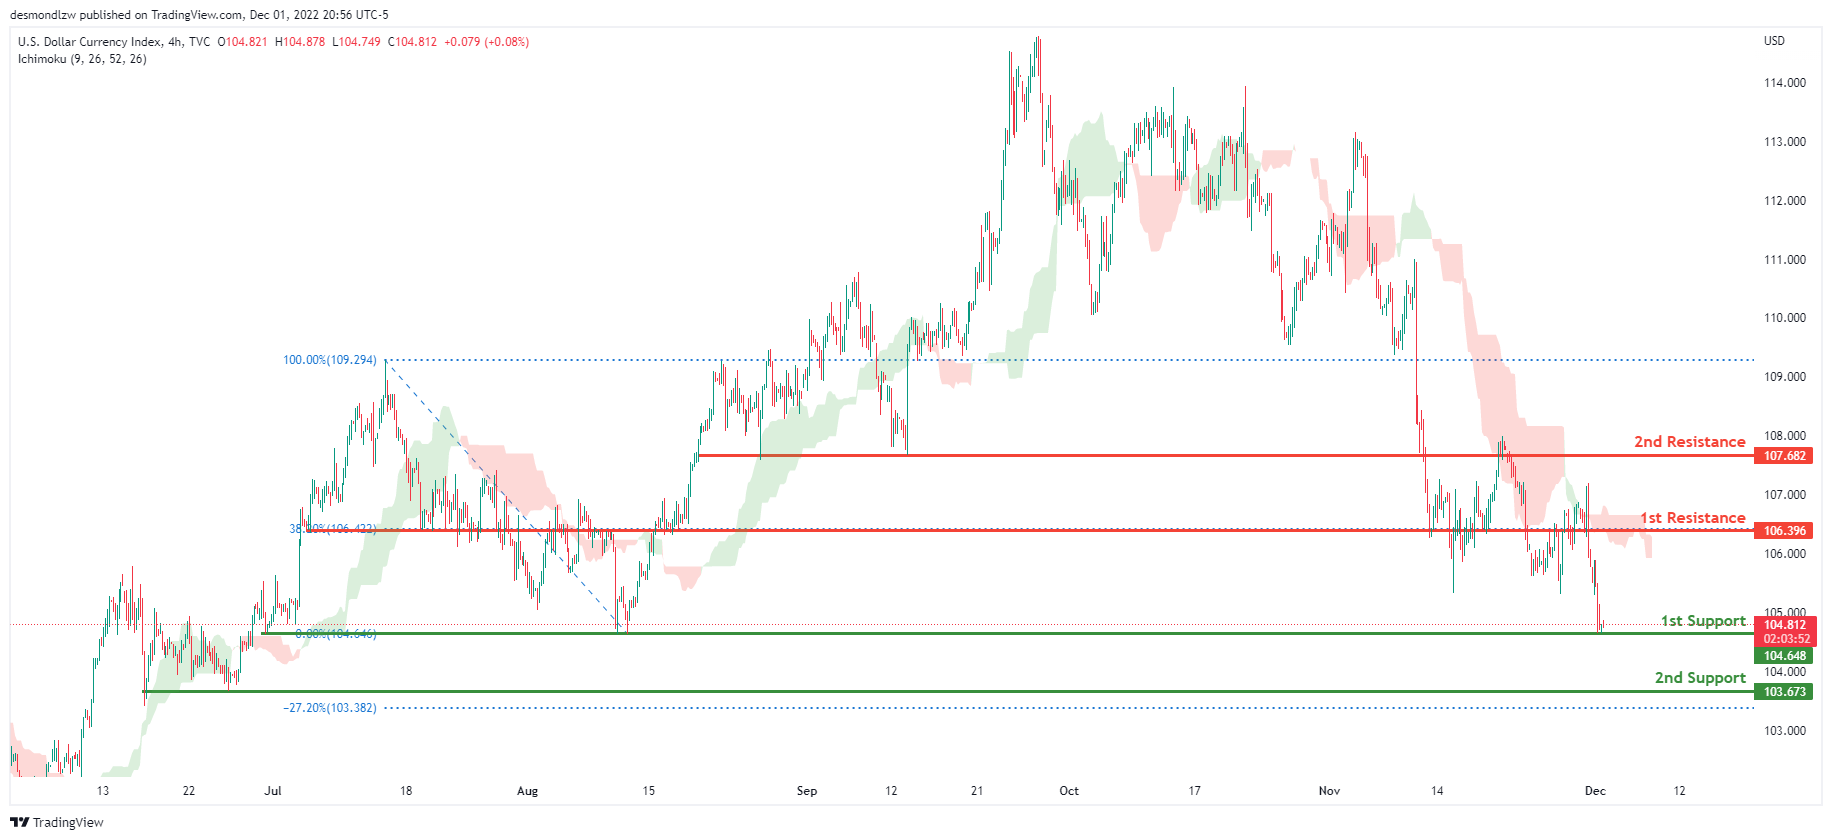
On the H4 chart, the overall bias for DXY is bearish. To add confluence to this, the price is crossing below the Ichimoku cloud which indicates a bearish market. If this bearish momentum continues, expect the price to possibly break the 1st support line at 104.648, where the previous swing low is, before heading towards the 2nd support line at 103.673, where the -27.2% Fibonacci expansion line is. In an alternative scenario, price could head back up and retest the 1st resistance line resistance at 106.396, where the 38.2% Fibonacci line lies.
Areas of consideration:
- H4 time frame, 1st resistance at 106.396
- H4 time frame, 1st support at 104.648
- H4 time frame, 2nd support at 103.673
EUR/USD:
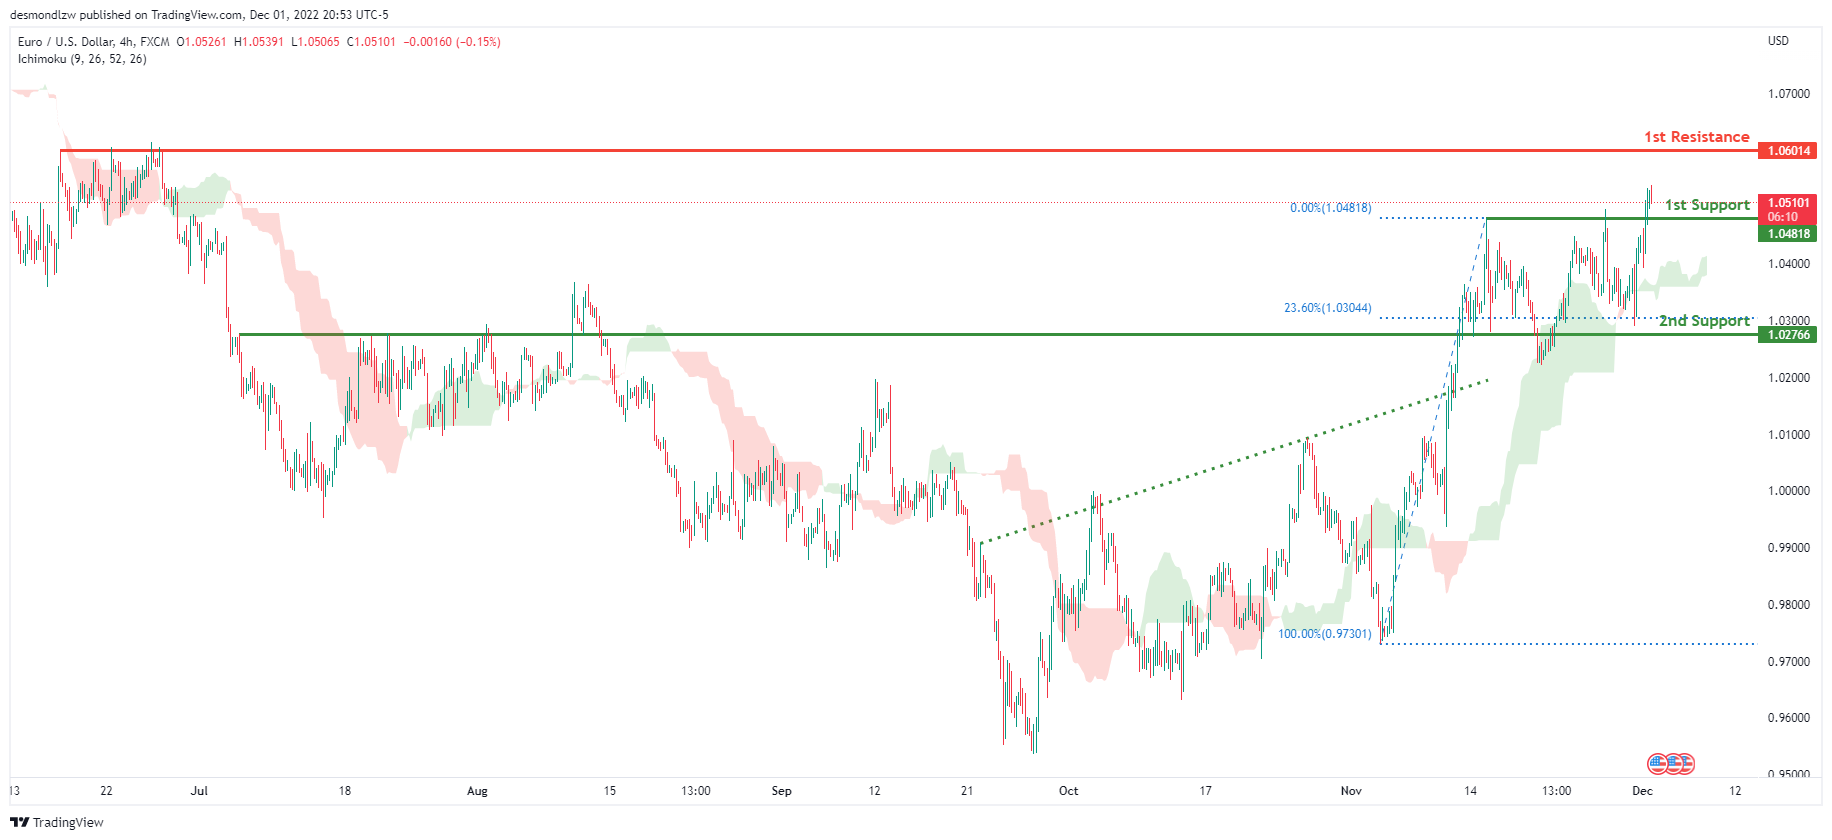
Looking at the H4 chart, my overall bias for EURUSD is bullish due to the current price being above the Ichimoku cloud, indicating a bullish market. To add confluence to this bias, price has also broken above the ascending trend line. If this bullish momentum continues, expect the price to possibly head towards the 1st resistance at 1.06014, where the previous swing high is located. In an alternate scenario, price could possibly head back down to retest the 1st support level at 1.04818, where the previous high is located.
Areas of consideration :
- H4 1st resistance at 1.06014
- H4 1st support at 1.04818
GBP/USD:
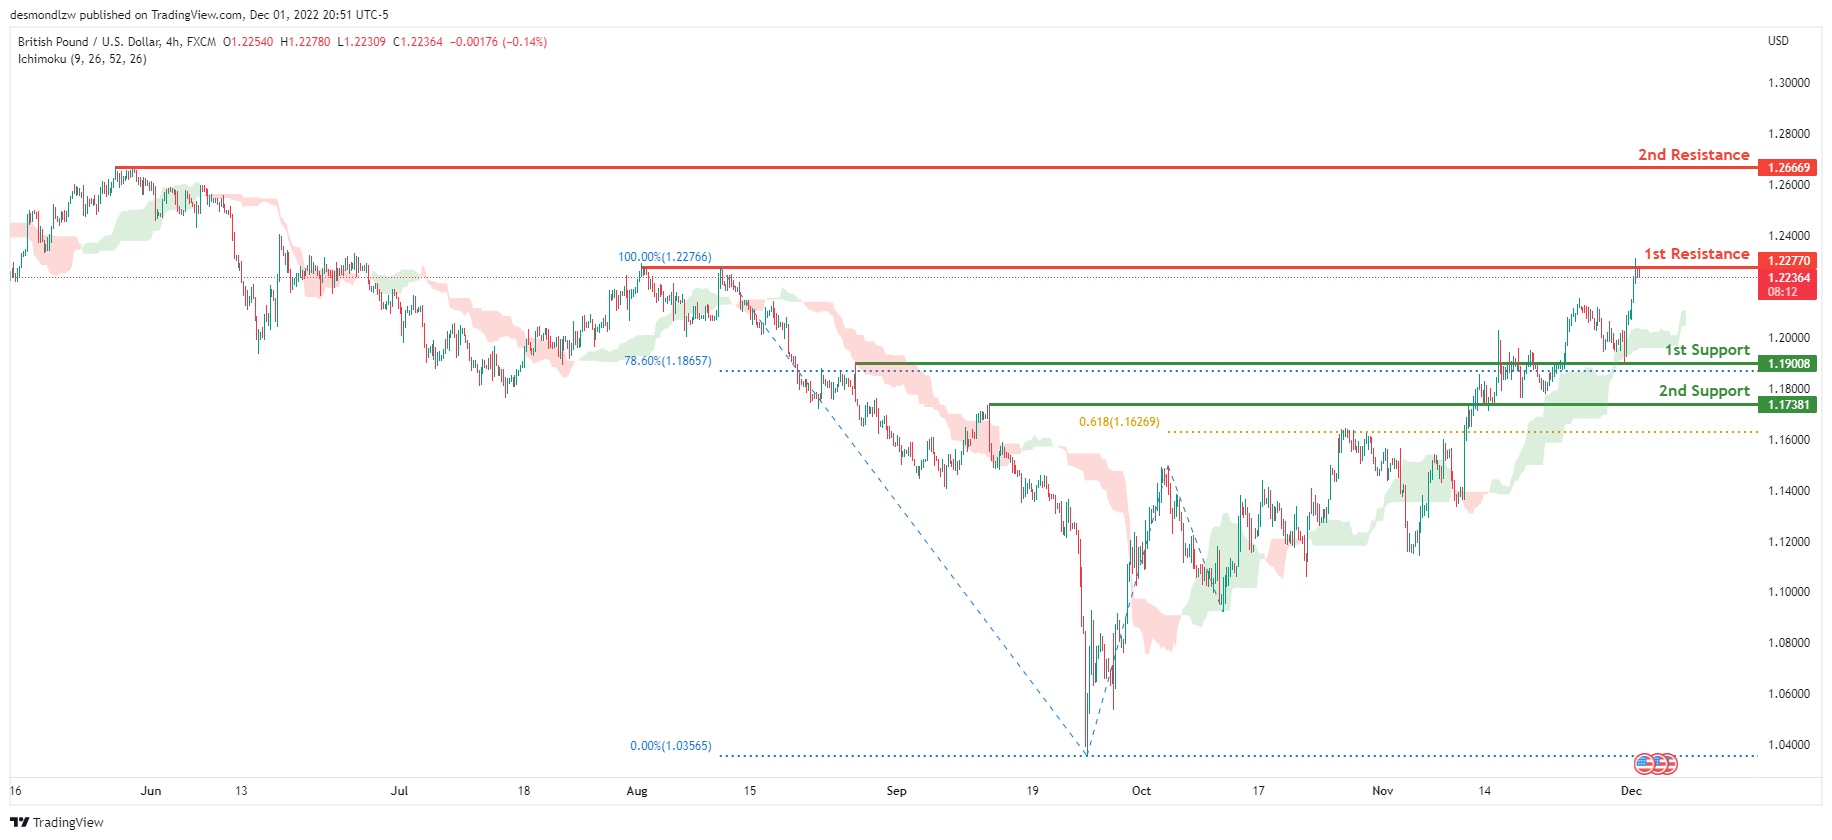
Looking at the H4 chart, my overall bias for GBPUSD is bullish due to the current price being above the Ichimoku cloud, indicating a bullish market. Expecting price to possibly break the 1st resistance line at 1.22770, where the previous swing high is, before heading towards the 2nd resistance line at 1.26669, where the previous swing high is. In an alternative scenario, price could possibly head back down to retest the 1st support line at 1.19008, where the 78.6% Fibonacci line is.
Areas of consideration:
- H4 1st resistance at 1.22770
- H4 2nd resistance at 1.26669
- H4 1st support at 1.19008
USD/CHF:
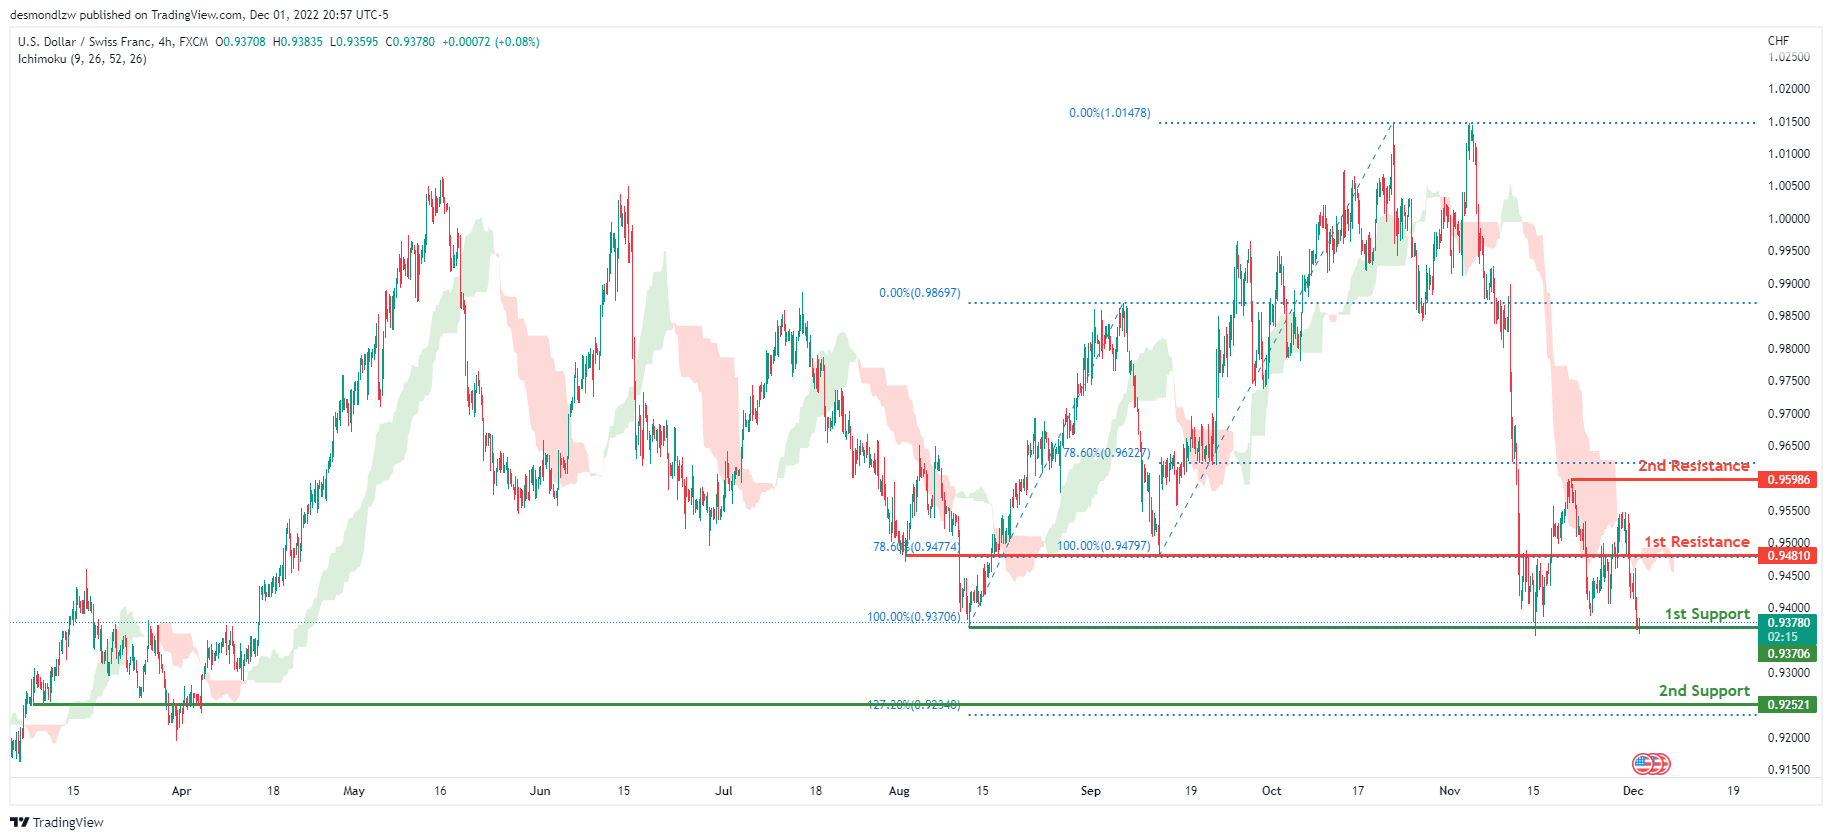
The overall bias for USDCHF on the H4 chart is bearish. In addition, the price is below the Ichimoku cloud, indicating a bearish market. If the current bearish trend continues, expect price to possibly break the 1st support line at 0.93706, where the previous swing low is, before heading towards the 2nd support at 0.92521 where the 127.2% Fibonacci extension line is. In an alternative scenario, price could possibly head back up towards the 1st resistance line at 0.94810 where the 78.6% Fibonacci line is.
Areas of consideration
- H4 1st support at 0.93706
- H4 2nd support at 0.92521
- H4 1st resistance at 0.94810
XAU/USD (GOLD):
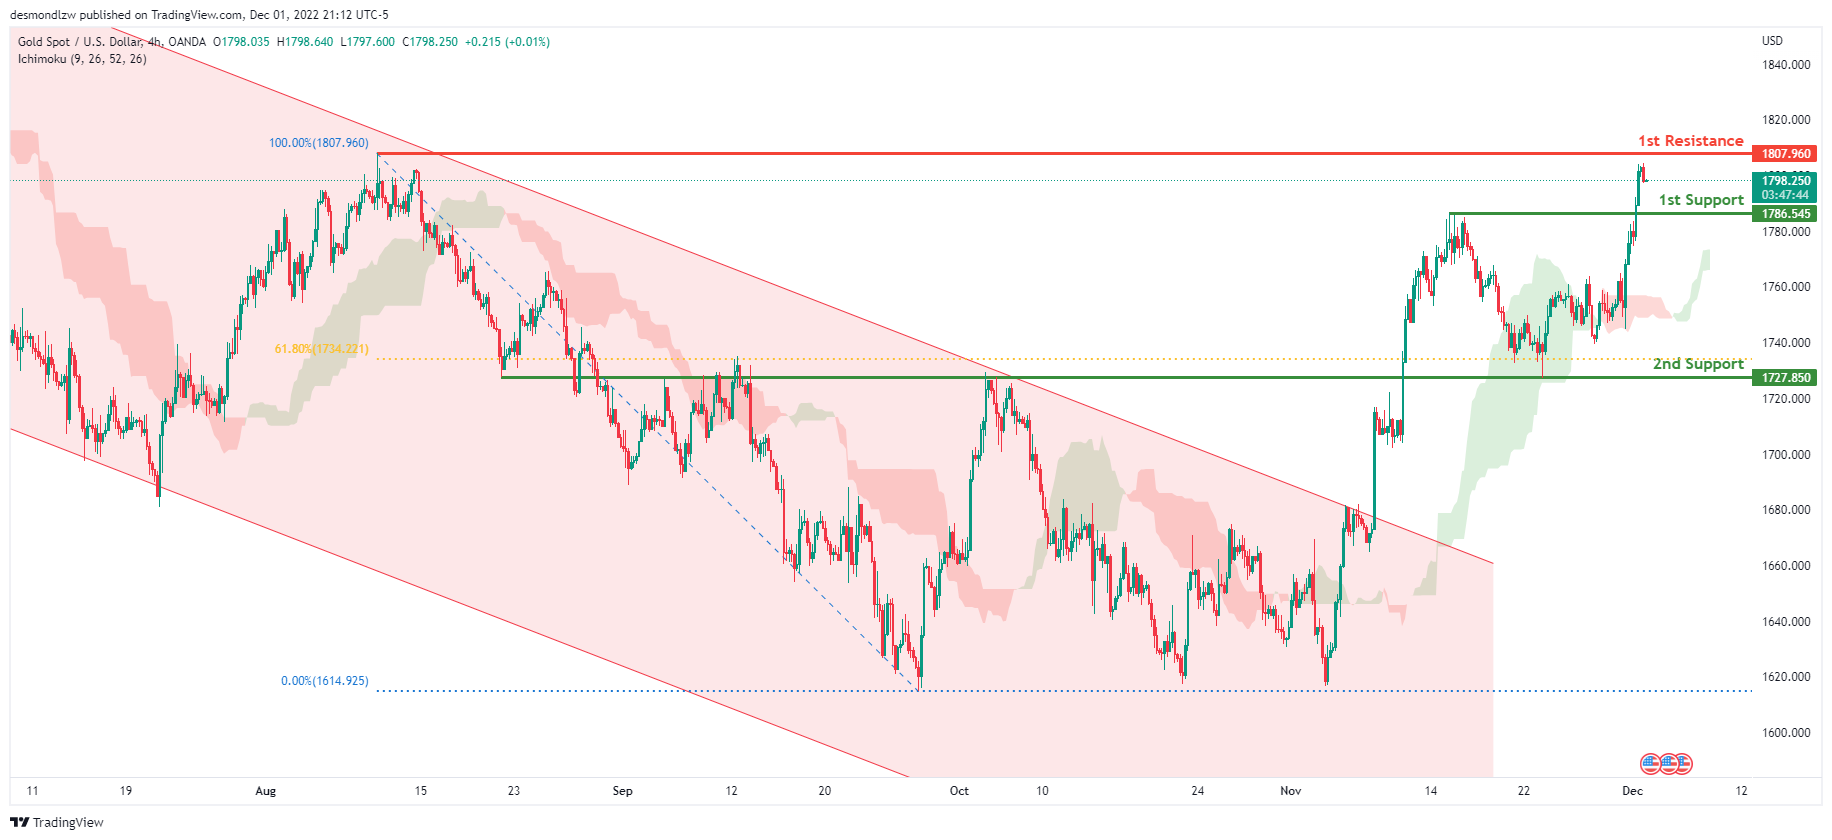
Looking at the H4 chart, my overall bias for XAUUSD is bullish due to the current price crossing above the Ichimoku cloud, indicating a bullish market. If this bullish momentum continues, expect the price to possibly continue heading towards the 1st resistance at 1807.960, where the previous swing high is located. In an alternate scenario, price could possibly head back down towards the 1st support level at 1786.545, where the previous swing high is located.
Areas of consideration:
- H4 time frame, 1st resistance at 1807.960
- H4 time frame, 1st support at 1786.545
AUD/USD:
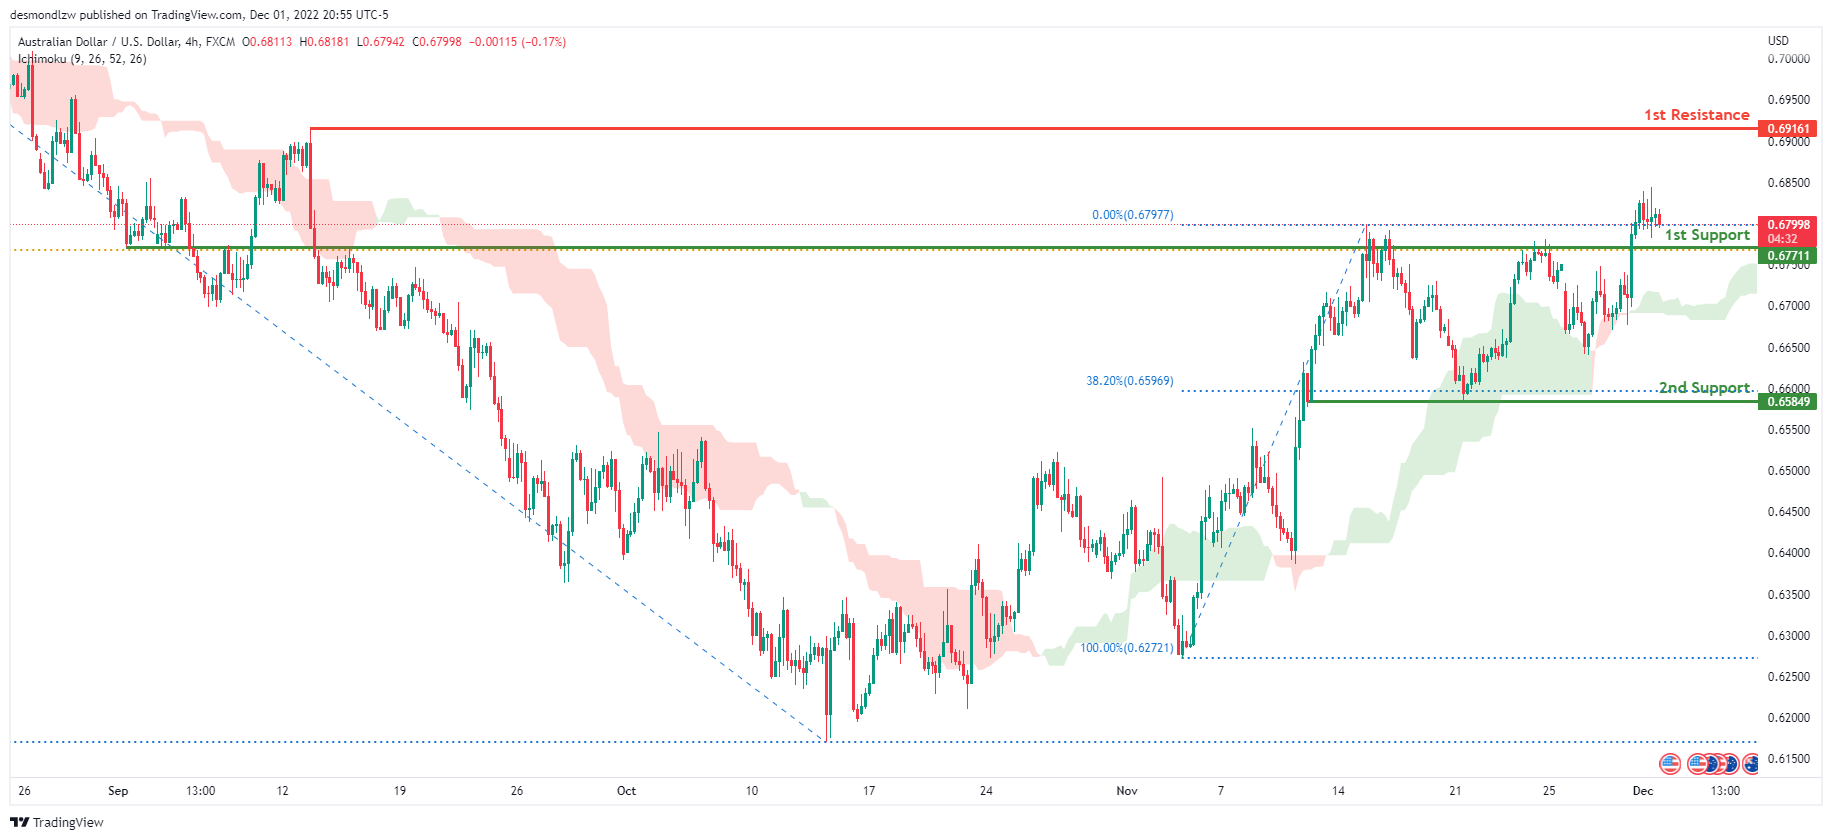
Looking at the H4 chart, my overall bias for ADUSD is bullish due to the current price being above the Ichimoku cloud, indicating a bullish market. Expecting price to continue heading towards the 1st resistance at 0.69161, where the previous swing high is. In an alternative scenario, price could possibly head back down to retest the 1st support line at 0.67711 where the 61.8% Fibonacci line is.
Areas of consideration
- H4, 1st resistance at 0.69161
- H4, 1st support at 0.67711
NZD/USD:
Looking at the H4 chart, my overall bias for NZDUSD is bullish due to the current price being above the Ichimoku cloud, indicating a bullish market.
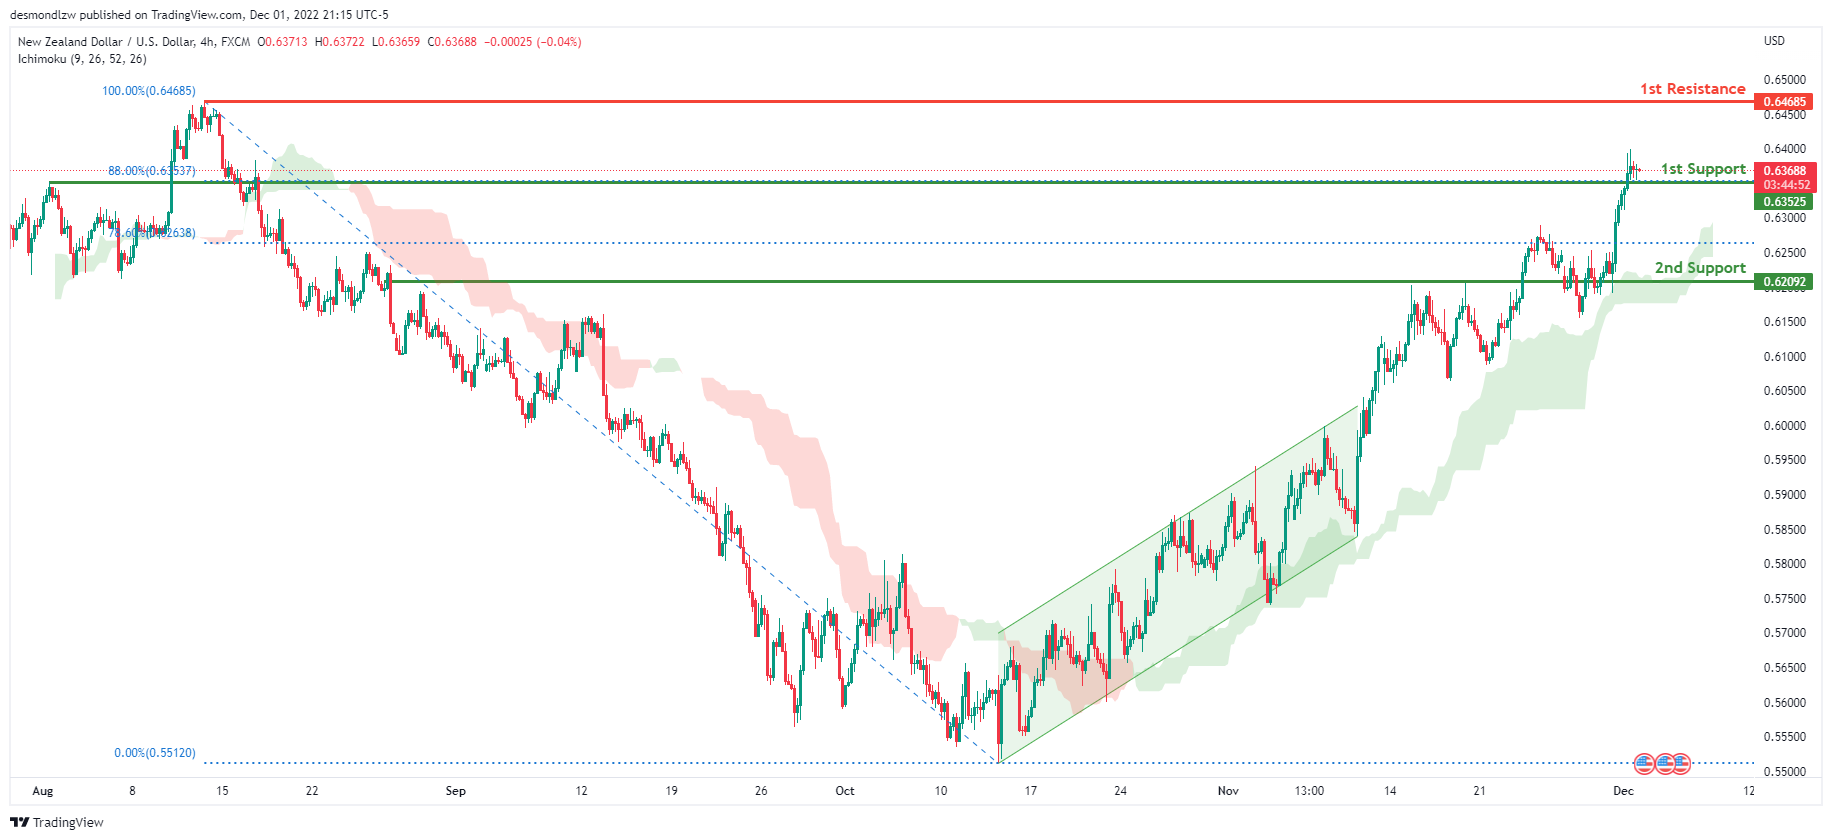
To add confluence to this bias, price has broken out of the ascending channel. If this bullish momentum continues, expect the price to head towards the 1st resistance line at 0.64685 where the previous swing high is. Alternatively, the price may head back down and break the 1st support at 0.63525, where the 88% Fibonacci line is, before heading towards the 2nd support at 0.62092, where the previous high is.
Areas of consideration:
- H4 time frame, 1st resistance at 0.64685
- H4 time frame, 1st support at 0.63525
- H4 time frame, 2nd support at 0.62092
USD/CAD:
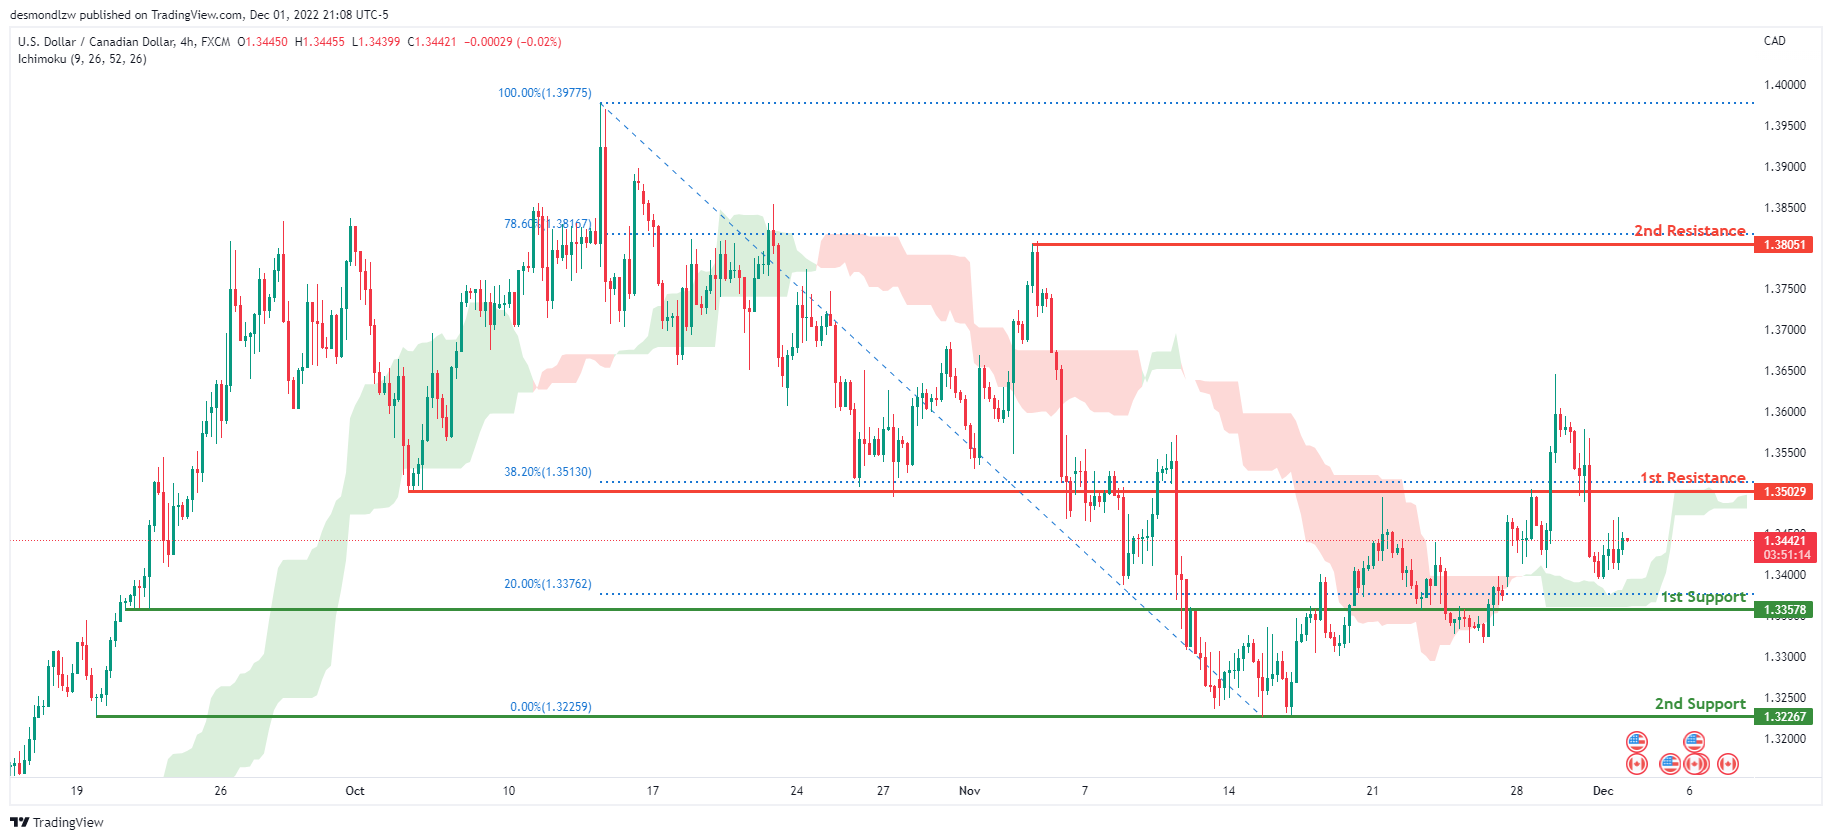
On the H4 chart, the overall bias for USDCAD is bullish. To add confluence to this, the price is above the Ichimoku cloud which indicates a bullish market. If this bullish momentum continues, expect the price to continue heading towards the 1st resistance at 1.35029, where the 38.2% Fibonacci line is. In an alternative scenario, price could head back down to retest the 1st support at 1.33578, where the 20% Fibonacci line is.
Areas of consideration:
- H4 time frame, 1st resistance at 1.35029
- H4 time frame, 1st support at 1.33578
OIL:
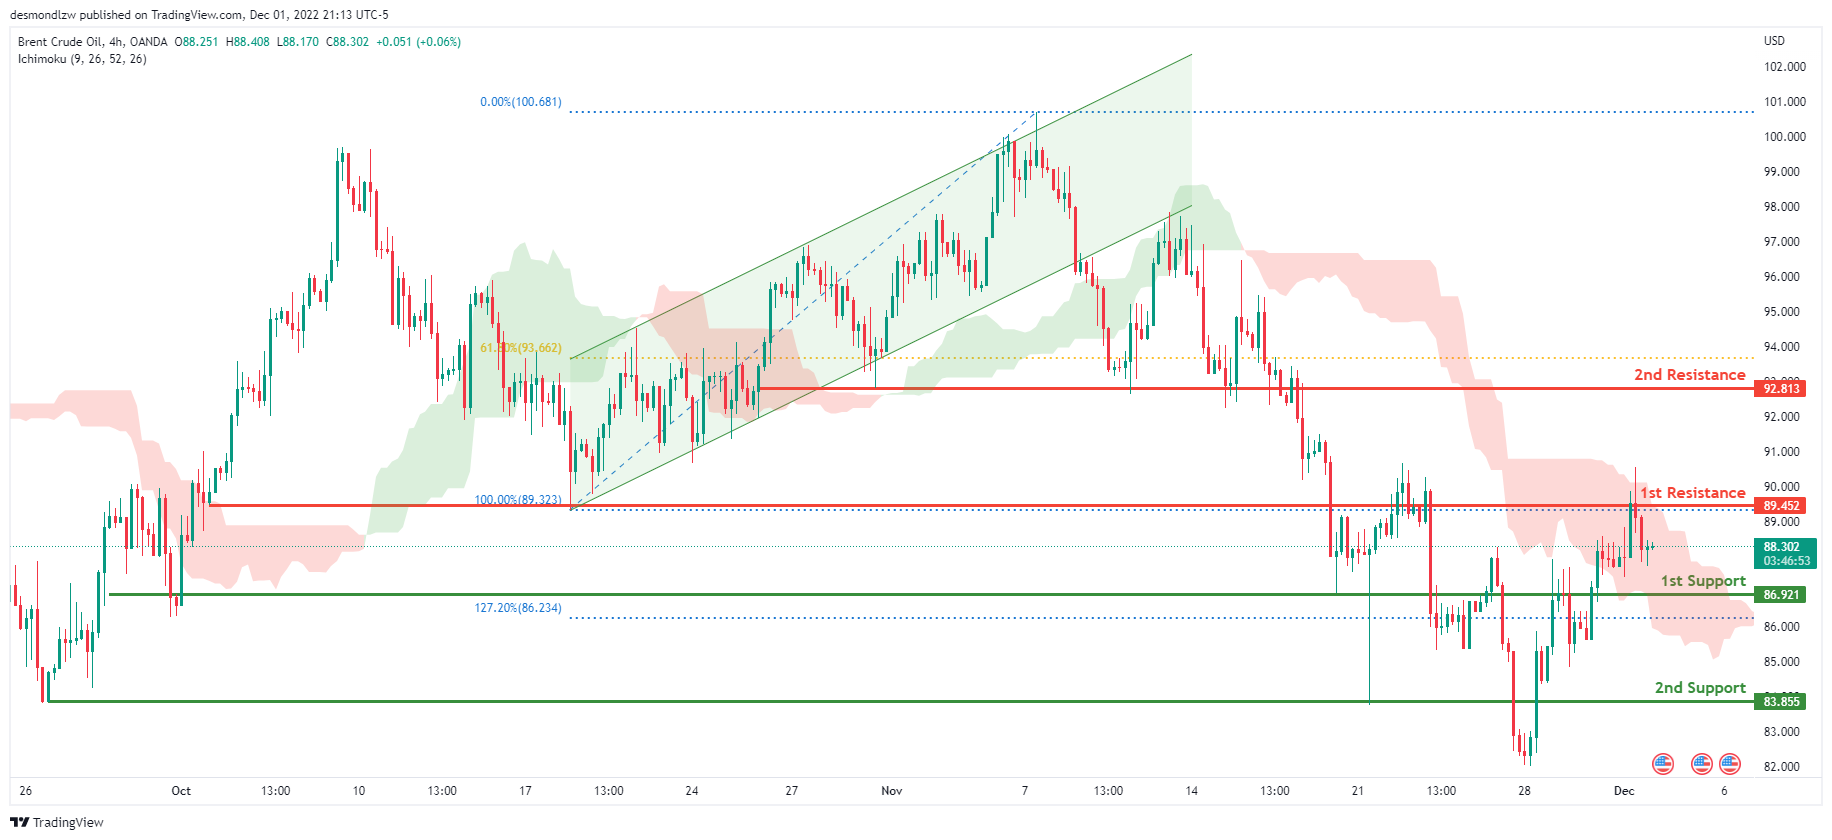
Looking at the H4 chart, my overall bias for BCOUSD is bearish due to the current price being below the Ichimoku cloud, indicating a bearish market. If this bearish momentum continues, expect price to possibly break the 1st support at 86.921, where the 127.2% Fibonacci extension line is located. In an alternate scenario, price could possibly head up towards the 1st resistance line at 89.452, where the previous swing low is.
Areas of consideration:
- H4 time frame, 1st resistance at 89.452
- H4 time frame, 1st support at 86.921
Dow Jones Industrial Average:
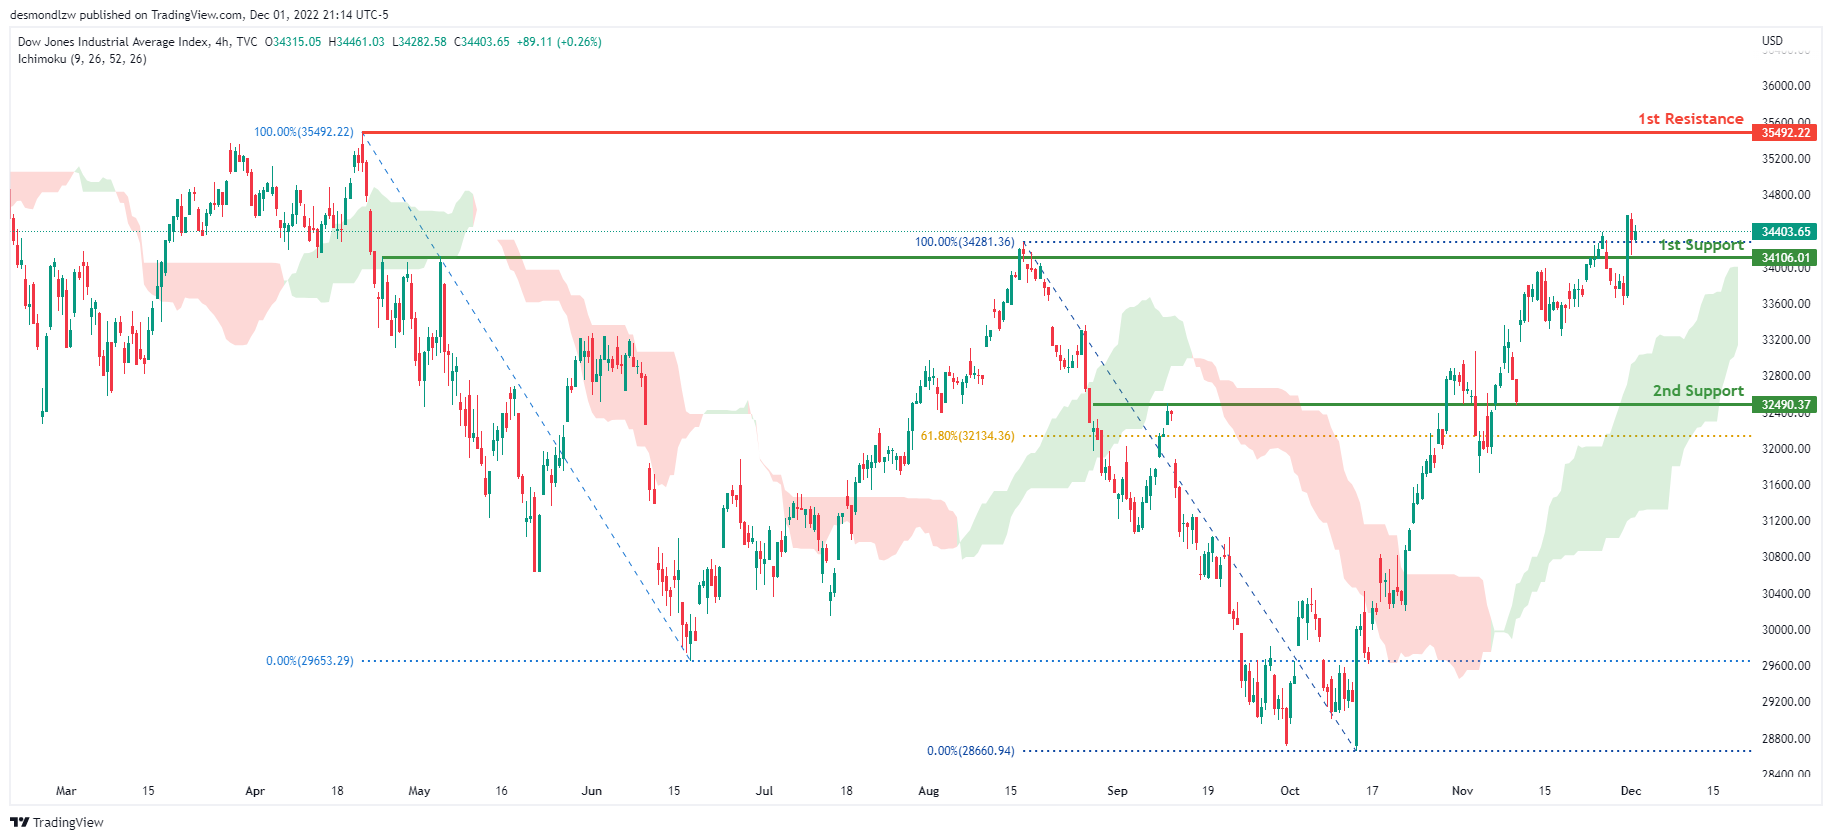
On the H4 chart, the overall bias for DJI is bullish. To add confluence to this, the price is above the Ichimoku cloud which indicates a bullish market. If this bullish momentum continues, expect the price to continue heading towards the 1st resistance line at 35492.22, where the previous swing high is. In an alternative scenario, price could head back down breaking the 1st support line at 34106.01, where the previous swing high is before heading towards the 2nd support at 32490.37, where the 61.8% Fibonacci line is.
Areas of consideration:
- H4 time frame, 1st support at 34106.01
- H4 time frame, 2nd support at 32490.37
- H4 time frame, 1st Resistance at 35492.22
DAX:
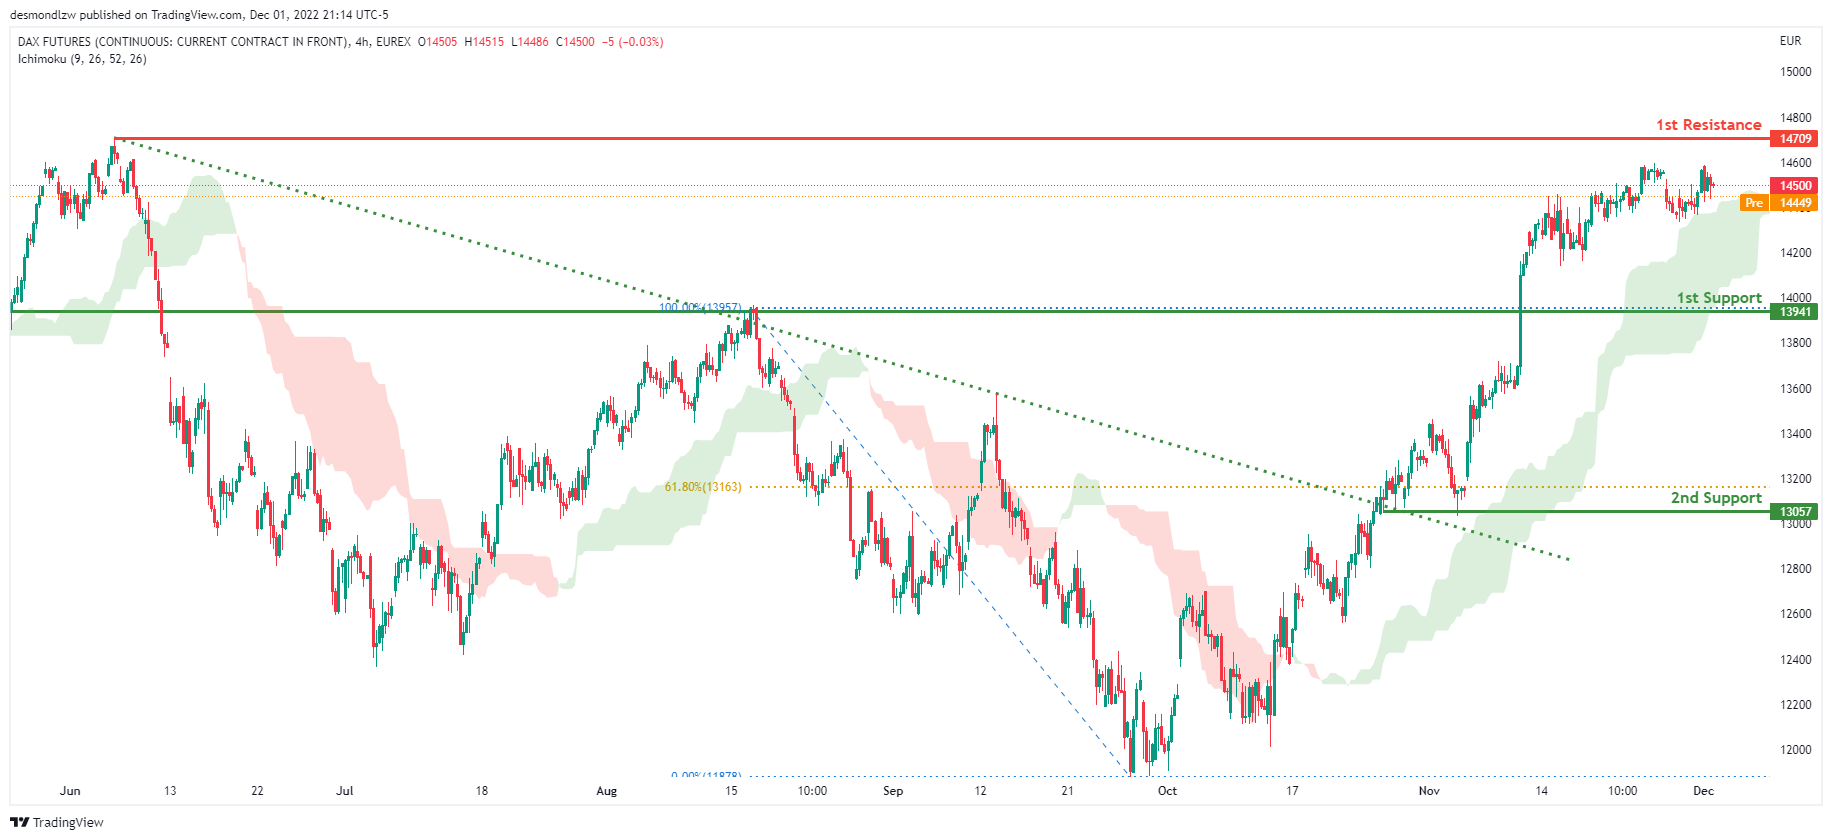
The H4 chart shows a bullish bias, with price breaking through the descending trendline and rising above the Ichimoku cloud. Price is expected to maintain its bullish momentum and rise to the first resistance level at 14709, where the previous swing high is located. Alternatively, the price could fall to the first support level at 13941, where the previous swing high was.
Areas of consideration:
- H4 time frame, 1st resistance is at 14709
- H4 time frame, 1st support is at 13941
ETHUSD:
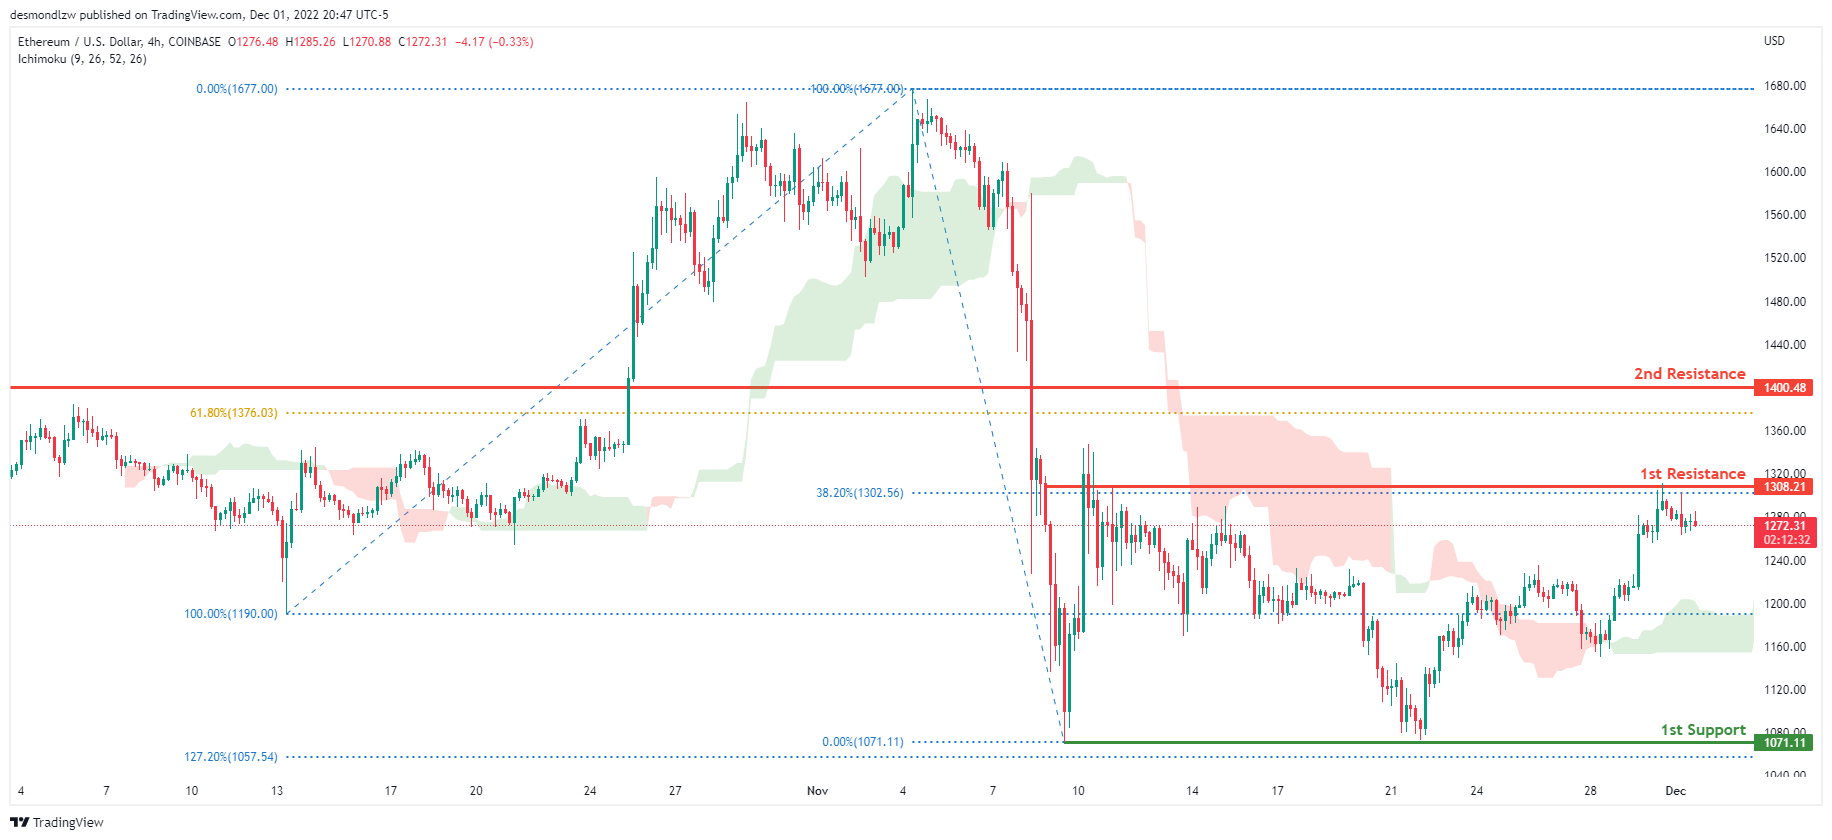
On the H4 chart, the overall bias for ETHUSD is bearish. However, the price is now above the Ichimoku cloud which might indicate a short-term shift to a bullish market. Expecting price to possibly break the 1st resistance at 1308.21, where the 38.2% Fibonacci line is before heading towards the 2nd resistance line at 1400.48, where the 61.8% Fibonacci line is. In an alternative scenario, price could possibly head back down towards the 1st support at 1071.11, where the previous swing low is.
Areas of consideration:
- H4 time frame, 1st resistance of 1308.21
- H4 time frame, 2nd resistance of 1400.48
- H4 time frame, 1st support at 1071.11
BTCUSD:
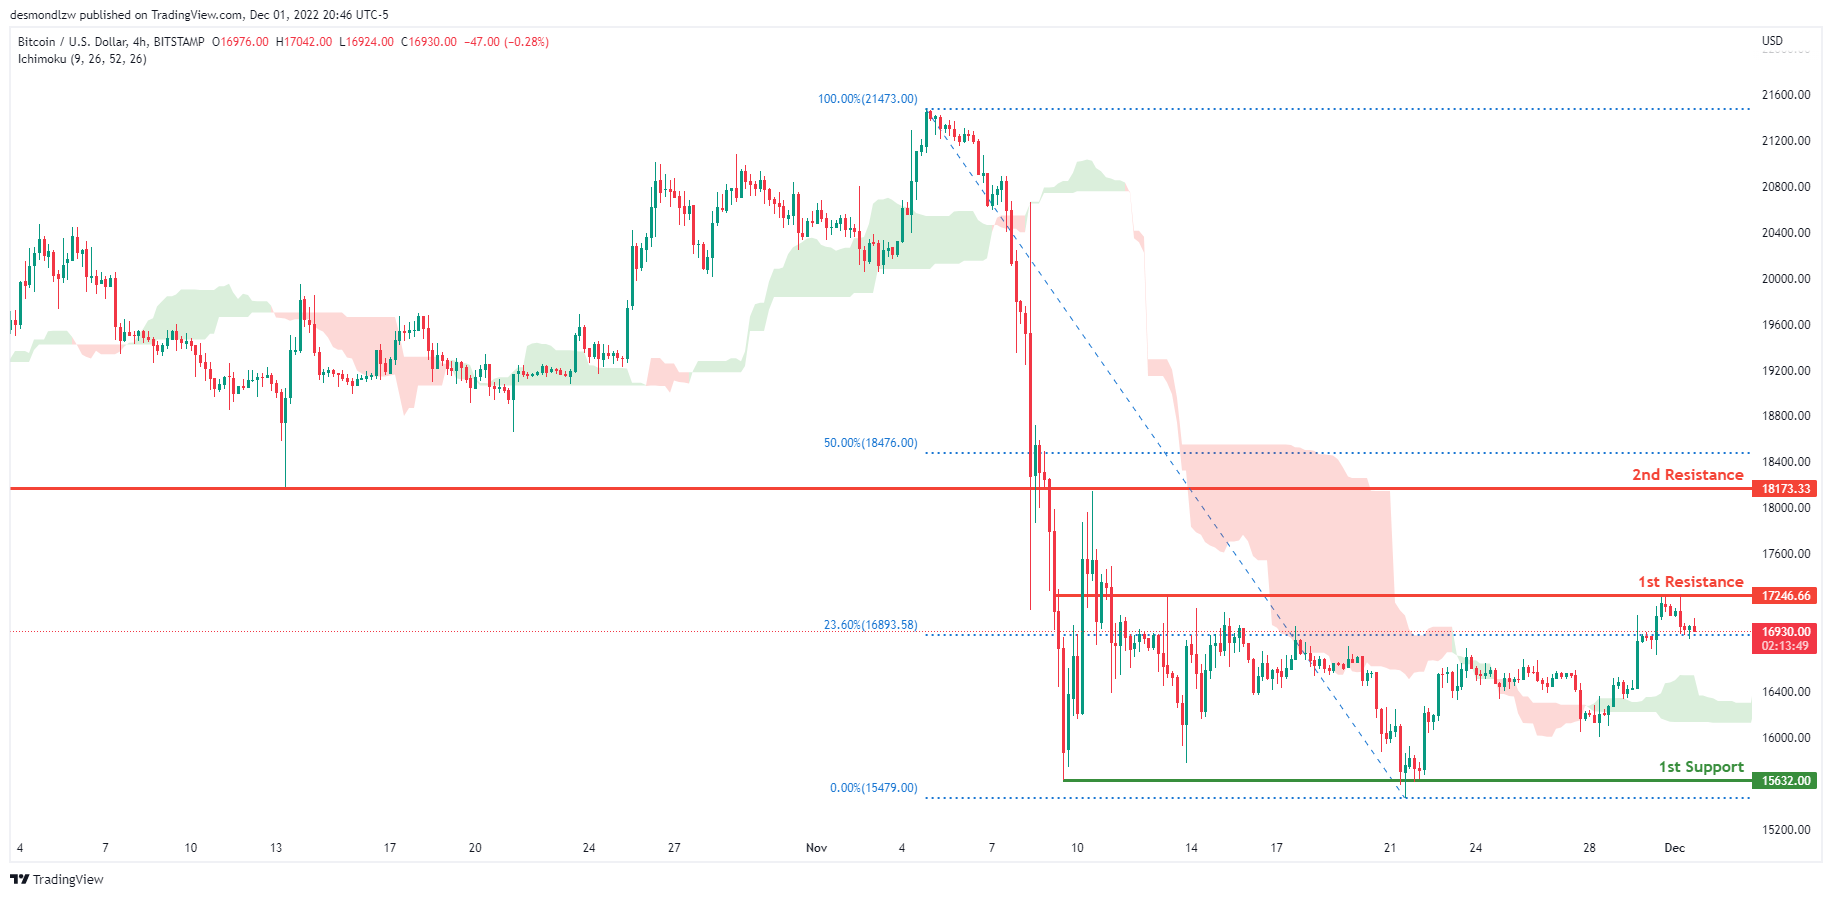
On the H4 chart, the overall bias for BTCUSD is bearish. However, the price is now above the Ichimoku cloud which might indicate a short-term shift to a bullish market. Expecting price to possibly break the 1st resistance at 17246.66, where the 23.6% Fibonacci line is before heading towards the 2nd resistance line at 18173.33, where the previous swing low is and 50% Fibonacci line are. In an alternative scenario, price could possibly head back down towards the 1st support at 15632.00, where the previous swing low is.
Areas of consideration:
- H4 time frame, 1st resistance 17246.66
- H4 time frame, 2nd resistance 18173.33
- H4 time frame, 1st support at 15632.00
S&P 500:
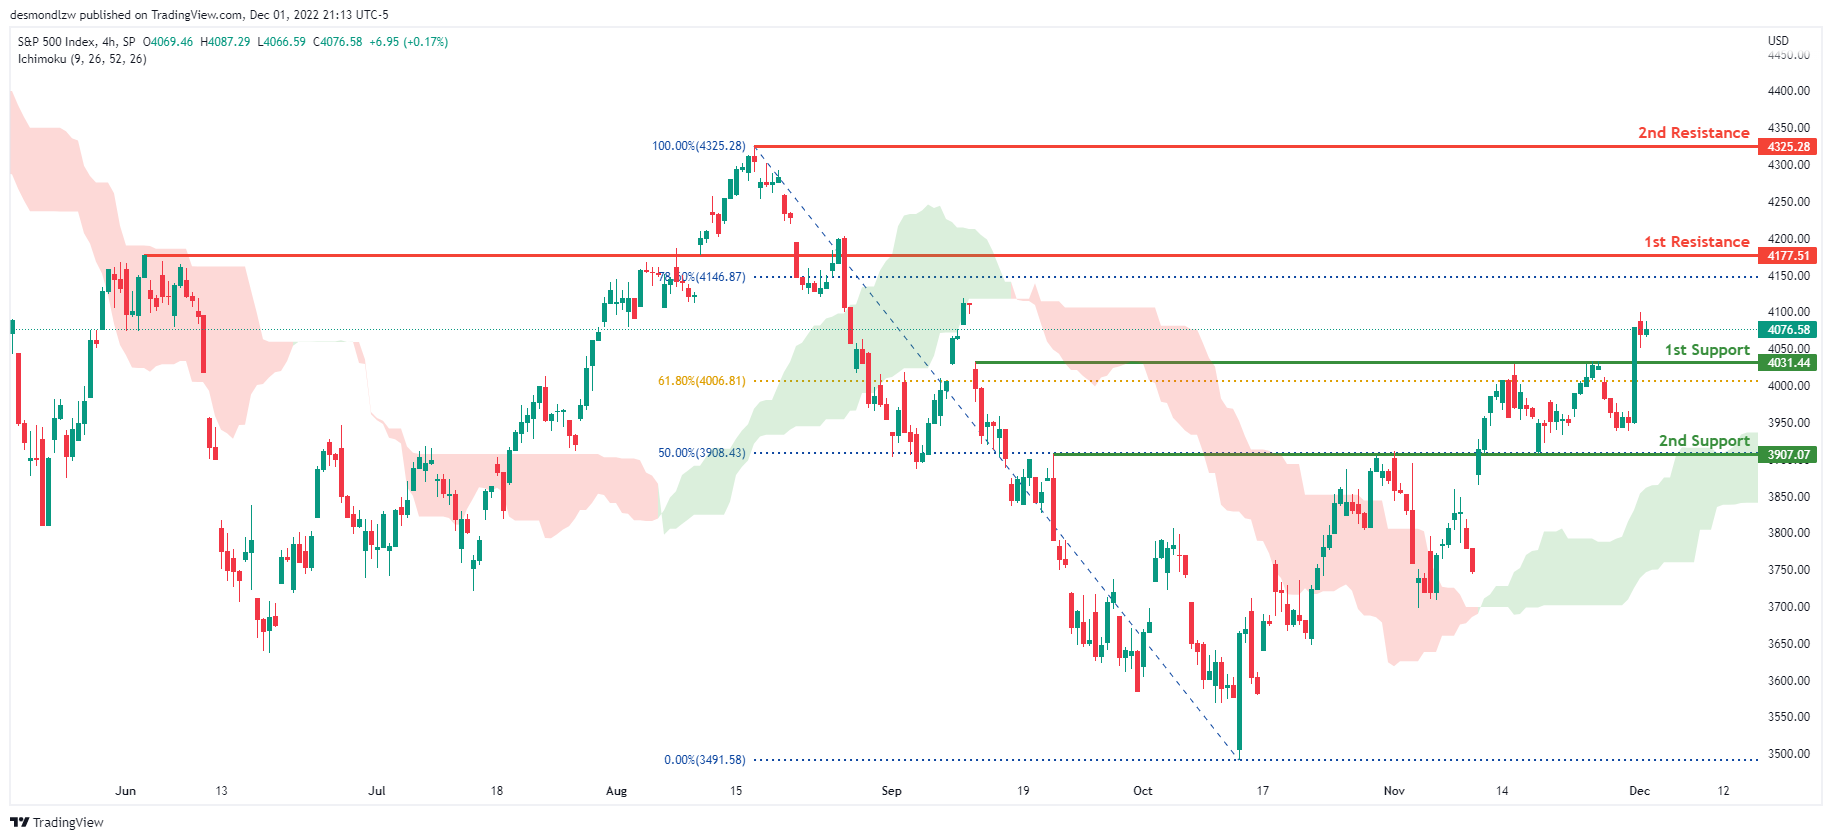
The overall bias for the S&500 on the H4 chart is bullish, with prices above the Ichimoku cloud. If the bullish momentum continues, the expected price to head towards the 1st resistance line is at 4177.51, which is the 78.6% Fibonacci line. In an alternate scenario, price could return to the 1st support line at 4031.44, where the 61.8% Fibonacci line is located.
Areas of consideration:
- H4 time frame, 1st support at 4031.44
- H4 time frame, 1st resistance at 4177.51
BoJ Tamura called for review of monetary framework
BoJ board member Naoki Tamura told Asahi daily that a review of monetary framework should be conducted by the central bank. Such review could come "soon or at a somewhat later date". "Whether the BOJ needs to tweak its monetary policy will depend on the outcome of the review," he said.
Tamura also noted there was scope to review the feasibility of the 2% target, and consider it as a more flexible goal. "As long as the economy is achieving a virtuous cycle, I think it's okay even if inflation is at, say 1.8%" instead of 2%," he noted.
Fed Williams: Slowing rate hike is just stepping down one step
New York Fed President John Williams said yesterday in an interview that slowing the pace of rate hikes in December would simply mean "stepping down one step" in the effort to curb inflation.
"I still think we have a ways to go in terms of where the fed funds target is and where we need to get it to next year in order to get the sufficiently restrictive stance," he said.
"Inflation, first of all, is the number one problem we're facing in terms of monetary policy. It is far too high," Williams said. And, bring inflation back to 2% target will "take a good couple of years".
But he added: "I expect to see a pretty significant decline in inflation next year as supply chain issues improve, as we see the slowing economy, the economy getting into better balance."
Cliff Notes: Costs Heap Pressure on the Consumer and Business
Key insights from the week that was.
Updates on the consumer, housing and investment kept Australian market participants busy this week. While new information for the US argued for greater caution from policy makers.
Domestically, the week began with a sour update on the Australian consumer, October’s retail sales printing its first negative result of the year at -0.2%. The limited detail showed the weakness was broadly-based, with declines in nominal spending across almost all store-types and states. That retail prices are rising at a pace of 2%qtr suggests the underlying decline in real spending volumes this month was much larger than the nominal headline figure, likely in the -0.5% to -1.0% range. Rising interest rates are clearly beginning to impact retail spending, and with the RBA expected to tighten policy into early-2023, the pressure on consumer demand will build in the period ahead.
Developments on housing were also downbeat. CoreLogic’s home price index, covering the eight major capital cities, fell by another 1.1% in November. Price declines remain broadly-based across the major eastern states, with most segments by price tier, region and type of dwelling continuing to move lower. That dwelling approvals tumbled another 6.0% lower in October provided additional perspective on the scale of housing’s downturn, with private detached houses and private sector units respectively down -2.2% and -11.3%. Given the extensive set of headwinds facing the construction sector and broader housing market, further significant declines are expected ahead, hitting GDP as well as the demand for housing credit.
Lastly for the consumer, some evidence of a deceleration in inflation was seen in October. The ABS’ new monthly CPI came in at 0.2% against our expectation for a 0.6% rise, with food, housing, auto fuel and holiday travel all materially weaker than anticipated. Note though that key components of the CPI are not sampled every month; as an example, electricity costs are assessed in the end month of the quarter. Moreover, the October release would not have captured the impact of that month’s flooding. Still, the October release points to the circa 8%yr pace we have forecast for Q4 being the peak for this cycle.
In the lead-up to next week’s Q3 GDP report, the ABS also released two partial indicators of investment.
Construction work done staged a rebound in Q3 as expected, rising 2.2% to reverse Q2’s -2.0% (initially -3.8%). The ABS however noted that this outcome should be regarded as a preliminary estimate with a below-average 70% response rate to the survey. The gains for construction were broad based in the quarter. Though housing’s 1.3% increase came despite a 5.0% decline in renovations, and the overall level of construction remains 0.5% below mid-2021. Supply delays, difficulties in sourcing labour and inclement weather continue to limit the sector’s ability to work through its project pipeline. Higher costs are also a consequence, up 2.8% in Q3 and 10.8% versus a year ago – the most rapid pace of cost escalation since 1989.
CAPEX spending subsequently disappointed, falling 0.6% owing to a dip in mining sector activity (-5.1% versus +1.4% for non-mining) which is likely to prove temporary given investment in the sector rose 11% over the 12 months to June 2022 and as expectations remain constructive. For mining, the update on 2022/23 investment intentions points to a 11% increase in spending; meanwhile, a near-17% gain is projected for non-mining, resulting in a 15% forecast for investment growth overall. Clearly businesses are responding to tight capacity and rising demand, though tax incentives and rapid price growth are also buoying these nominal estimates. With the economy set to slow dramatically in 2023 and remain below-trend in 2024, we are likely to see increased caution come 2023/24.
Following the downside surprise for retail sales, renovation work and equipment investment, we have revised down our forecast for Q3 GDP from 1.1% to 0.8%.
Over in the US this week, both the data and tone of central bank speak pointed to a need for caution over the outlook. Ahead of tonight’s nonfarm payrolls release, November’s 127k rise in ADP private payrolls was well below expectations at close to half October’s gain. For October, the JOLTS survey also pointed a loss of momentum for employment, with job openings and the hiring rate both falling. In our view, annual growth in both indicators is now below average, signalling a trend deceleration in net job creation and, likely, wage growth. Quantitative and qualitative views on business activity also deteriorated in November. Most notably, the ISM manufacturing index followed the S&P Global measure and fell to a contractionary reading of 49.0, signalling that big manufacturers at the core of the US economy are now also coming under pressure. More broadly, the latest Beige Book from the Federal Reserve pointed to stagnation across the economy, with growth assessed to only be “flat or up slightly”.
Given these outcomes, it is not surprising that FOMC Chair Powell, while still determined to defeat the threat of inflation, was a little more circumspect on the outlook this week, making clear that the FOMC planned to downshift their pace of tightening at the December meeting, from 75bps to 50bps. Helpfully, in the speech and Q&A, Chair Powell provided some benchmarks for employment growth and wage inflation, referring to 100k in monthly job gains as the pace required to match population growth – with any outcome lower than this level increasing slack in the labour market – and a need for wages growth to be 1.5-2.0ppts below its recent pace to be consistent with inflation returning to the 2.0%yr target in the medium-term.
The ADP and business surveys point to employment growth decelerating to or below the 100k level very soon; while wages growth also looks to be converging to the 3.5-4.0%yr range that the FOMC is arguably looking for, with annualised ECI private sector compensation growth in Q3 around 4.5% compared to 6.0% in Q2 and hourly earnings growth having averaged 0.3% per month the past 3 months – a sub-4.0% annual pace. If labour market momentum does slow as these partials suggest, the FOMC would be justified in halting the hiking cycle at 4.625% in February. However, if more momentum is seen in nonfarm payrolls and/or financial conditions ease quickly, the FOMC may look to continue slowly tightening towards mid-2023 to make sure inflation risks are guarded against.
Finally to China. The path out of COVID-zero remained in focus this week with new cases near record highs. Giving the market confidence, the actions of the Government were deliberate and controlled, with health authorities announcing a drive to increase the vaccination rate amongst the elderly, and Beijing allowing some of its residents to isolate at home. Current restrictions in cities with high caseloads were also narrowed, highlighting the intent of both central and local authorities to progressively free the domestic economy from the constraints of COVID-zero. Uncertainty will remain for some time, but both consumer activity and sentiment should see a material lift during the first half of 2023.
When assessing the outlook for China, it is also important to recognise the drive they are undertaking to revolutionise their power grid with renewable power, benefitting industry through improved access to power and by minimising cost pressures. The scaling up of renewable power is also allowing for the rapid take-up of electric vehicles, aiding both economic activity and their environment. Furthermore, leading in the green transition is giving Chinese industry a strong incentive to scale up their production of finished goods and parts required for society’s electrification, with potential markets spanning the globe. However, with regards to export opportunities, we must also remain cognisant of the threat of geopolitics.
USD/JPY Tumbles Below 138, US NFP Report Next
Key Highlights
- USD/JPY declined sharply and traded below the 138.00 support.
- A crucial bearish trend line is forming with resistance near 137.80 on the 4-hours chart.
- EUR/USD and GBP/USD gained bullish momentum and traded to new multi-week highs.
- The US nonfarm payrolls could increase 200K in Nov 2022, down from 251K.
USD/JPY Technical Analysis
The US Dollar faced a strong selling interest from the 140.00 zone against the Japanese Yen. USD/JPY started a sharp decline and traded below the 138.00 support.
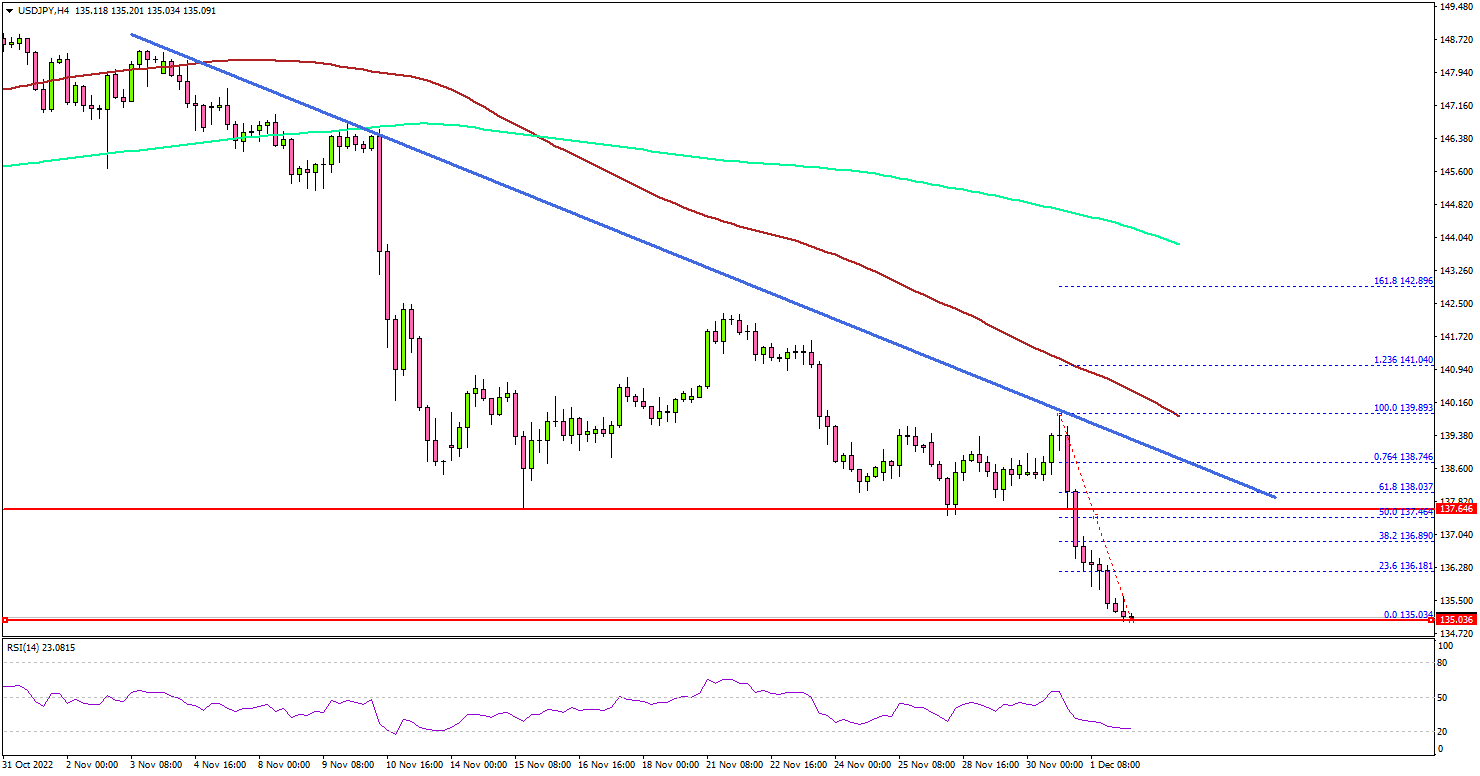
Looking at the 4-hours chart, the pair settled below the 138.00 zone, the 100 simple moving average (red, 4-hours), and the 200 simple moving average (green, 4-hours).
The decline gained pace below the 136.50 level and the pair even spiked below 136.00. The pair is showing bearish signs and remains at a risk of more losses below the 135.20 level. An initial support is near the 135.00 level.
The next major support is near the 134.00 zone. Any more losses might send the pair towards the 132.50 support zone.
On the upside, the pair is facing resistance near the 137.50. The next major resistance may perhaps be near 137.80. There is also a crucial bearish trend line forming with resistance near 137.80 on the same chart.
A clear move above the trend line resistance and then 138.00 might start a decent increase. In the stated case, USD/JPY may perhaps test 138.80. Any more gains could set the pace for a move towards the 140.00 resistance zone.
Looking at EUR/USD, the pair started a fresh increase and was able to clear the 1.0450 resistance zone. Similarly, GBP/USD gained pace and surpassed the 1.2150 resistance.
Economic Releases
- US nonfarm payrolls for Nov 2022 – Forecast 200K, versus 251K previous.
- US Unemployment Rate for Nov 2022 - Forecast 3.7%, versus 3.7% previous.
- Canada’s employment Change payrolls for Nov 2022 – Forecast 5K, versus 108.3K previous.
- Canada’s Unemployment Rate for Nov 2022 - Forecast 5.3%, versus 5.2% previous.
US NFP and How the Market Could React
Tomorrow has the all-important release of US labor market numbers. But the Fed's Powell kind of already robbed the thunder from the release during his speech at the Brookings Institute yesterday. He basically implied that the Fed would start slowing down its tightening at the next meeting. Naturally the market jumped and the dollar weakened in response. Now the question is whether there will be follow-through on the optimism with the jobs numbers.
November's NFP is expected to come in lighter compared to the prior month, but it should be noted that the data has been markedly outperforming expectations lately. Taken in context of the latest BLS report showing that the labor market remained tight, the consensus for what to expect out of NFP has drifted up, slightly. A week ago, analysts were forecasting 200K jobs added, but that has now moved up to 210K jobs, compared to 261K in October.
The trends remain favorable
Prior to covid, a 210K jobs report would be considered relatively good. But referring back to the BLS report that came out yesterday, there are some worrying signs. As mentioned, in October there were 261K jobs created, but 353K jobs went off the market. Meaning that companies are closing down job offers faster than people are being hired. The largest drop in job offers occurred in state and local governments, followed by manufacturing. Combined, that represented the bulk of the reduction in job openings.
For now, the market remains tight, mostly because the extraordinarily large gap between job openings and jobseekers that occurred from the pandemic is still there. There were 6.1 million people looking for work last month, but there were 10.3 million jobs for them. Despite this mismatch, wages have failed to keep up with inflation. Current expectations are that average hourly earnings will slow to 0.3% from 0.4% reported in October.
Putting the pieces together
The Fed's main worry though this cycle has been that higher inflation combined with an extremely tight labor market would lead to a wage-price spiral. However, that hasn't happened, giving the Fed plenty of space to raise rates to combat inflation. Recently, inflation has been starting to come down, from a combination of higher borrowing costs and worries about an impending recession.
The prolonged loss of purchasing power among American workers as their salaries fail to keep up with prices would be expected to lead to demand destruction. Which would also contribute to reducing inflation, as Americans see their pocketbooks being pinched and refuse to pay higher prices. As retailers across the country report rising inventories and some are suspending buying new inventory for the start of next year, the natural expectation is that the economy will slow down. Which in turn also contributes to lower inflation.
The unemployment rate is expected to remain steady at 3.7%, and so is the participation rate. This is reflected in the BLS data showing the number of people quitting to find better pay far outweighed the number of people being fired.