Sample Category Title
USD/CAD Drifting ahead of Job Reports
The Canadian dollar continues to show limited movement. In the European session, USD/CAD is almost unchanged at 1.3433. We are likely to see stronger movement in the North American session, as both the US and Canada release the November employment reports.
US nonfarm payrolls expected to soften
Today’s highlight is the US nonfarm employment report, with a consensus of 200,000 for November. This follows a 261,000 gain in October. The US employment market has been surprisingly resilient, considering the sharp rise in interest rates. The employment market has recently started to cool off, but unless today’s NFP release significantly underperforms, it won’t change the Fed’s view that it is still too early to tell if inflation is on its way down.
Canada’s economy showed a massive gain in jobs in October, with 108,300. This was ten times the estimate of 10,000. November is expected to show a small gain of 5,000, with the employment rate projected to tick higher to 5.3%, up from 5.2%. Canada’s economy is generally performing well, and today’s employment report is the final key release prior to the Bank of Canada’s rate meeting on December 7th. The Bank of Canada has been aggressive in its tightening, in order to curb inflation which is running at a 6.9% clip. Like the Fed, the BoC is looking for signs that inflation has peaked, but until then we can expect oversize rate hikes to continue, with a 50-bp hike likely next week.
Jerome Powell’s speech on Wednesday sent the US dollar sharply lower, as Powell’s comments were not as hawkish as feared. Powell said that more evidence was needed to show that inflation was falling, and reiterated that rates would likely rise higher than the Fed has projected in September. Still, investors chose to focus on Powell’s broad hint that the Fed would ease the pace of rates next week with a 50-bp move, after four straight hikes of 75 bp.
USD/CAD Technical
- USD/CAD has support at 1.3398 and 1.3300
- There is resistance at 1.3478 and 1.3576
AUD/USD: Will Bears Have Enough Strength to Send the Pair to a Minimum of 0.617?
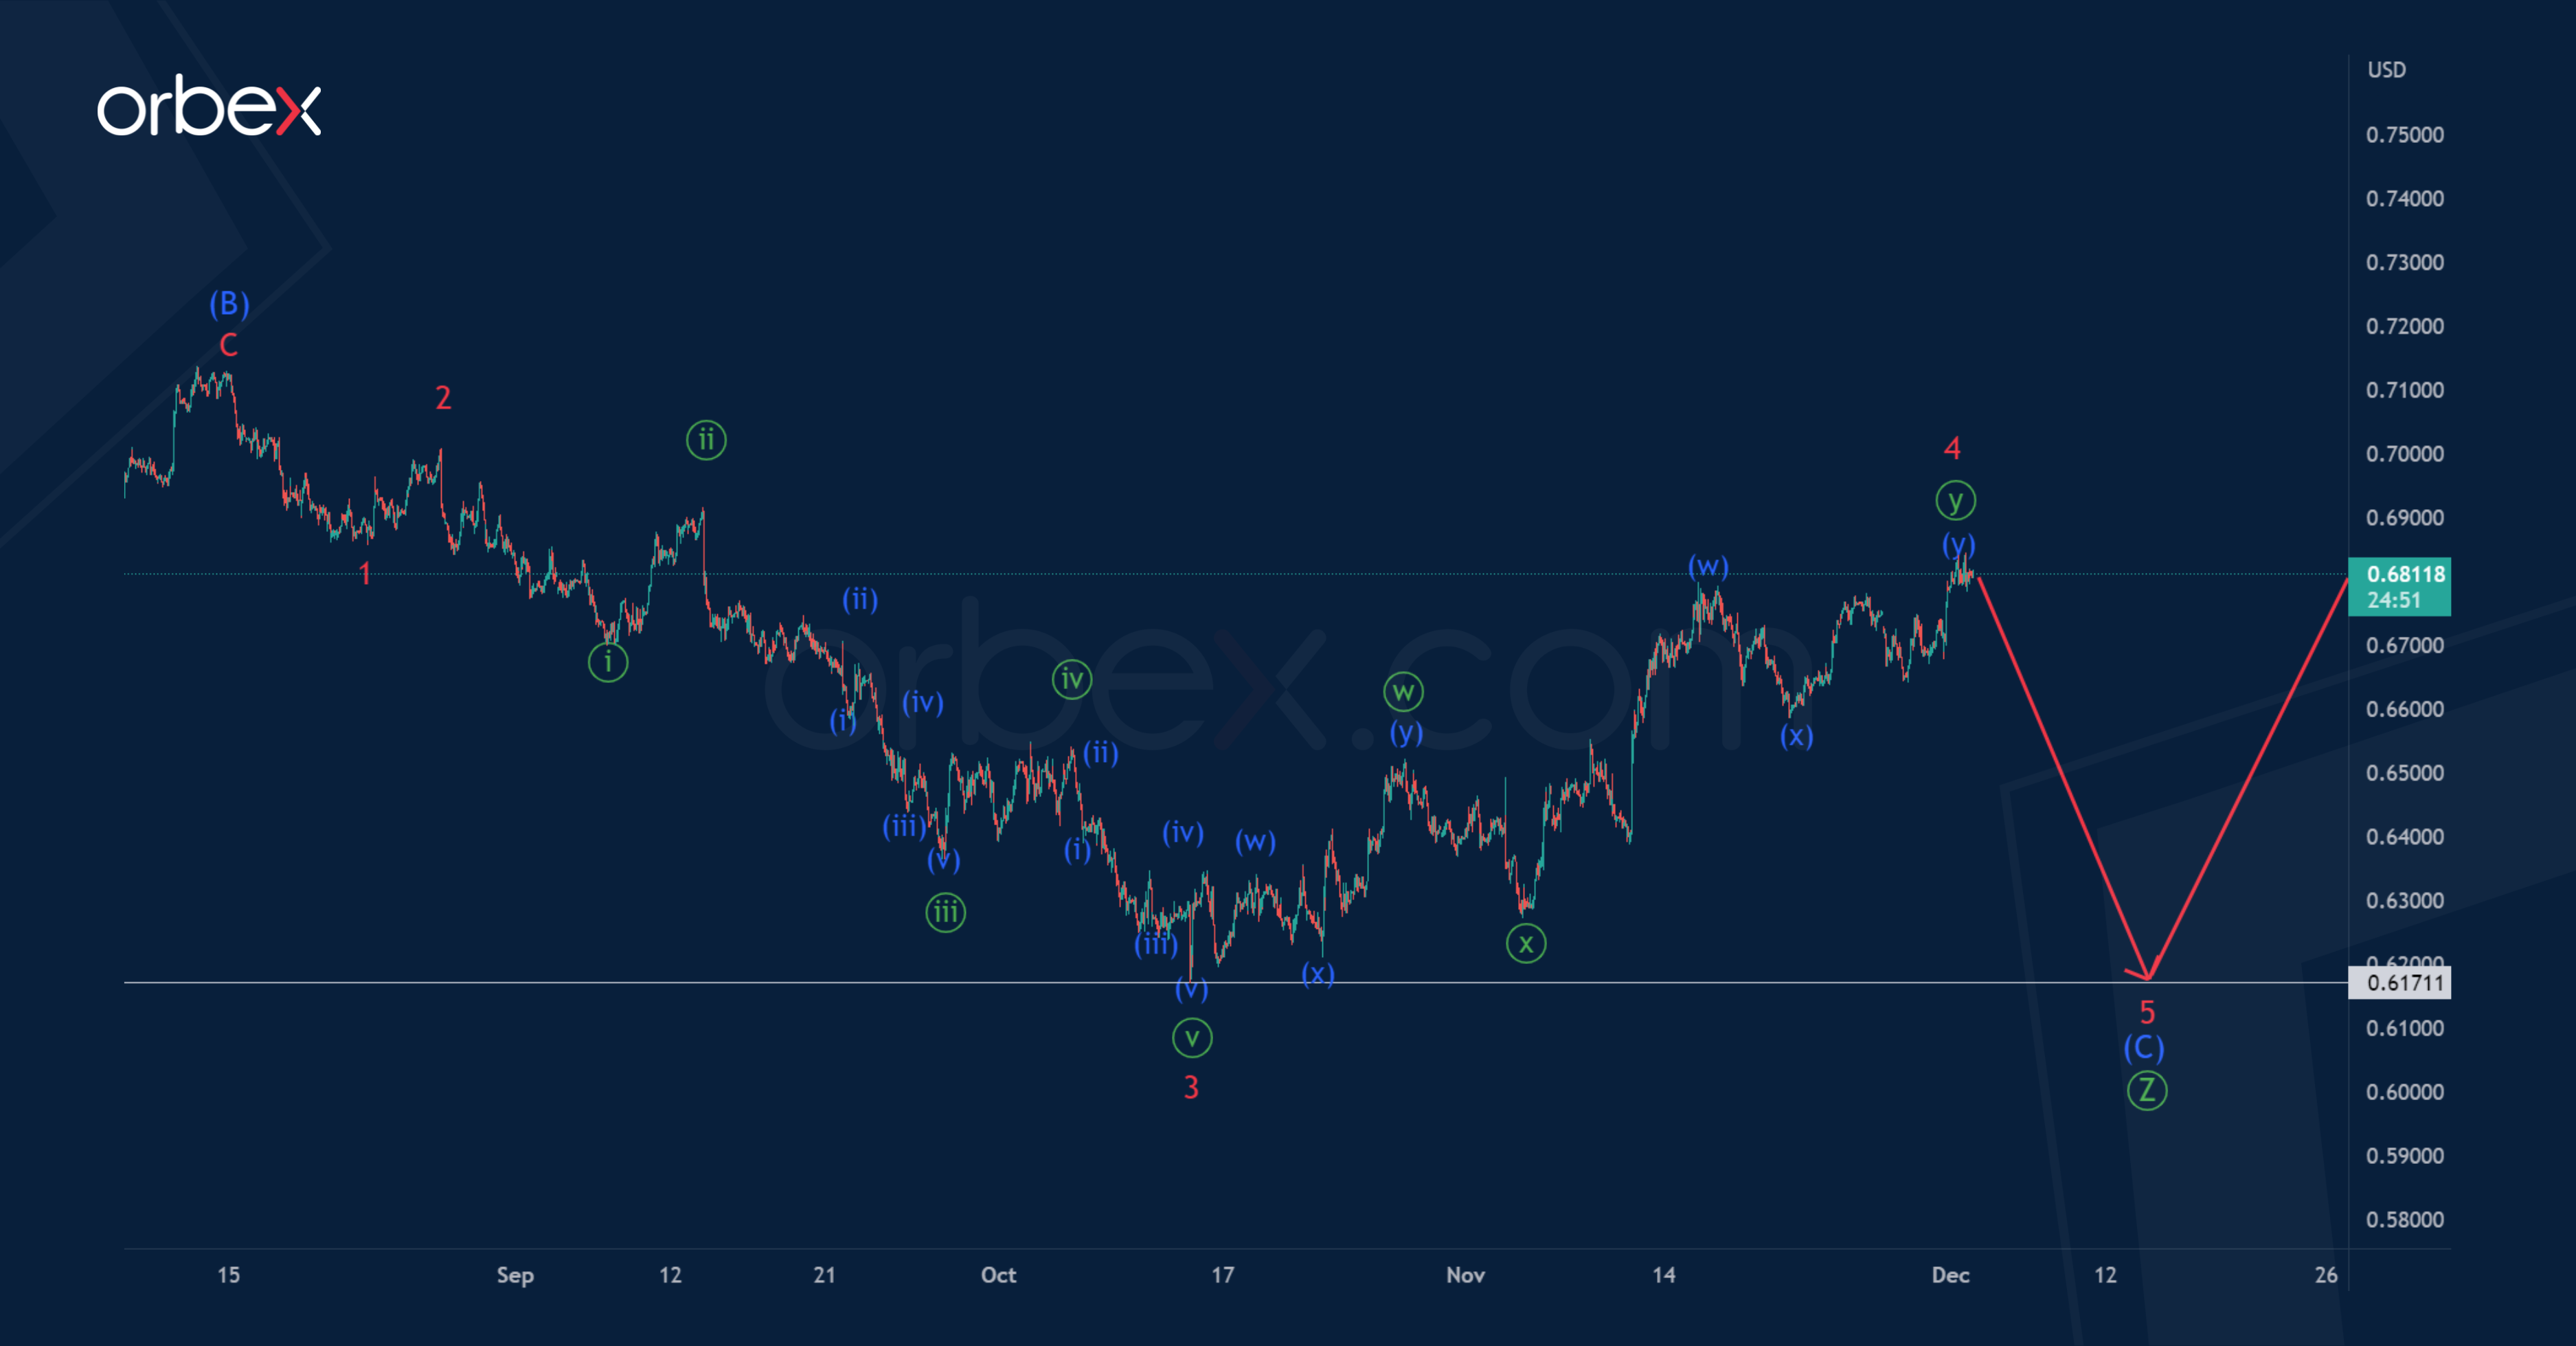
It is likely that the AUDUSD pair will form a bearish triple zigzag Ⓦ-Ⓧ-Ⓨ-Ⓧ-Ⓩ in the long term, where the primary wave Ⓩ is a simple zigzag (A)-(B)-(C). The intermediate wave (B) of this zigzag took the form of a simple bullish zigzag A-B-C.
At the moment, an impulse wave (C) is being formed, which consists of minor sub-waves 1-2-3-4-5. Minor wave 3 consists of five sub-waves of the minute degree.
Most likely, the development of the minor corrective wave 4 in the form of a minute double zigzag was completed not so long ago. Thus, the market may continue to move down in the impulse wave 5.
The currency is expected to decline to the previous low of 0.617, marked by the impulse 3.
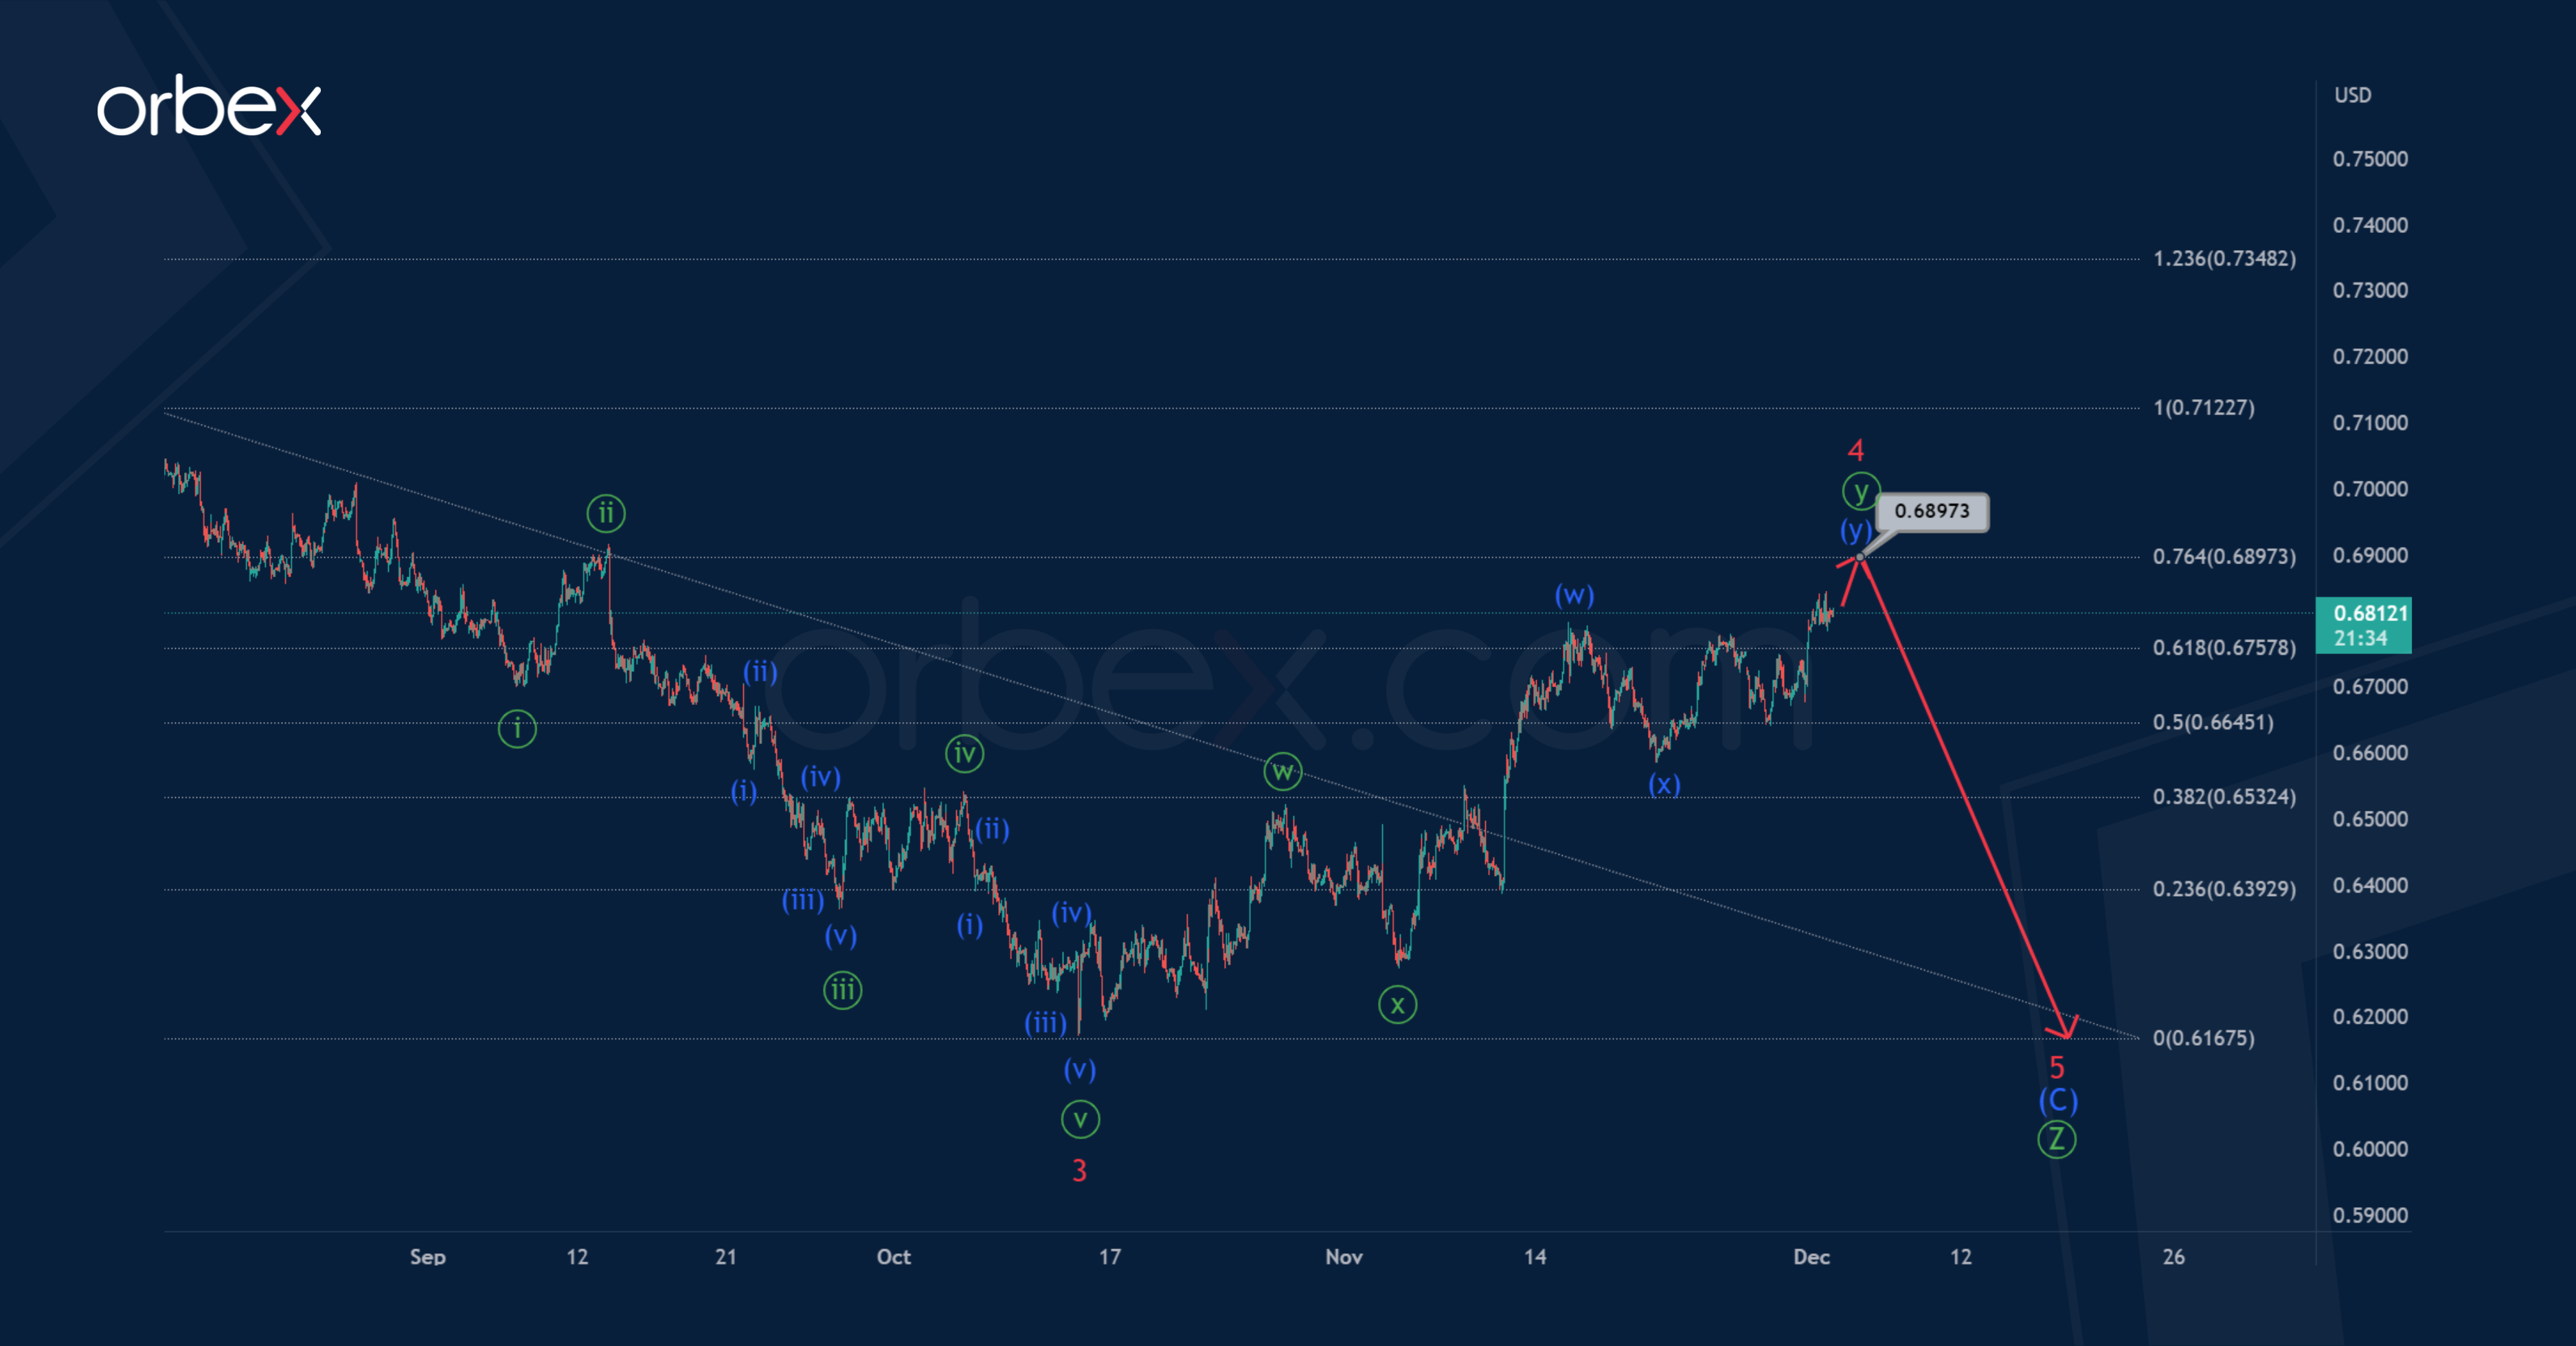
However, corrective wave 4 may not have been fully completed.
Bulls could build only two parts of correction 4, that is, we can see fully formed sub-waves ⓦ-ⓧ, and the sub-wave ⓨ is still being built, but is already close to its completion.
In the near future, the market may grow to 0.689. At that level, the entire corrective wave 4 will be at 76.4% along the Fibonacci lines of previous bearish impulse 3. Then, after the full completion of wave 4, we can expect a decline in the minor wave 5.
NAS 100 Awaits More Catalyst
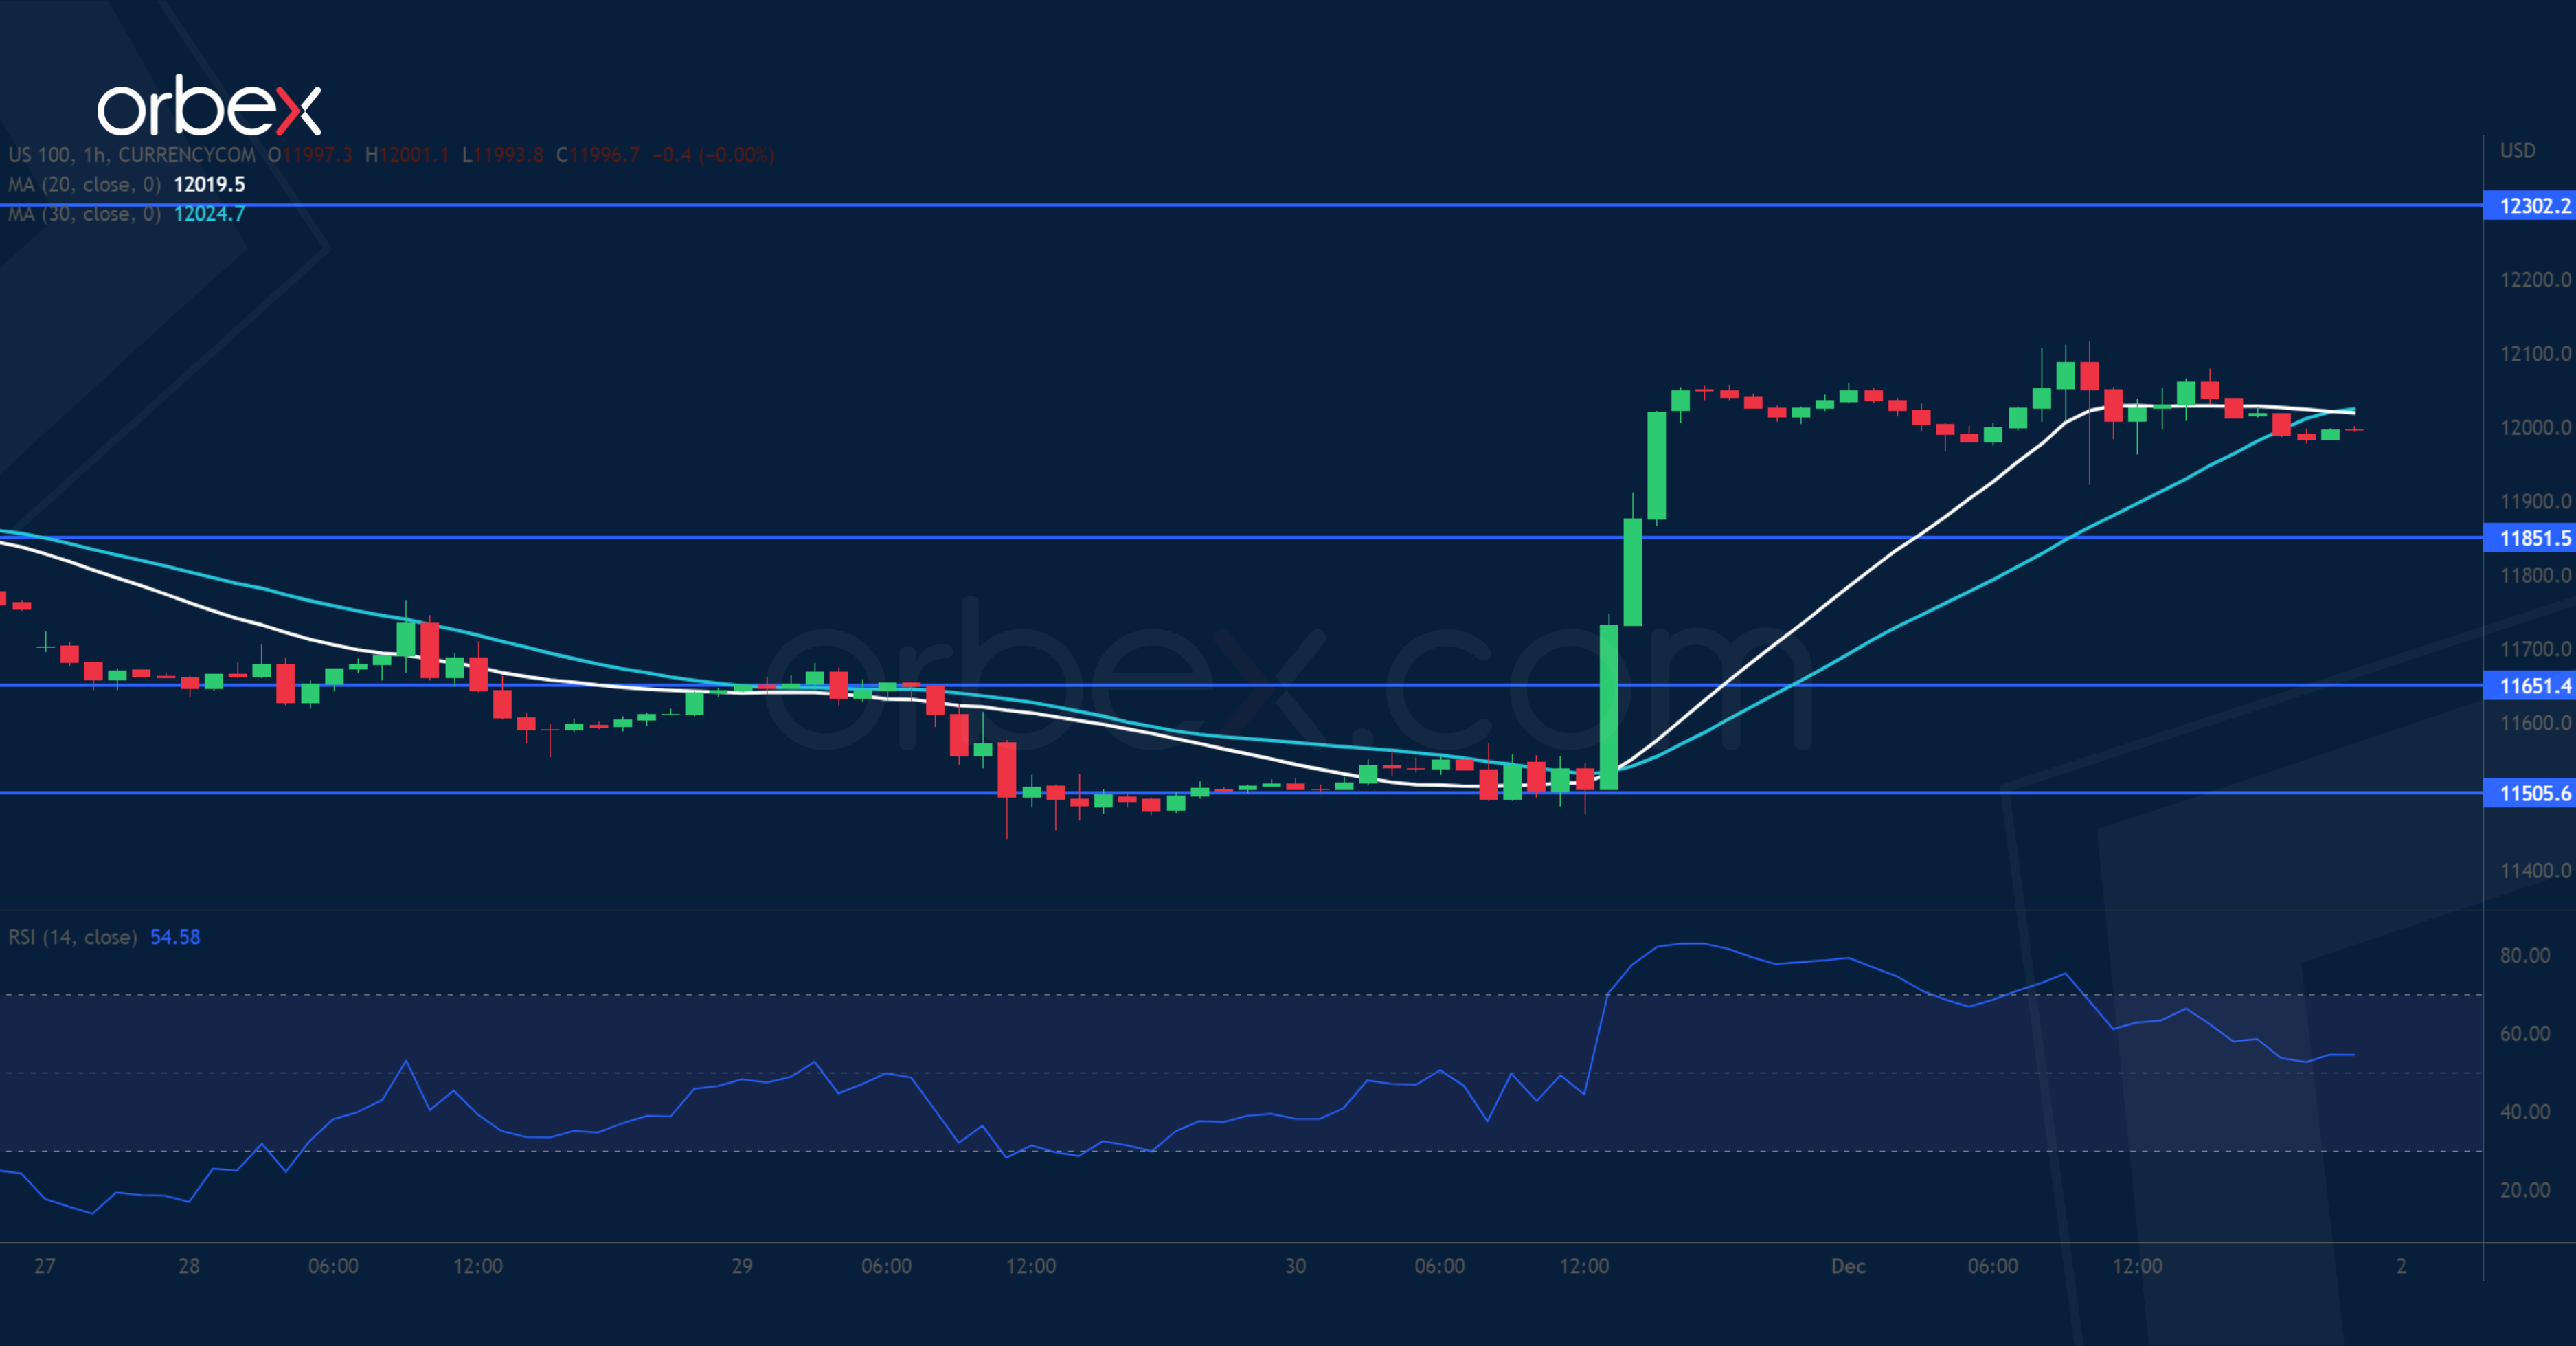
The Nasdaq 100 steadies as traders await November’s reading on the US labour market. On the daily chart, the index has found solid support over the 20-day moving average (11500) next to the previous double top from October. The surge in conjunction with a bullish MA cross shows that the recovery could be speeding up towards 12300. But before that, the RSI’s overbought situation means that the price could use some breathing room after a vertical ascent. 11850 is the immediate support and 11650 a key demand zone.
CAD/JPY Struggles for Bids
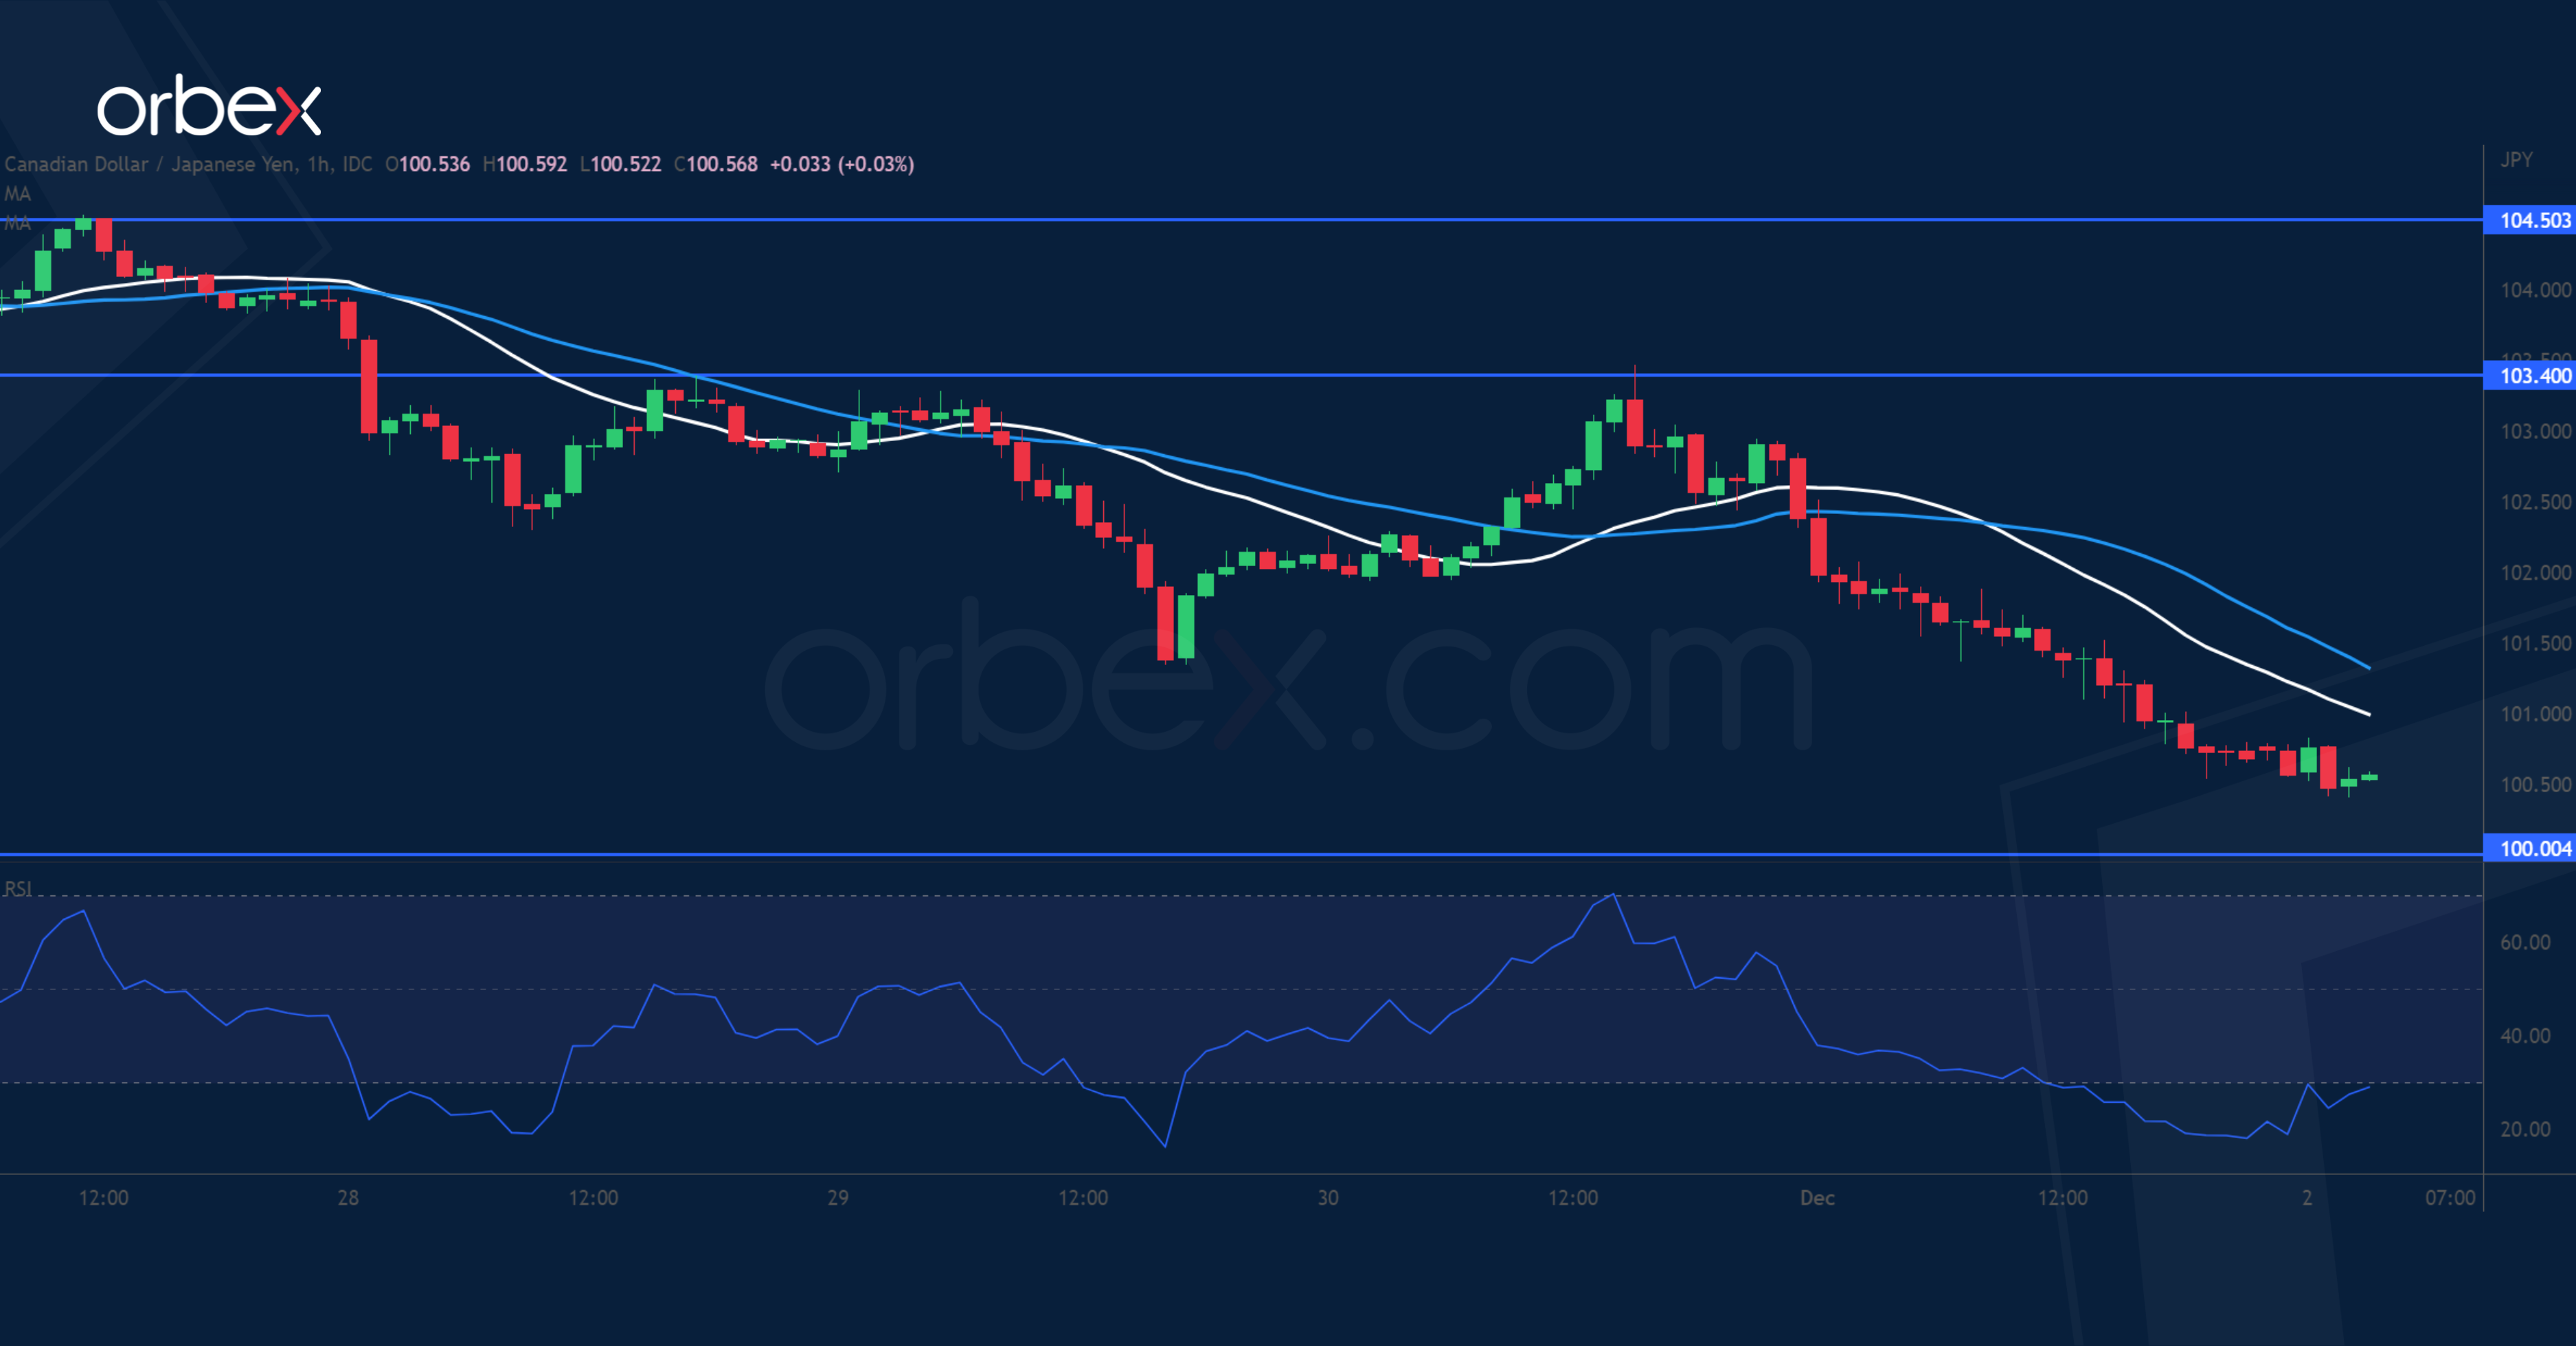
The Japanese yen rallied after BoJ officials hinted at a potential exit of QE. On the daily chart, a fall below the double bottom by the June and August lows around 102.00 may cause a bearish reversal. A bearish MA cross shows an acceleration to the south. The latest rebound came to a halt at 103.40, which suggests that the path of least resistance is down. The psychological level of 100.00 could be next. The RSI’s overextension may attract some buying but the bears may see a bounce as an opportunity to sell into strength.
NZD/USD Makes Higher High
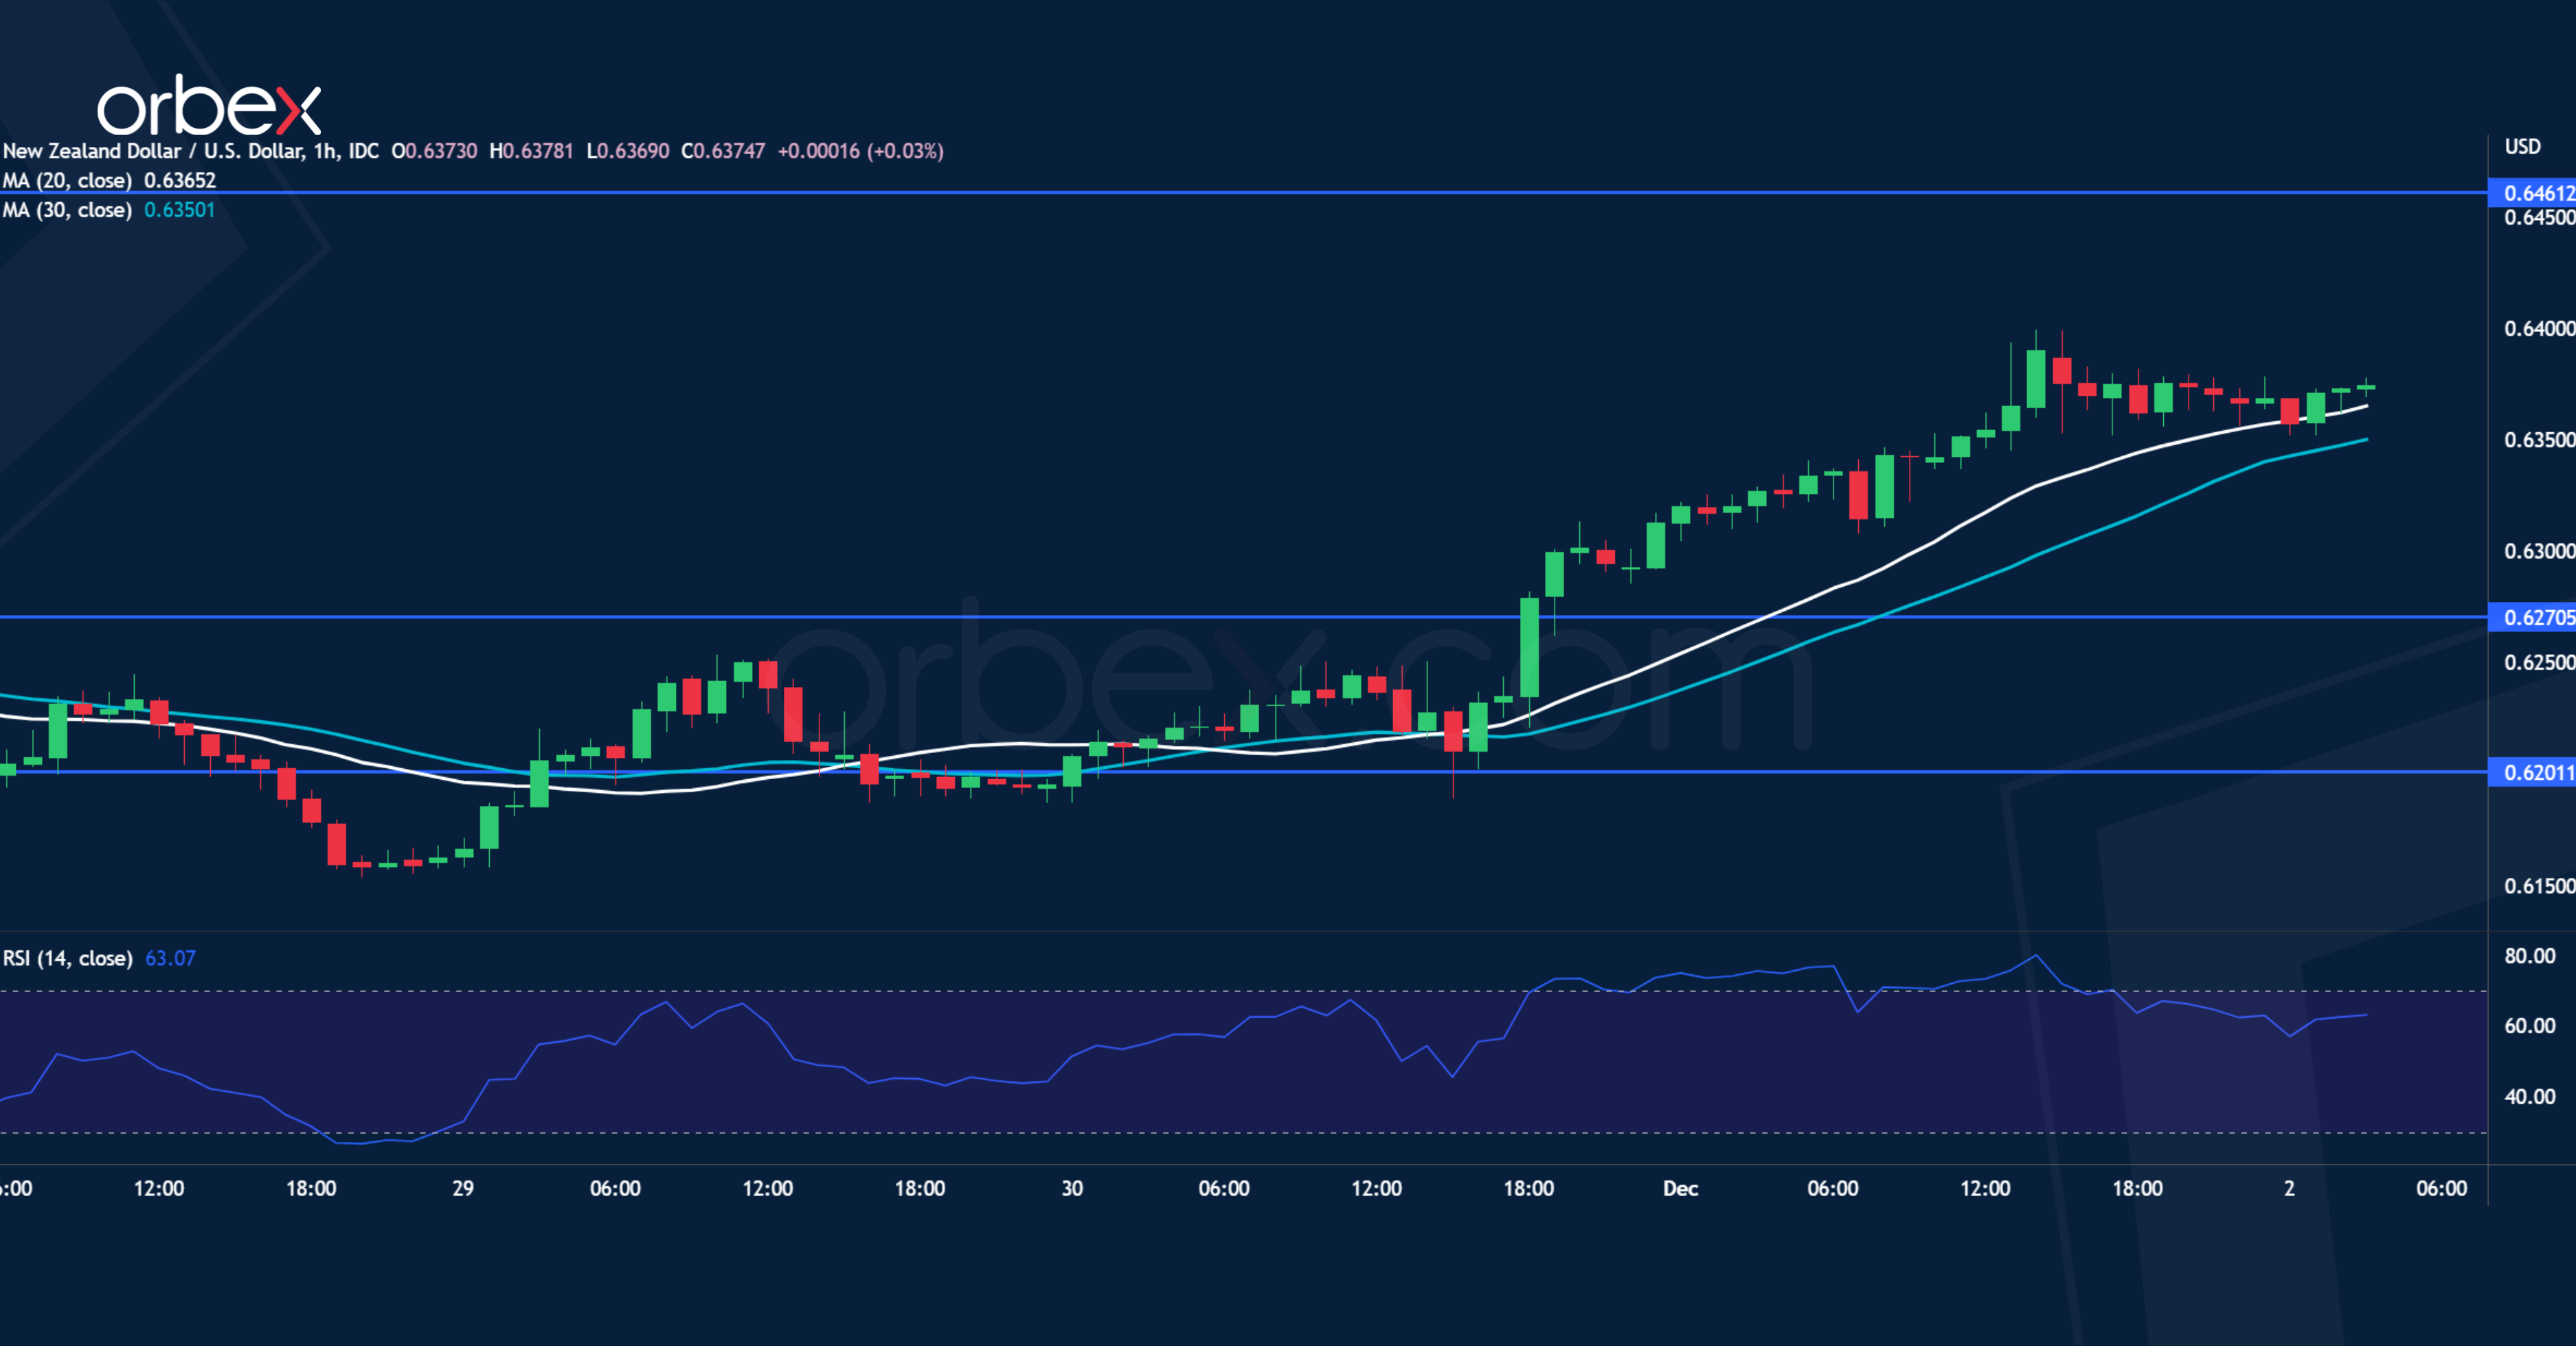
The US dollar continues to soften after October’s PCE showed a deceleration. The pop above the high of 0.6290 is a confirmation that the bulls are still in control after a short-lived correction. Strong momentum may send the pair to August’s high at 0.6460 which is a major ceiling from the medium-term perspective. Its breach could force the last selling interests to cover and trigger a bullish reversal in the weeks to come. As the RSI surged into the overbought area, 0.6270 is the closest support in case of a pullback.
Markets Recently Gave Much More Weight to Softer Data
Markets
Yesterday, the post-Powell bond rally simply continued as markets read US data as supporting the case for the Fed to slow its anti-inflationary campaign in December and maybe also at Q1 2023 meetings. US data were mixed, but in line with the recent reaction function, soft data outweighed. Challenger job cuts jumped sharply, mainly as companies are cutting costs. Weekly jobless claims improved (225k from 241k), but continuing claims, which recently got more attention as a pointer for the labour market, rose further. October spending (0.8% M/M) and income data (0.7%) were really strong and suggest a strong contribution of consumption to Q4 growth. Markets focused on softer price data, with the core PCE measure easing from 5.2% to 5.0%. The US non-manufacturing ISM joined the PMI measure with the headline index moving in contraction territory (49.0 from 50.2) and prices pressures easing (43.0). Fed Powell already admitted that goods price inflation is slowing, but that wages and services remain inflationary risks. Still, US yields nosedived further after the ISM, declining between 8.25 bps (2-y) and 13.75 bps (30-y), driven by a sharp further decline in real US yields. German yields, also dropped further between 10/11 bps (2 & 30-y) and 13.7 bps (5-y). The German 10-y yield is nearing the key 1.77% support. Lower real yields triggered further offloading of USD longs. DXY dropped below the high profile 105.30 support. EUR/USD (close 1.0520) jumped above the 1.0479/97 recent highs. USD/JPY smashed below the 137.50 support, closing at 135.33. One exception to recent trends, US equities hardly profited from lower real yields and the dollar (Dow -0.59%, Nasdaq +0.13%).
This morning most Asian equities mostly are trading in negative territory with Japan (Nikkei -1.6%) underperforming on the impressive rebound of the yen. US yields regain a few bps. The dollar still struggles (DXY 104.7, EUR/USD 1.0525, USD/JPY 135.2). Later today, all eyes will be on the US payrolls. The consensus expects 200k net job growth, but after a soft ADP report earlier this week risks are seen to the downside. Recall that Powell recently suggested that job growth slowing to 100k is probably needed to bring some balance to the labour market. Also keep a close eye at the wage data (AHE expected at 0.3% M/M and 4.6% Y/Y). As indicated earlier, markets recently gave much more weight to softer data than to data pointing to resilience in activity. This reaction function probably also applies to the US payrolls. The US 10-y yield is testing the key 3.55% October low. Also the US 2-y yield nears a first important support (4.26%, neckline HS formation). A break would indicate that markets expect the Fed to soon ease its policy priority on inflation in favour of growth. This isn’t what Powell and Co guided until now. Key question is who will give in. The payrolls might also be key for the ST fate of the dollar. We find it early too already see a sharp setback of the dollar (with a.o. risks of new risk-off wave). Even so, with key support levels under heavy pressure, a soft figure could trigger further stoploss USD selling short-term. 1.0615 is the next reference on the EUR/USD chart.
News Headlines
The Bank of Japan’s newest board member Naoki Tamura told Bloomberg it would be appropriate to conduct a review at the right time. This could be soon or a little later, depending on how inflation, wages and the economy evolve, he said. His comments suggest that it could take place even before current BoJ governor Kuroda steps down next spring. That would make it more clear for his successor what to do in terms of monetary policy since reviews are typically used to justify changes or adjustments in the stance. Last such review was conducted in March last year. The BoJ’s current framework of negative policy rates and yield curve control has come under pressure amid rising (global) inflation. The yen suffered heavy losses as a result. USD/JPY rose to and above 150, prompting government FX interventions. The pair since then retreated dramatically to 135 today, but mainly on the back of a weaker USD.
The EU is close in reaching a deal to cap Russian oil prices at $60 per barrel before a Monday deadline. That’s when wider EU sanctions on oil are due to come into force. The plan bans shipping and services needed to transport Russian oil unless the cargoes are bought below the price cap. This level needs to be attractive enough for Russian oil producers to keep flows going while ultimately still limiting revenues. If it is too low however, Russia could stop production/exports altogether, causing global oil prices to spike. Poland still needs convincing as it continues to push to toughen the sanctions package before signing off on the price cap. Talks will continue over the weekend.
Elliott Wave View: Gold Has Turned Bullish
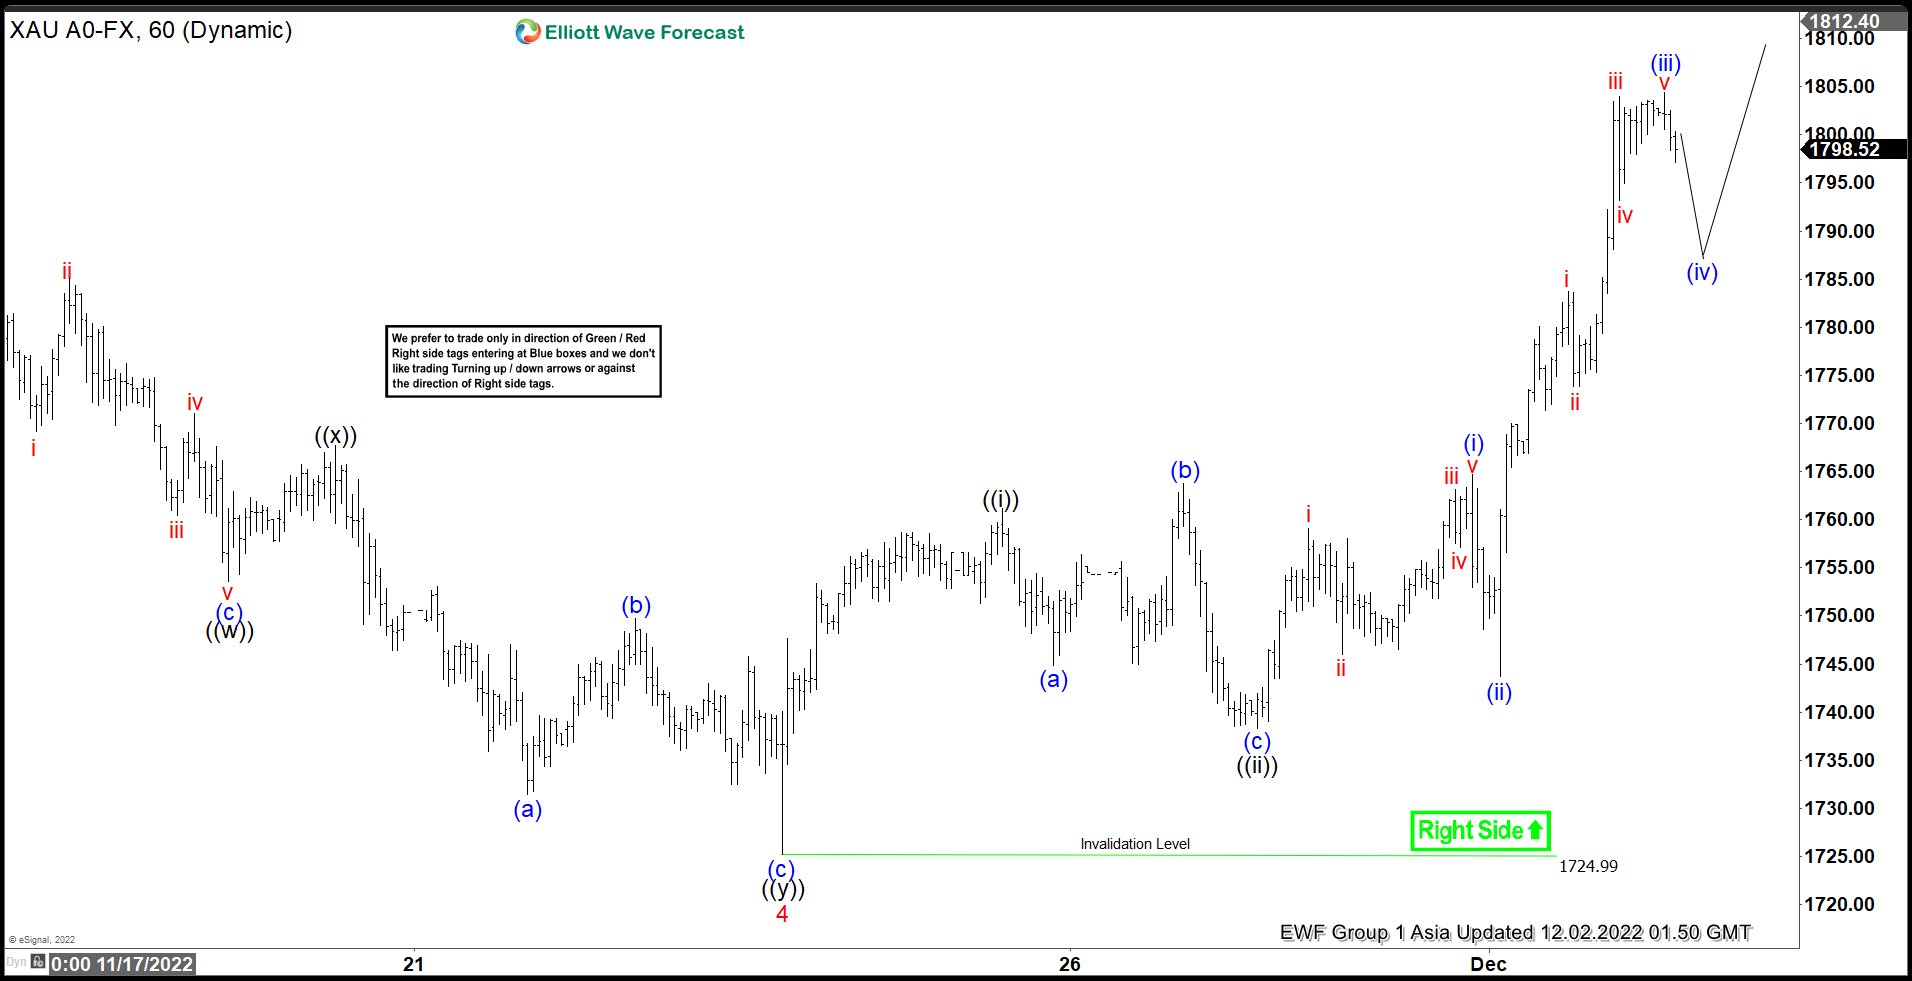
Short term Elliott Wave View in Gold (XAUUSD) suggests the rally from 9.28.2022 low is unfolding as a 5 waves impulse Elliott Wave structure. Up from 9.28.2022 low, wave 1 ended at 1729.46 and pullback in wave 2 ended at 1616.71. The metal then resumed higher in wave 3. Up from wave 2, wave ((i)) ended at 1682.37 and dips in wave ((ii)) ended at 1663.80. The metal resumes higher in wave ((iii)) towards 1772.78 and pullback in wave ((iv)) ended at 1752.30. Final leg higher wave ((v)) ended at 1786.53 which completed wave 3. From there, the metal pullback in wave 4 which ended at 1725.23.
Wave 5 higher is in progress with internal subdivision as an impulse in lesser degree. Up from wave 4 low, wave ((i)) ended at 1761.18 and pullback in wave ((ii)) ended at 1738.30. The metal forms a nest in wave ((iii)). Up from wave ((ii)), wave (i) ended at 1764.66 and pullback in wave (ii) ended at 1743.70. The precious metal then resumes higher in wave (iii) towards 1804.45. Expect wave (iv) to find support for more upside in wave (v) to end wave ((iii)). Near term, as far as pivot at 1725 low stays intact, expect pullback to find support in 3, 7, 11 swing for more upside.
Gold 60 Minutes Elliott Wave Chart
All Eyes on NFP
Sentiment was mixed at yesterday’s trading session. Equity bulls were timid, while the dollar bears were in charge of the market after the latest PCE data, which is the Fed’s favorite gauge of inflation showed that the core PCE index slowed more than expected in October. Personal spending accelerated in line with expectations, while income rose more than expected.
The softening inflation sent the US dollar index tumbling below its 200-DMA for the first time since summer 2021. The US dollar index slipped below its major 38.2% Fibonacci retracement on 2021-2022 rally, and stepped into the bearish consolidation zone. Finally!
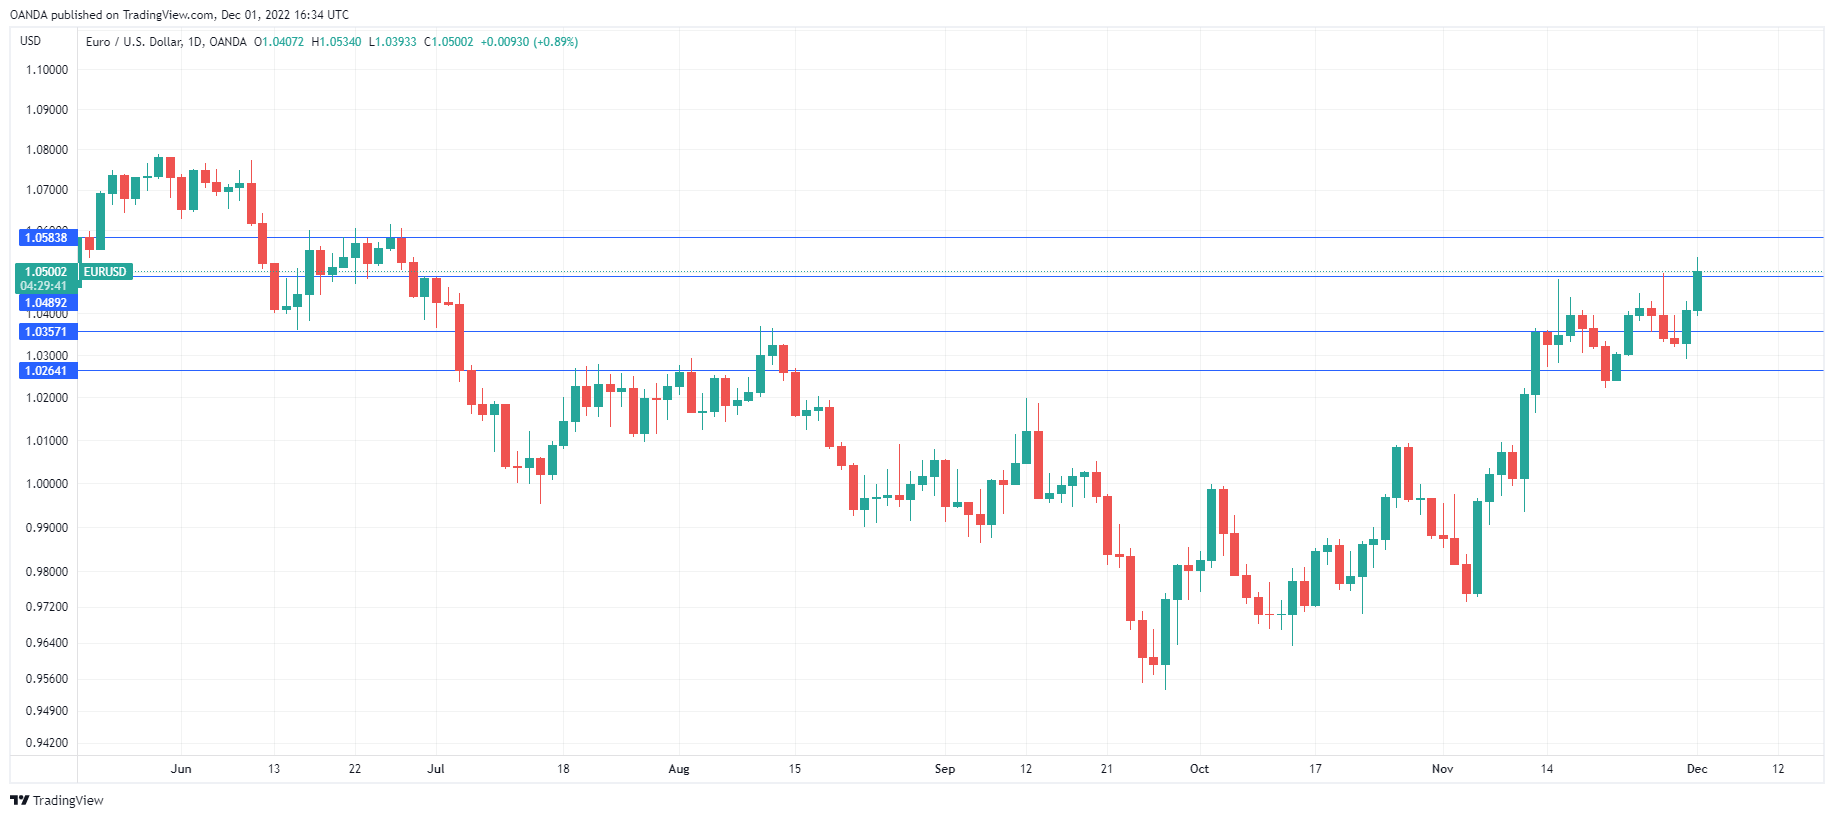
The EURUSD advanced above the 1.05 level for the first time since June, and broke above its own long-term negative trend top. Cable cleared the 200-DMA, which stands at 1.1250, and advanced past the 1.22 mark. The dollar-yen fell to 135 mark this morning.
All these moves seem like a miracle happened, but be careful, because according to the activity in swap markets, the pricing of the Fed’s peak rate fell to 4.9% this week, which is an alarming sign that the market is not pricing well the Federal Reserve’s (Fed) communication. The Fed will probably go beyond the 5% mark - this is at least what the Fed officials are killing themselves to say - and the rates will stay there for some time.
So, there is a risk that we won’t see a one-direction trade for the US dollar in the coming weeks. The US dollar may not soften as smoothly as it strengthened over the past year and a half, and any piece of news or data that would rectify the Fed pricing could reverse the dollar’s latest losses.
US equities consolidate near critical level pre-NFP
Trading in equities was much less festive than the FX yesterday, as the ISM manufacturing index warned that the US manufacturing activity fell below 50, the contraction zone, for the first time since summer 2020.
The S&P500 flirted with the 4100 mark, and closed the day around the ceiling of the ytd descending channel, while Nasdaq remained flat around its 200-DMA, which is a touch above the 12’000 mark.
Today, the much-expected jobs data should determine whether the S&P500 deserves to quit the ytd negative trend, or stay in it.
If you asked me last week, or at the beginning of this week, how the market would react to a strong NFP data, I would say, probably poorly – because we know that the Fed wants the labour conditions to deteriorate to fight inflation, and strong jobs data would only revive the hawkish Fed expectations and send equities lower.
But after having seen the overly optimistic market reaction to Jerome Powell’s speech on Wednesday - which gave away no new information but which triggered a weird euphoria across risk assets - I think that investors are dying to price in the goldilocks scenario, which is the sweet combination of slowing inflation, but a mild economic slowdown, which means mild deterioration in the US jobs data.
Therefore, a fairly strong NFP print today, around or slightly above the 200’000 penciled in by analysts, should boost risk appetite and help the S&P500 close the week above its 200-DMA, and above the ytd bearish trend.
A soft figure, like Wednesday’s ADP report, could increase recession odds and keep equities under negative pressure.
Then, there is a slim possibility that we will see a very strong figure, at 300’000 or above. In that case, we shall see the Fed hawks take the upper hand again, and send equity valuations lower before the weekly closing bell.
US Labour Market Takes Centre Stage
Market movers today
It's time for US Nonfarm Payrolls, which is one of the key data points for the Fed going into their next FOMC meeting on 14 December. We expect US job growth to decline from 261k to a still decent 220k (consensus 200k). Also keep a close eye on wage growth, which is a key input to the Fed's assessment of the outlook for core inflation.
The Fed's Evans will speak tonight and may offer the first comments from a Fed member on the labour market report.
In the Scandies we get the monthly NAV labour market report in Norway which is likely to show an ease in the tightness of the labour market. We pencil in a rise in the seasonally adjusted unemployment rate to 1.7% - which is naturally still very low. This will prove to be one of the key final releases for Norges Bank heading into the 15 December monetary policy meeting. Also next week's Regional Network Survey and inflation release will be key.
The 60 second overview
Markets: Overall it has been fairly quiet overnight with very limited market moves across asset classes. The focal point in markets remains the outlook for US monetary policy. Nominal and real yields in US have moved considerably lower this week following not least Powell's speech Wednesday evening but also weaker-than-expected US data.
Yesterday's ISM manufacturing report - a gauge of the US manufacturing outlook - fell more than expected with the main index falling to 49.0 from 50.2 last month and hence contractionary territory (below the 50 threshold). Also the details on both employment and price pressures were weaker-than-expected. This together with lower-than-expected PCE core inflation in October, also released yesterday, strengthened market expectations that the Fed will slow down its pace of rate hikes.
US rates markets are now pricing in a peak in US policy rates below 4.9% suggesting that the Fed will deliver only an additional 100bp more of tightening in this cycle. We still think that risks to this pricing is skewed to the topside and highlight that the recent substantial easing of global financial conditions only risks creating a second inflation wave as we head into 2023.
Equities: Nordics in catch-up with the US rally. High multiples in the lead as yields dropped sharply (Orsted 8%, EQT 5%, NIBE 5%). Interestingly, US equities did not rally on lower yields but S&P -0.1% with the preference for quality continuing. Despite the directionless markets, VIX dropped -3% to just below 20, so risk on is still visible.
FI: Global bond yields continue to decline on the back of the comments from Fed chairman Powell regarding slower pace of rate hikes as well as lower than expected rise in the PCE deflator as well as weaker than expected ISM manufacturing data. Hence, 10Y Treasuries rallied some 14bp and the curve flattened from the long end.
FX: Broad USD continues to weaken, with EUR/USD trading over 1.05 for the first time since late June. This also supports Scandies, with both NOK and SEK making new multi-month highs vs the USD. GBP was among yesterday's big winners as inflation expectations came in lower.
Credit: The dovish comments from the FED created a very bullish session for the credit market. This brought iTraxx main 5bp tighter to 86bp while Xover tightened 16bp to 443bp.
GBP/JPY Daily Outlook
Daily Pivots: (S1) 164.52; (P) 165.87; (R1) 167.23; More...
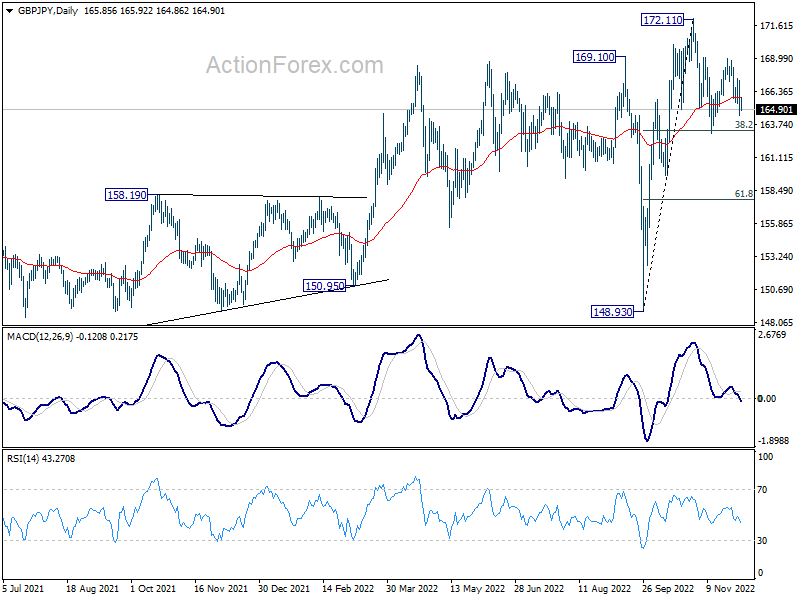
Intraday bias in GBP/JPY remains mildly on the downside for 163.02 support. Break there will resume the whole decline from 172.11 and target 159.71 support next. For now, risk will stay on the downside as long as 167.40 minor resistance holds, in case of recovery.
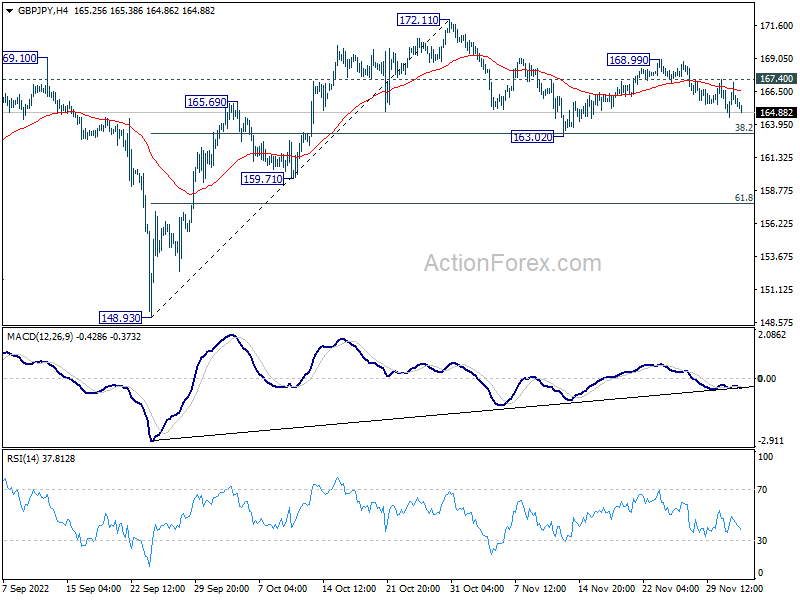
In the bigger picture, there is no clear sign of medium term topping yet. Up trend from 123.94 (2020 low) could still resume through 172.11 high at a later stage. However, firm break of 159.71 support will argue that it's already in correction to the up trend from 123.94, and deeper decline would be seen back towards 148.93 support.