Sample Category Title
Technical Outlook and Review
USD/JPY:
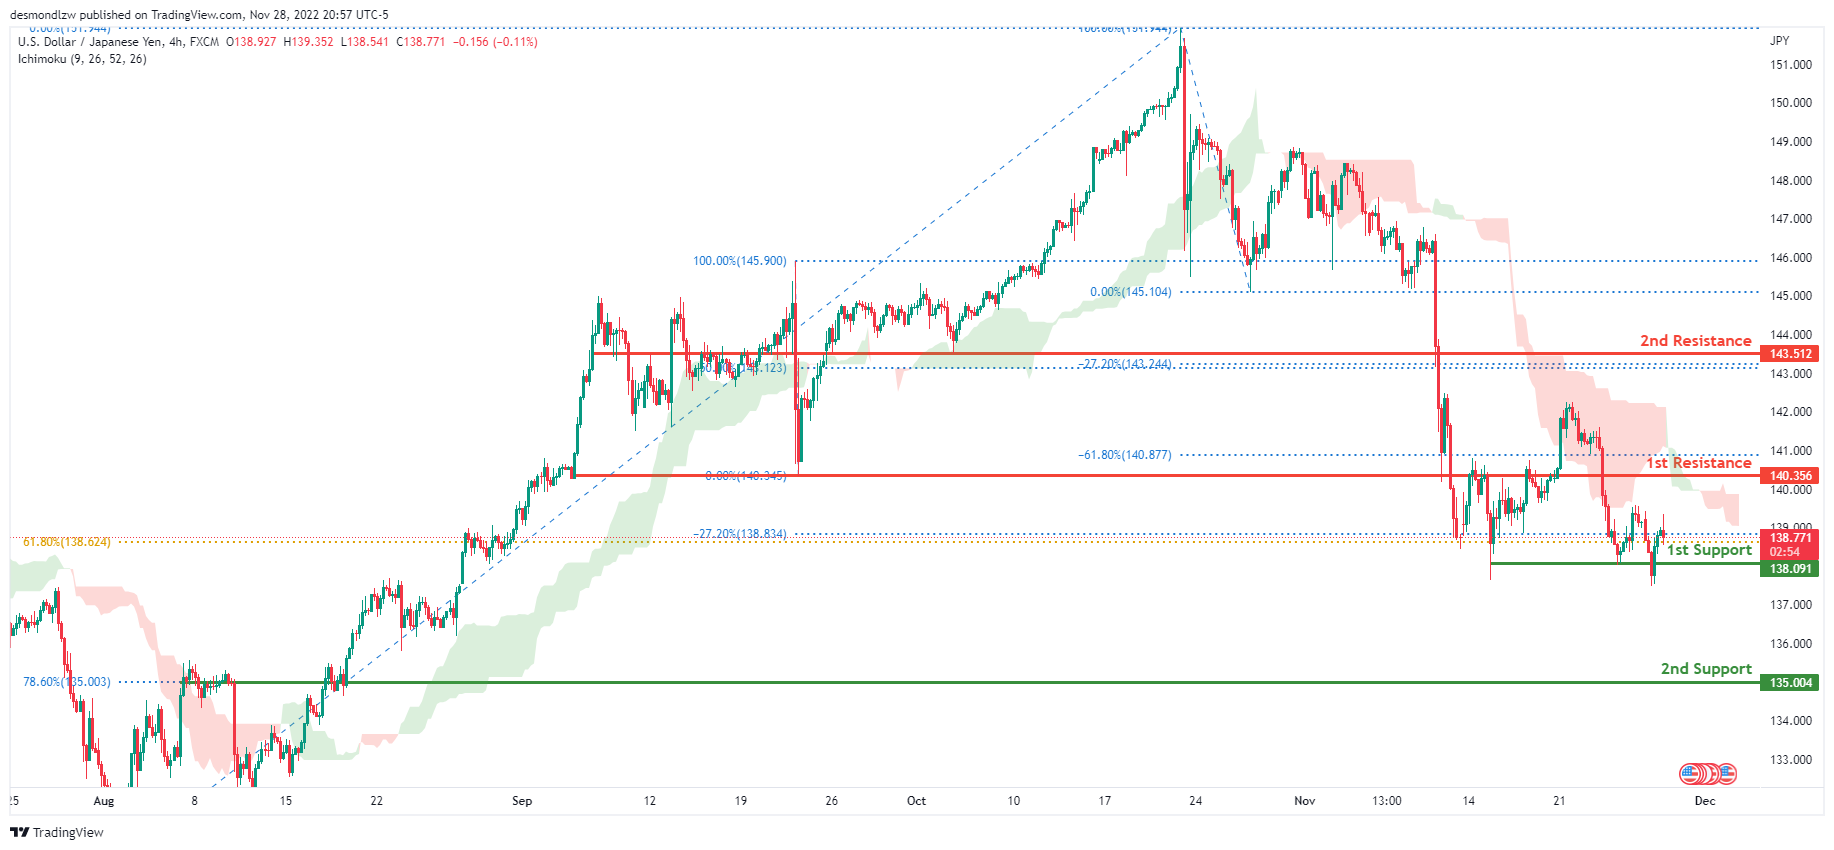
The current general bias for USDJPY on the H4 chart is bearish. To add confluence to this, the price is under the Ichimoku cloud which indicates a bearish market. If the bearish momentum continues, expect USDJPY to head towards the 1st support line at 138.091, where the –27.2% Fibonacci expansion line is located. In an alternative scenario, price could go up to retest the 1st resistance line at 140.356, where the -61.8% Fibonacci expansion line and previous low are located.
Areas of consideration:
- H4 time frame, 1st resistance at 140.356
- H4 time frame, 1st support at 138.091
DXY:
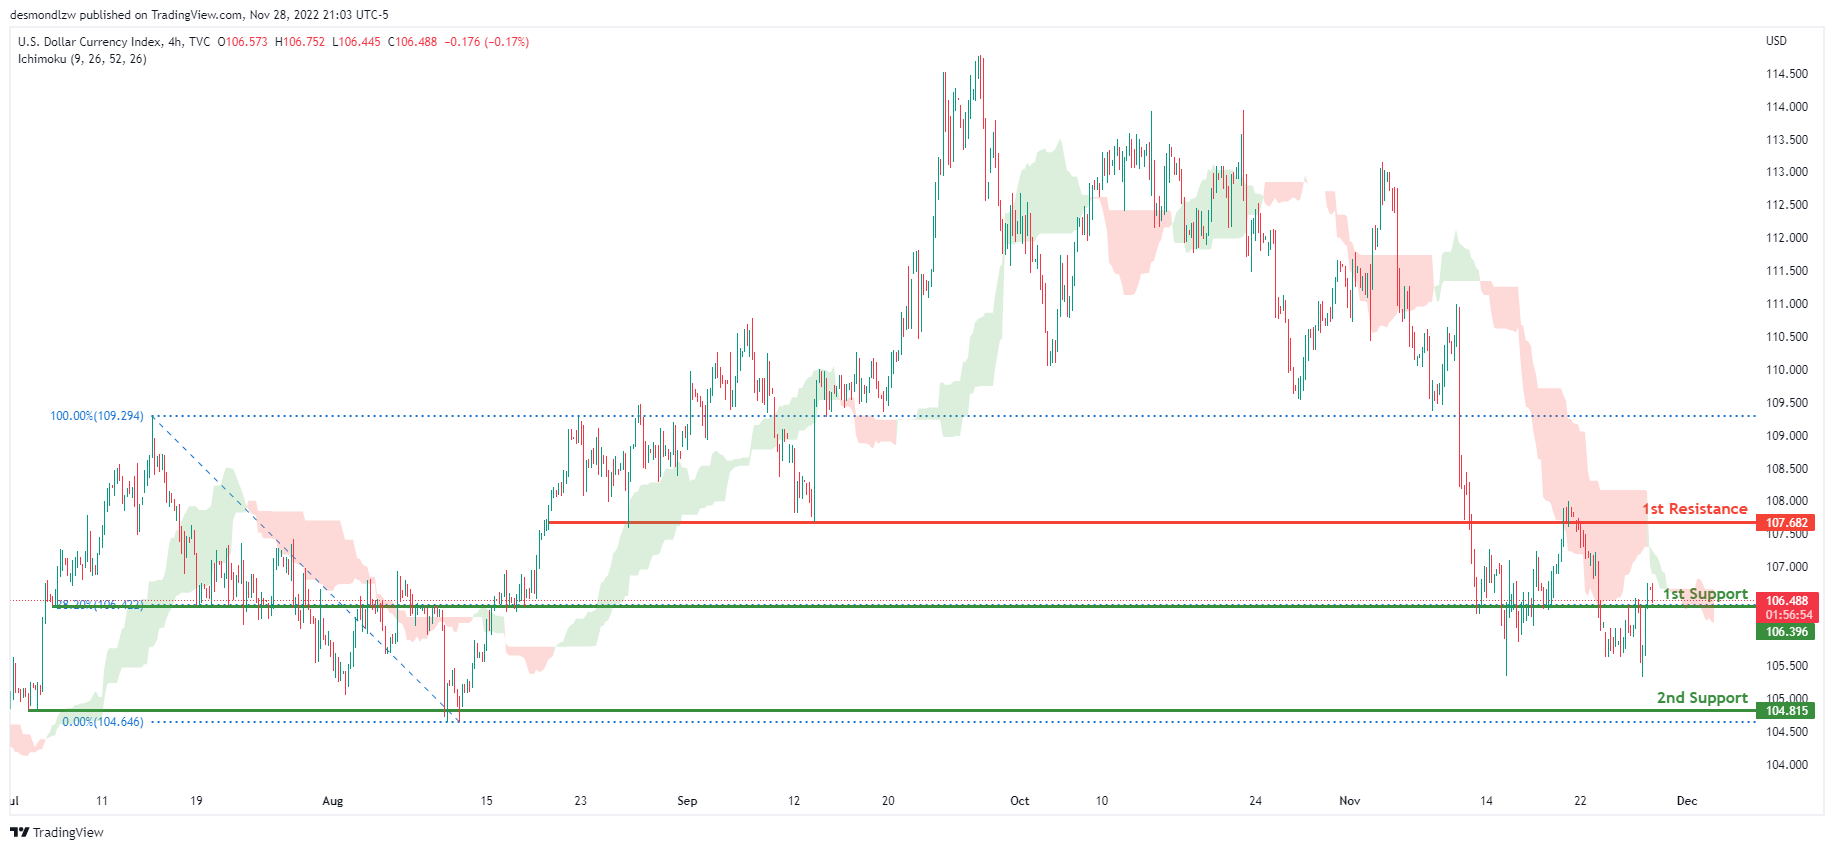
On the H4 chart, the overall bias for DXY is bearish. To add confluence to this, the price is crossing below the Ichimoku cloud which indicates a bearish market. If this bearish momentum continues, expect the price to break the 1st support line at 106.396 where the 38.2% Fibonacci line is located, before heading towards the 2nd support at 104.815, where the previous swing low is. In an alternative scenario, price could head back up and retest the 1st resistance line resistance at 107.682, where the previous swing low lies.
Areas of consideration:
- H4 time frame, 1st resistance at 107.682
- H4 time frame, 1st support at 106.396
- H4 time frame, 2nd support at 104.815
EUR/USD:
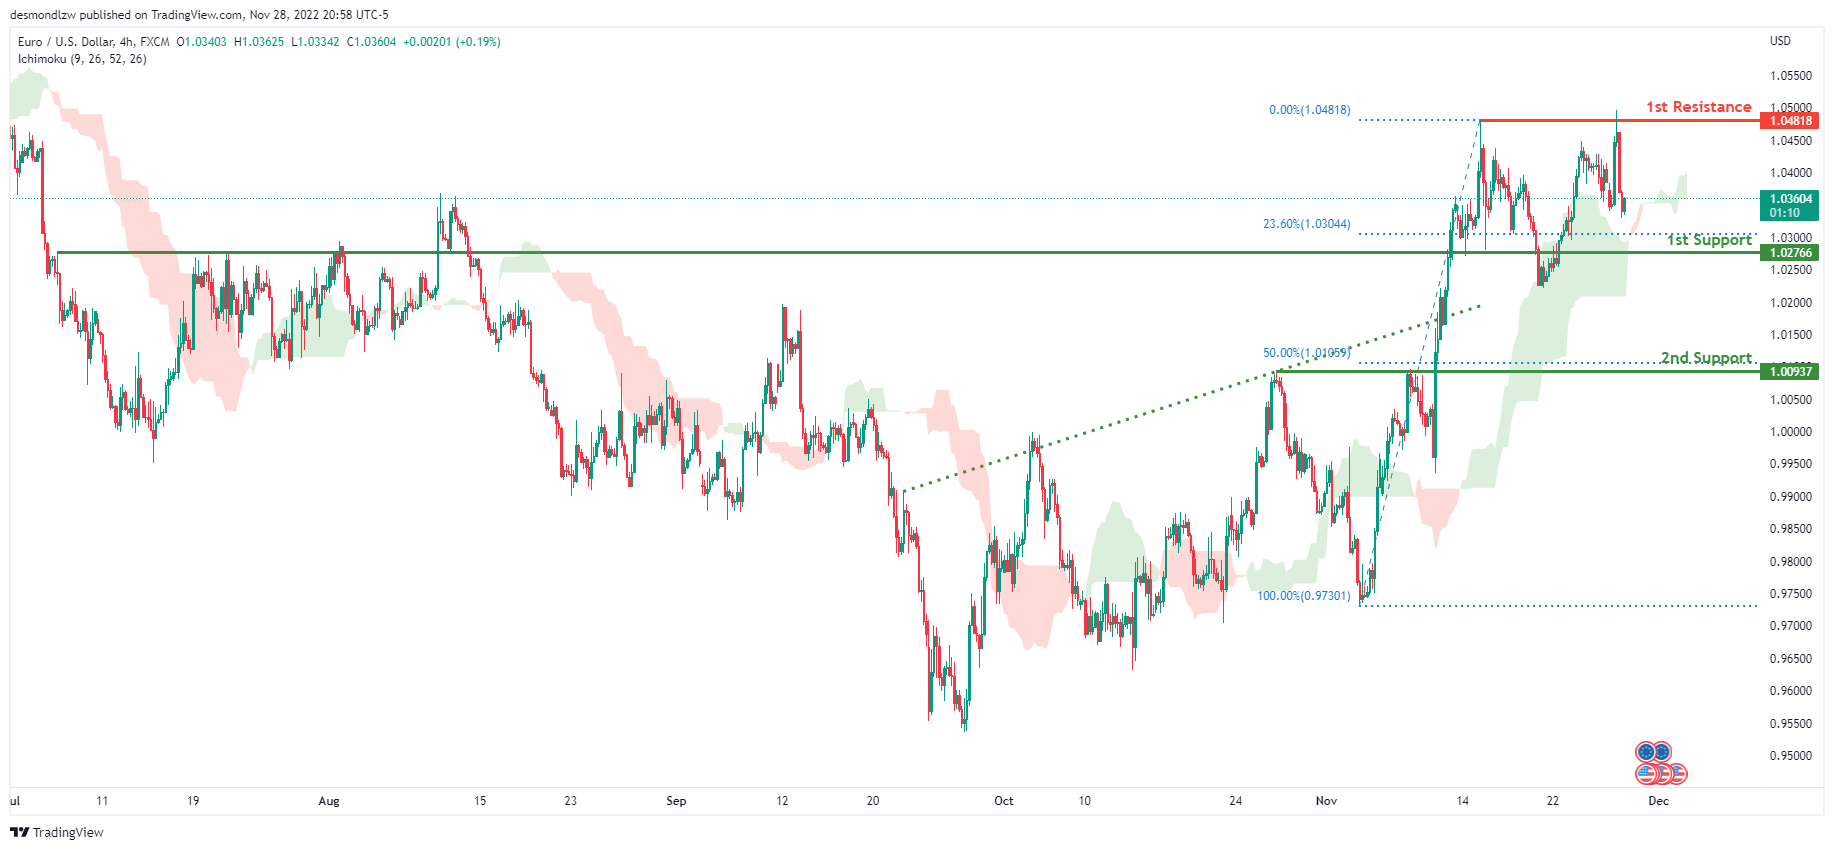
Looking at the H4 chart, my overall bias for EURUSD is bullish due to the current price being above the Ichimoku cloud, indicating a bullish market. To add confluence to this bias, price has also broken above the ascending trend line. If this bullish momentum continues, expect the price to possibly head towards the 1st resistance at 1.04818, where the previous swing high is located. In an alternate scenario, price could possibly head back down towards the 1st support level at 1.02766, where the 23.6% Fibonacci line is located, before heading towards the 2nd support at 1.00937, where the 50% Fibonacci line is.
Areas of consideration :
- H4 1st resistance at 1.04818
- H4 1st support at 1.02766
- H4 2nd support at 1.0093
GBP/USD:
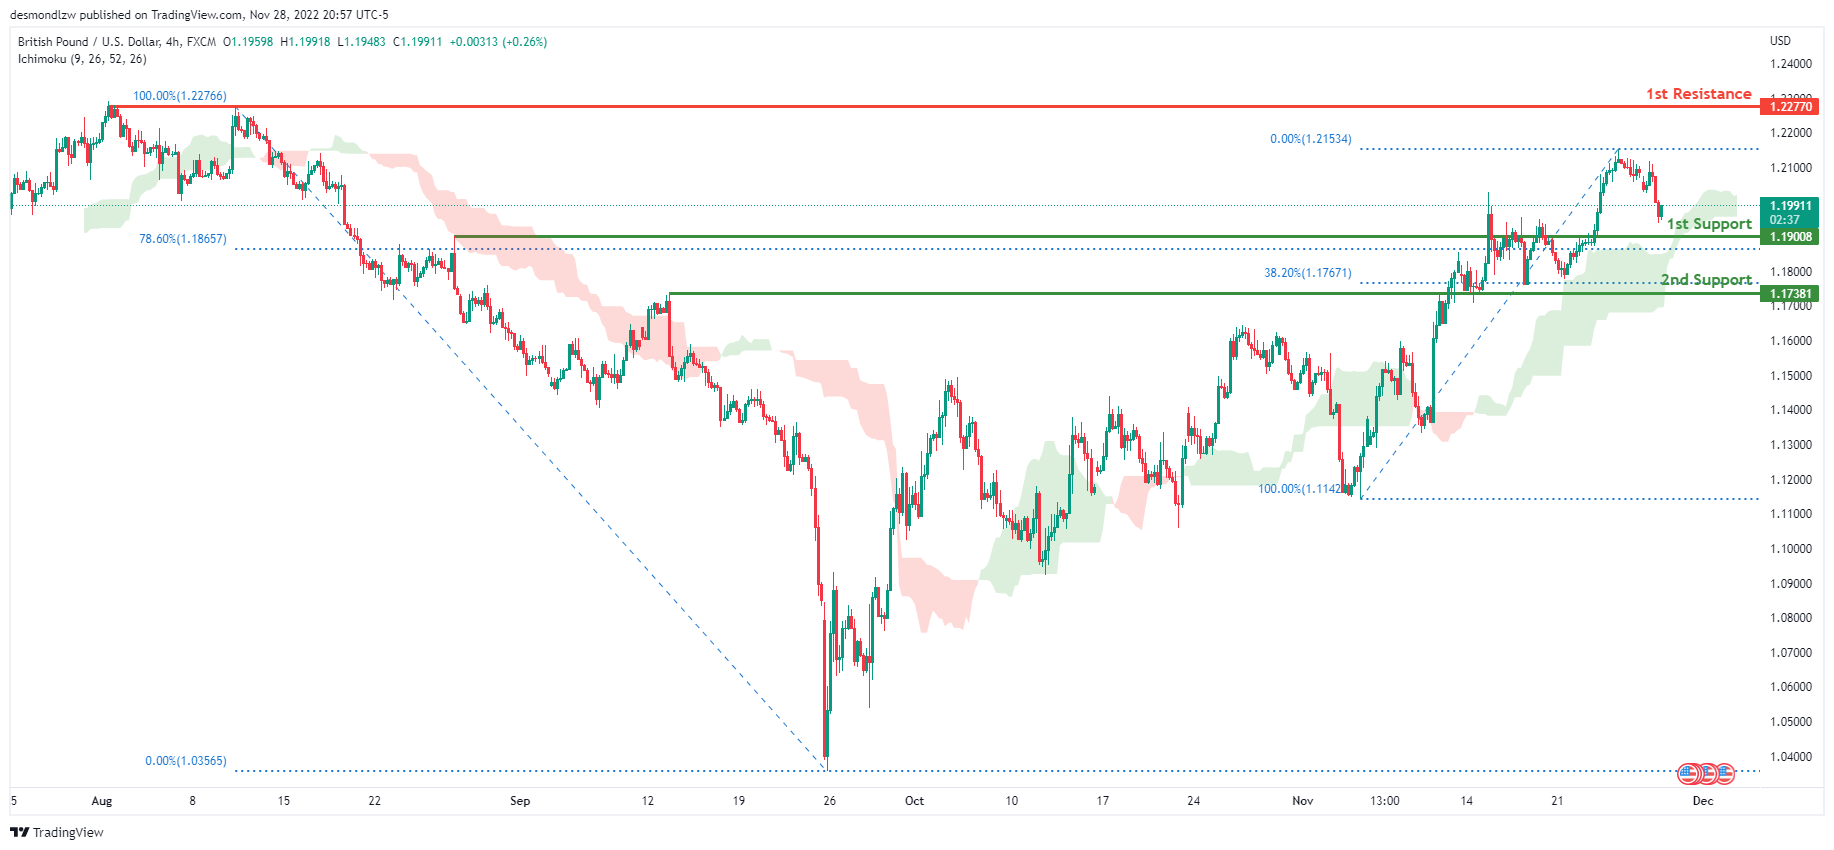
Looking at the H4 chart, my overall bias for GBPUSD is bullish due to the current price being above the Ichimoku cloud, indicating a bullish market. Expecting price to possibly head towards the 1st resistance line at 1.22770, where the previous swing high is. In an alternative scenario, price could possibly head back down to retest the 1st support line at 1.19008, where the 78.6% Fibonacci line is.
Areas of consideration:
- H4 1st resistance at 1.22770
- H4 1st support at 1.19008
USD/CHF:
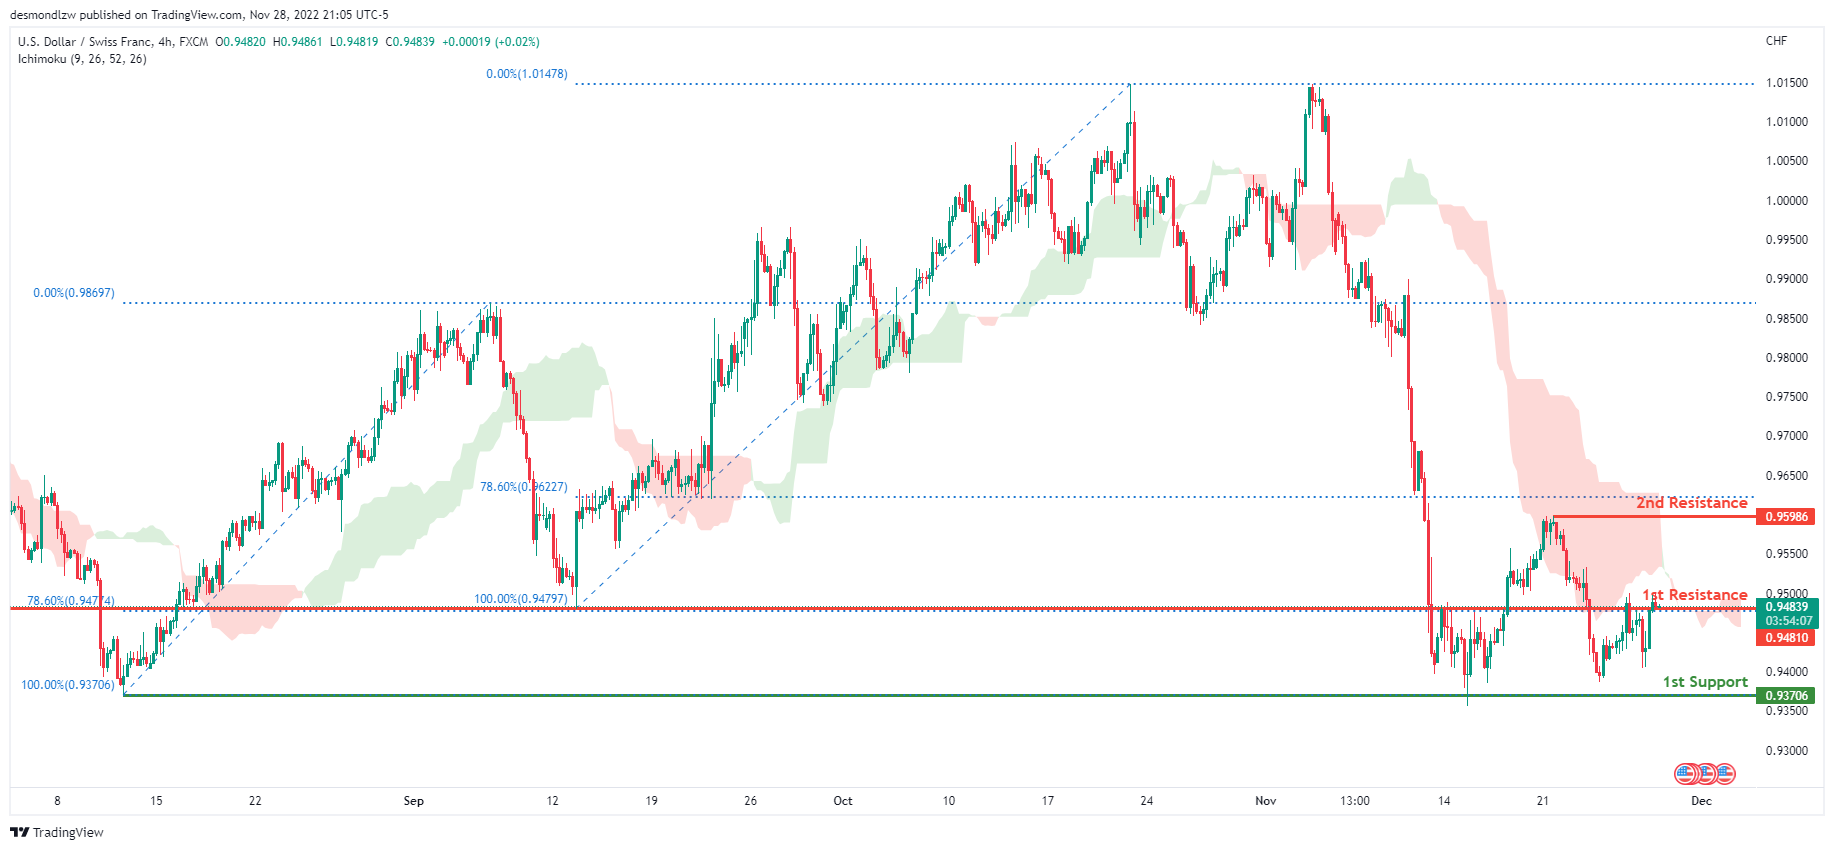
The overall bias for USDCHF on the H4 chart is bearish. In addition, the price is crossing below the Ichimoku cloud, indicating a bearish market. If the current bearish trend continues, expect price to continue heading towards the 1st support line at 0.93706, where the previous swing low is. In an alternate scenario, price could rise towards the 1st resistance line at 0.94810, where the 78.6% Fibonacci line is, before heading towards the 2nd resistance at 0.95986, where the previous swing high is.
Areas of consideration
- H4 1st support at 0.93706
- H4 1st resistance at 0.94810
- H4 2nd resistance at 0.95986
XAU/USD (GOLD):
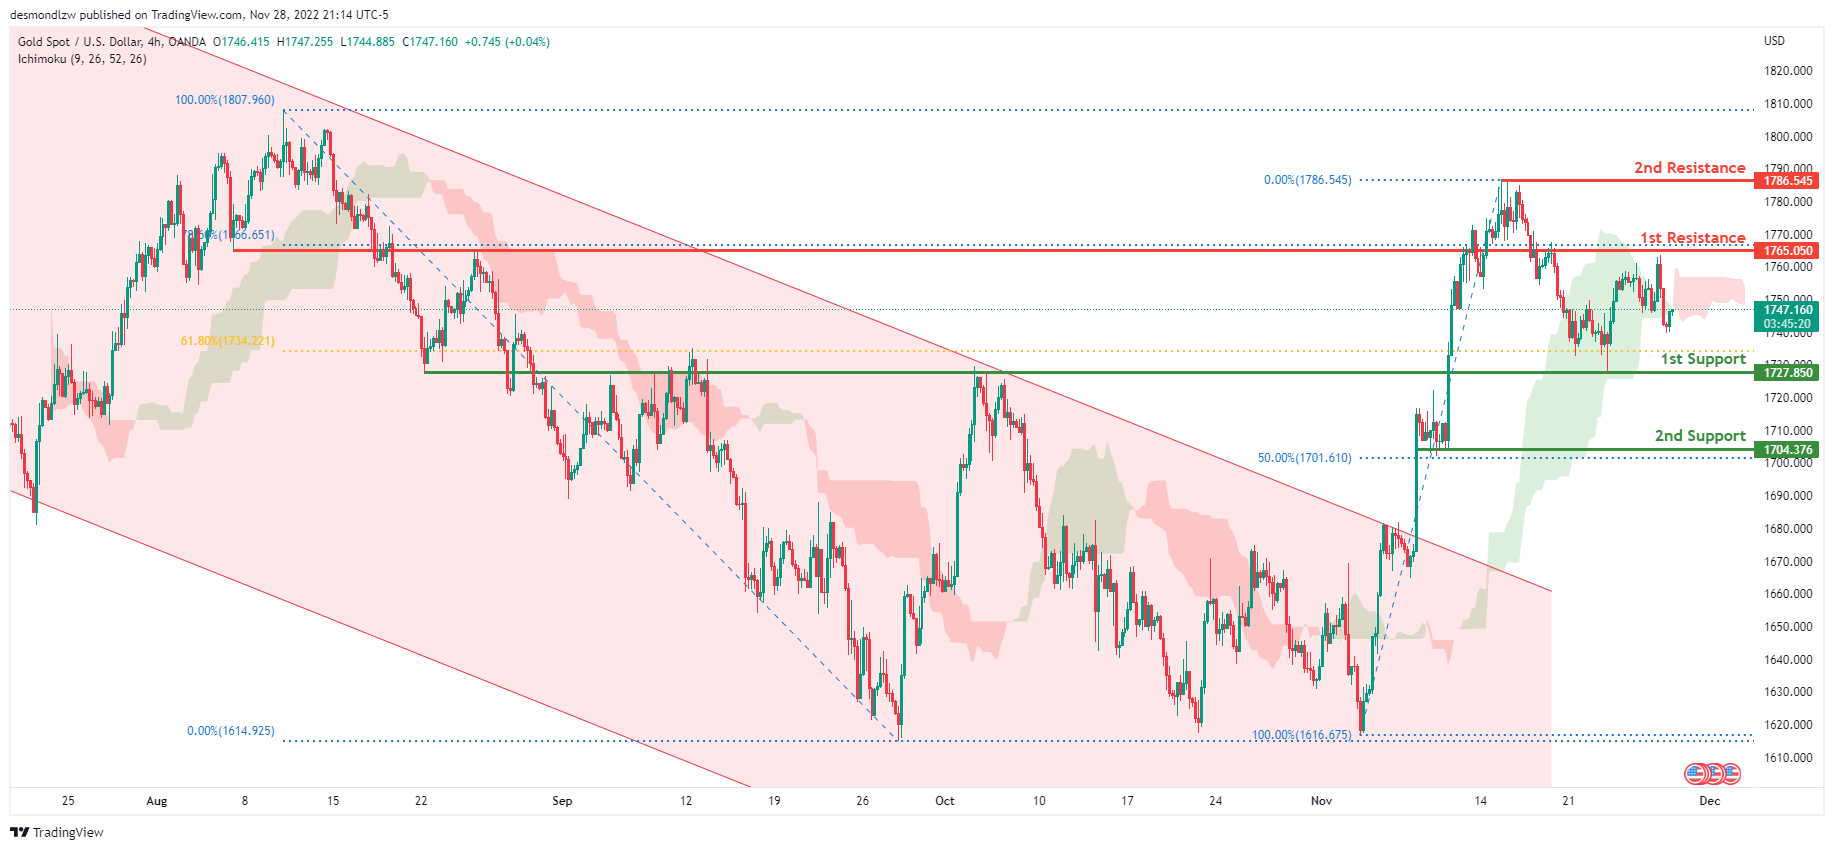
Looking at the H4 chart, my overall bias for XAUUSD is bullish due to the current price crossing above the Ichimoku cloud, indicating a bullish market. If this bullish momentum continues, expect the price to possibly head back up towards the 1st resistance at 1765.050, where the 78.6% Fibonacci line is located. In an alternate scenario, price could possibly head back down towards the 1st support level at 1727.850, where the 38.2% and 61.8% Fibonacci lines are located.
Areas of consideration:
- H4 time frame, 1st resistance at 1765.483
- H4 time frame, 1st support at 1727.850
AUD/USD:
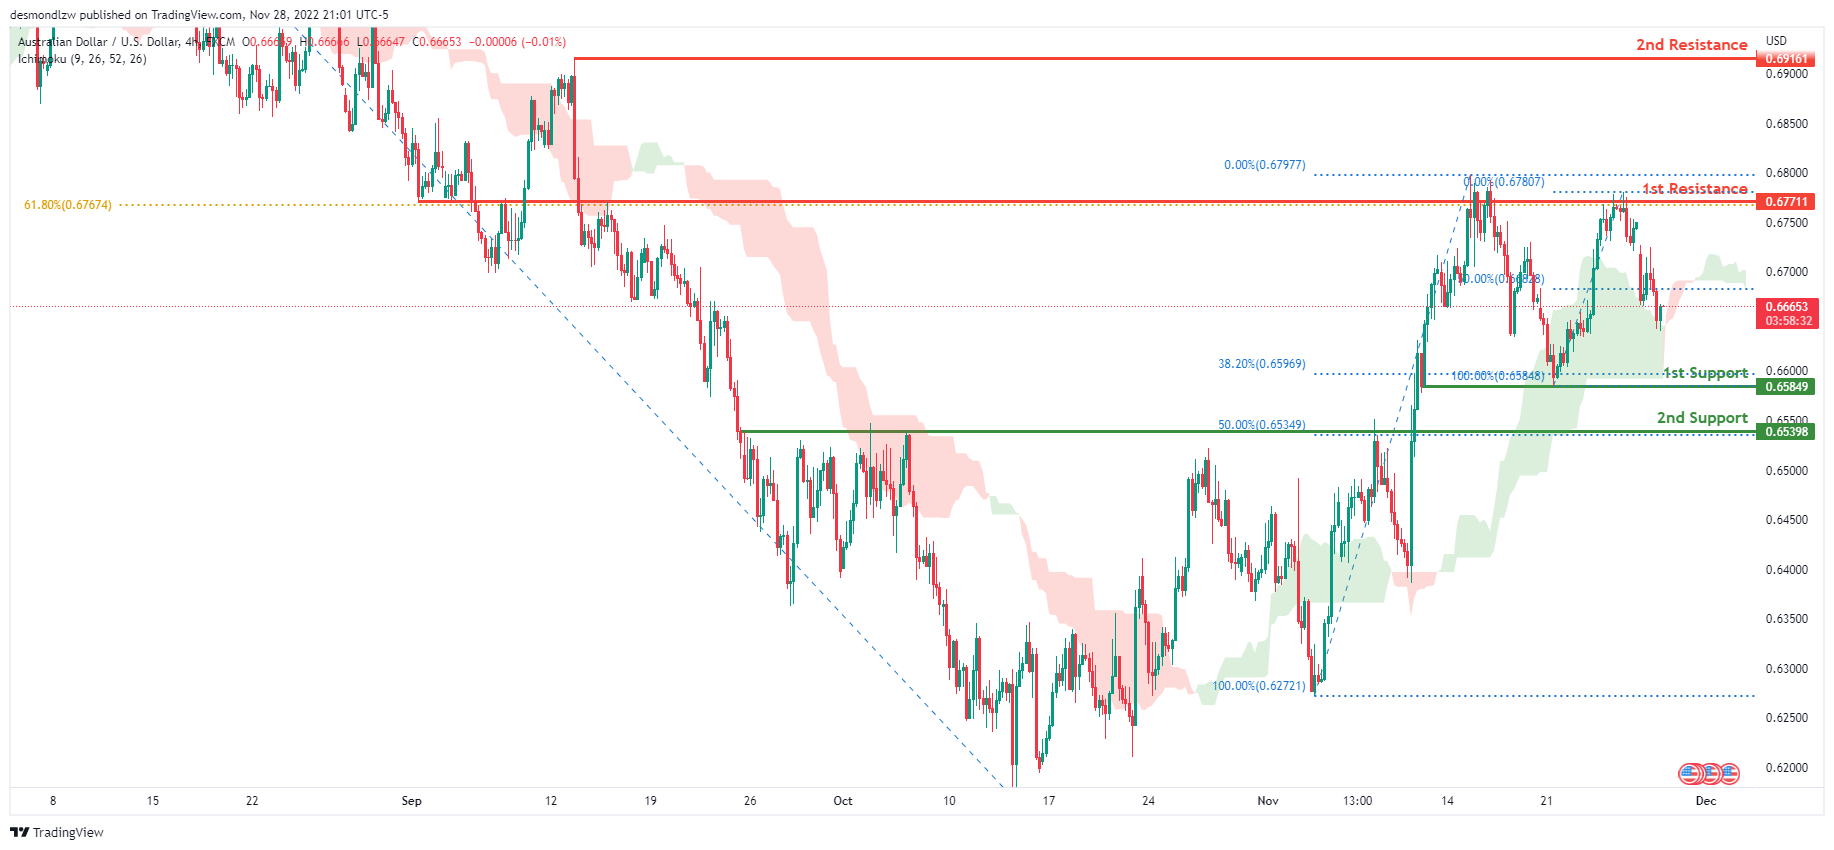
Looking at the H4 chart, my overall bias for ADUSD is bullish due to the current price being above the Ichimoku cloud, indicating a bullish market. Expecting price to continue heading towards the 1st resistance at 0.67711 where the 61.8% Fibonacci line is. If this 1st resistance line is broken, expect the price to head towards the 2nd resistance at 0.69161, where the previous swing high is. In an alternative scenario, price could possibly head back down to retest the 1st support line at 0.65849 where the 38.2% Fibonacci line is.
Areas of consideration
- H4, 1st resistance at 0.67711
- H4, 2nd resistance at 0.69161
- H4, 1st support at 0.65849
NZD/USD:
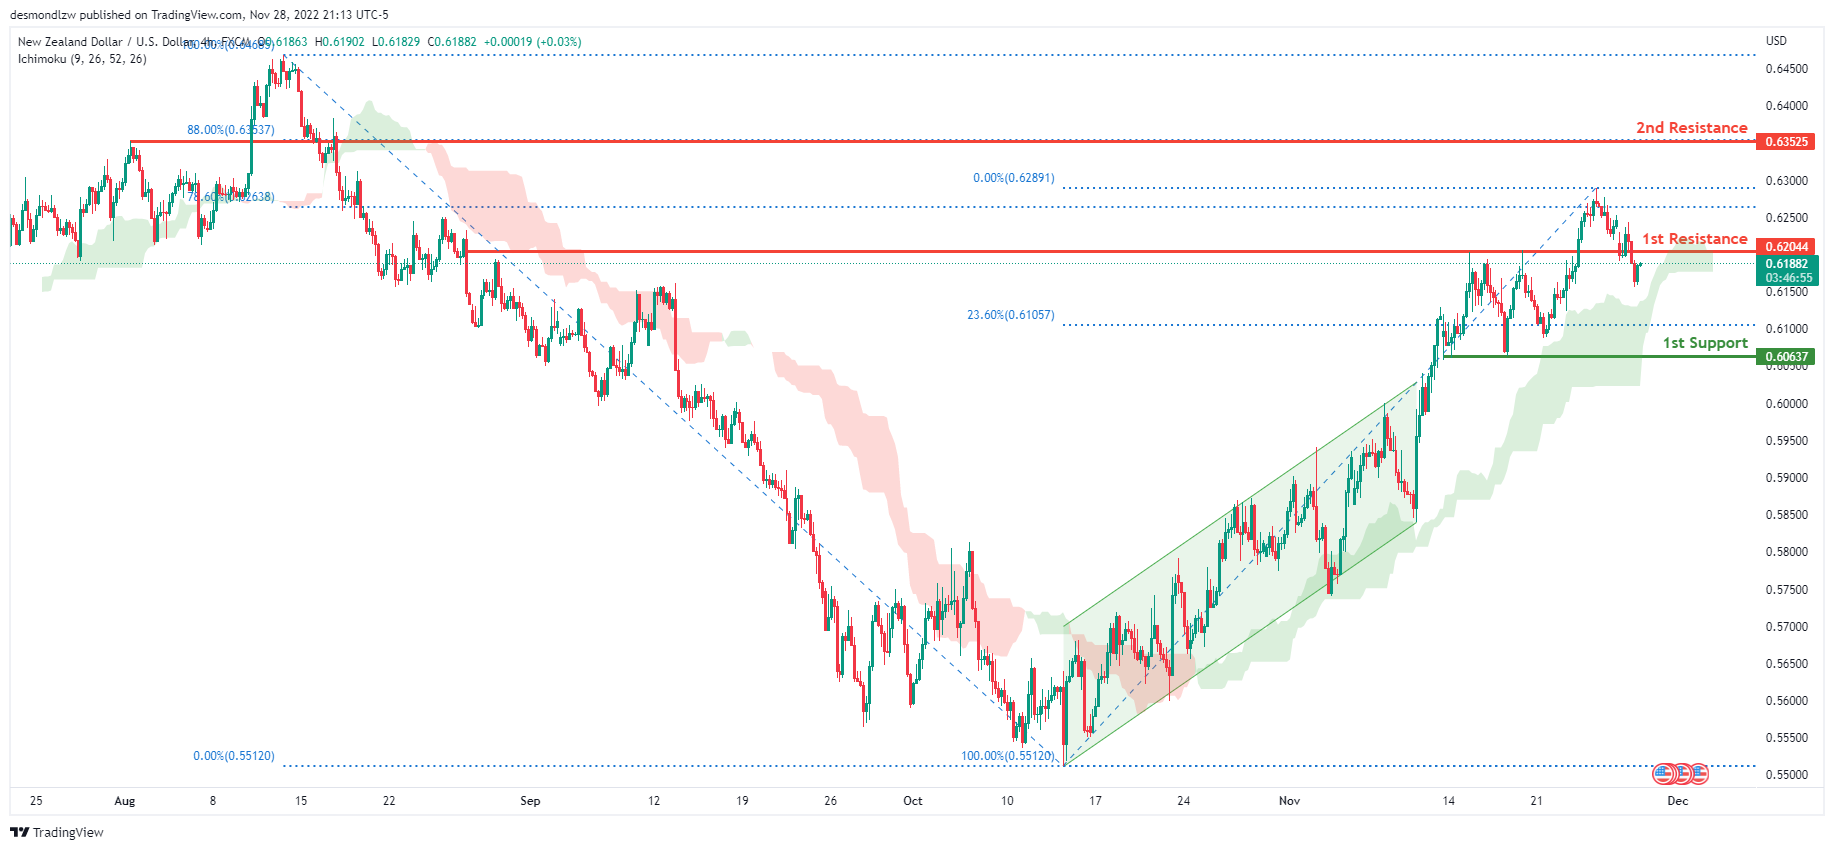
On the H4 chart, we have a bullish bias with the price moving above the Ichimoku cloud and has broken out of the ascending channel. If this bullish momentum continues, expect the price to continue heading towards the 1st resistance line at 0.62044, slightly below where the 78.6% Fibonacci line is. Alternatively, the price may head back down and retest the 1st support at 0.60637, where the previous swing low is.
Areas of consideration:
- H4 time frame, 1st resistance at 0.62044
- H4 time frame, 1st support at 0.60637
USD/CAD:
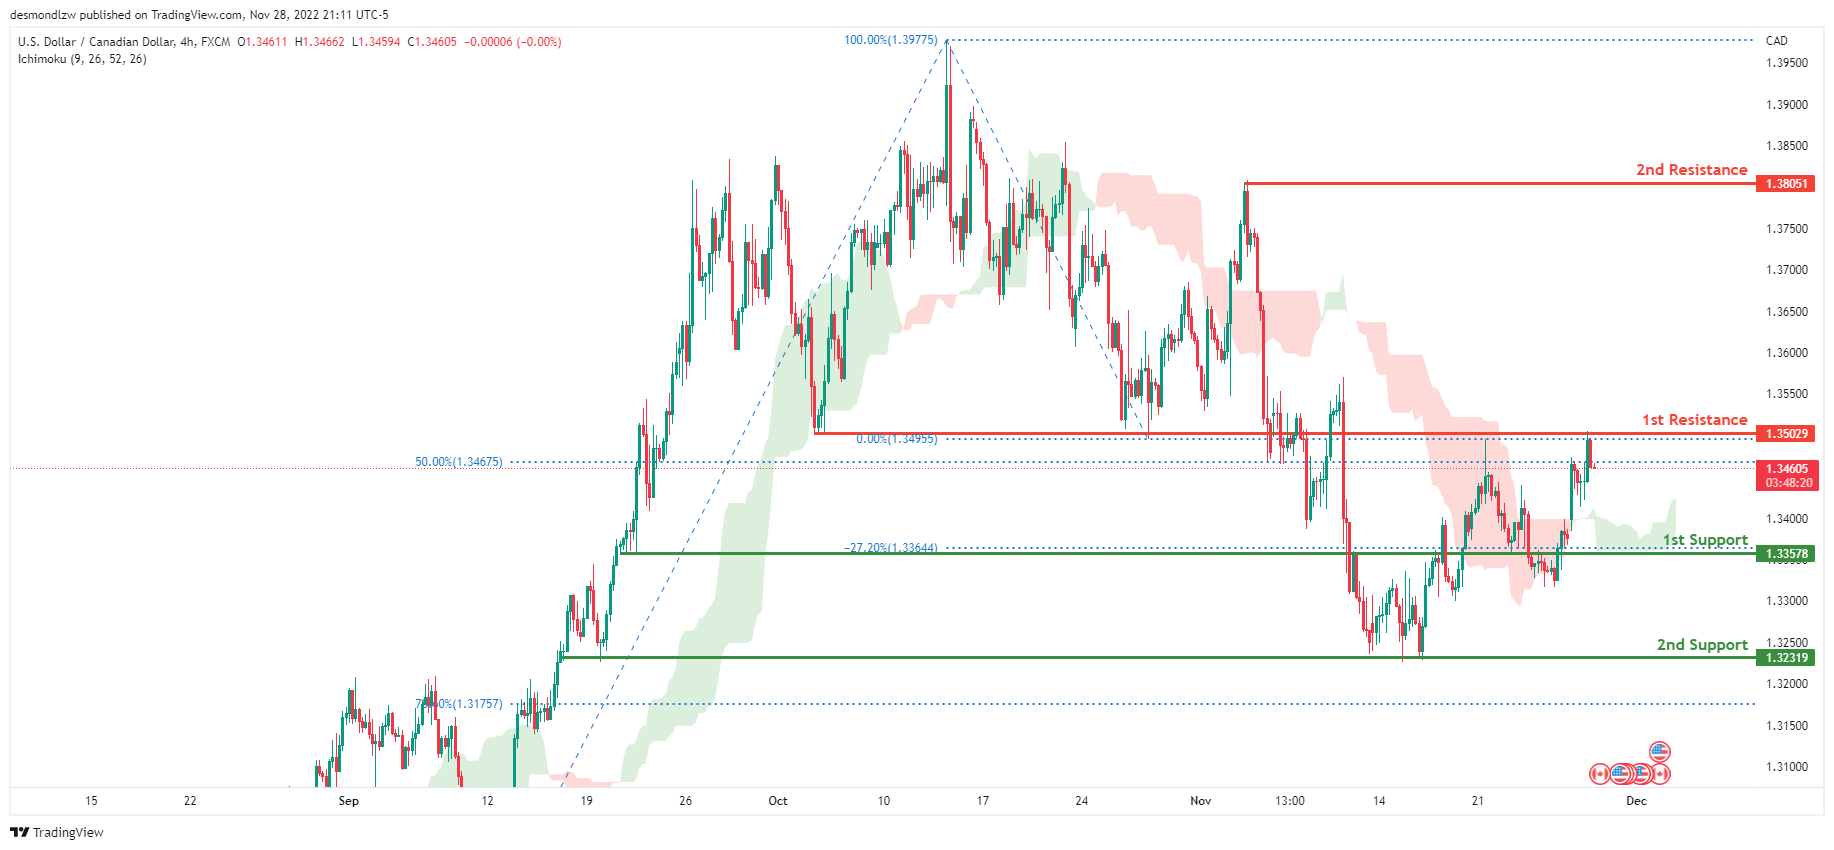
On the H4 chart, the overall bias for USDCAD is nullish . To add confluence to this, the price is above the Ichimoku cloud which indicates a bullish market. If this bullish momentum continues, expect the price to break the 1st resistance line at 1.35029, where the 50% Fibonacci line is located, before heading towards the 2nd resistance at 1.38051, where the previous swing high is. In an alternative scenario, price could head back down to retest the 1st support at 1.33578, where the -27.2% Fibonacci expansion line is.
Areas of consideration:
- H4 time frame, 1st resistance at 1.35029
- H4 time frame, 2nd resistance at 1.38051
- H4 time frame, 1st support at 1.33578
OIL:
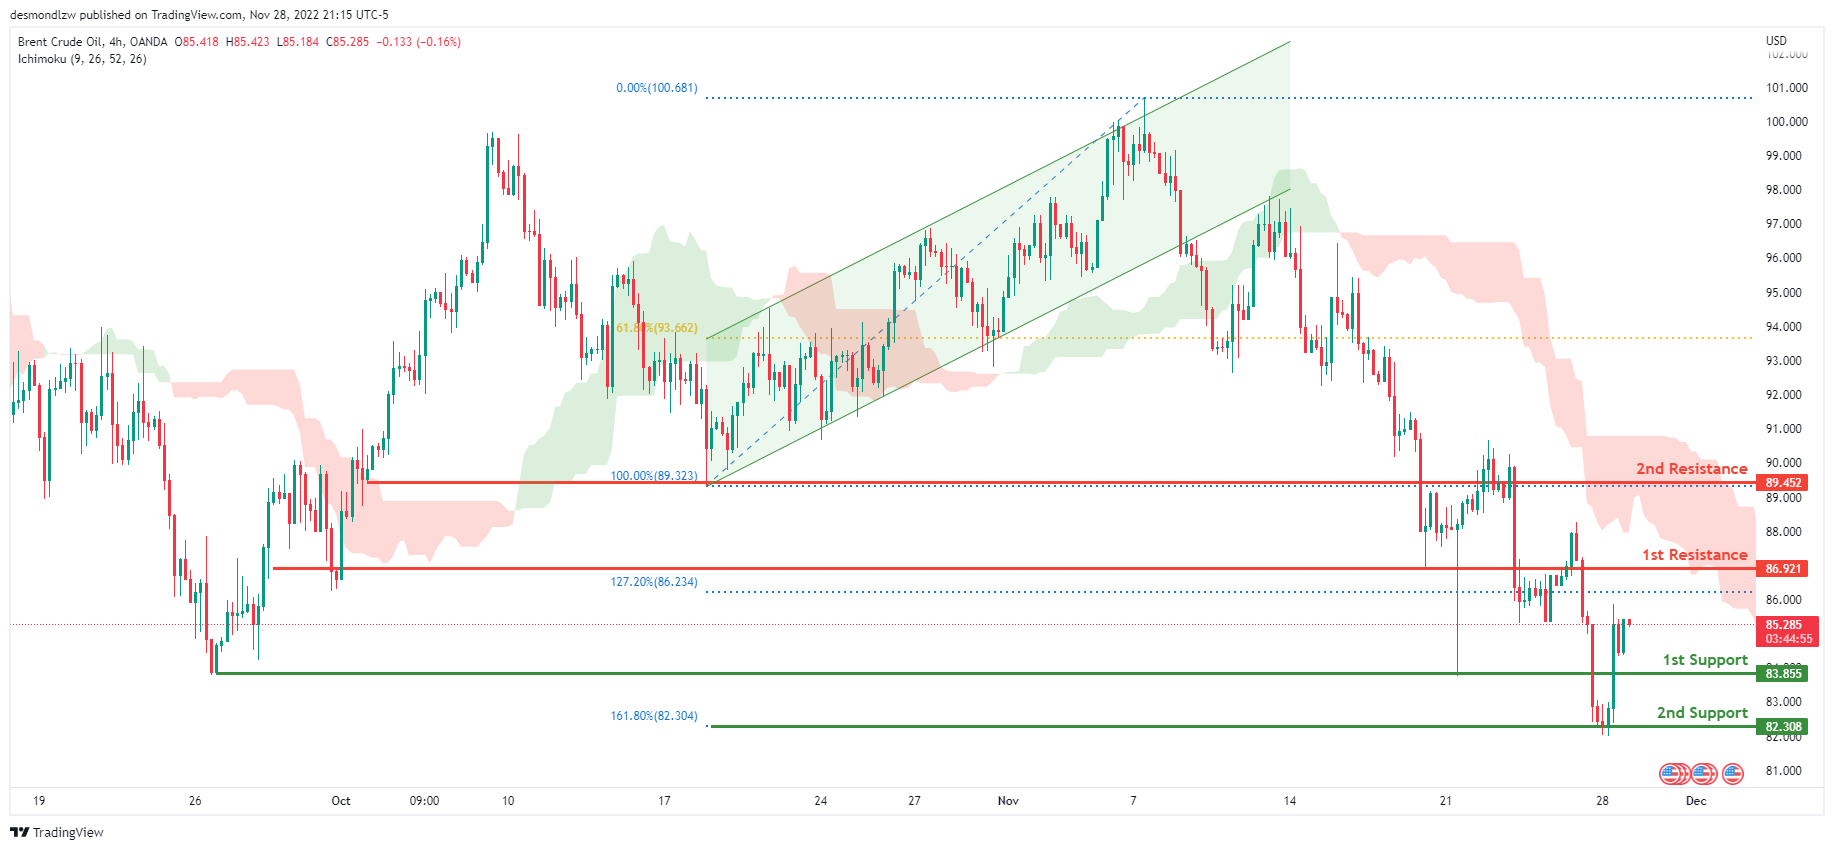
Looking at the H4 chart, my overall bias for BCOUSD is bearish due to the current price being below the Ichimoku cloud, indicating a bearish market. If this bearish momentum continues, expect price to possibly break the 1st support at 83.855, where the previous swing low is located, before heading towards the 2nd support at 82.308, where the 161.8% Fibonacci extension line is. In an alternate scenario, price could possibly head back up to retest the 1st resistance level at 86.921, where the 127.2% Fibonacci extension line is located. If this 1st resistance line is broken, expect the price to head towards the 2nd resistance line at 89.452, where the previous swing low is.
Areas of consideration:
- H4 time frame, 1st resistance at 86.921
- H4 time frame, 2nd resistance at 89.452
- H4 time frame, 1st support at 83.855
- H4 time frame, 2nd support at 82.308
Dow Jones Industrial Average:
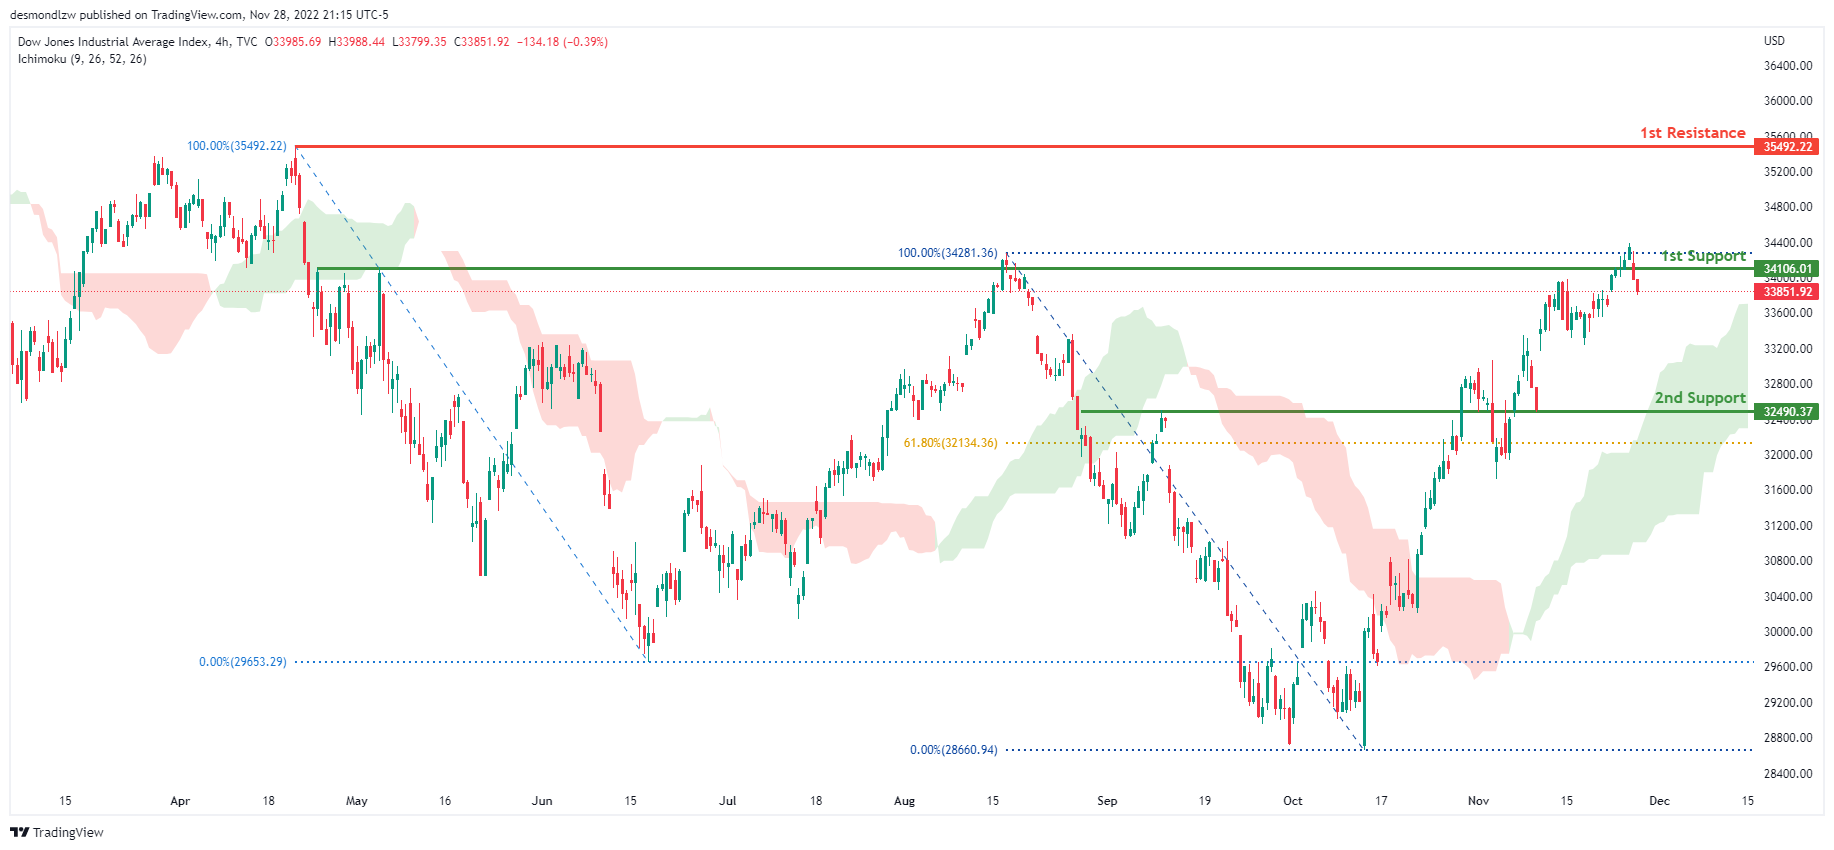
On the H4 chart, the overall bias for DJI is bullish. To add confluence to this, the price is above the Ichimoku cloud which indicates a bullish market. If this bullish momentum continues, expect the price to continue heading towards the 1st resistance line at 35492.22, where the previous swing high is. In an alternative scenario, price could head back down breaking the 1st support line at 34106.01, where the previous swing high is before heading towards the 2nd support at 32490.37, where the 61.8% Fibonacci line is.
Areas of consideration:
- H4 time frame, 1st support at 34106.01
- H4 time frame, 2nd support at 32490.37
- H4 time frame, 1st Resistance at 35492.22
DAX:
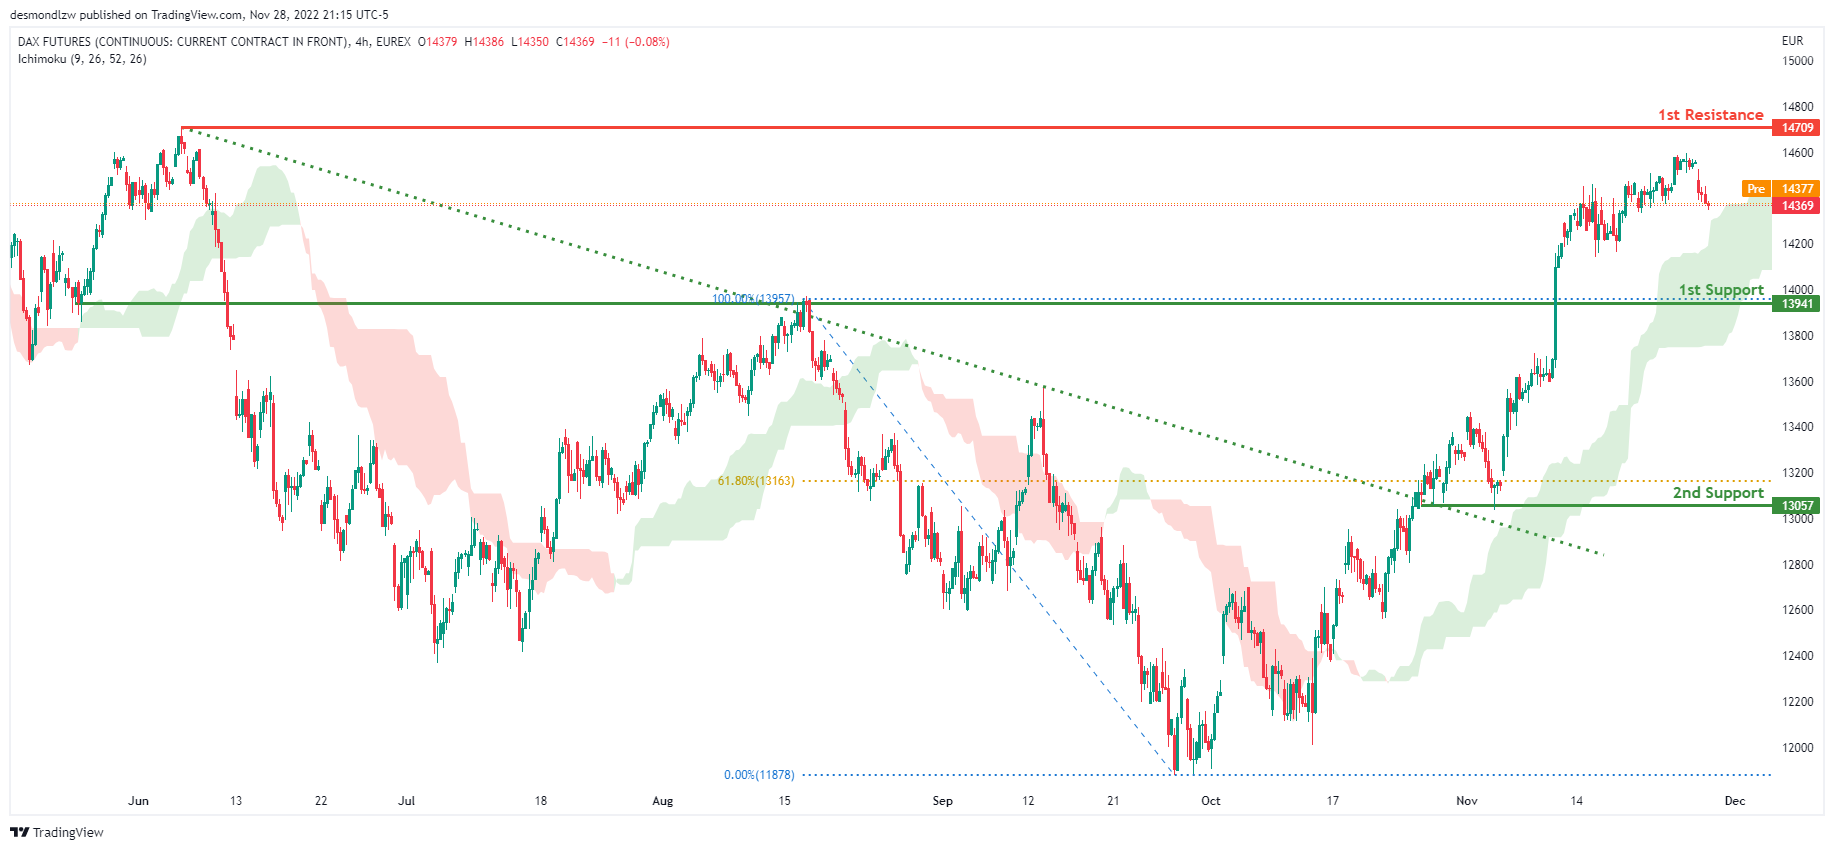
The H4 chart shows a bullish bias, with price breaking through the descending trendline and rising above the Ichimoku cloud. Price is expected to maintain its bullish momentum and rise to the first resistance level at 14709, where the previous swing high is located. Alternatively, the price could fall to the first support level at 13941, where the previous swing high was.
Areas of consideration:
- H4 time frame, 1st resistance is at 14709
- H4 time frame, 1st support is at 13941
ETHUSD:
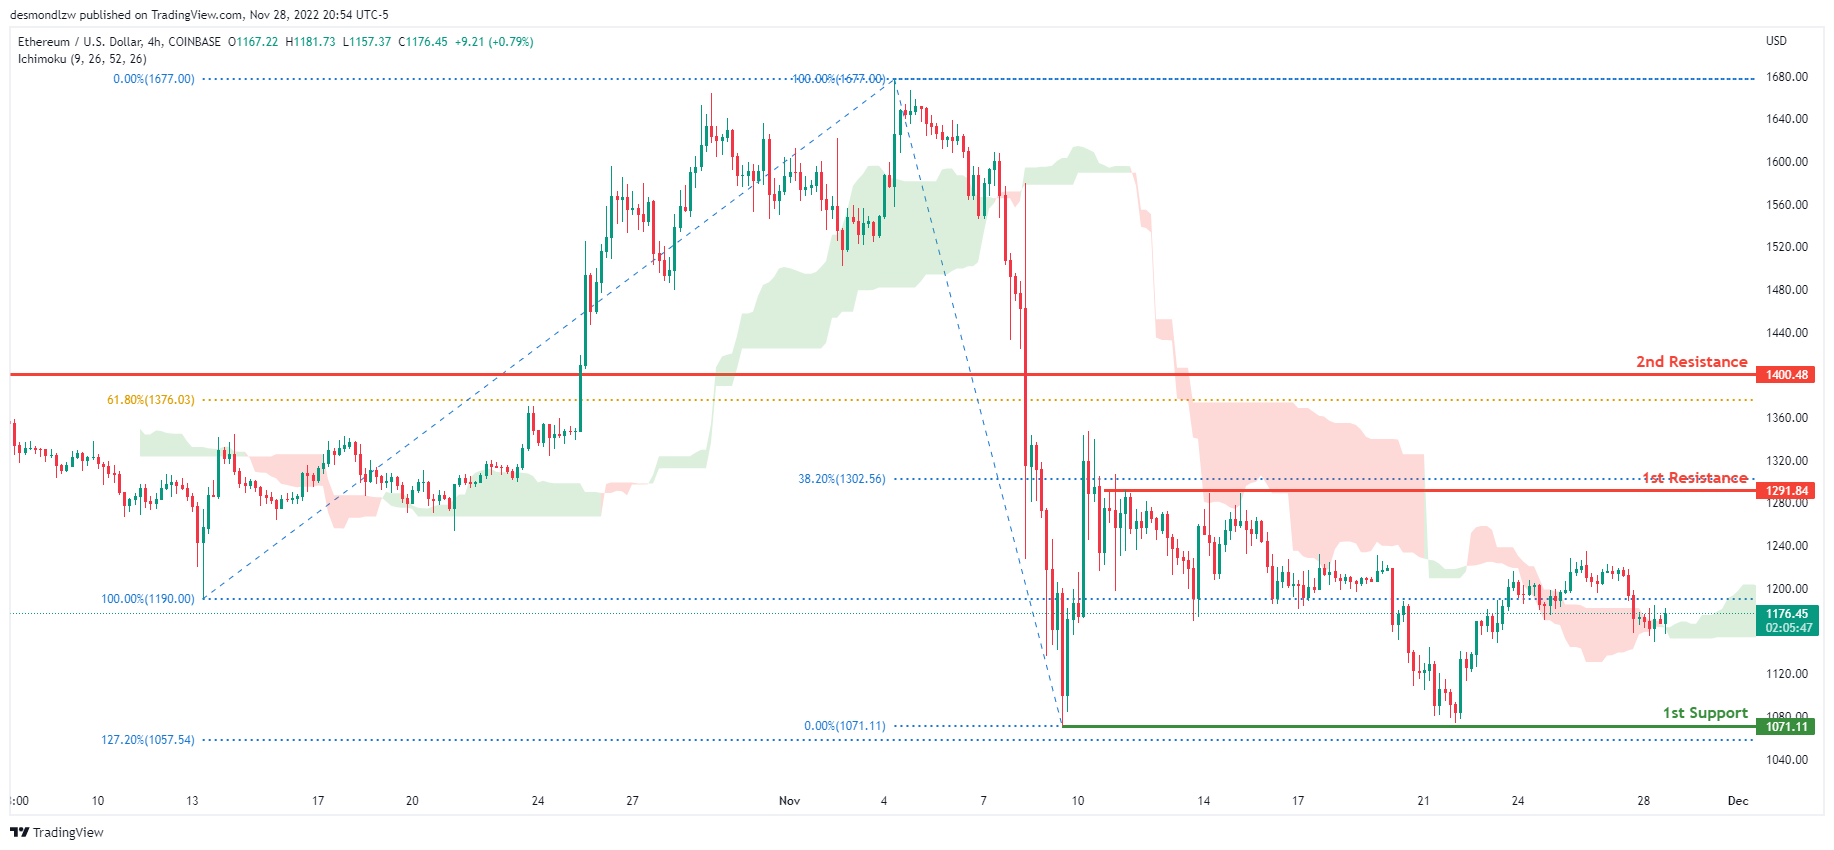
Looking at the H4 chart, my overall bias for ETHUSD is bearish due to the current price being below the Ichimoku cloud, indicating a bearish market .If this bearish momentum continues, expect price to possibly head towards the 1st support at 1071.11, where the -previous swing low is located. In an alternate scenario, price could possibly head back up towards the 1st resistance level at 1291.84, where the 38.2% Fibonacci line is located.
Areas of consideration:
- H4 time frame, 1st resistance of 1291.84
- H4 time frame, 1st support at 1071.11
BTCUSD:
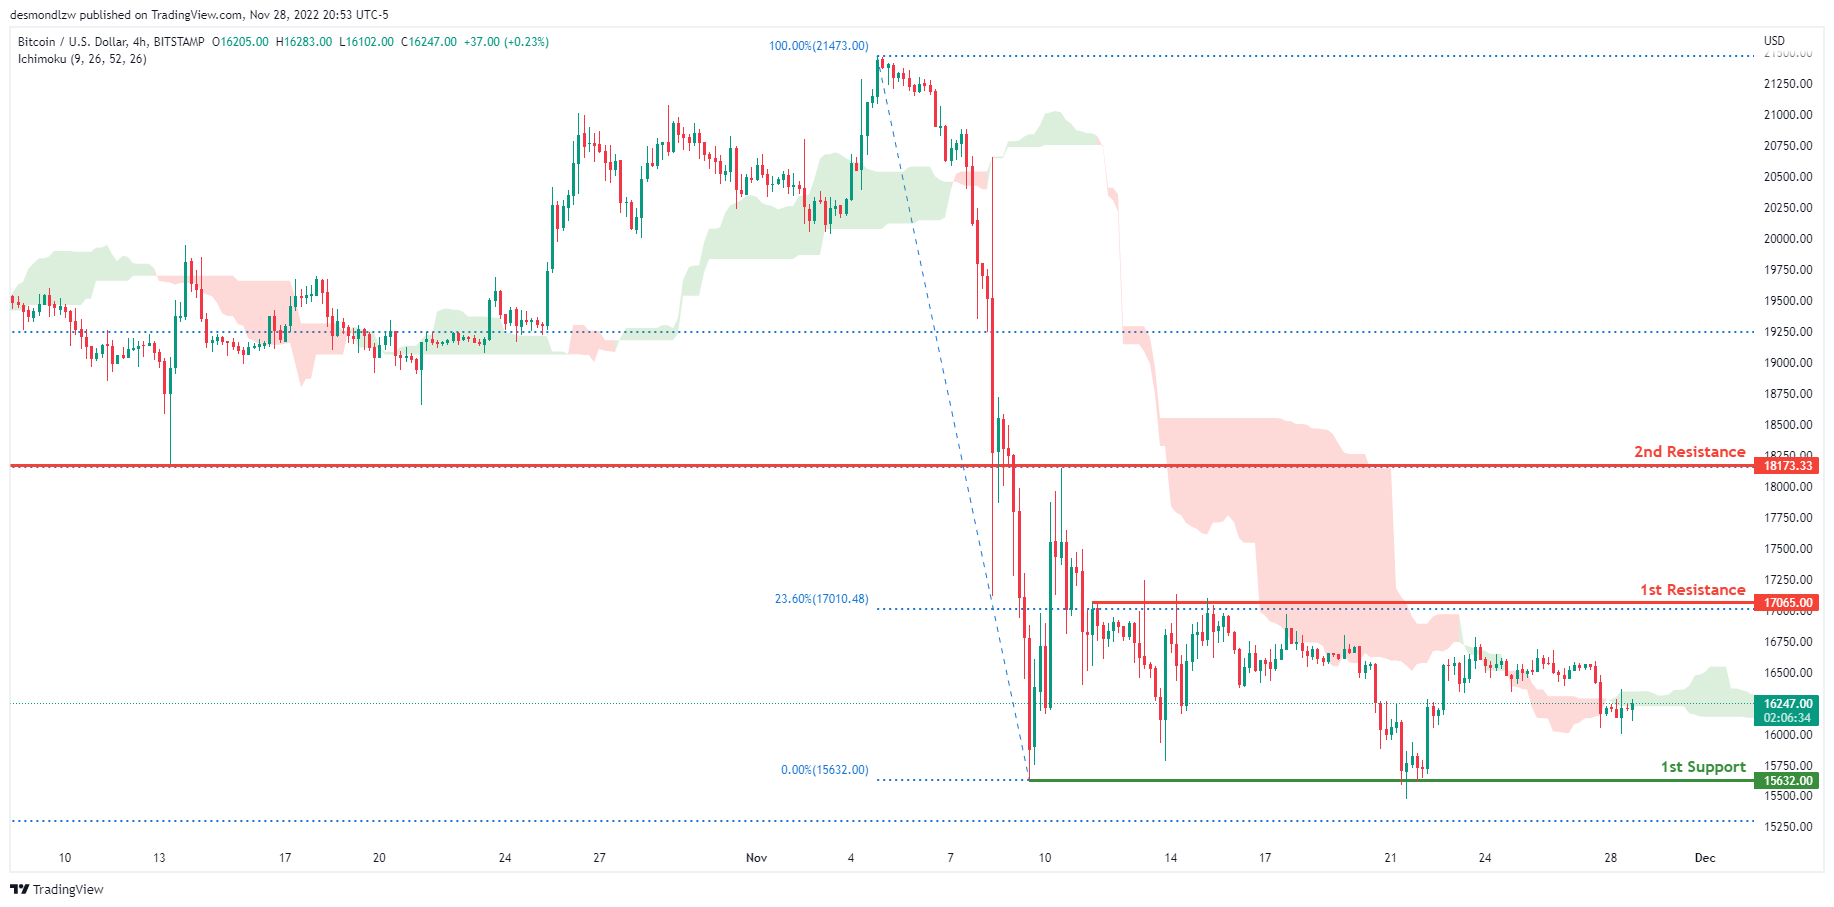
On the H4 chart, the overall bias for BTCUSD is bearish. To add confluence to this, the price is below the Ichimoku cloud which indicates a bearish market. If this bearish momentum continues, expect the price to head towards the 1st support line at 15632.00, where the previous swing low is located. In an alternative scenario, price could head back up to retest the 1st resistance line at 17065.00, where the 23.6% Fibonacci line is located.
Areas of consideration:
- H4 time frame, 1st resistance 17065.00
- H4 time frame, 1st support at 15632.00
S&P 500:
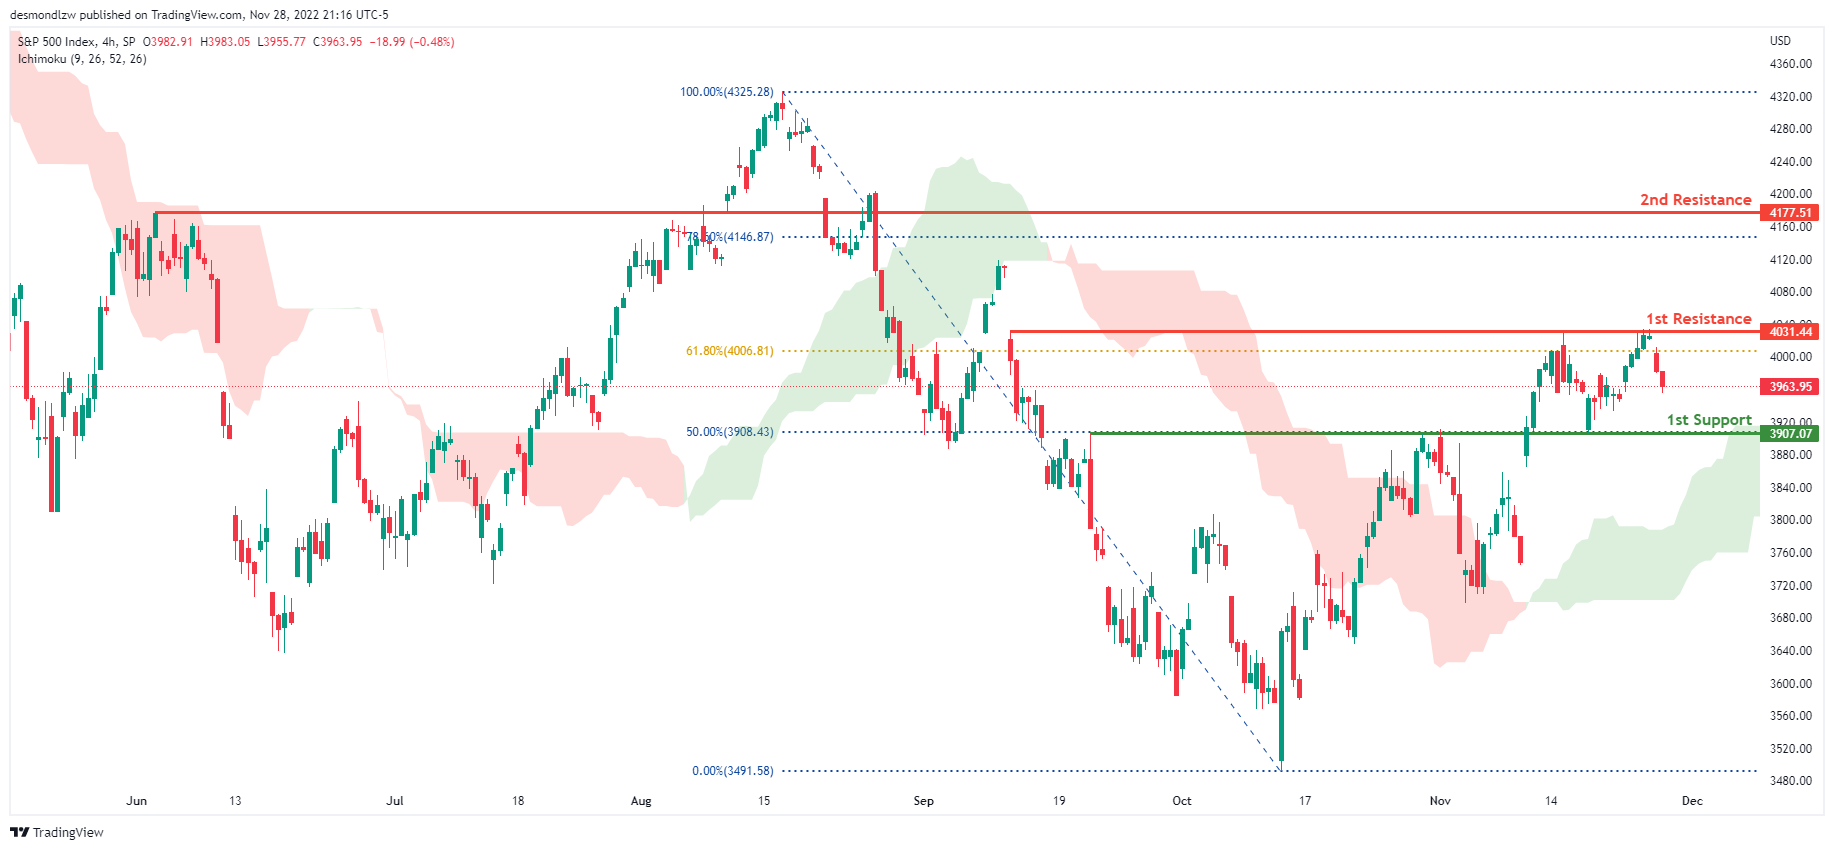
The overall bias for the S&500 on the H4 chart is bullish, with prices above the Ichimoku cloud. If the bullish momentum continues, the price will rise to the first resistance line at 4031.44, where the 61.8% Fibonacci line is located. If the first resistance line is broken, the second resistance line is at 4119.28, which is the previous swing high and the 78.6% Fibonacci line. In an alternate scenario, price could return to the first support line at 3907.07, where the 50% Fibonacci line is located.
Areas of consideration:
- H4 time frame, 1st support at 3907.07
- H4 time frame, 1st resistance at 4031.44
- H4 time frame, 2nd resistance at 4119.28
NZIER: RBNZ rate to peak at 5% next year
In the November Monetary Policy Statement, RBNZ projected that interest rate would peak at 5.5% while the economy would start contracting in Q2 2023 until Q1 2024.
NZIER said it expected the negative impact of higher interest rates on demand will "become more apparent around mid-2023". With that, RBNZ "will not need to increase interest rates by as much as it currently expects to".
"Nonetheless, we expect further increases in the OCR and for it to peak at 5 percent over the coming year," NZIER added.
Fed Barkin supportive of slower, but probably longer and potentially high tightening
Richmond Fed President Thomas Barkin said in an interview yesterday, "I'm very supportive of a (tightening) path that is slower, probably longer and potentially higher than where we were before."
"It is helpful to be somewhat more cautious as you are in restrictive territory," he said. "It is a better risk-management approach."
"Inflation has been stubborner than I would like," he said. "As long as inflation stays elevated, that makes the case to me that we need to do more."
Fed Williams: Restrictive policy to continue through at least next year
New York Fed President John Williams said yesterday, "Inflation is far too high, and persistently high inflation undermines the ability of our economy to perform at its full potential... There is still more work to do."
"I do think we're going to need to keep restrictive policy in place for some time; I would expect that to continue through at least next year," he added.
Nevertheless, "at some point, nominal interest rates will need to come down. Otherwise real interest rates will be going up and that would just be tightening policy further and further in terms of its effects on the economy... I do see a point, probably in 2024, that we'll start bringing down nominal interest rates because inflation is coming down and we would want to have real interest rates appropriately positioned."
Fed Bullard: Strong labor market gives us license to pursue disinflationary strategy
St. Louis Fed President James Bullard reiterated yesterday that interest rate has to be raised to at least 5.00-5.25%, from the current 3.75-4.00%, to be "sufficiently restrictive" to curb inflation. The interest rate will have to stay at that level "all during 2023 and into 2024".
But regarding the size of the next hike in December, Bullard said he would leave the exact tactics to Chair Jerome Powell. "In macroeconomic terms I'm not sure it matters that much at exactly which date we get there or what meeting we get there (the terminal rate)", he said. "Generally speaking I have advocated that sooner is better, that you do want to get to the right level of the policy rate for the current data and the current situation, but I would defer to the chair as to how he wants to play the tactics on this."
"I do think that the fact that the labor market is so strong gives us license to pursue our disinflationary strategy now and try to get the inflation under control right now so we don't replay the 1970s where the FOMC at that time took 15 years to get inflation under control," Bullard noted.
US Jobs Data and Powell’s Speech Eyed as Dollar Rally Stalls
There’s a storm of critical events this week that will shape the US dollar’s trajectory, including a speech by the Fed boss on Wednesday and the latest employment report on Friday. The Fed chief could strike a hawkish tone, while most indications suggest the US labor market is still in good shape. As for the dollar, even though the rally has stalled lately, a trend reversal is probably a story for next year.
Dollar loses its shine
It’s been a tough couple of months for the US dollar, which has surrendered almost half the gains it recorded this year, as some early signs that inflation has started to simmer down saw traders unwind bets that the Fed will push interest rates above 5% this cycle.
While the inflation landscape hasn’t changed so dramatically, investors seem to be placing emphasis on several leading indicators suggesting the US economy is losing steam, betting that this will prevent the Fed from raising rates much further. Gloomy business surveys, high inventory levels, a softening housing market, low consumer morale, and a deeply inverted yield curve are all classic warnings of trouble ahead.
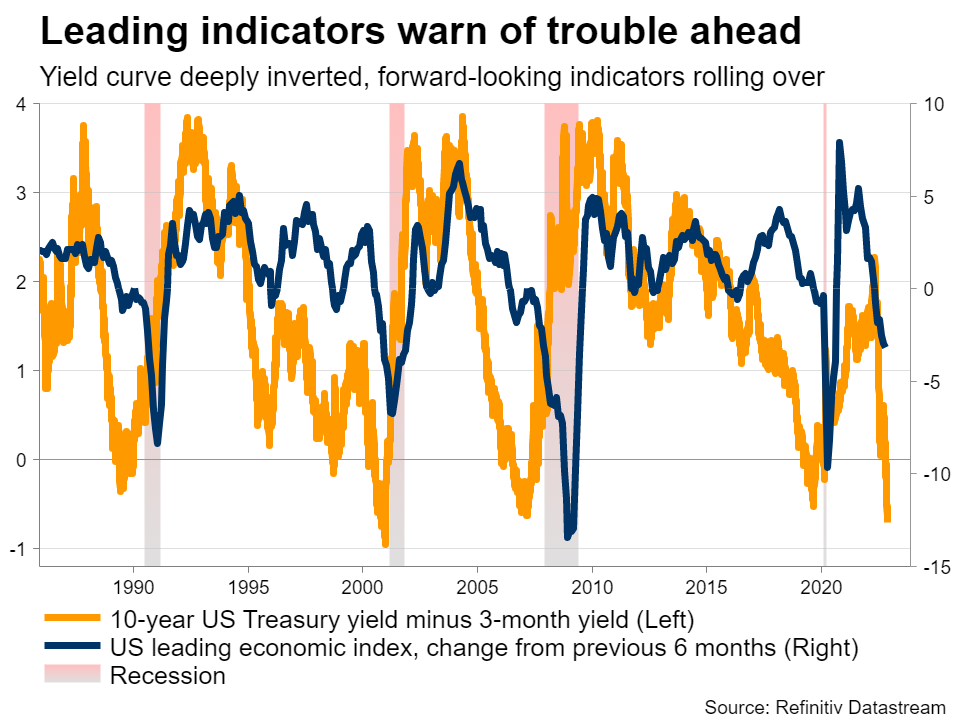
Nevertheless, this weakness hasn’t been reflected in ‘official’ data yet. Consumption remains solid, the Atlanta Fed GDPNow tracker points to annualized growth of 4% this quarter, and the labor market is still near full employment. This durability means the Fed cannot back down yet, despite mounting evidence that the economy might struggle next year.
Powell and nonfarm payrolls
This week, the show will get started with a speech from Fed chief Powell at 18:30 GMT Wednesday, where he is likely to highlight his unwavering commitment to getting inflation under control. Markets have been trading as if the inflation war has been won, with yields sliding and stocks rallying lately, which is counter-productive for the Fed as it neutralizes the impact of its rate increases.
Therefore, Powell might take the opportunity to push back and remind investors that the tightening cycle still has some ways to go, stressing that rates will stay elevated for some time. This has been the playbook all year - whenever financial conditions loosen excessively, Powell hits back.
Turning to the data, Wednesday will bring the second estimate of GDP for Q2 and the ADP jobs report for November. Then on Thursday, personal income and consumption numbers are due out, alongside the core PCE price index and the latest ISM manufacturing index. The week will conclude with the jobs report for November and the ISM services survey on Friday.
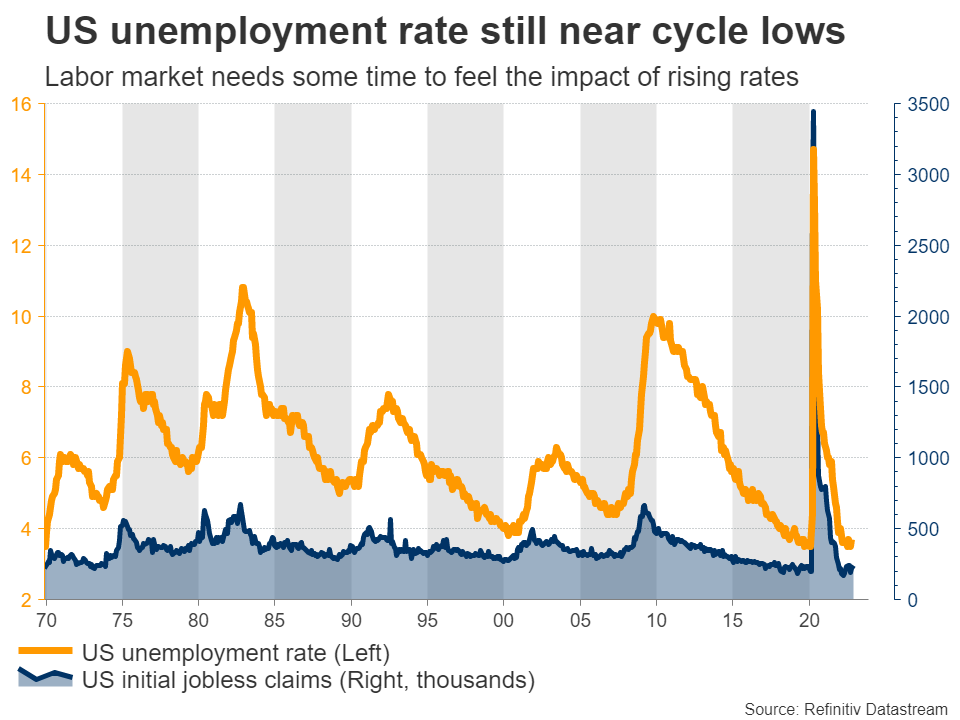
Nonfarm payrolls are expected at 200k in November, slightly softer than the 261k in October but still a healthy number overall. The unemployment rate is seen unchanged at 3.7%, while wage growth is projected to have cooled a little both in monthly and yearly terms.
Labor market indicators softened during the month, but not much. Business surveys revealed a marginal increase in workforce numbers while seekers of unemployment benefits increased a touch, albeit not enough to signal any massive disappointment in this data. It will likely take a few more months before the labor market truly feels the heat of higher rates.
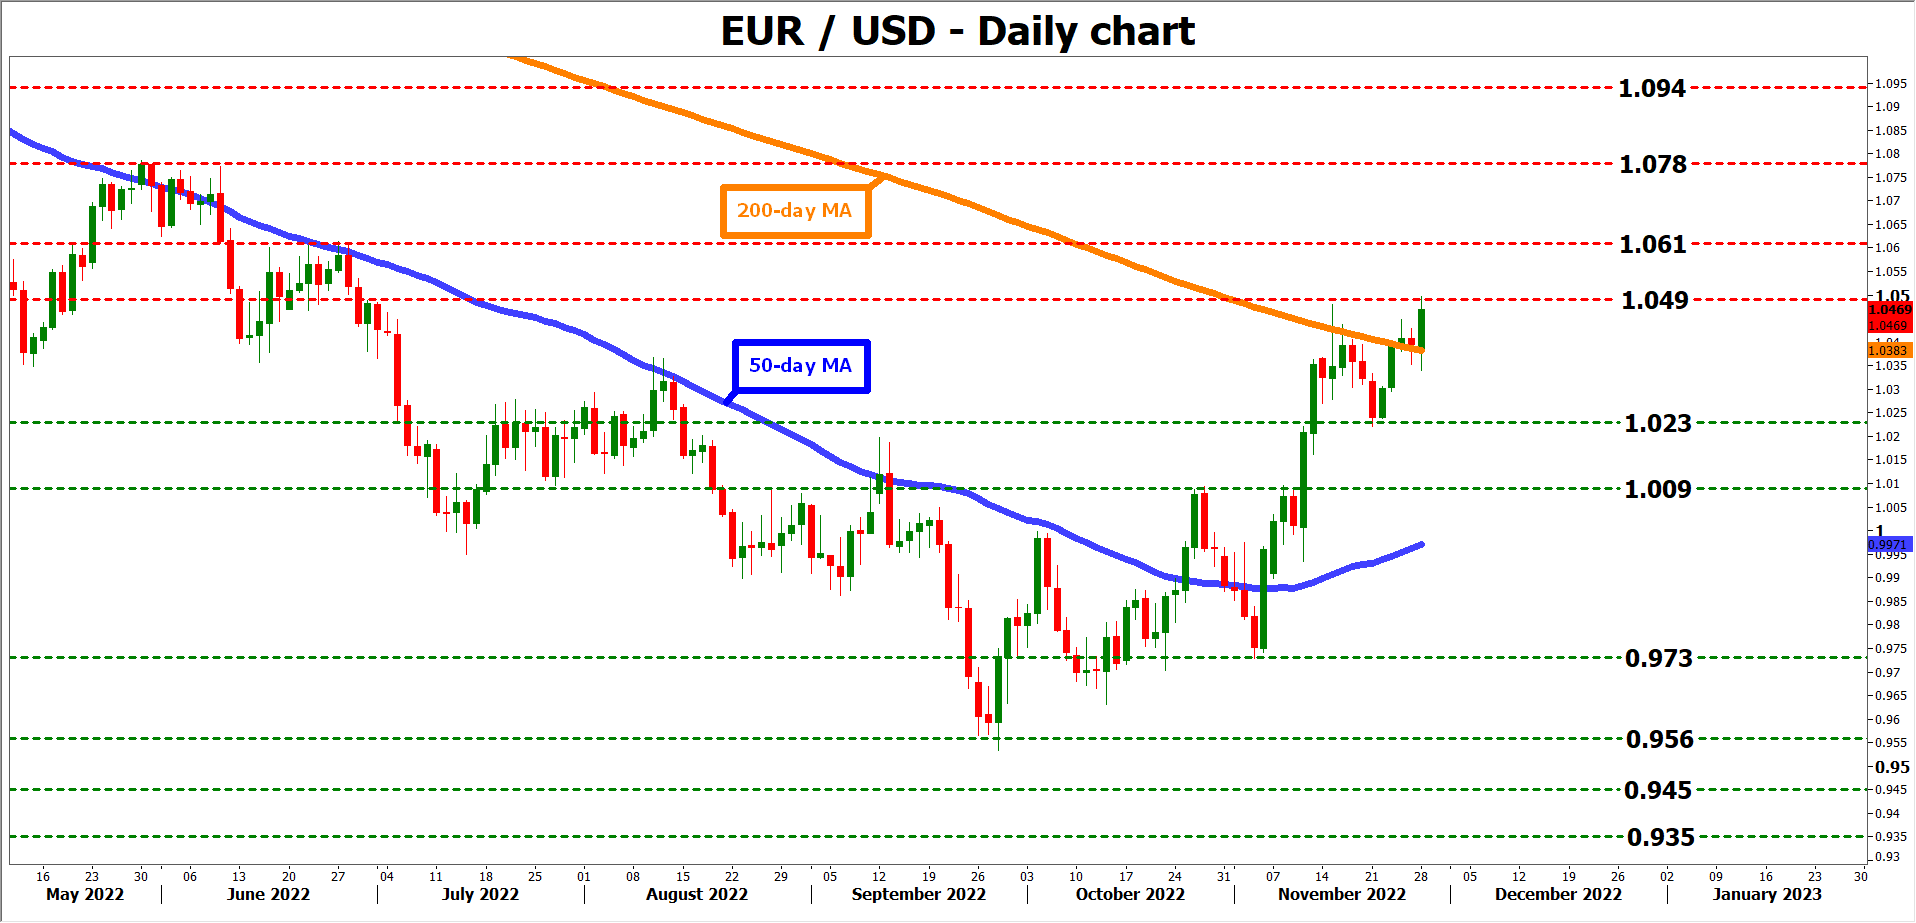
From a technical standpoint, a soft report could propel euro/dollar above the 1.0490 region, opening the door towards 1.0610. On the other hand, another solid dataset might pressure the pair lower, with the first major support barrier being the 1.0230 zone.
Dollar reversal?
All told, even though some of the elements that fueled this ferocious dollar rally seem to be losing their kick, for instance with US inflation cooling off, it is still too early to call for a proper trend reversal.
The argument is simple - other major economies such as the Eurozone and United Kingdom will probably fall into recession long before America does. Business surveys suggest these economies might be in a downturn already, while the US likely needs a few more quarters to get there thanks to its resilience to the energy shock.
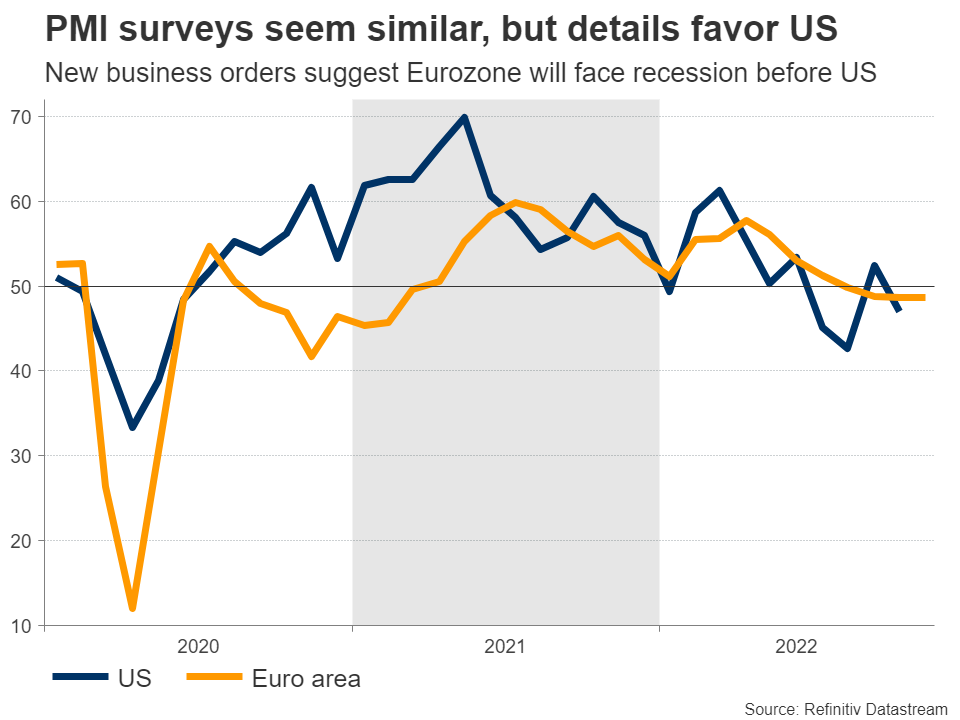
Historically speaking, powerful dollar rallies don’t end while the outlook for global growth is deteriorating, as safe-haven flows keep the reserve currency in demand. Hence, while this rally seems to be entering its final chapters, the prospect of a reversal remains premature for now, and possibly a story for next year.
GBP/USD Eyes Fresh Rally, Dollar Dips Further
Key Highlights
- GBP/USD is holding gains above the 1.2000 support zone.
- It is trading above a key bullish trend line with support near 1.1960 on the 4-hours chart.
- Crude oil price declined heavily and tested the $74.20 support zone.
- EUR/USD started a fresh increase and climbed above 1.0400.
GBP/USD Technical Analysis
The British Pound started a fresh increase above the 1.1800 resistance against the US Dollar. GBP/USD even cleared the 1.2000 resistance to move into a positive zone.
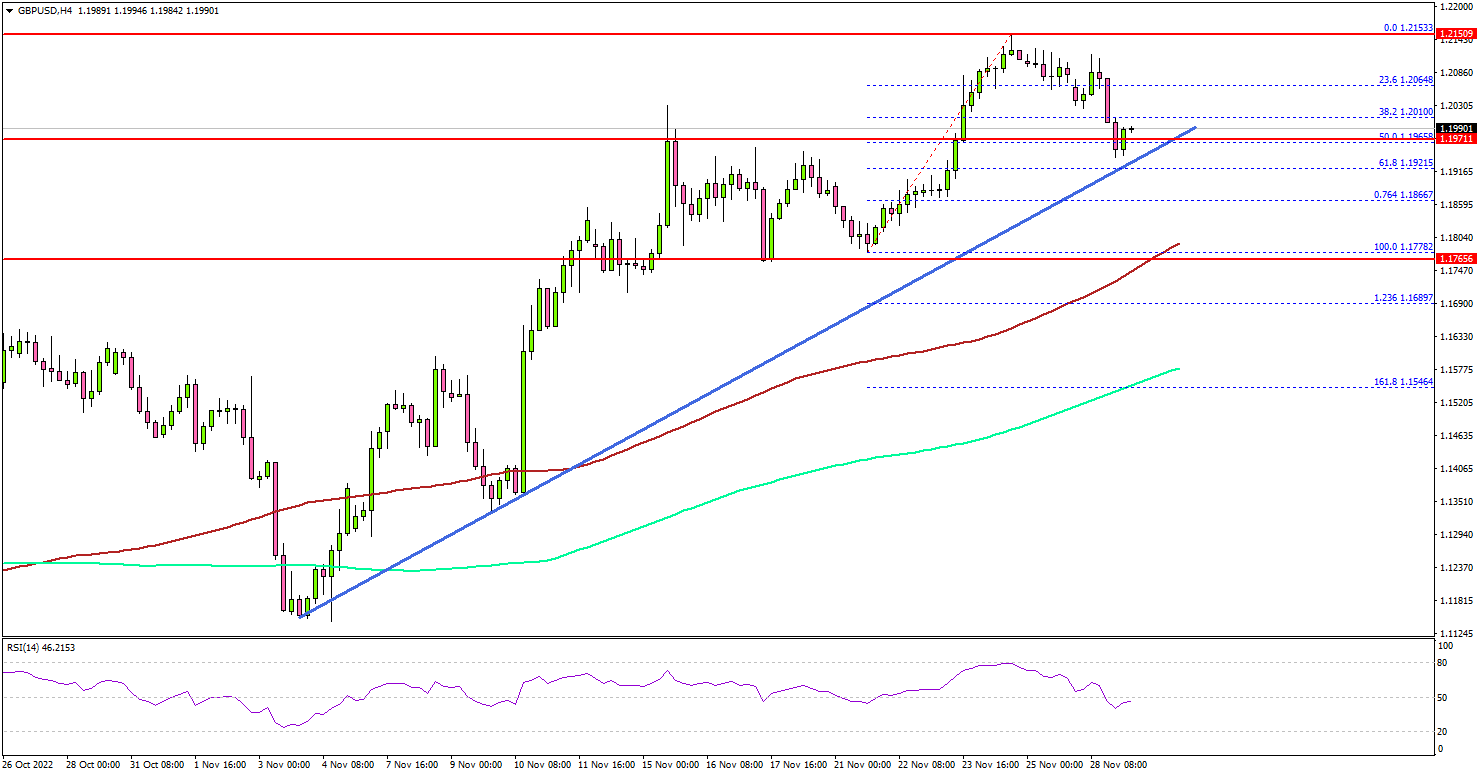
Looking at the 4-hours chart, the pair settled above the 1.2000 level, the 100 simple moving average (red, 4-hours) plus the 200 simple moving average (green, 4-hours).
It traded to a new multi-week high at 1.2153 before there was a minor downside correction. An initial support is near the 1.2000 level. The next major support is near the 1.1960 zone. There is also a key bullish trend line forming with support near 1.1960 on the same chart.
Any more losses might send the pair towards the 1.1850 support zone. On the upside, the pair might gain bullish momentum once it settles above the 1.2150 level.
In the stated case, GBP/USD may perhaps test the 1.2250 resistance. The next major resistance may perhaps be near 1.2380. Any more gains could set the pace for a move towards the 1.2500 resistance zone.
Looking at EUR/USD, the pair remained well bid above the 1.1300 level and might continue to rise towards the 1.1500 resistance zone.
Economic Releases
- German Consumer Price Index for Nov 2022 (YoY) (Prelim) – Forecast +10.3%, versus +10.4% previous.
- German Consumer Price Index for Nov 2022 (MoM) (Prelim) – Forecast -0.2%, versus +0.9% previous.
- US Housing Price Index for Sep 2022 (MoM) - Forecast -0.7%, versus -0.7% previous.
- Canadian Gross Domestic Product for Q3 2022 (Annualized) – Forecast +3.5%, versus 3.3% previous.
CADJPY Wave Analysis
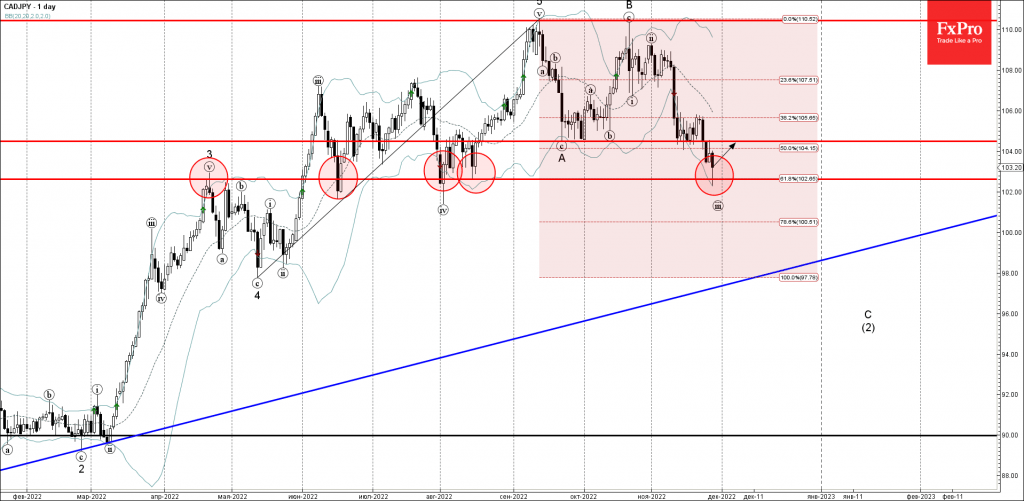
- CADJPY reversed from support level 102.65
- Likely to rise to resistance level 104.50
CADJPY just recently reversed up from the major support level 102.65 (former strong resistance from April, which has been reversing this currency pair from the middle of July, as can be seen below), standing near the daily Bollinger Band and by the 61.8% Fibonacci correction of the upward impulse from May.
The upward reversal from the support level 102.65 stopped the previous short-term impulse wave (iii).
CADJPY can be expected to rise further in the active impulse wave (3) toward the next resistance level 104.50 (former monthly low from September).
Dow Jones Wave Analysis
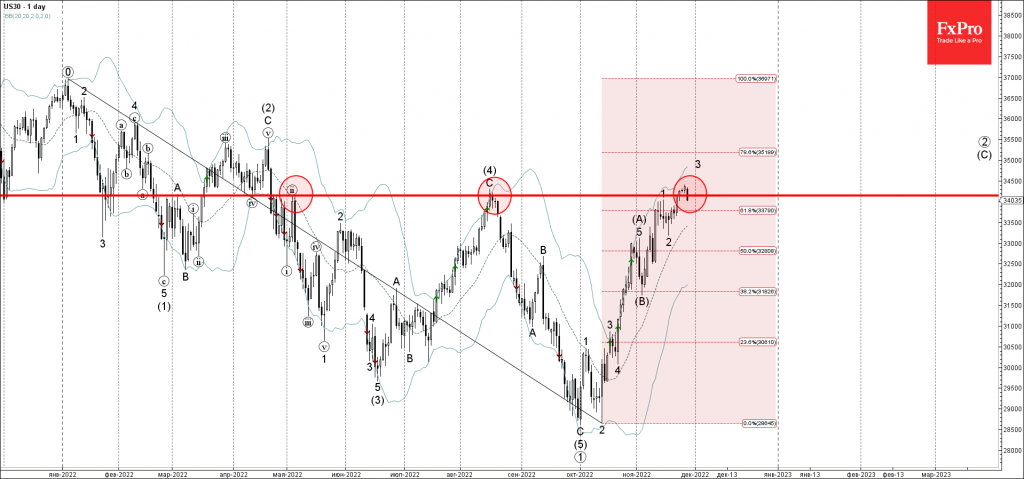
- Dow Jones reversed from resistance level 34145.00
- Likely to fall to support level 33500.00
Dow Jones index just reversed down from the long-term resistance level 34145.00 (previous monthly high from May and August), strengthened by the nearby upper daily Bollinger Band.
The downward reversal from the resistance level 34145.stopped the previous short-term impulse wave 3, which belongs to the intermediate impulse wave (C) from the start of November.
Given the strength of the resistance level 34145.00, Dow Jones index can be expected to fall further toward the next support level 33500.00.