Sample Category Title
Dollar Ready for a Rebound as Risk Rally Loses Momentum
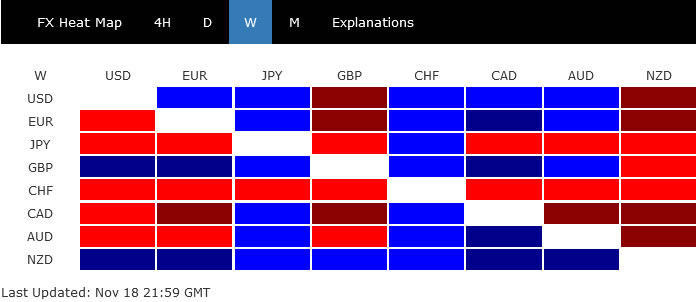
The post-CPI selloff in Dollar and rally in US stocks faded last week, after Fed officials talked down the significance of just one data point. While the greenback still lacked momentum for sustainable recovery, selloff has at least slowed. The greenback ended the week mixed together with Euro.
On the one hand New Zealand Dollar was the best performer, as traders look forward to a jumbo 75bps hike by RBNZ. Sterling followed as second, with no disastrous response to the UK government's new budget. Swiss Franc and Yen were the weakest ones while Canadian dollar followed, as weighed down by falling oil prices.
Looking ahead, there is prospect of finally a stronger rebound in Dollar, considering the risk of a near term pull back in stocks, and recovery in yields. Also, retreat in gold price and extended decline in oil could give the greenback a helping hand.
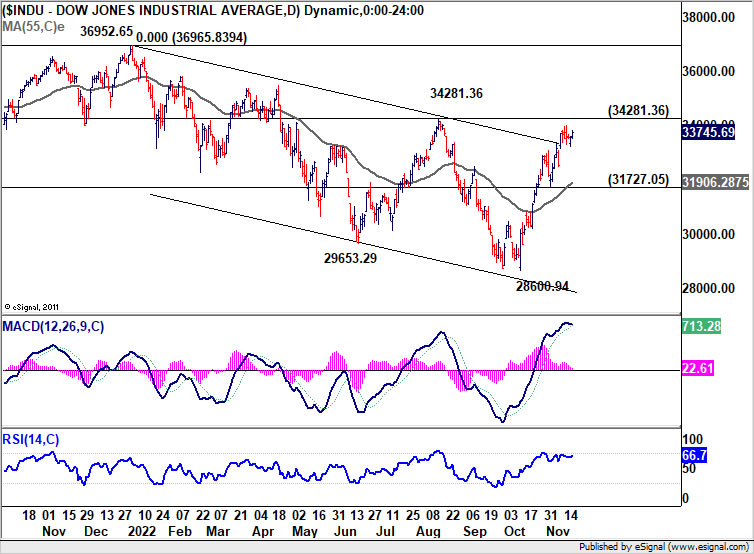
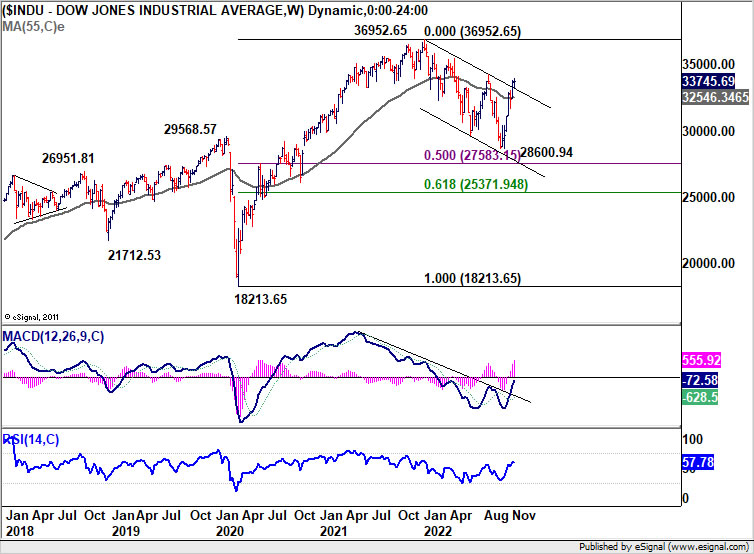
DOW losing upside momentum as Fed hawks returned
Rally in the US stock markets started to lost momentum after a chorus of Fed officials emphasized not to over interpret just one month of inflation data. Tightening is set to continue, and interest rates will stay at "sufficiently restrictive" levels until inflation shows sign of returning to target sustainably. So what is "sufficiently restrictive"? According to St. Louis Fed President James Bullard, rates could be anywhere between 5%-7%.
DOW closed the week nearly flat after engaging in sideway trading in very tight range. It's starting to lose upside momentum slightly as seen in daily MACD. While further rise cannot be ruled out, upside is likely to be limited by 34281.36 resistance on first attempt to bring a pull back. That could start to happen in the coming week or two.
But overall, near term bullish outlook will remain in favor as long as 31727.05 support holds. That is, corrective pattern from 36952.65 has completed with three waves down to 28600.94. Firm break of 3481.36 will pave the way to retest 36952.65. That might happen in the early part of next year.
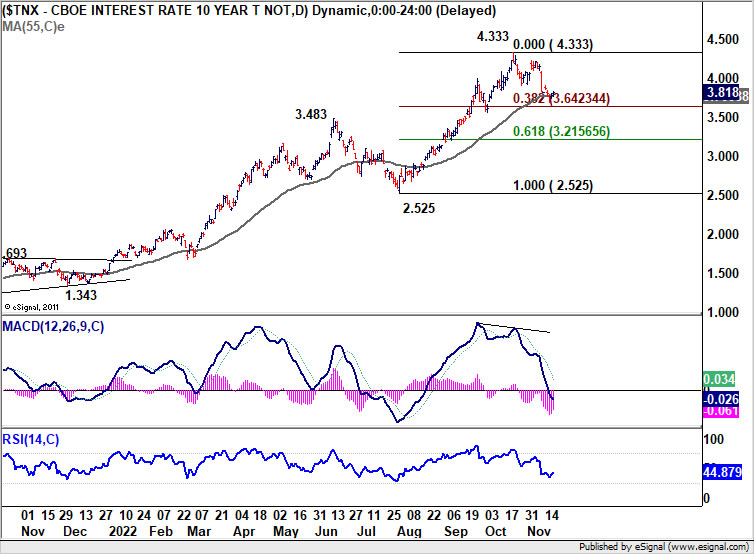
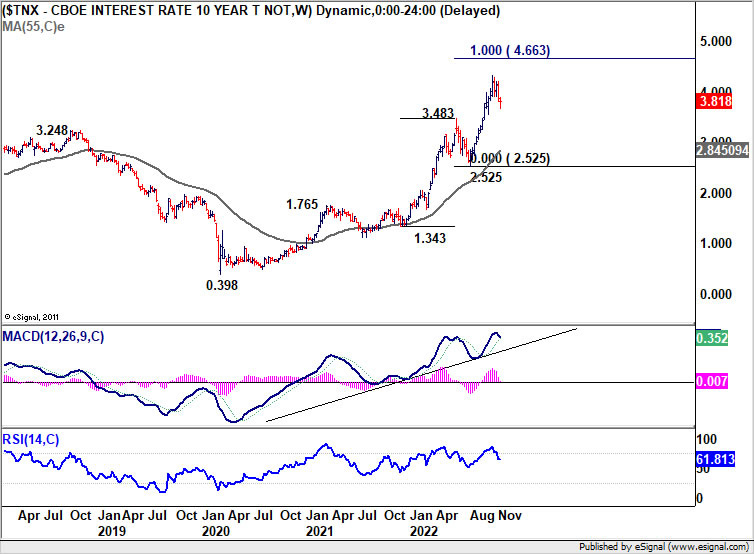
10-year yield drawing support from 55 day EMA
10-year yield stabilized after a brief dip to 3.692 and closed the week nearly flat too. Outlook is unchanged that it's merely in a correction to rise from 2.525. Strong support is expected from current zone of 55 day EMA (now at 3.768) and 38.2% retracement of 2.525 to 4.333 at 3.642 to bring rebound.
There is little prospect for TNX to break through 4.333 high in the near term. That is, range trading between 3.642/4.333 is envisaged.
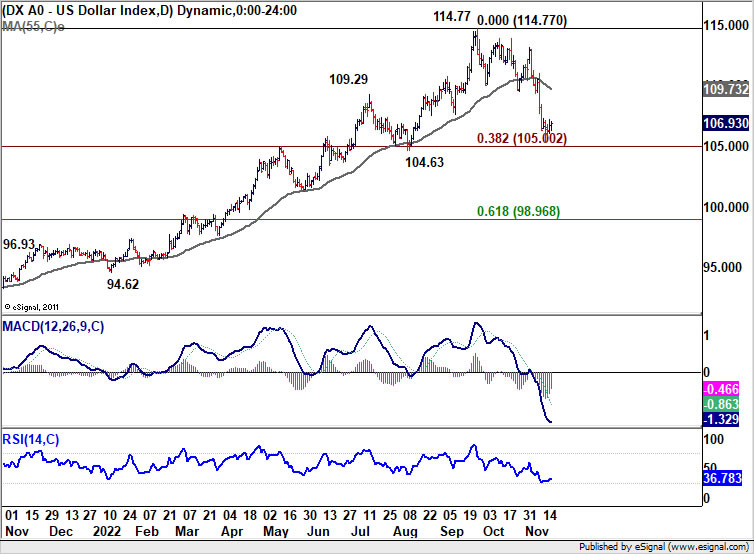
Rebound in Dollar index to happen any time
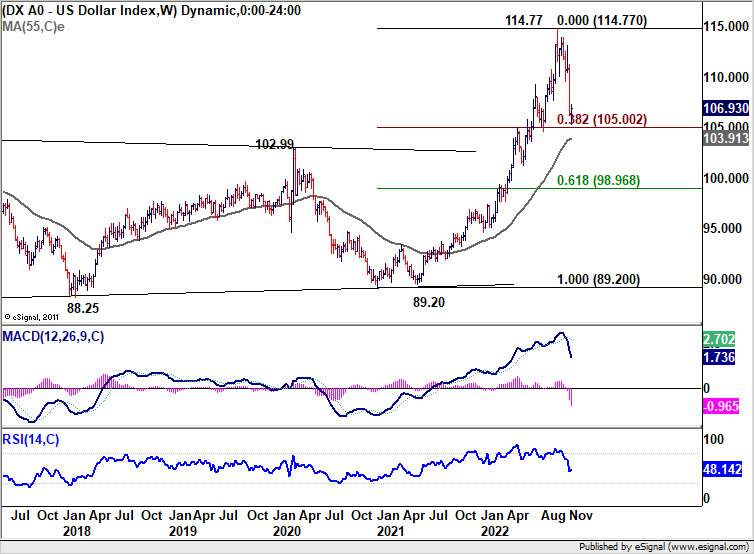
Dollar index closed the week slightly higher after initial dip to 105.34. DXY is now close to an important support zone at 104.63, 38.2% retracement of 89.20 to 114.77 at 105.00, and 55 week EMA at 103.91. So a rebound could happen any time. Break above last week's high at 107.27 could trigger buying back towards 55 day EMA (109.73).
The overall conditions for DXY to rebound should there if DOW does start the pull back as mentioned above, while 10-year yield also recovers.
WTI oil ready for down trend resumption
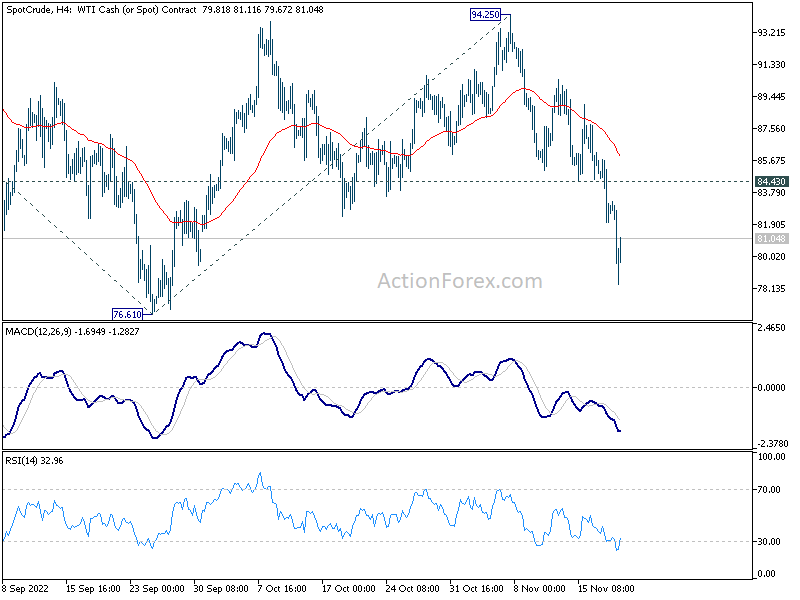
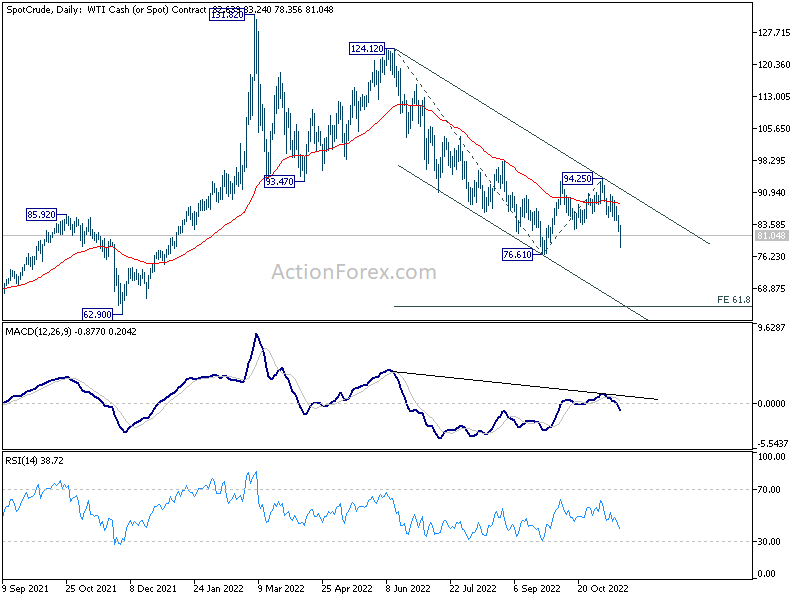
Development in oil prices could be used as a gauge to confirm overall risk sentiment. WTI oil logged a second weekly decline as weighed down by concern over China. While there were steps in easing the strict zero-COVID policy, skyrocketing infections could eventually force the government to reinstate tough lockdown measures. After all, unlike almost all other countries in the world, the vaccination status in China is a big unknown.
Last week's decline suggests that WTI's corrective rebound from 76.61 has completed with three waves up to 94.25. Immediate focus is now on 76.61 low. Firm break there will resume whole down trend from 131.82 high. Next target will be 61.8% projection of 124.12 to 76.61 from 94.25 at 64.88.
While it's indeed too early to tell whether the down trend would really hit the above mentioned target, a break through 76.61 should come in tandem with pull back in stocks, and a stronger recovery in Dollar.
Gold topped in short term, starting pull back
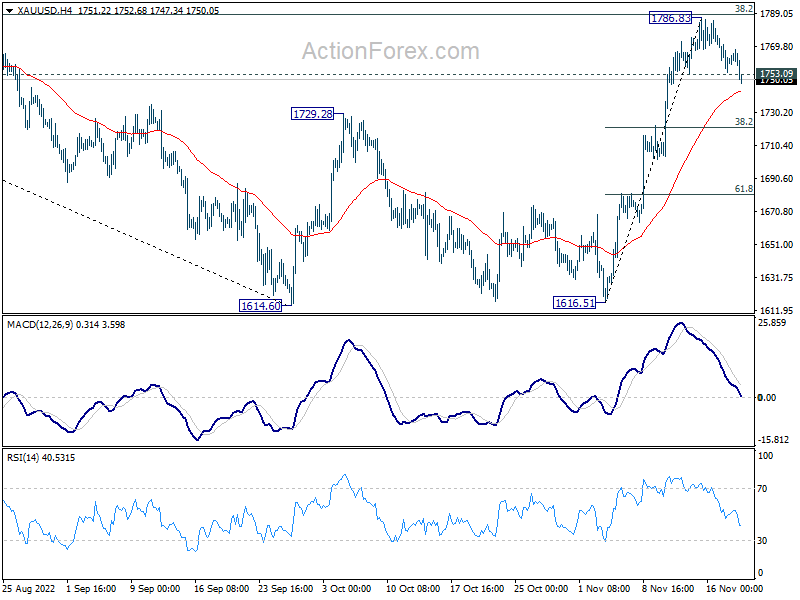
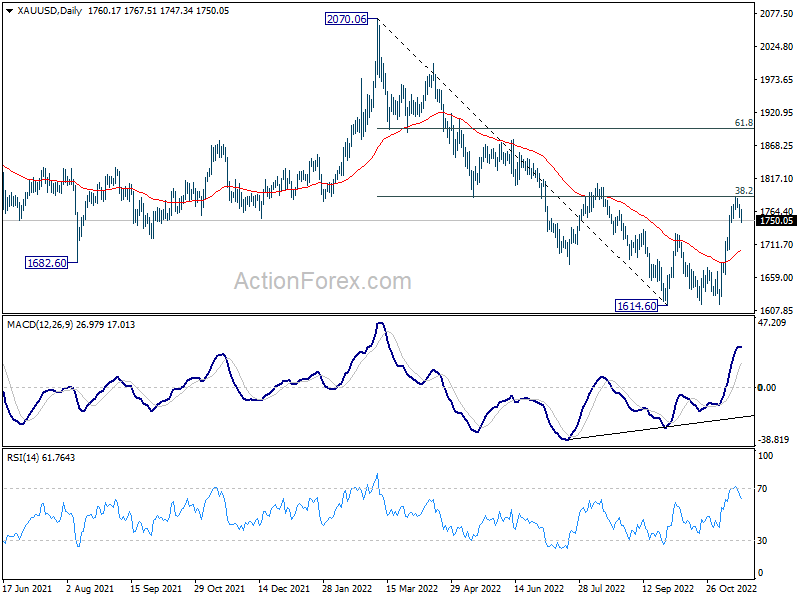
Taking about the prospect of a rebound in Dollar, Gold's pull back is also worth a note. The break of 1753.09 minor support last week indicates short term topping at 1786.83. That came just ahead of 38.2% retracement of 2070.06 to 1614.60 at 1788.58.
Deeper decline is in favor in Gold in the short term. Firm break of 4 hour 55 EMA (now at 1742.44) would pave the way to 38.2% retracement of 1616.51 to 1786.83 at 1721.76, or even further to 55 day EMA (now at 1702.80). If that happens, such pull back should be accompanied by a stronger rebound in Dollar in general.
NZD/USD lost momentum ahead of 0.6257 fibonacci level
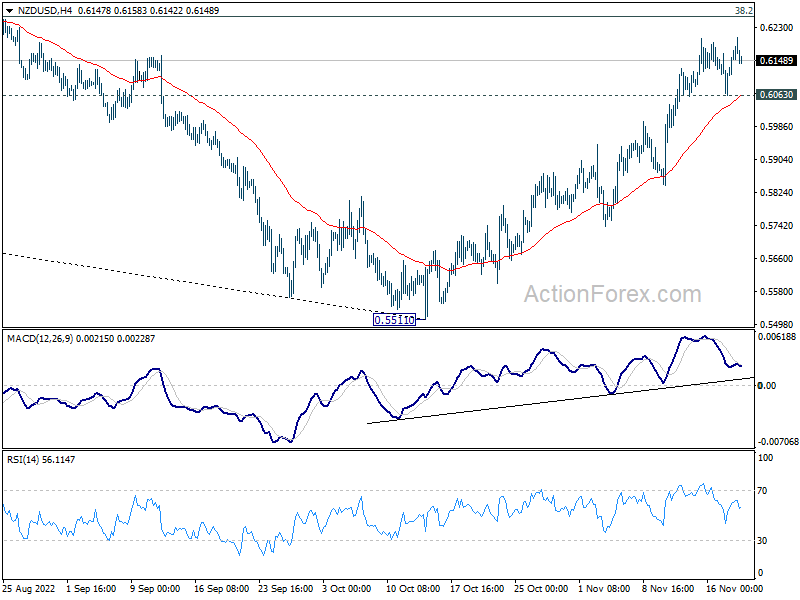
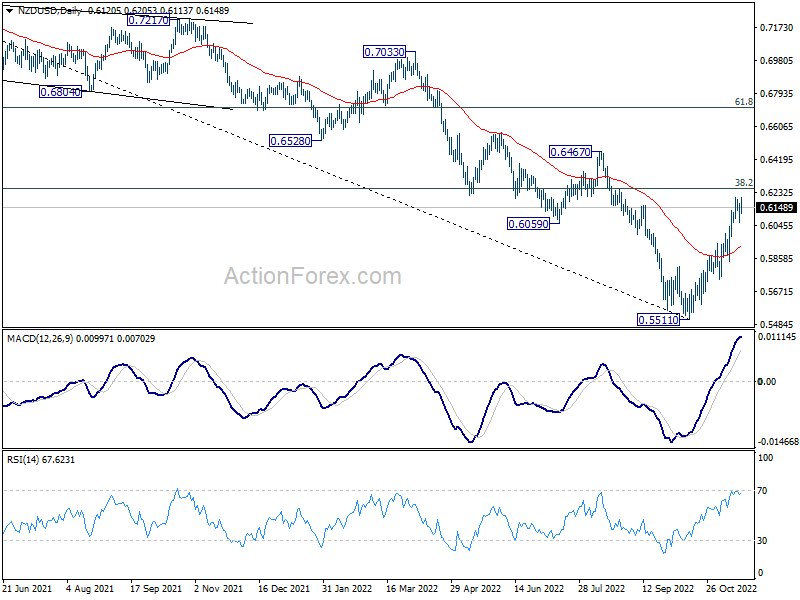
New Zealand Dollar ended as the strongest one last week, ahead of a jumbo 75bps rate hike by RBNZ in the coming Wednesday. Nevertheless, NZD/USD is clearly losing momentum ahead of 38.2% retracement of 0.7463 (2021 high) to 0.5511 at 0.6257.
Rejection by 0.6257, followed by break of 0.6063 minor support, will argue that a short term top is formed. Deeper retreat could then be seen back to 55 day EMA (now at 0.5927). If that happens, it would be another sign that Dollar's rebound is underway.
USD/CAD Weekly Outlook
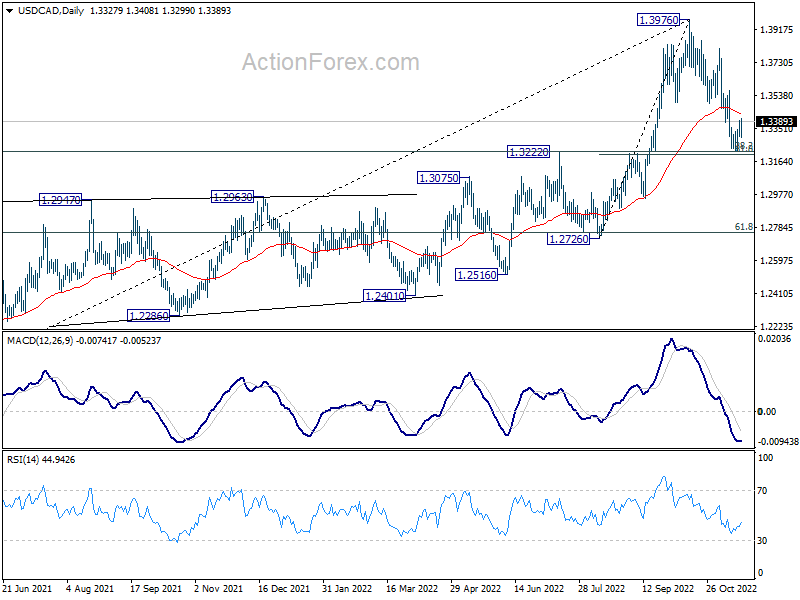
USD/CAD recover ahead of 1.3207 cluster support (61.8% retracement of 1.2726 to 1.3976 at 1.3204) last week. But upside is limited well below 1.3494 support turned resistance. Initial bias remains neutral this week first. On the upside, firm break of 1.3494 will indicate that correction from 1.3976 has completed at 1.3224. Intraday bias will be turned back to the upside for 1.3807/3976 resistance zone. However, on the downside, sustained break of 1.3204/7 will carry larger bearish implication and target 1.2952 support next.
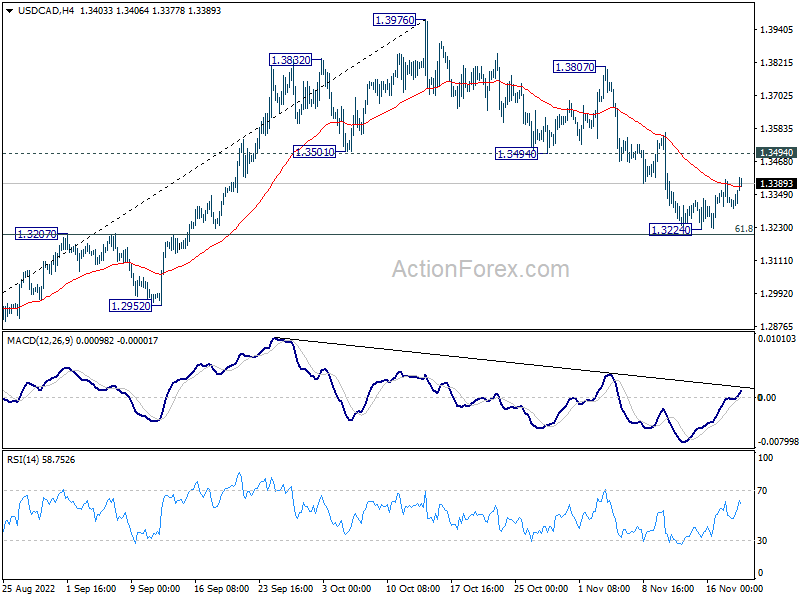
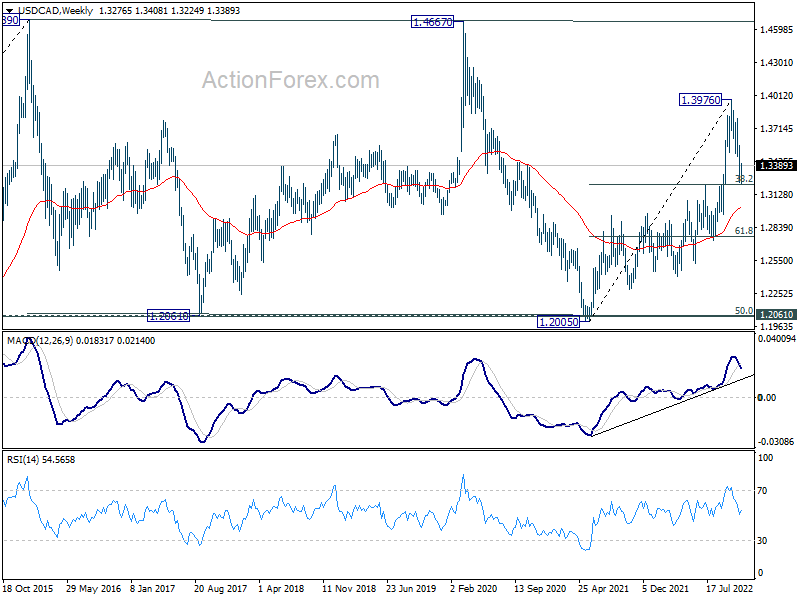
In the bigger picture, as long as 1.3222 cluster support (38.2% retracement of 1.2005 to 1.3976 at 1.3223) holds, larger up trend from 1.2005 (2021 low) is still expected to resume through 1.3976 high at a later stage. . However, firm break of 1.3222/3 will indicate that the trend might have reversed. Deeper fall would be seen to next cluster support at 1.2726 (61.8% retracement at 1.2758).
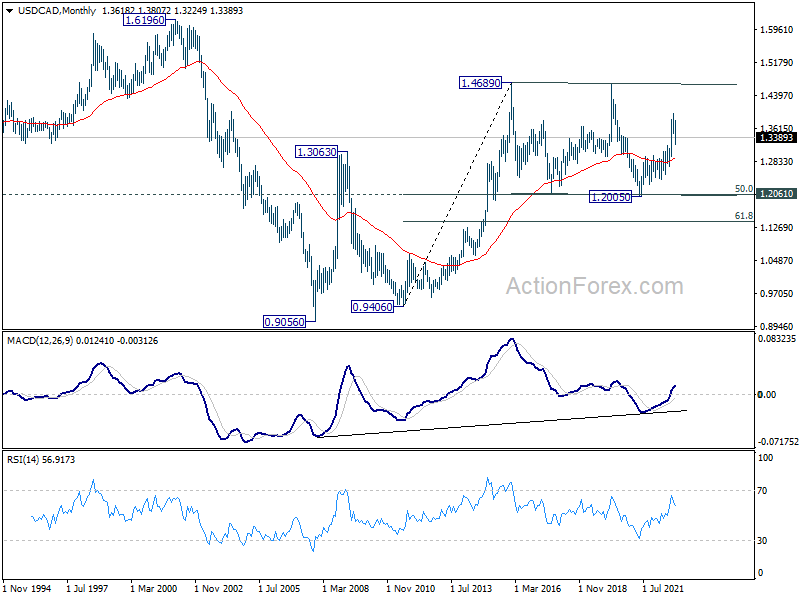
In the longer term picture, price actions from 1.4689 (2016 high) are seen as a consolidation pattern only, which might have completed at 1.2005. That is, up trend from 0.9506 (2007 low) is expected to resume at a later stage. This will remain the favored case as long as 1.2061 support holds, which is close to 50% retracement of 0.9406 to 1.4689 at 1.2048.
EUR/USD Weekly Outlook
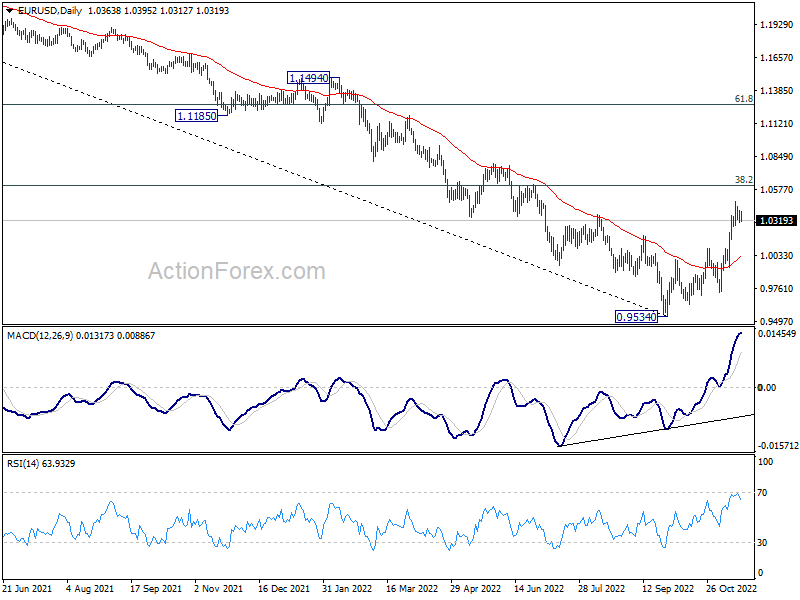
EUR/USD edged higher to 1.0481 last week but turned sideway. Initial bias remains neutral this week for consolidations. Downside of retreat should be contained by 1.0092 resistance turned support to bring another rally. On the upside, break of 1.0481 will resume the rise from 0.9534 and target 1.0609 fibonacci level.
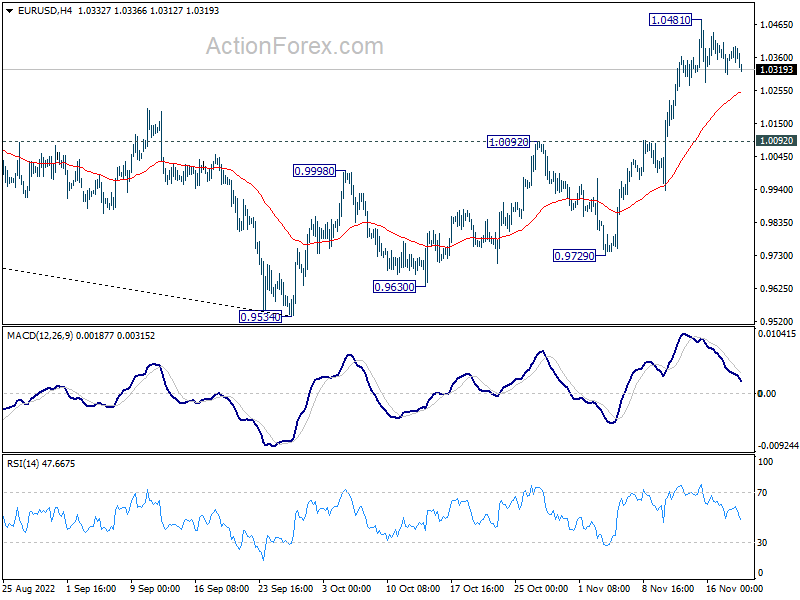
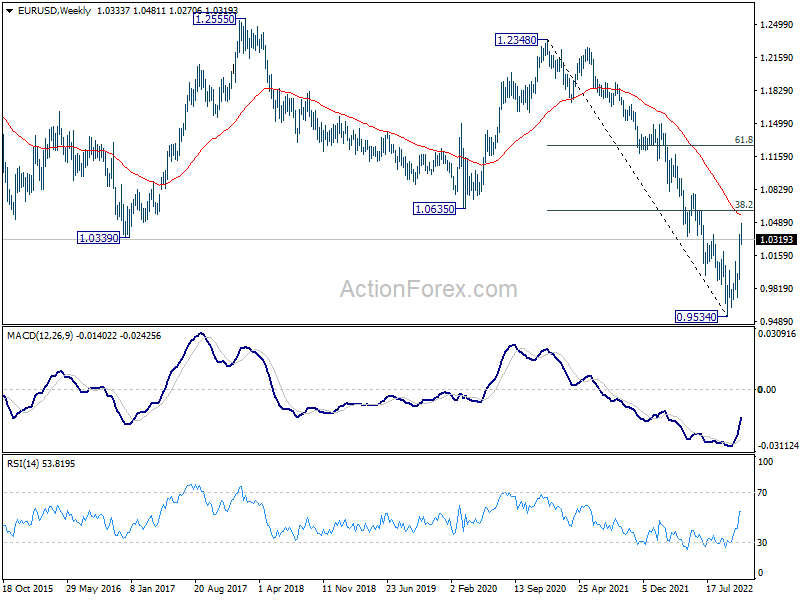
In the bigger picture, a medium term bottom was in place at 0.9534, on bullish convergence condition in daily MACD. Even as a corrective rise, rally from 0.9534 should target 38.2% retracement of 1.2348 (2021 high) to 0.9534 at 1.0609. Sustained trading above 55 week EMA (now at 1.0566) will raise the chance of trend reversal and target 61.8% retracement at 1.1273. This will now remain the favored case as long as 1.0092 resistance turned support holds.
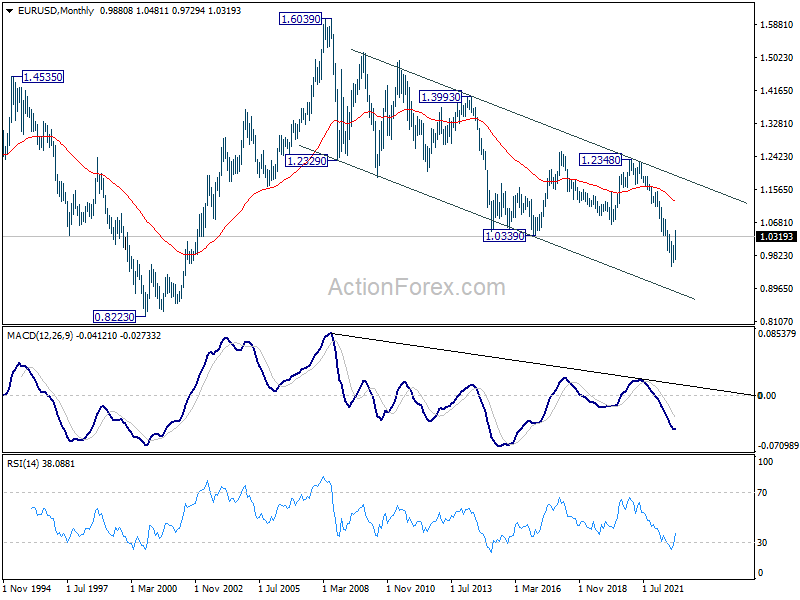
In the long term picture, as long as 1.0635 support turned resistance holds (2020 low), long term down trend from 1.6039 (2008) could still extend through 0.9534 at a later stage. However, sustained break of 1.0635 will confirm bottoming and at least turn long term outlook neutral.
USD/JPY Weekly Outlook
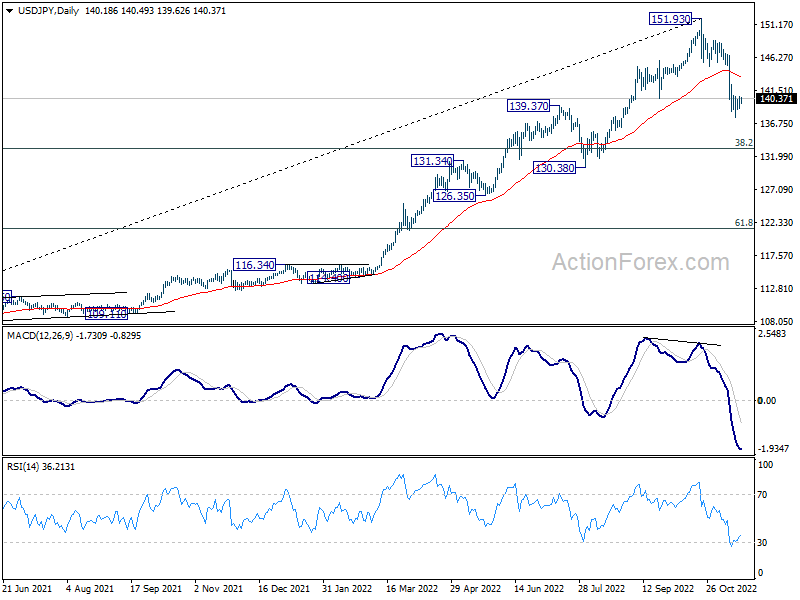
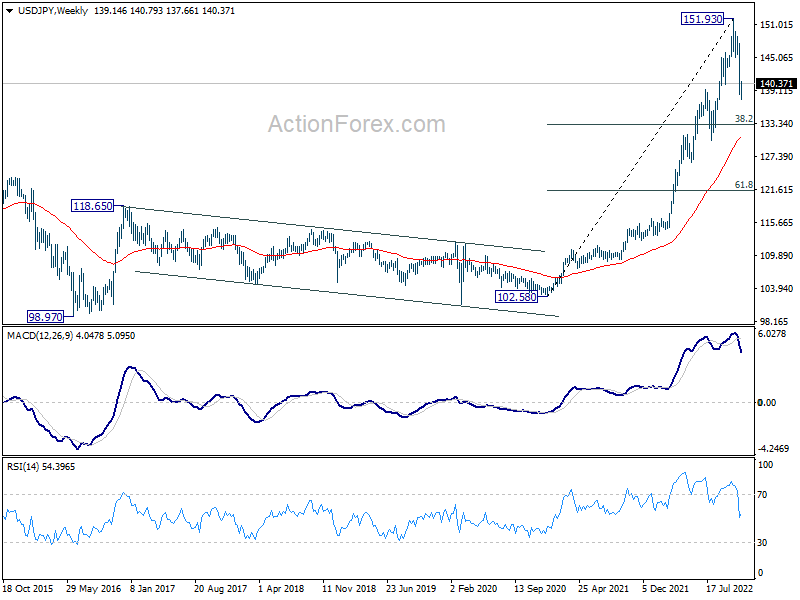
USD/JPY edged lower to 137.66 last week but recovered since then. Initial bias remains neutral this week for consolidations. Upside should be limited below 145.16 support turned resistance. On the downside, break of 137.66 will resume the decline from 151.93, to 133.07 fibonacci level, as a correction to the larger up trend.
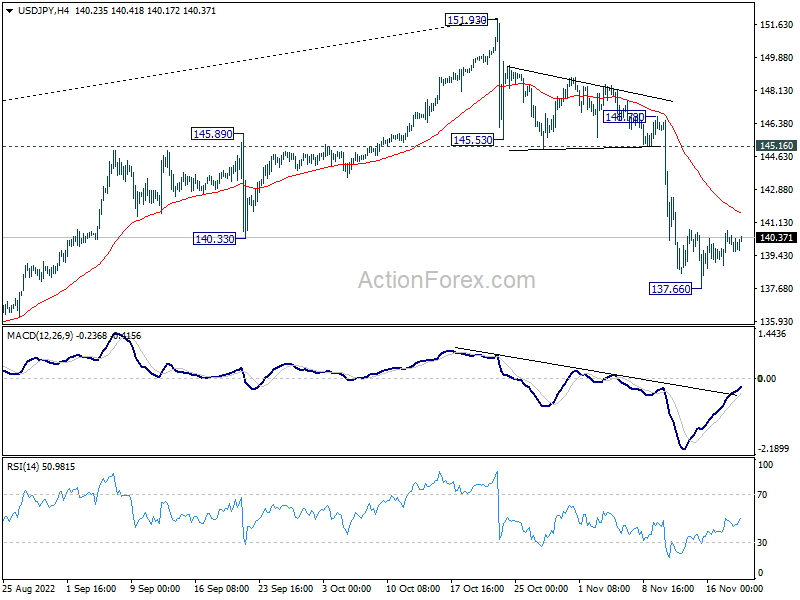
In the bigger picture, a medium term top should be formed at 151.93. Fall from there is correcting larger up trend from 102.58. It's too early to call for bearish trend reversal. But even as a corrective move, such decline should target 38.2% retracement of 102.58 to 151.93 at 133.07, or further to 55 week EMA (now at 130.58).
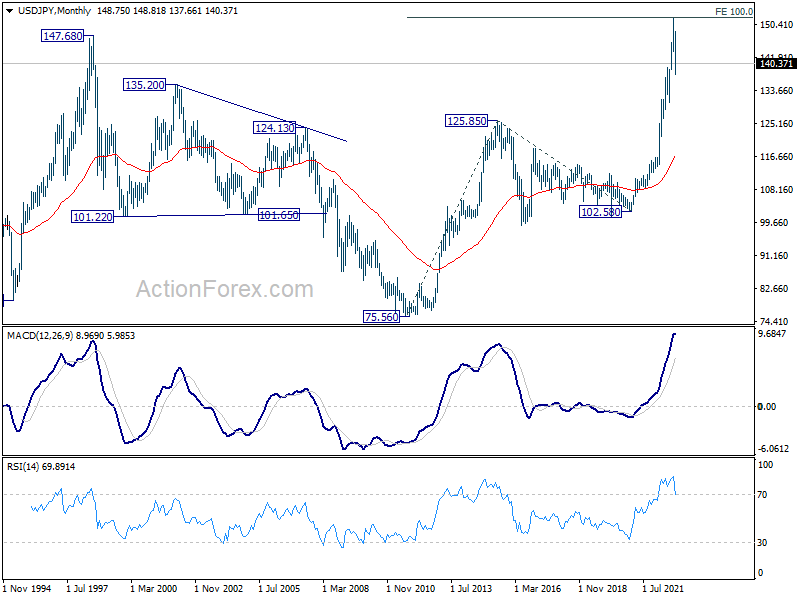
In the long term picture, rise from 102.58, as part of the up trend from 75.56 (2011 low) was put to a halt at 151.93, just ahead of 100% projection of 75.56 to 125.85 from 102.58 at 152.87. There is no clear sign of long term reversal yet. Such up trend is expected to resume at a later stage, as long as 125.85 resistance turned support holds.
GBP/USD Weekly Outlook
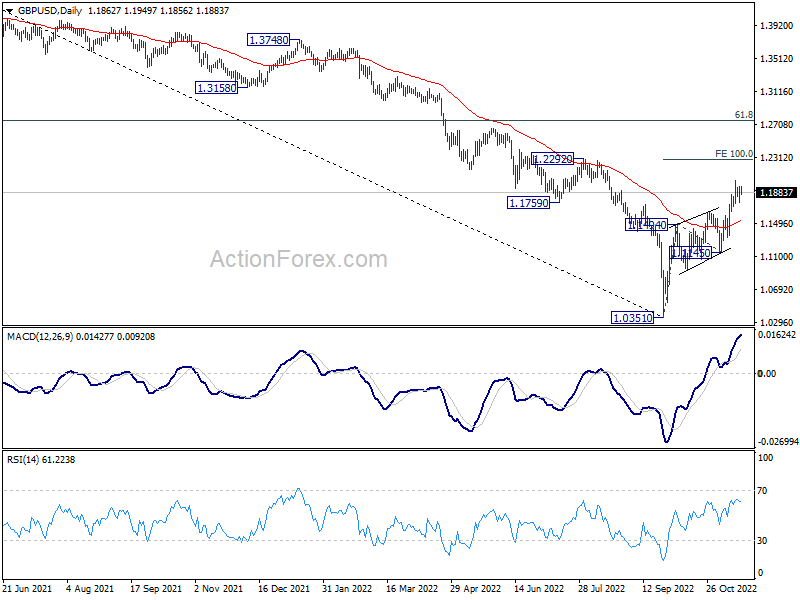
GBP/USD edged higher to 1.2028 last week but turned sideway since then. Initial bias remains neutral this week for consolidations. Further rise is expected as long as 1.1644 resistance turned support holds. On the upside, break of 1.2028 will resume whole rise from 1.0351 to 100% projection of 1.0351 to 1.1494 from 1.1145 at 1.2288. However, sustained break of 1.1644 will bring deeper fall to 1.1145 support instead.
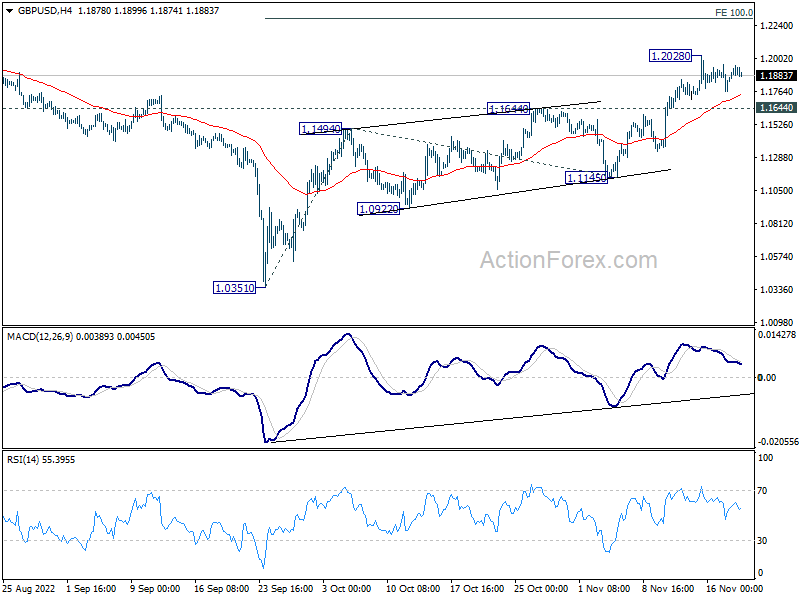
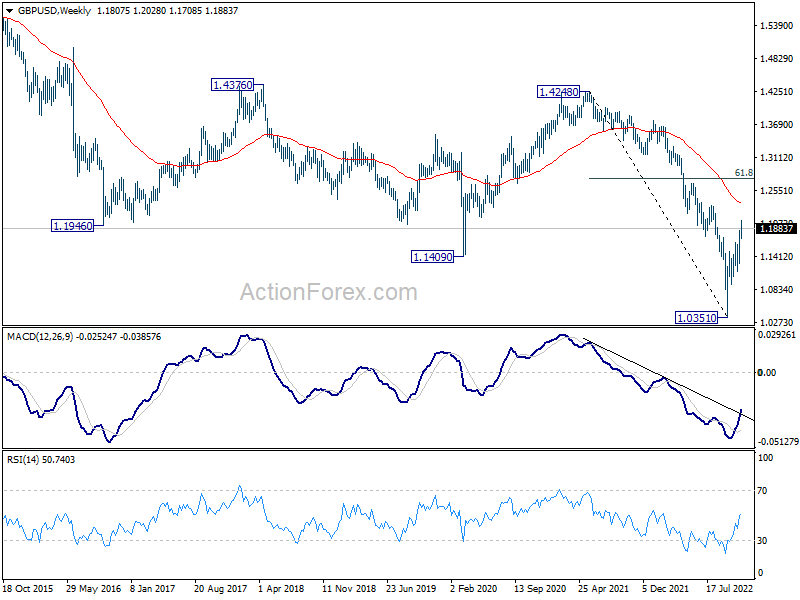
In the bigger picture, rise from 1.0351 medium term bottom is at least correcting whole down trend from 1.4248 (2021 high). Further rise is expected as long as 1.1145 support holds. Next target is 61.8% retracement of 1.4248 to 1.0351 at 1.2759.
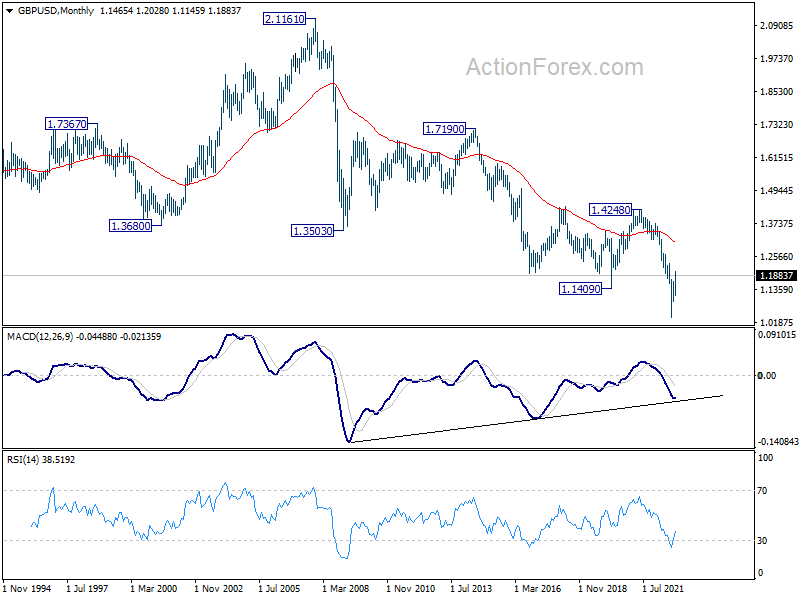
In the longer term picture, as long as 1.4248 resistance holds (2021 high), long term outlook will remain neutral at best. Down trend from 2.1161 (2007) could still resume for another low through 1.0351 at a later stage.
USD/CHF Weekly Outlook
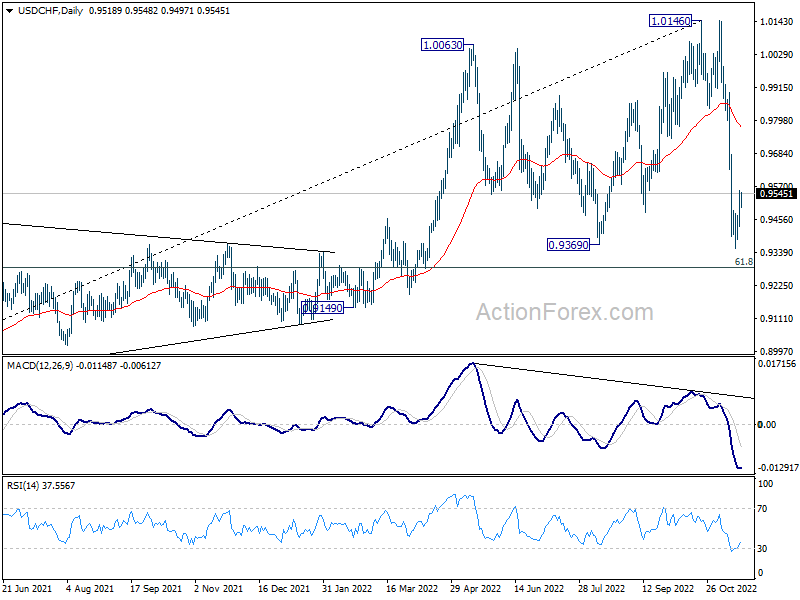
USD/CHF edged lower to 0.9355 but recovered since then. Initial bias remains neutral this week for consolidations first. But further decline is expected as long as 0.9680 resistance holds. Break of 0.9355 will resume the fall from 1.0146 to 0.9287 fibonacci level.
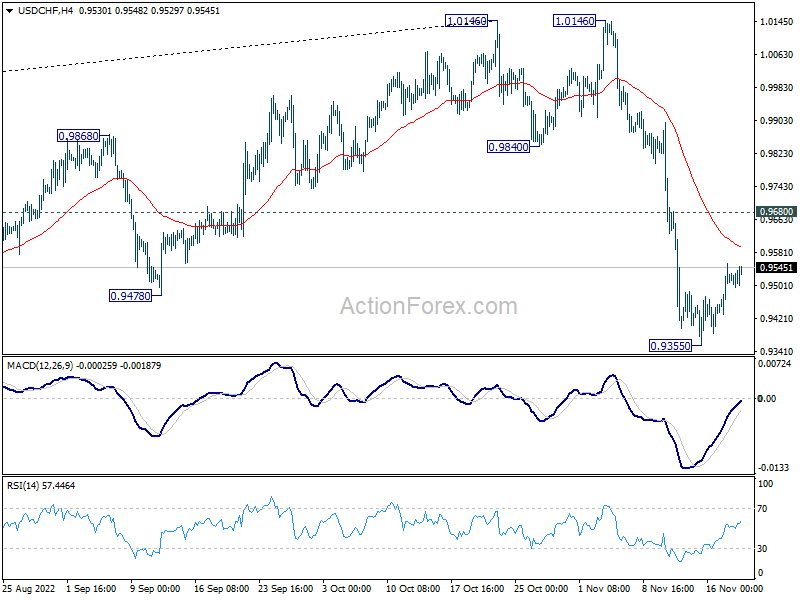
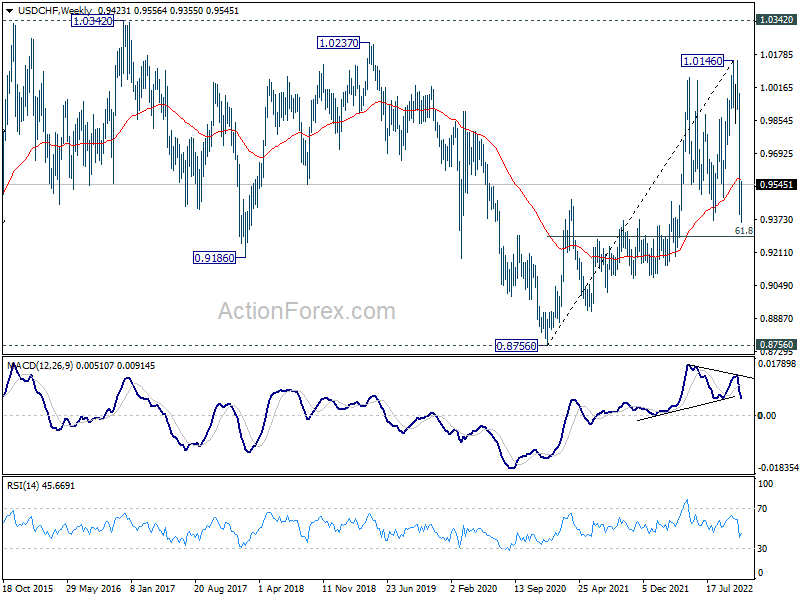
In the bigger picture, rise from 0.8756 (2021 low) has completed at 1.0146, well ahead of 1.0342 long term resistance (2016 high). Based on current downside momentum, fall from 1.0146 might be a medium term down trend itself. Break of 61.8% retracement of 0.8756 to 1.0146 at 0.9287 will pave the way to 0.8756. In any case, risk will stay on the downside as long as 55 day EMA (now at 0.9775) holds.
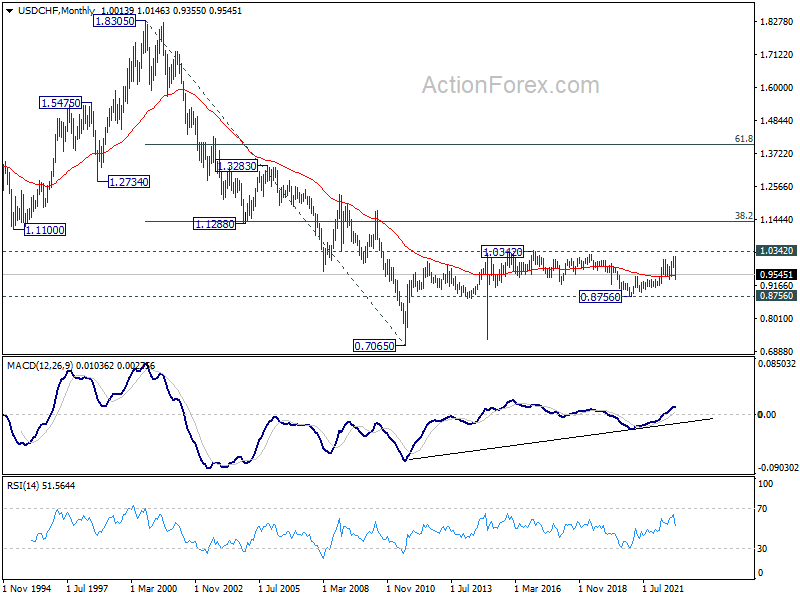
In the long term picture, long term sideway pattern from 1.0342 (2016 high) is extending and it's probably in another medium term down leg. Downside will likely be contained by 0.8756 support in case of deeper fall. Overall, range trading should continue until further development.
AUD/USD Weekly Outlook
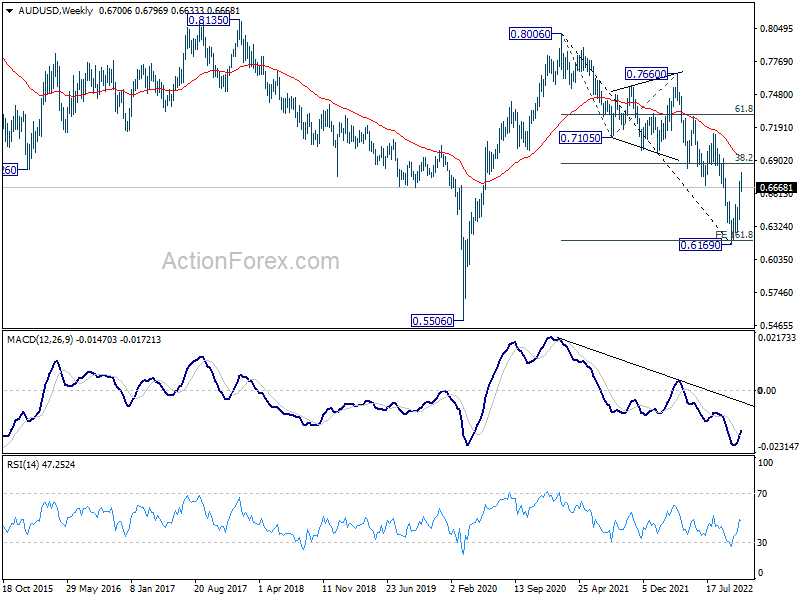
AUD/USD edged higher to 0.6796 last week but retreated. Initial bias stays neutral this week for consolidations. Further rally is expected as long as 0.6521 resistance turned support holds. On the upside, break of 0.6796 will resume the rise from 0.6169 to 0.6871 fibonacci level.
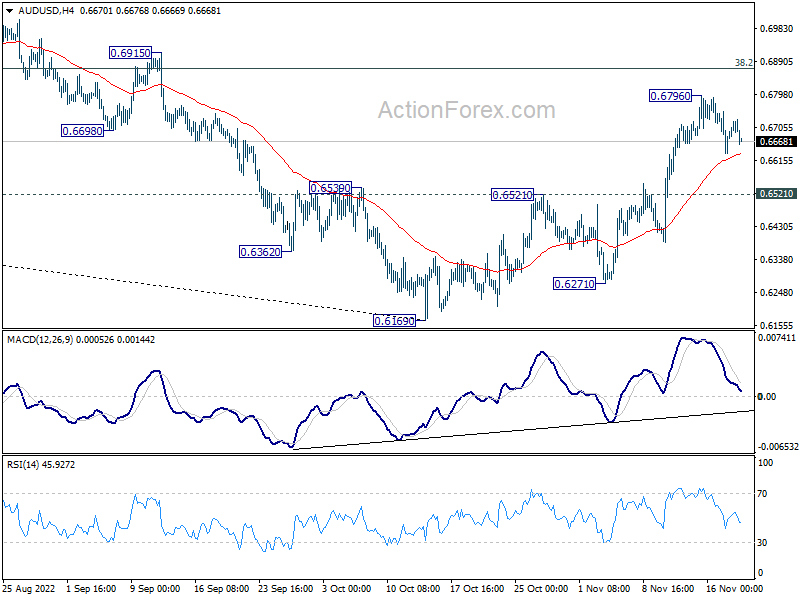
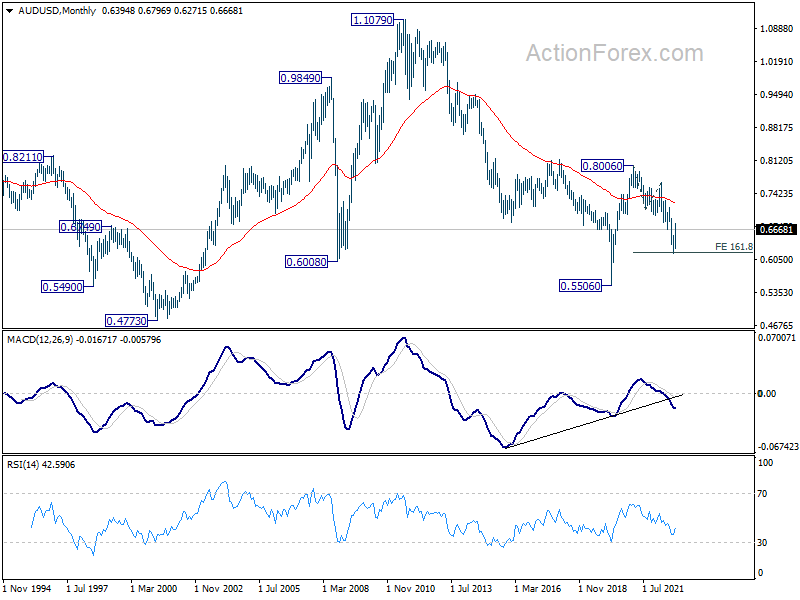
In the bigger picture, a medium term bottom is in place at 0.6160 already. But it's too early to call for trend reversal. Nevertheless, even as a corrective move, rise from 0.6169 should target 38.2% retracement of 0.8006 to 0.6169 at 0.6871. Sustained trading above 55 week EMA (now at 0.6934) will raise the chance of the start of a bullish up trend. This week now remain the favored case as long as 0.6521 resistance turned support holds.
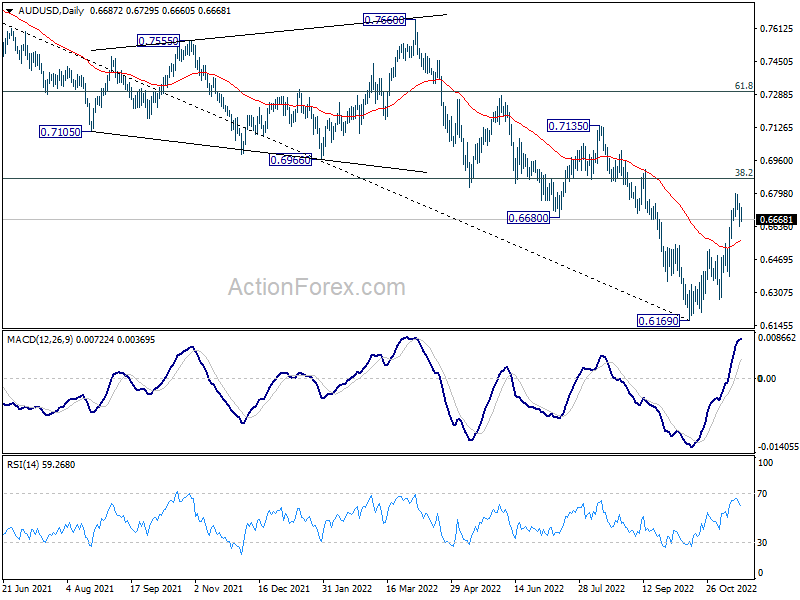
In the long term picture, the down trend from 0.8006 could still be seen as a corrective move, considering that it failed to break through 161.8% projection of 0.8006 to 0.7105 from 0.7660 at 0.6202 decisively. Strong rebound from current level will keep long term outlook neutral first. However, sustained break of 0.6202 will open up deep fall to retest 0.5506.
USD/CAD Weekly Outlook
USD/CAD recover ahead of 1.3207 cluster support (61.8% retracement of 1.2726 to 1.3976 at 1.3204) last week. But upside is limited well below 1.3494 support turned resistance. Initial bias remains neutral this week first. On the upside, firm break of 1.3494 will indicate that correction from 1.3976 has completed at 1.3224. Intraday bias will be turned back to the upside for 1.3807/3976 resistance zone. However, on the downside, sustained break of 1.3204/7 will carry larger bearish implication and target 1.2952 support next.
In the bigger picture, as long as 1.3222 cluster support (38.2% retracement of 1.2005 to 1.3976 at 1.3223) holds, larger up trend from 1.2005 (2021 low) is still expected to resume through 1.3976 high at a later stage. . However, firm break of 1.3222/3 will indicate that the trend might have reversed. Deeper fall would be seen to next cluster support at 1.2726 (61.8% retracement at 1.2758).
In the longer term picture, price actions from 1.4689 (2016 high) are seen as a consolidation pattern only, which might have completed at 1.2005. That is, up trend from 0.9506 (2007 low) is expected to resume at a later stage. This will remain the favored case as long as 1.2061 support holds, which is close to 50% retracement of 0.9406 to 1.4689 at 1.2048.
GBP/JPY Weekly Outlook
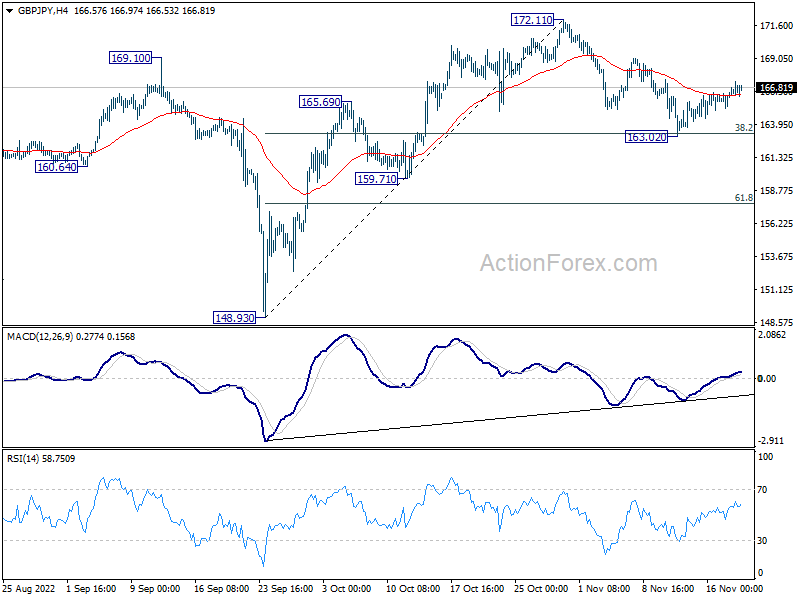
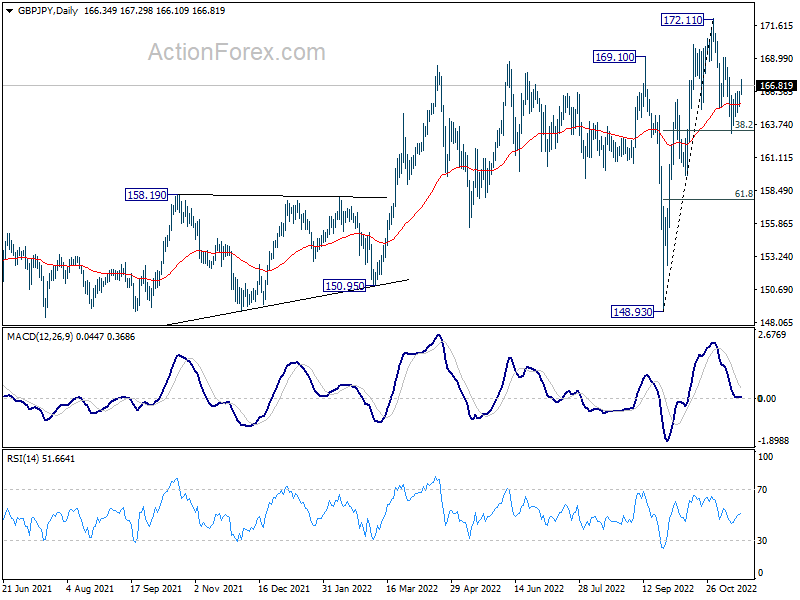
Last week's recovery suggests that GBP/JPY's correction from 172.11 has completed at 163.20, after hitting 38.2% retracement of 148.93 to 172.11 at 163.25. Initial bias is mildly on the upside for retesting 172.11 high first. On the downside, however, sustained trading below 38.2% retracement of 148.93 to 172.11 at 163.25 will bring deeper decline to 61.8% retracement at 157.78 and possibly below.
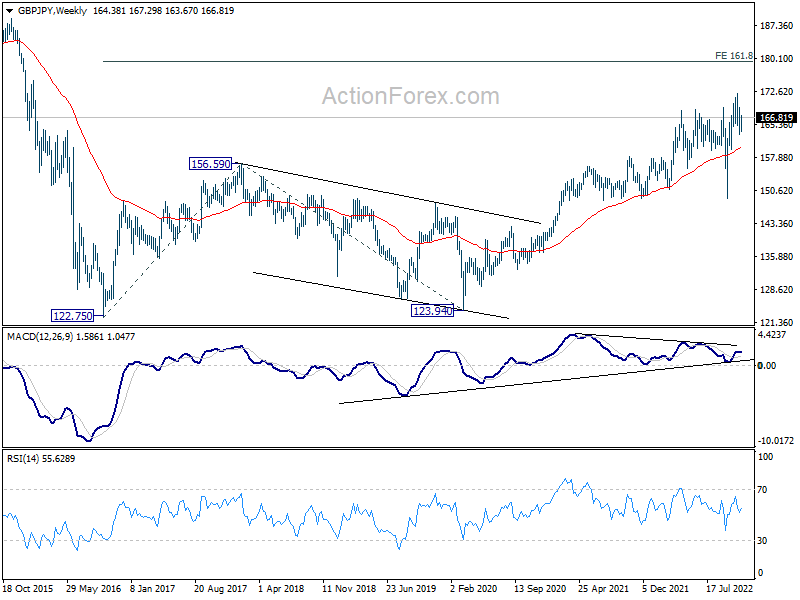
In the bigger picture, there is no clear sign of medium term topping yet. Up trend from 123.94 (2020 low) could still resume through 172.11 high at a later stage. However, firm break of 159.71 support will argue that it's already in correction to the up trend from 123.94, and deeper decline would be seen back towards 148.93 support.
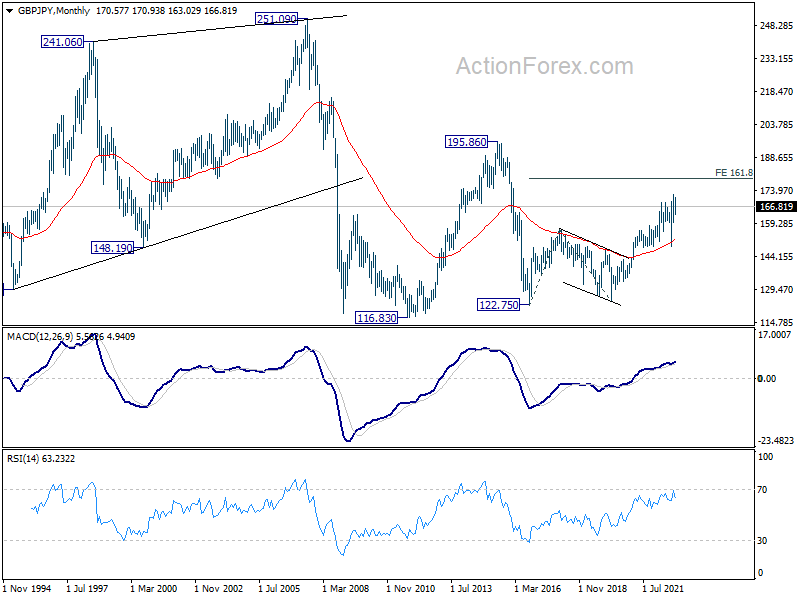
In the longer term picture, as long as 55 month EMA (now at 151.88) holds, rise from 122.75 could still extend higher at a later stage. Next target is 195.86 (2015 high).
EUR/JPY Weekly Outlook
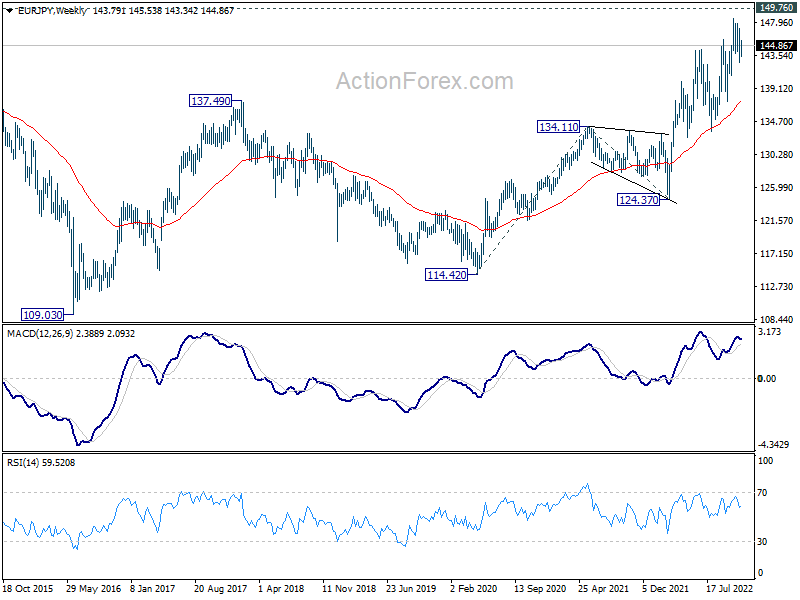
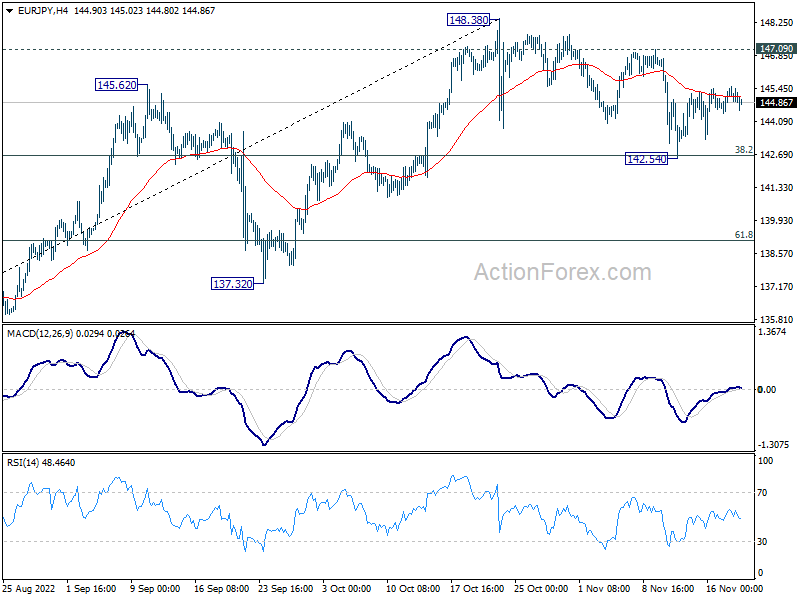
EUR/JPY recovered last week but failed to sustain above 4 hour 55 EMA. Initial bias is turned neutral this week first. Correction from 148.38 might have completed at 142.54. Break of 147.09 resistance will indicate that larger up trend is ready to resume through 148.38 high. However, on the downside, sustained break of 142.65 will bring deeper fall to 61.8% retracement at 139.11 and possibly below.
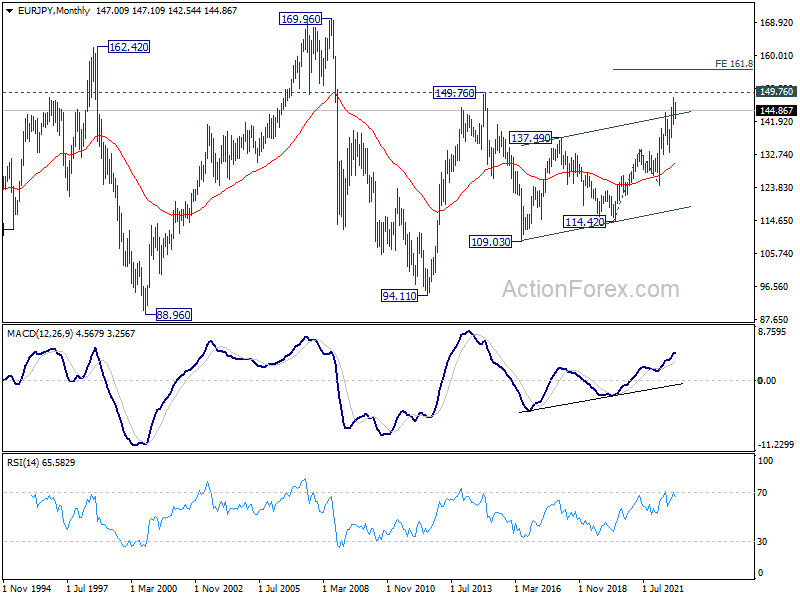
In the bigger picture, there is no clear sign of medium term topping yet. Up trend from 114.42 (2020 low) could still resume through 148.38 to 149.76 (2014 high). However, break of 137.32 support argue that a medium term correction has already started to correct the whole up trend from 114.42.
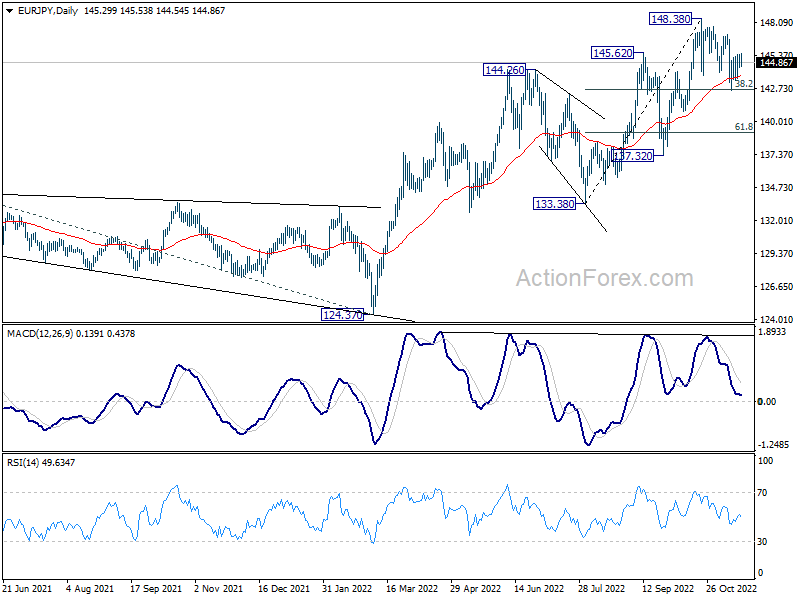
In the long term picture, outlook will stay bullish as long as 134.11 resistance turned support holds (2021 high). Sustained break of 149.76 (2014 high) will open up further rally, as resumption of the rise from 94.11 (2012 low), towards 169.96 (2008 high).