Sample Category Title
Big Oil Price Drop
Market movers today
A quiet start to another week where central banks remain on the spotlight. German October Producer Price Index will be released today, and in the evening Fed's Daly will be on the wires.
Later in the week, we expect Riksbank to hike its policy rate by 75bp, which is largely priced in the markets already. Reserve Bank of New Zealand (RBNZ) is also expected to deliver a 75bp hike, while the central bank of Turkey is expected to continue its unorthodox policies with another 150bp cut.
On the data front, the most important releases will be Euro Area and US Flash PMIs on Wednesday, and while markets' focus remains on forward-looking data, we will also keep an eye out for FOMC and ECB minutes, due for release on Wednesday and Thursday, respectively.
The 60 second overview
Oil: Brent dropped sharply on Friday to as low as USD86/bbl. There was no apparent trigger of the selloff, but it could be a signal about concerns over whether China after all will not begin to ease lockdowns due to a recent rise in infections. A further drop in prices could lead OPEC+ to cut production further.
Climate: Climate negotiators managed a deal on Sunday at COP27. Details have yet to be determined of the fund to be created, which will help compensate poor nations from damages caused by climate change.
US: Atlanta Fed's Raphael Bostic on Saturday argued for slowing pace of rate hikes at the December FOMC meeting and thought 75-100bp of additional tightening was warranted. That would take Fed Funds rate to 4.5-4.75% range.
Equities: Equities higher Friday, lifted by defensive value stocks as the inflation relief narrative faded further. Utilities and health care the two biggest outperformers while energy stocks lower as oil dropped further. VIX standing at 23 reflecting the continued uncertainty in the growth outlook. In US on Friday, Dow +0.6%, S&P 500 +0.5%, Nasdaq +0.01% and Russell 2000 +0.6%. The positive sentiment is not continuing this morning with Asian markets mostly lower. China struggling with increased numbers of Covid infection but also the South Korean export data this morning were yet again dreadful. European and US futures also lower this morning.
FI: The volatility persists in the market as shown on Friday, where 10Y Bunds initially rose 10bp, but ended the day more or less unchanged at 2%. 10Y Treasuries rose some 5bp during Friday, and the US Treasury curve continued to invert between 2Y and 10Y and is now at -70bp. We are seeing the same pattern in the German yield curve between 2Y and 10Y, that is also inverse as the risk of recession continues to increase in both the Eurozone and US economies and the lower than expected US CPI data.
FX: Last week brought a reversal of the Fed pivot-trade with the USD strengthening and not least the Scandies underperforming. EUR/USD is back close to the 1.03 level while EUR/SEK and EUR/NOK are trading close to 11.00 and 10.50, respectively.
Credit: Following a couple of days of widening, sentiment improved again on Friday where iTraxx Xover tightened 14.5bp and Main 3.6bp.
AUD/USD Daily Report
Daily Pivots: (S1) 0.6650; (P) 0.6690; (R1) 0.6719; More...
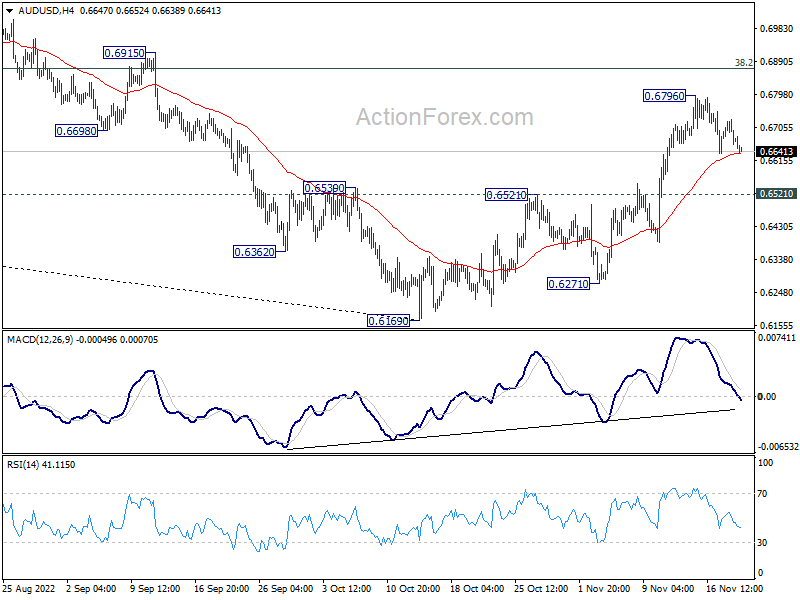
Intraday bias in AUD/USD stays neutral at this point. Further rally is expected as long as 0.6521 resistance turned support holds. On the upside, break of 0.6796 will resume the rise from 0.6169 to 0.6871 fibonacci level. However, sustained break of 0.6521 will argue that whole rebound from 0.6169 is over, and bring deeper fall to retest this low.
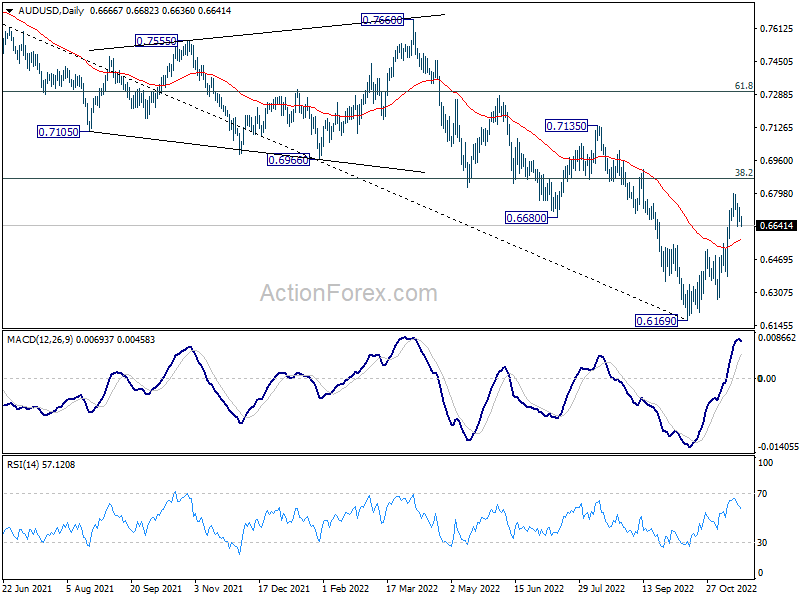
In the bigger picture, a medium term bottom is in place at 0.6160 already. But it's too early to call for trend reversal. Nevertheless, even as a corrective move, rise from 0.6169 should target 38.2% retracement of 0.8006 to 0.6169 at 0.6871. Sustained trading above 55 week EMA (now at 0.6923) will raise the chance of the start of a bullish up trend. This week now remain the favored case as long as 0.6521 resistance turned support holds.
Dollar Extending Recovery, Euro and Sterling Soften
Dollar opened the week broadly higher, following last week's late recovery. Swiss Franc also picks up some buying, especially against Euro and Sterling. Commodity currencies are mixed for now, with Canadian Dollar having an upper hand. Yen is also mixed as corrective trading continues. The week is relatively light with holidays. But there are still some focuses like RBNZ rate decision, PMIs, and Fed and ECB minutes.
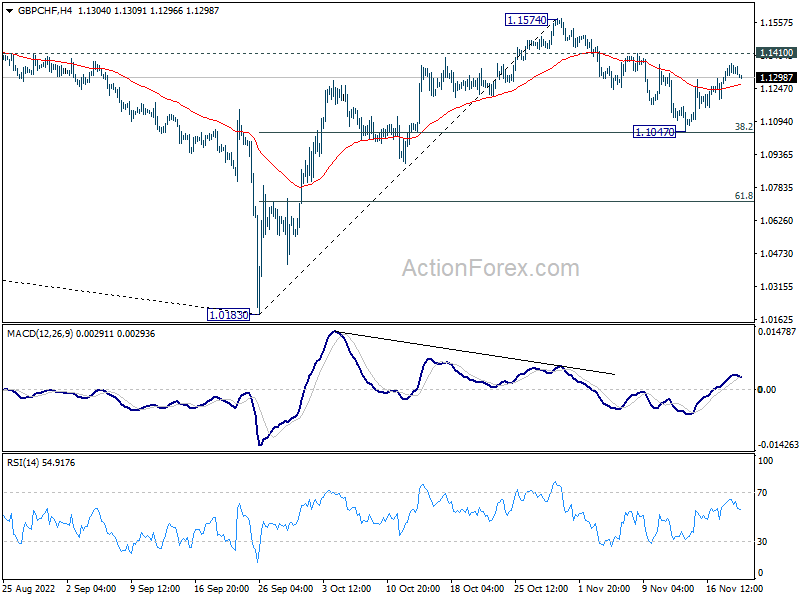
Technically, while GBP/CHF recovered last week after drawing support from 38.2% retracement of 1.0183 to 1.1574 at 1.1043. But recovering stalled ahead of 1.1410 resistance, keeping risks on the downside. Break of 1.1047 will prompt deeper decline to 61.8% retracement at 1.0714, even as a corrective move. Nevertheless, break of 1.1410 will revive near term bullishness for retest of 1.1574 resistance first. Development in GBP/CHF could be a hint on whether EUR/GBP is heading through 0.8827 resistance, or 0.8570 support.
In Asia, Nikkei rose 0.16%. Hong Kong HSI is down -1.68%. China Shanghai SSE is down -0.52%. Singapore Strait Times is down -0.81%. 10-year JGB yield dropped -0.0023 to 0.251.
Fed Bostic: 75 to 100 basis points of additional tightening warranted
Atlanta Fed President Raphael Bostic said on Saturday, "If the economy proceeds as I expect, I believe that 75 to 100 basis points of additional tightening will be warranted... It's clear that more is needed, and I believe this level of the policy rate will be sufficient to rein in inflation over a reasonable time horizon."
"In terms of pacing, assuming the economy evolves as I expect in the coming weeks, I would be comfortable starting the move away from 75-basis-point increases at the next meeting," he added.
Bostic expected Fed to pause at some point to "let the economic dynamics play out," given that it may take 12-24 months for the effect of rate hikes to be "fully realized."
"I do not think we should continue raising rates until the inflation level has gotten down to 2%. Because of the lag dynamics I discussed earlier, this would guarantee an overshoot and a deep recession," he said.
Bitcoin down again, ready for 2019 levels?
Both Bitcoin is some selling pressure and looks heading back to this month's low. Negative news for cryptocurrencies are neverending, with reports that giant Digital Currency Group could be in trouble after its crypto lender Genesis was forced to pause withdrawals. The earlier collapse of FTSE was put to blame.
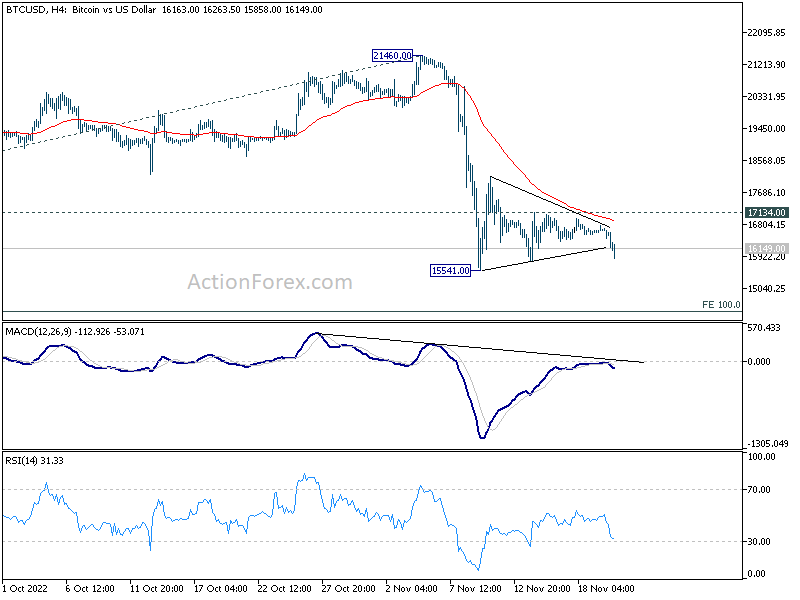
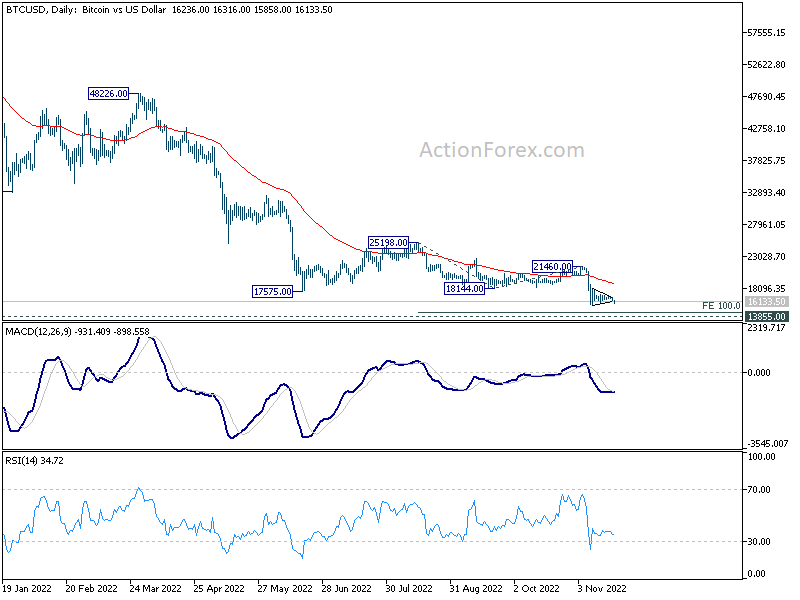
Technically, Bitcoin's consolidation pattern from 15541 might have completed. Break of this low will resume larger down trend to 100% projection of 25198 to 18144 from 21460 at 14406, or even further to 2019 high at 13855. Break of 17134 resistance will delay the bearish case and extend the consolidations first.
RBNZ to hike 75bps; Fed and ECB to publish minutes
RBNZ is widely expected to step up tightening effort and raise the Official Cash Rate by 75bps to 4.25% this week. The central bank should continue to maintain hawkish bias. There are expectations there the OCR would peak at 5.00% by early next year. In terms of central bank activities, Fed and ECB will publish meeting minutes, but they're unlikely to reveal anything new, given the frequency of comments from officials.
Regarding economic data, PMIs from Australia, Eurozone, UK and Japan will catch most attention. Germany will release Ifo business climate and Gfk consumer sentiment. Canada and New Zealand will release retail sales. US will release durable goods orders.
Here are some highlights for the week:
- Monday: Germany PPI.
- Tuesday: New Zealand trade balance; UK public sector net borrowing; Eurozone current account; Canada retail sales, new housing price index.
- Wednesday: Australia PMIs; RBNZ rate decision. Eurozone PMIs; UK PMIs; US durable goods orders, jobless claims, PMIs, new home sales, FOMC minutes.
- Thursday: Japan PMI manufacturing; Germany Ifo business climate; ECB meeting accounts.
- Friday: New Zealand retail sales; Japan Tokyo CPI; Germany GDP final, Gfk consumer sentiment.
AUD/USD Daily Report
Daily Pivots: (S1) 0.6650; (P) 0.6690; (R1) 0.6719; More...
Intraday bias in AUD/USD stays neutral at this point. Further rally is expected as long as 0.6521 resistance turned support holds. On the upside, break of 0.6796 will resume the rise from 0.6169 to 0.6871 fibonacci level. However, sustained break of 0.6521 will argue that whole rebound from 0.6169 is over, and bring deeper fall to retest this low.
In the bigger picture, a medium term bottom is in place at 0.6160 already. But it's too early to call for trend reversal. Nevertheless, even as a corrective move, rise from 0.6169 should target 38.2% retracement of 0.8006 to 0.6169 at 0.6871. Sustained trading above 55 week EMA (now at 0.6923) will raise the chance of the start of a bullish up trend. This week now remain the favored case as long as 0.6521 resistance turned support holds.
Economic Indicators Update
| GMT | Ccy | Events | Actual | Forecast | Previous | Revised |
|---|---|---|---|---|---|---|
| 07:00 | EUR | Germany PPI M/M Oct | 0.90% | 2.30% | ||
| 07:00 | EUR | Germany PPI Y/Y Oct | 41.50% | 45.80% |
Bitcoin down again, ready for 2019 levels?
Both Bitcoin is some selling pressure and looks heading back to this month's low. Negative news for cryptocurrencies are neverending, with reports that giant Digital Currency Group could be in trouble after its crypto lender Genesis was forced to pause withdrawals. The earlier collapse of FTSE was put to blame.
Technically, Bitcoin's consolidation pattern from 15541 might have completed. Break of this low will resume larger down trend to 100% projection of 25198 to 18144 from 21460 at 14406, or even further to 2019 high at 13855. Break of 17134 resistance will delay the bearish case and extend the consolidations first.
Fed Bostic: 75 to 100 basis points of additional tightening warranted
Atlanta Fed President Raphael Bostic said on Saturday, "If the economy proceeds as I expect, I believe that 75 to 100 basis points of additional tightening will be warranted... It's clear that more is needed, and I believe this level of the policy rate will be sufficient to rein in inflation over a reasonable time horizon."
"In terms of pacing, assuming the economy evolves as I expect in the coming weeks, I would be comfortable starting the move away from 75-basis-point increases at the next meeting," he added.
Bostic expected Fed to pause at some point to "let the economic dynamics play out," given that it may take 12-24 months for the effect of rate hikes to be "fully realized."
"I do not think we should continue raising rates until the inflation level has gotten down to 2%. Because of the lag dynamics I discussed earlier, this would guarantee an overshoot and a deep recession," he said.
Technical Outlook and Review
USD/JPY:
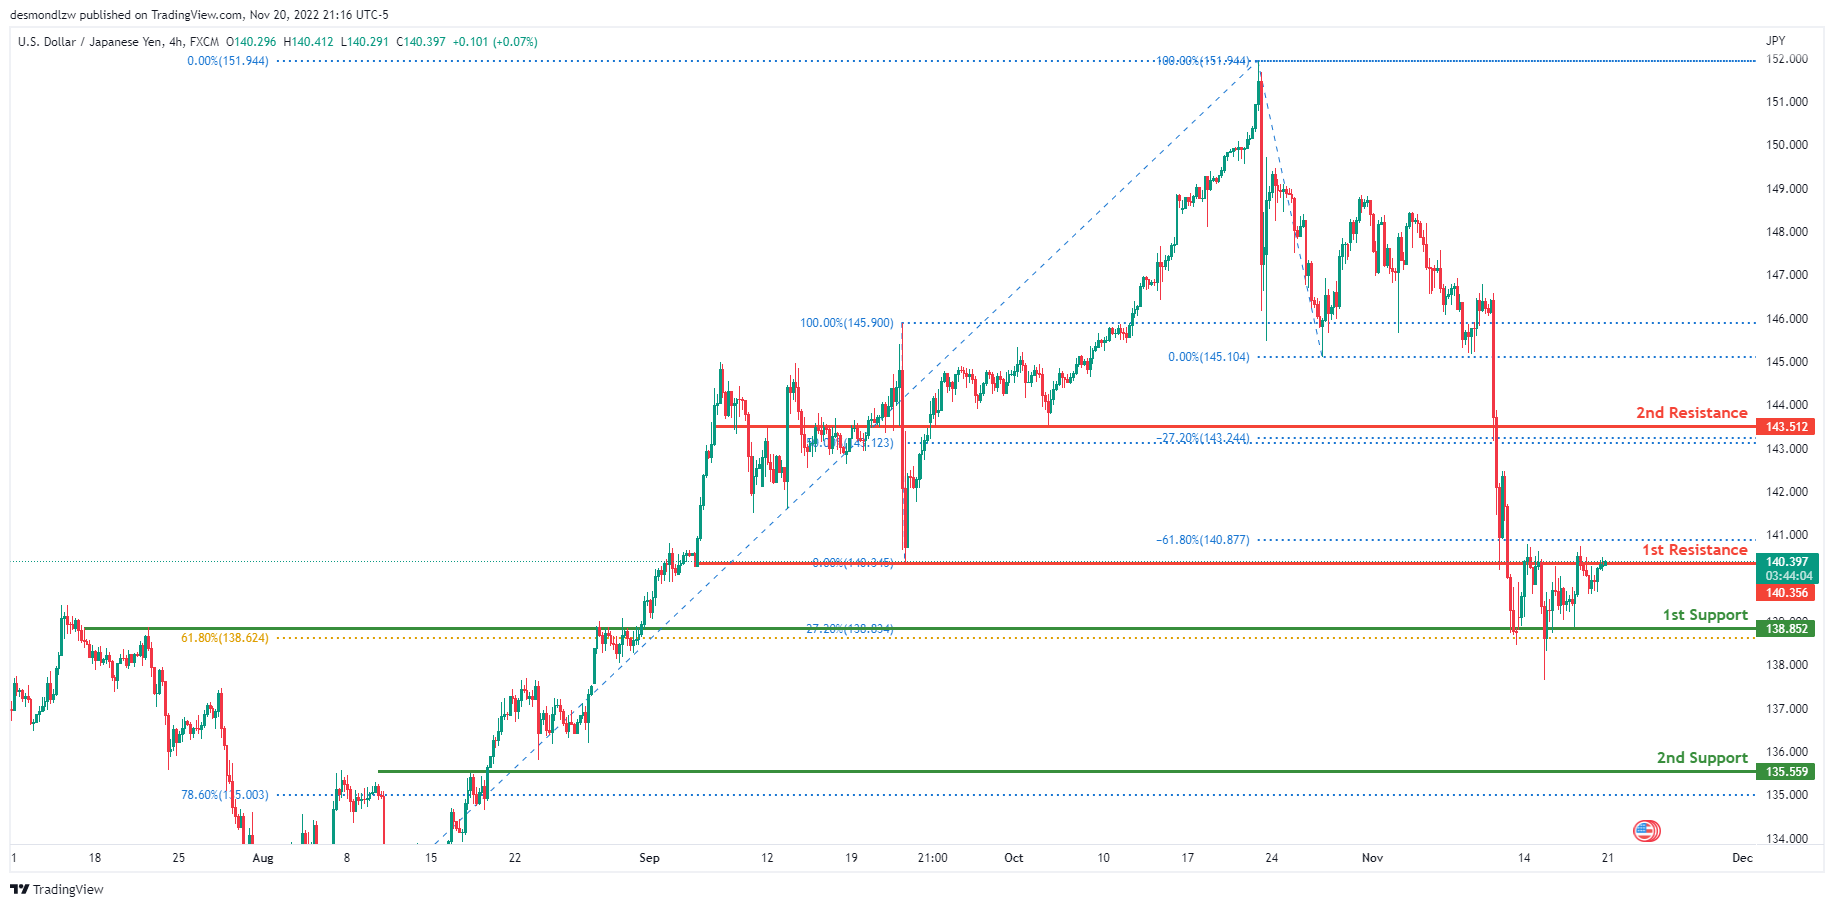
The current general bias for USDJPY on the H4 chart is bearish. To add confluence to this, the price is below the Ichimoku cloud which indicates a bearish market. If the bearish momentum continues, expect USDJPY to break the 1st support line at 138.852 where the -27.2% Fibonacci expansion line is located and head towards the 2nd support line at 135.554 where the 78.6% Fibonacci line is located. In an alternative scenario, price could go back up to break the 1st resistance at 140.356, where the -61.8% Fibonacci expansion line and previous low are located before heading towards the 2nd resistance line at 143.512 where the -27.2% Fibonacci expansion line and 50% Fibonacci line are located.
Areas of consideration:
- H4 time frame, 1st resistance at 140.356
- H4 time frame, 2nd resistance at 143.512
- H4 time frame, 1st support at 138.852
- H4 time frame, 2nd support at 135.554
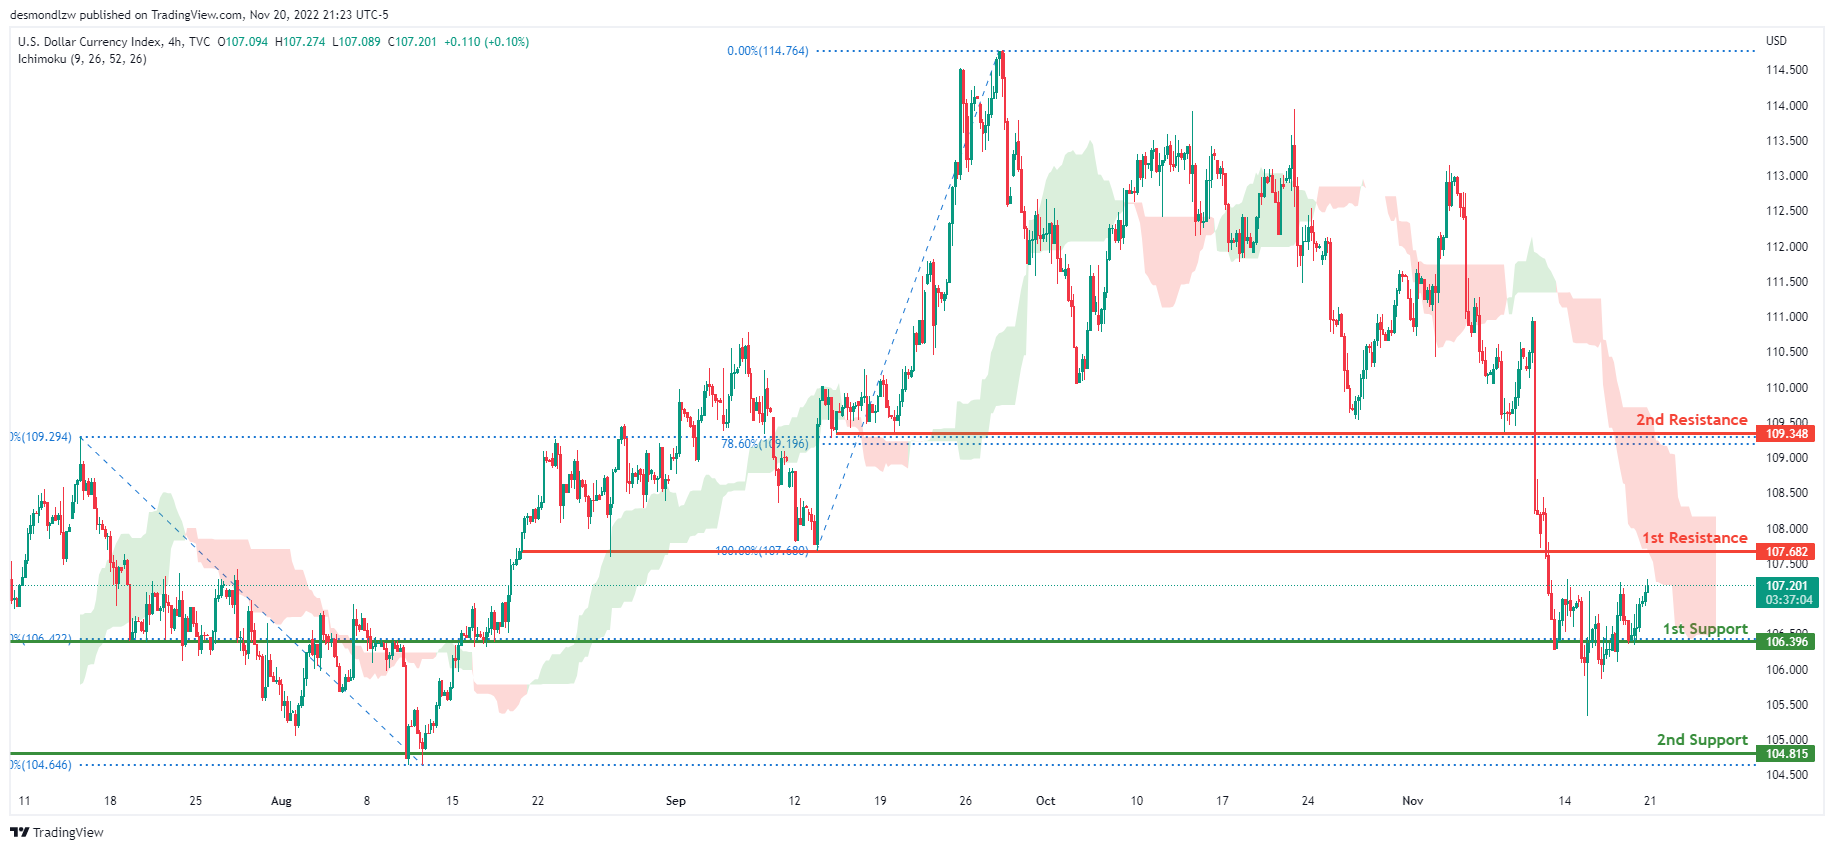
DXY:
On the H4 chart, the overall bias for DXY is bearish. To add confluence to this, the price is below the Ichimoku cloud which indicates a bearish market. If this bearish momentum continues, price could break the 1st support line at 106.396 where the 38.2% fibonacci line is located, before heading towards the 2nd support at 104.815 where the previous low and the 0% Fibonacci line are located. In an alternative scenario, price could head back up and retest the 1st resistance line at 107.682, where the previous low and 100% Fibonacci line are located.
Areas of consideration:
- H4 time frame, 1st resistance at 107.682
- H4 time frame, 1st support at 106.396
- H4 time frame, 2nd support at 104.815
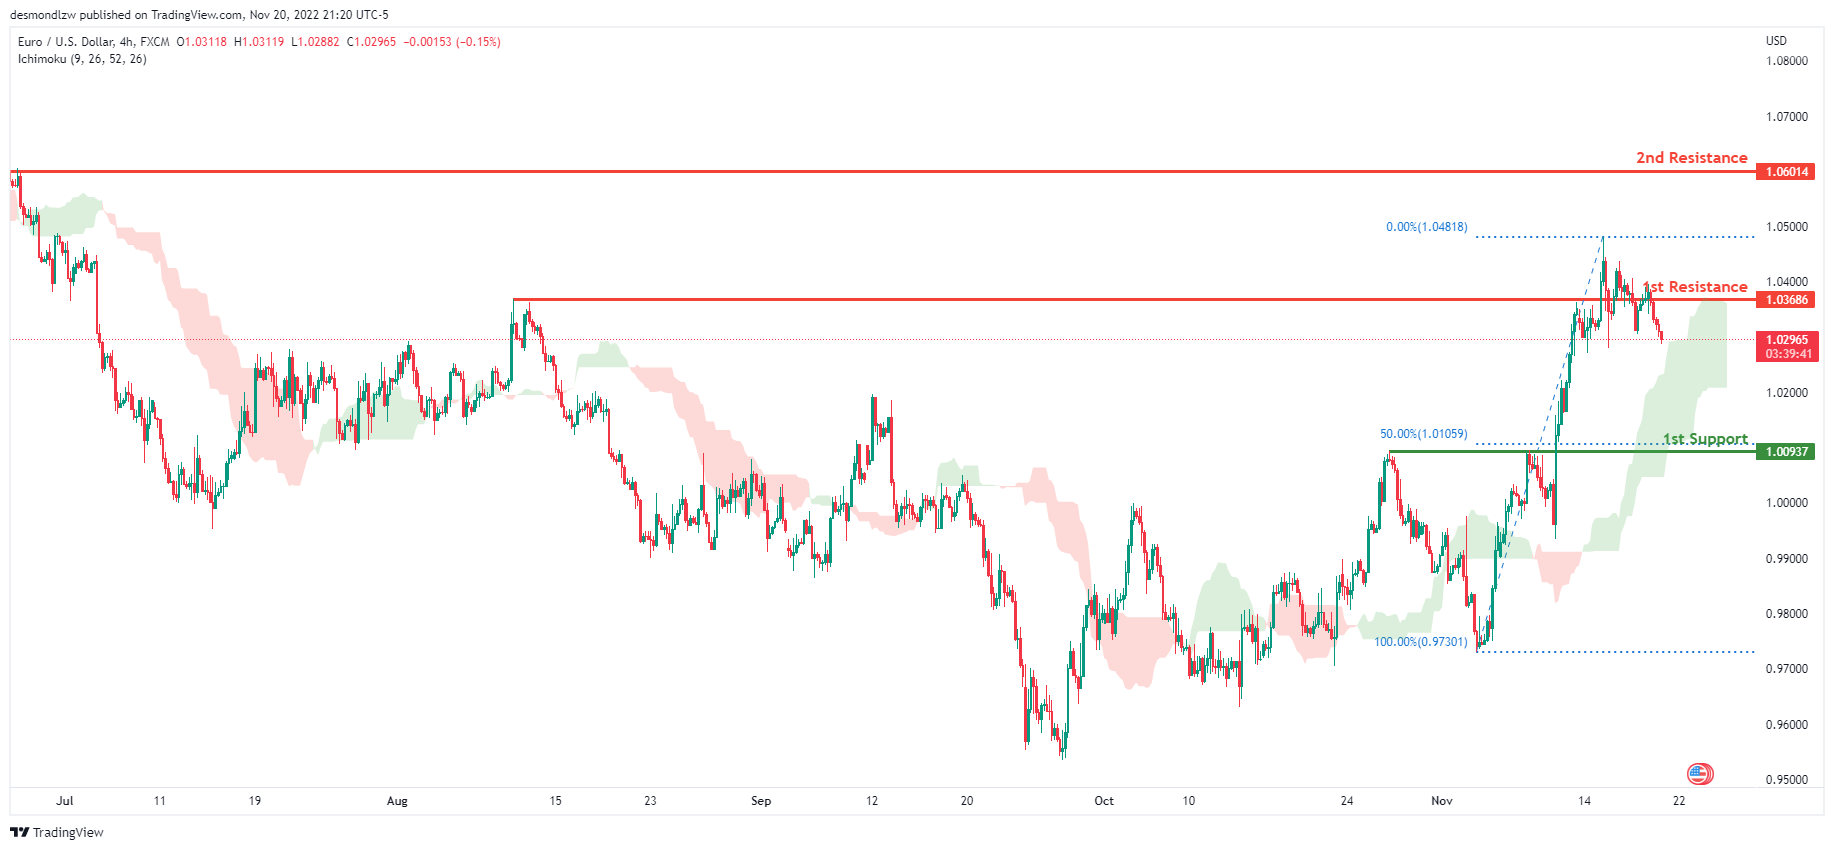
EUR/USD:
Looking at the H4 chart, my overall bias for EURUSD is bullish due to the current price being above the Ichimoku cloud, indicating a bullish market. To add confluence to this bias, price has also broken above the ascending trend line. If this bullish momentum continues, expect the price to possibly head back up to retest the 1st resistance at 1.03686, where the previous swing high is located. In an alternate scenario, price could possibly head back down towards the 1st support level at 1.00937, where the 50% Fibonacci line is located.
Areas of consideration :
- H4 1st resistance at 1.03686
- H4 1st support at 1.00937
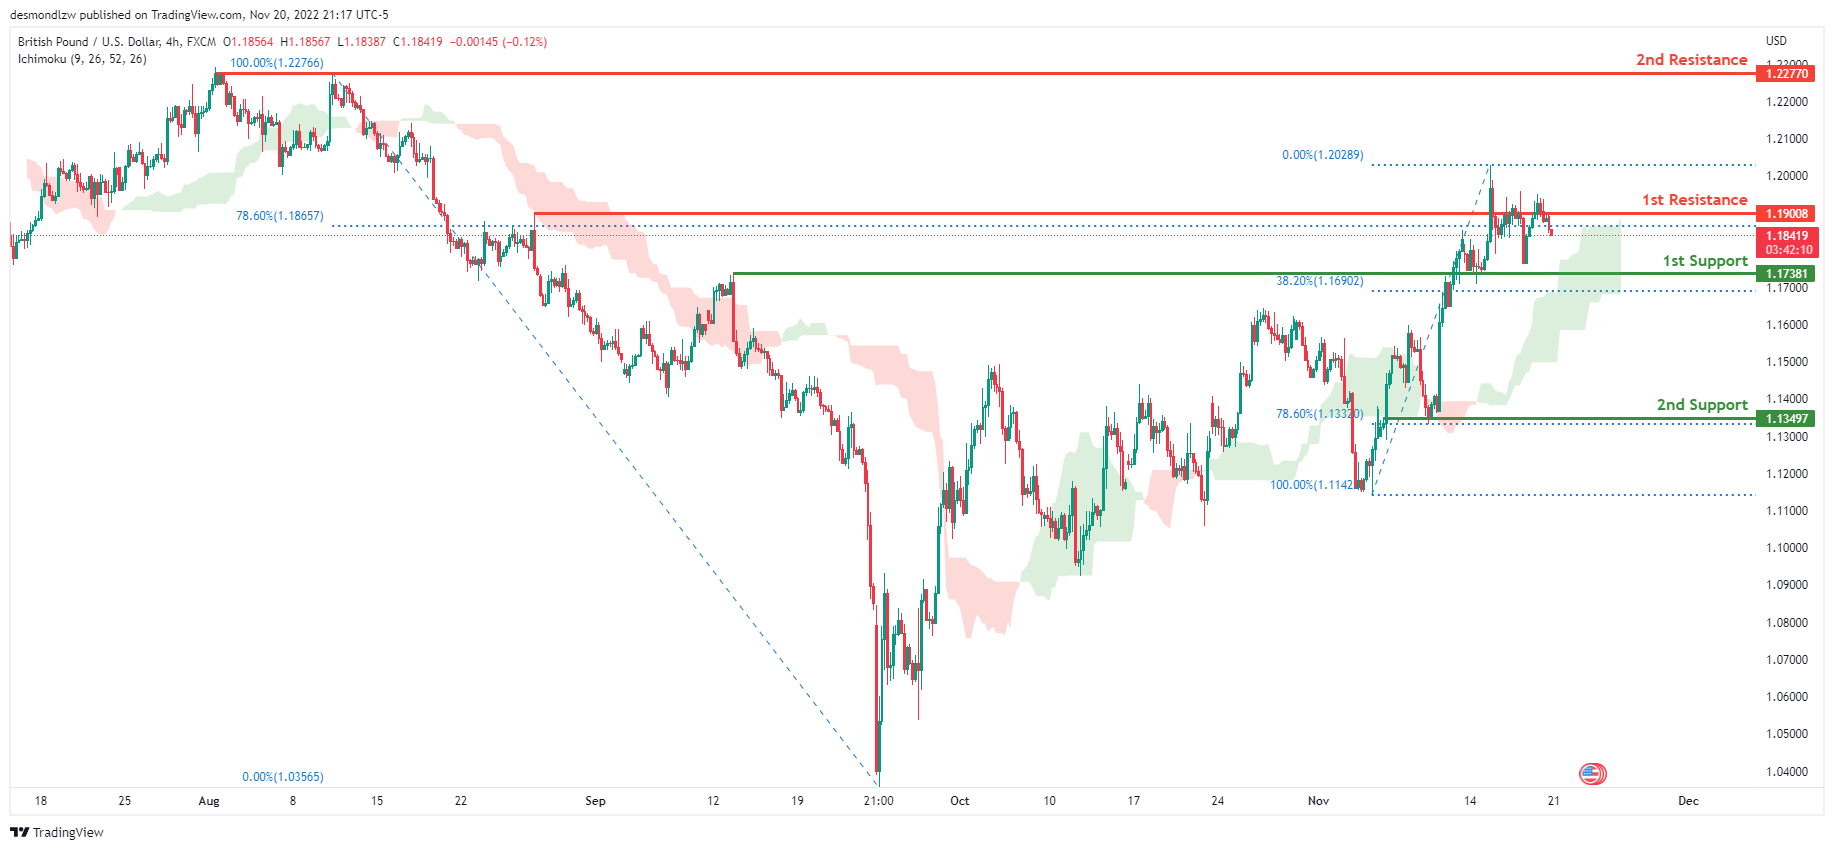
GBP/USD:
On the H4, the price is moving above the ichimoku cloud, suggesting that the price may break the first resistance level at 1.19008, which corresponds to the 78.6% fibonacci and the previous swing high, before heading to the 2nd resistance line at 1.22770, where the previous swing high is. Alternatively, the price may break the first support level at 1.17381, which is where the previous swing high and 38.2% Fibonacci line are, before moving on to the second support level at 1.13497, which is the 78.6% Fibonacci line.
Areas of consideration:
- H4 1st resistance at 1.19008
- H4 2nd resistance at 1.22770
- H4 1st support at 1.17381
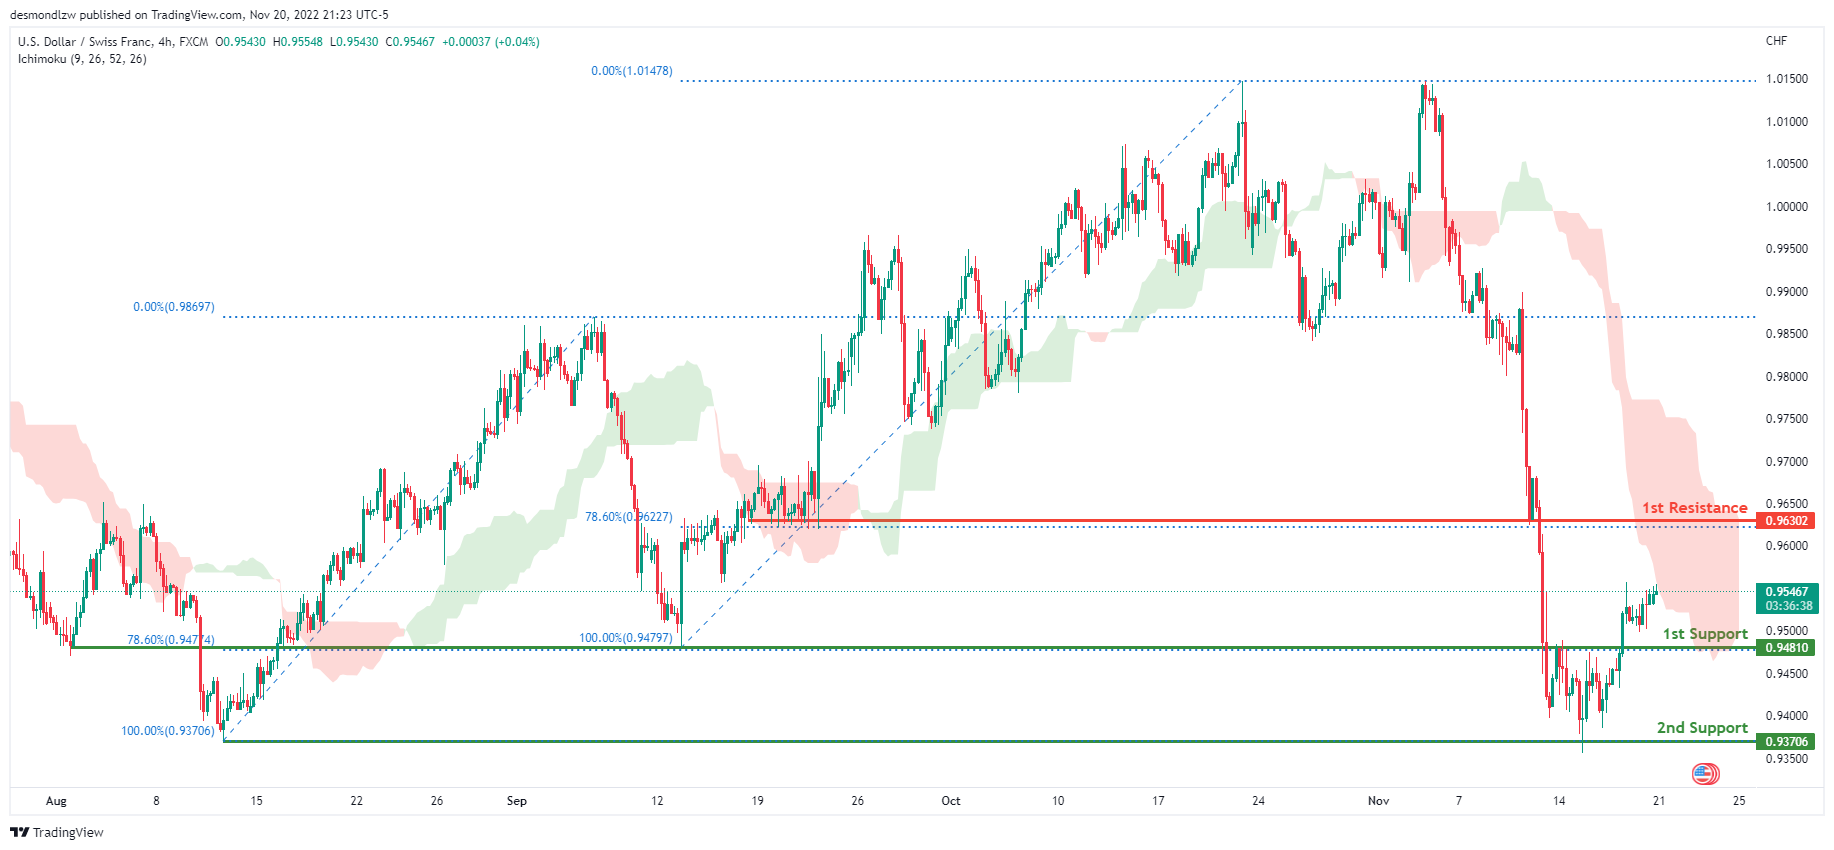
USD/CHF:
The overall bias for USDCHF on the H4 chart is bearish. In addition, the price is below the Ichimoku cloud, indicating a bearish market. If the current bearish trend continues, the price might move back down to retest the first support line at 0.94810, where the 78.6% Fibonacci line is. In an alternate scenario, price could rise towards the first resistance line at 0.96302, where the 78.6% Fibonacci line is.
Areas of consideration
- H4 1st support at 0.94810
- H4 1st resistance at 0.96302
XAU/USD (GOLD):
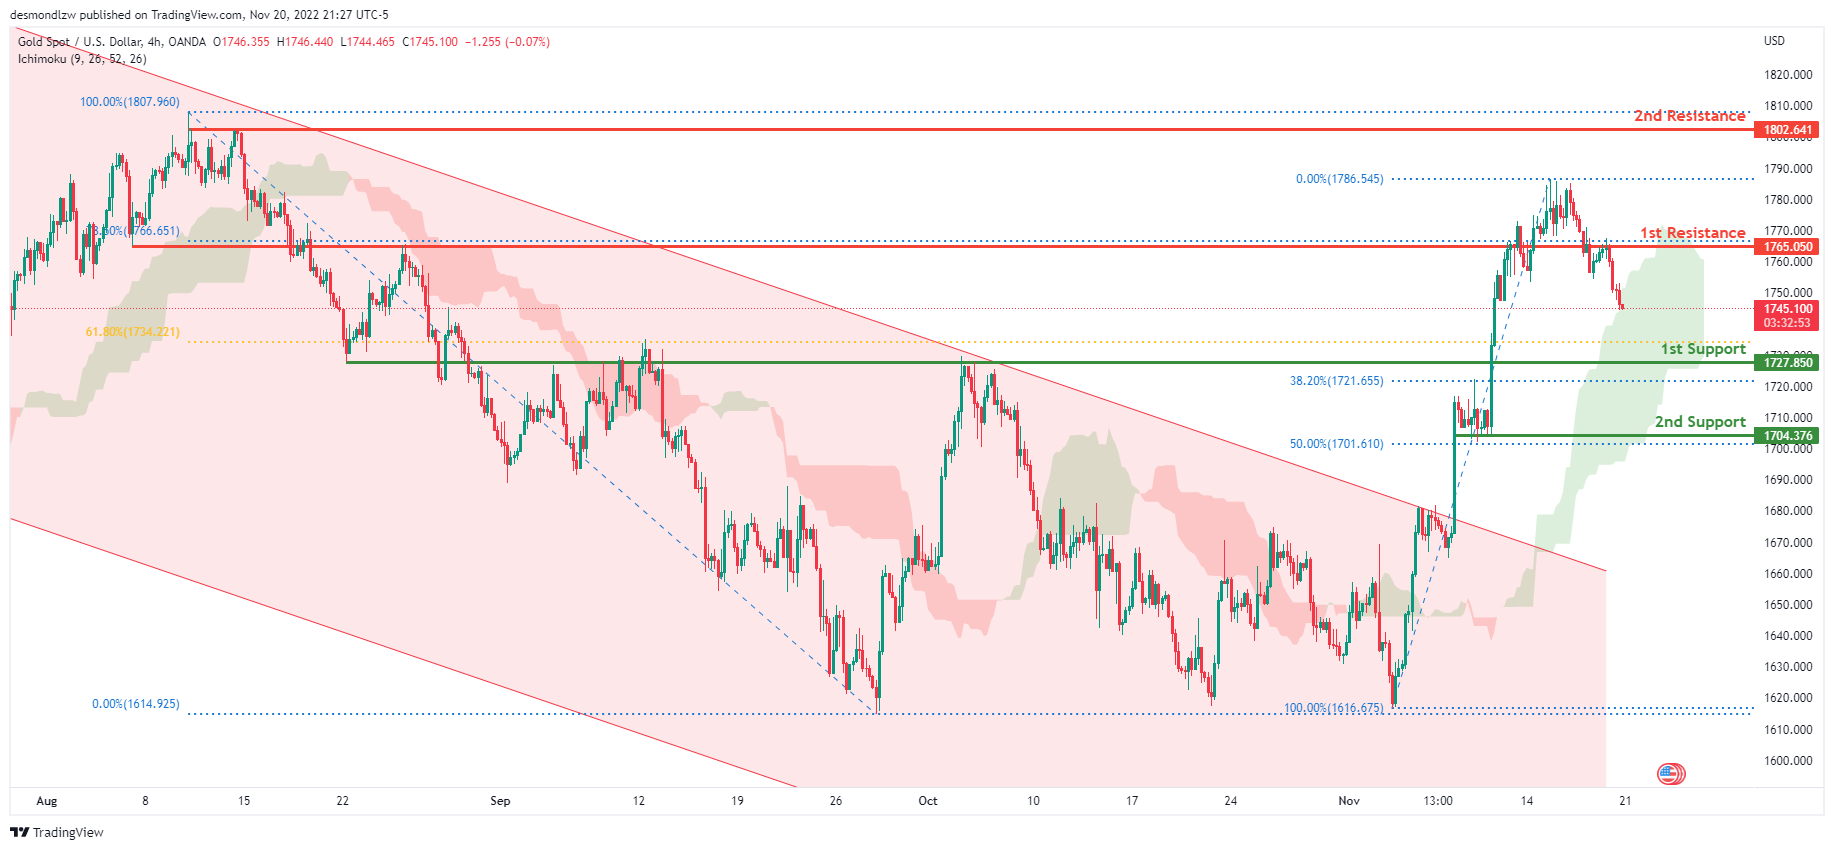
Looking at the H4 chart, my overall bias for XAUUSD is bullish due to the current price being above the Ichimoku cloud, indicating a bullish market. To add confluence to this bias, price has also broken above the descending channel. If this bullish momentum continues, expect price to possibly head towards the 1st resistance at 1765.050, where the 78.6% Fibonacci line is located. In an alternate scenario, price could possibly head back down towards the 1st support level at 1727.850, where the 38.2% and 61.8% Fibonacci lines are located.
Areas of consideration:
- H4 time frame, 1st resistance at 1765.483
- H4 time frame, 1st support at 1727.850
AUD/USD:
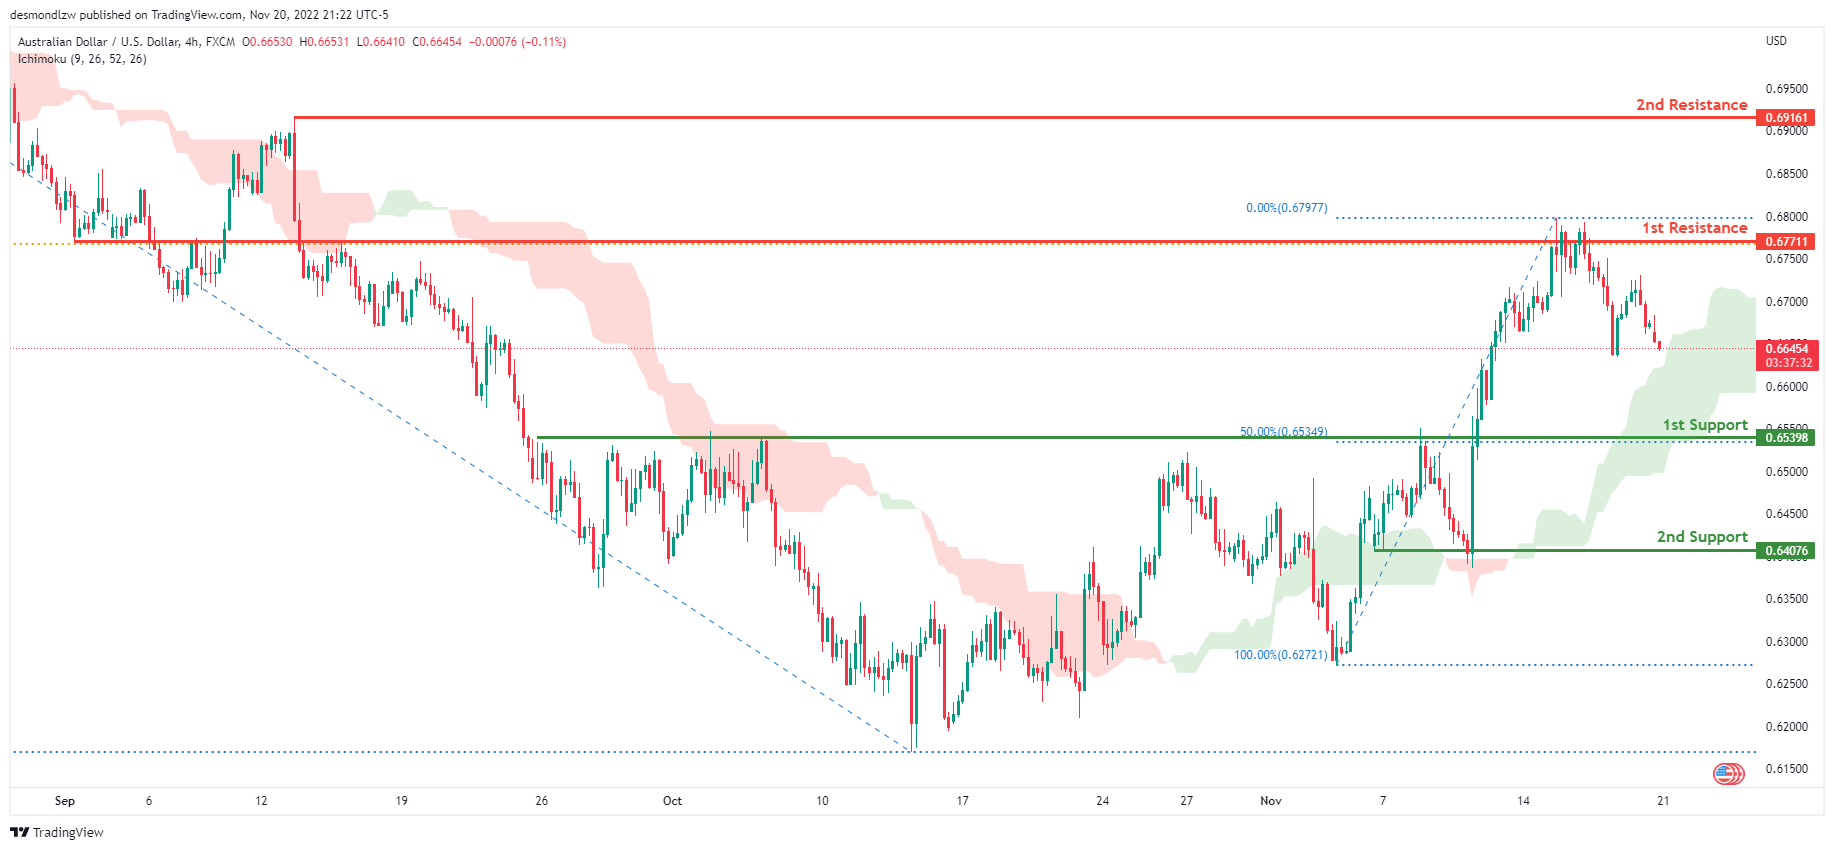
With the price moving above the ichimoku cloud on the H4, we have a bullish bias that the price may break the first resistance at 0.67711, which is in line with the 61.8% fibonacci line, before heading towards the 2nd resistance line at 0.69161, the previous swing high. Alternatively, the price could fall to the first support level at 0.65398, which is marked by the 50% Fibonacci line.
Areas of consideration
- H4, 1st resistance at 0.67711
- H4, 2nd resistance at 0.69161
- H4, 1st support at 0.65398
NZD/USD:
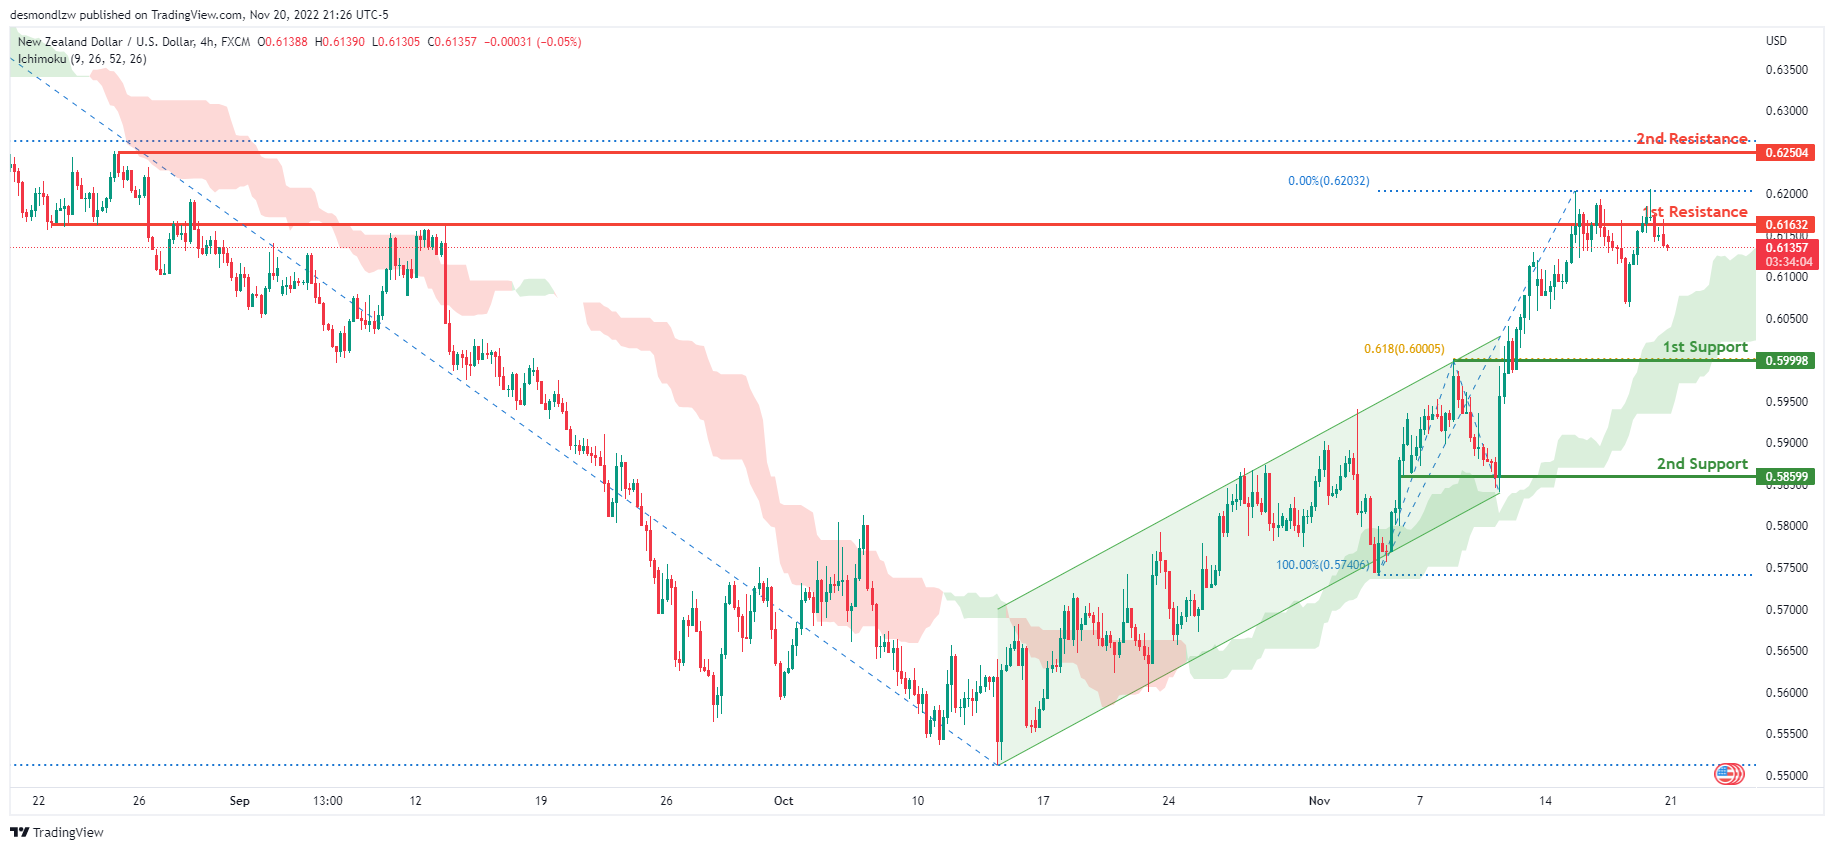
On the H4 chart, the price is moving above the Ichimoku cloud and has broken out of the ascending channel. If this bullish momentum continues, the price may break the 1st resistance at 0.61632, which is in line with the previous swing high and 0% fibonacci line, before heading towards the 2nd resistance line at 0.62504, where the 78.6% Fibonacci line is. Alternatively, the price may head back towards the 1st support at 0.59998, where the 61.8% Fibonacci projection line is located.
Areas of consideration:
- H4 time frame, 1st resistance at 0.61632
- H4 time frame, 1st support at 0.59998
USD/CAD:
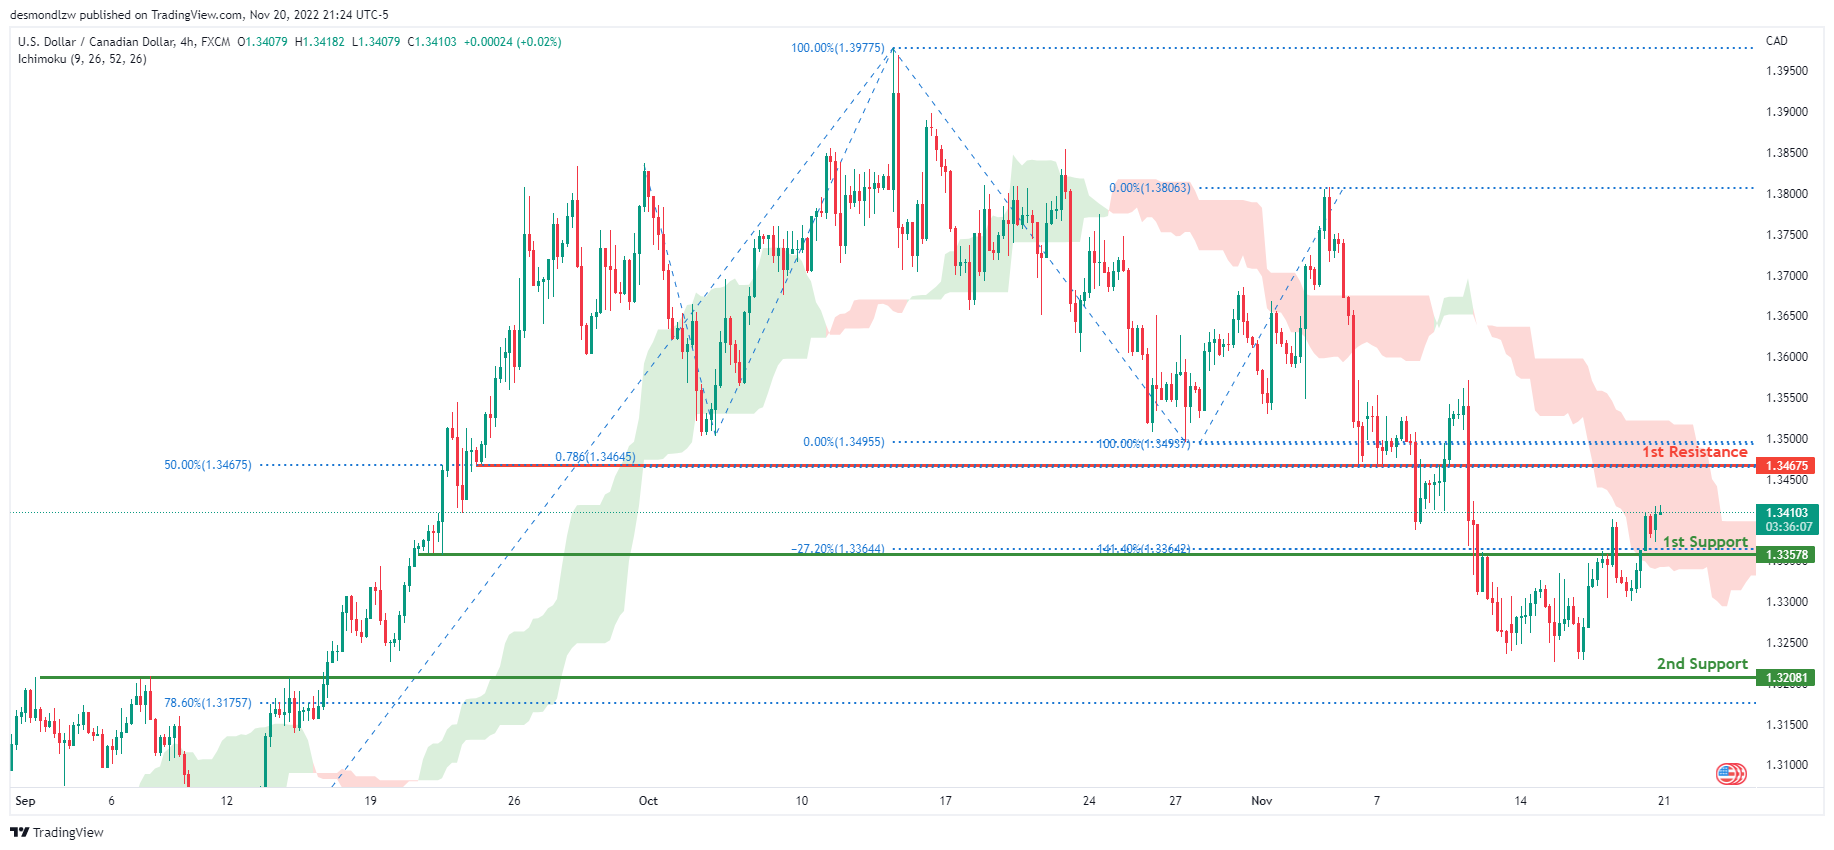
On the H4 chart, the overall bias for USDCAD is bearish. To add confluence to this, the price is below the Ichimoku cloud which indicates a bearish market. If this bearish momentum continues, expect the price to head down towards the 1st resistance line at 1.34675, where the 50% Fibonacci line and 78.6% Fibonacci projection line is. In an alternative scenario, price could head back down to retest the 1st support line at 1.33578, where the -27.2% Fibonacci expansion line and 141.4% Fibonacci line is.
Areas of consideration:
- H4 time frame, 1st resistance at 1.34675
- H4 time frame, 1st support at 1.33578
OIL:
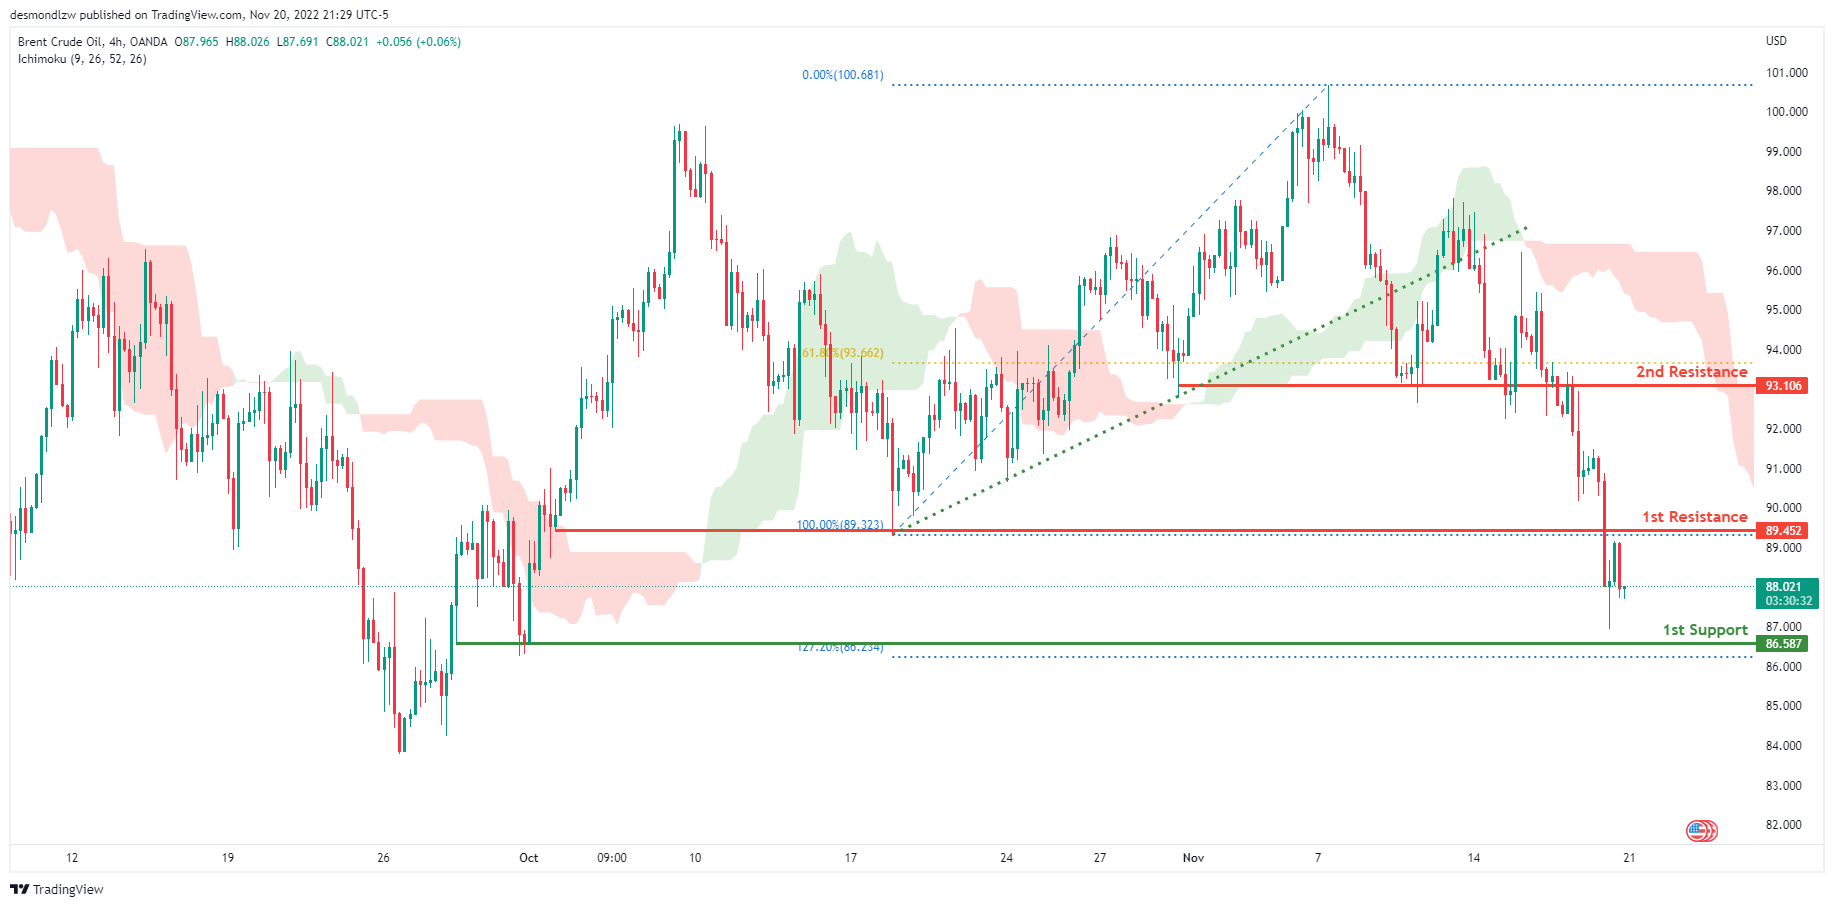
Looking at the H4 chart, my overall bias for BCOUSD is bearish due to the current price being below the Ichimoku cloud, indicating a bearish market. If this bearish momentum continues, expect price to possibly head towards the 1st support at 86.587, where the 127.2% Fibonacci extension line is located. In an alternate scenario, price could possibly head back up towards the 1st resistance level at 89.452, where the previous swing low is located.
Areas of consideration:
- H4 time frame, 1st resistance at 89.452
- H4 time frame, 1st support at 86.587
- H4 time frame, 2nd support at 89.452
Dow Jones Industrial Average:
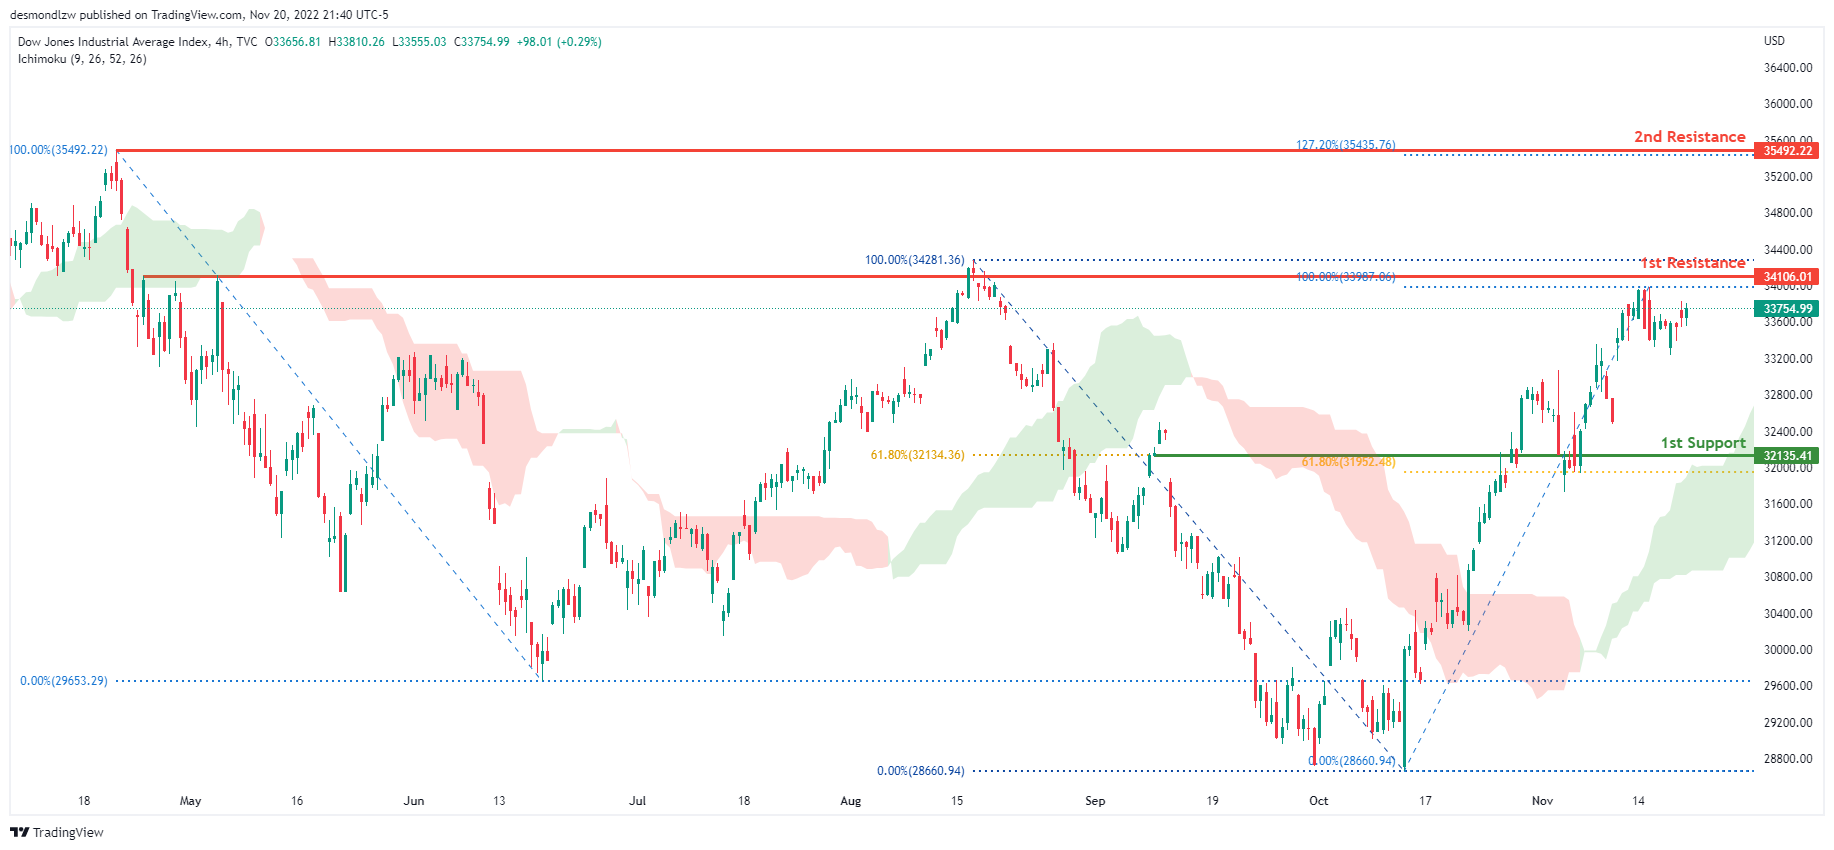
On the H4 chart, the overall bias for DJI is bullish. To add confluence to this, the price is above the Ichimoku cloud which indicates a bullish market. If this bullish momentum continues, expect the price to possibly head towards the 1st resistance at 34106.01 where the previous high and 100% Fibonacci line is located. In an alternative scenario, price could head towards the 1st support line at 32135.41, where 2 of the 61.8% Fibonacci lines are located.
Areas of consideration:
- H4 time frame, 1st support at 32135.41
- H4 time frame, 1st Resistance at 34106.01
DAX:
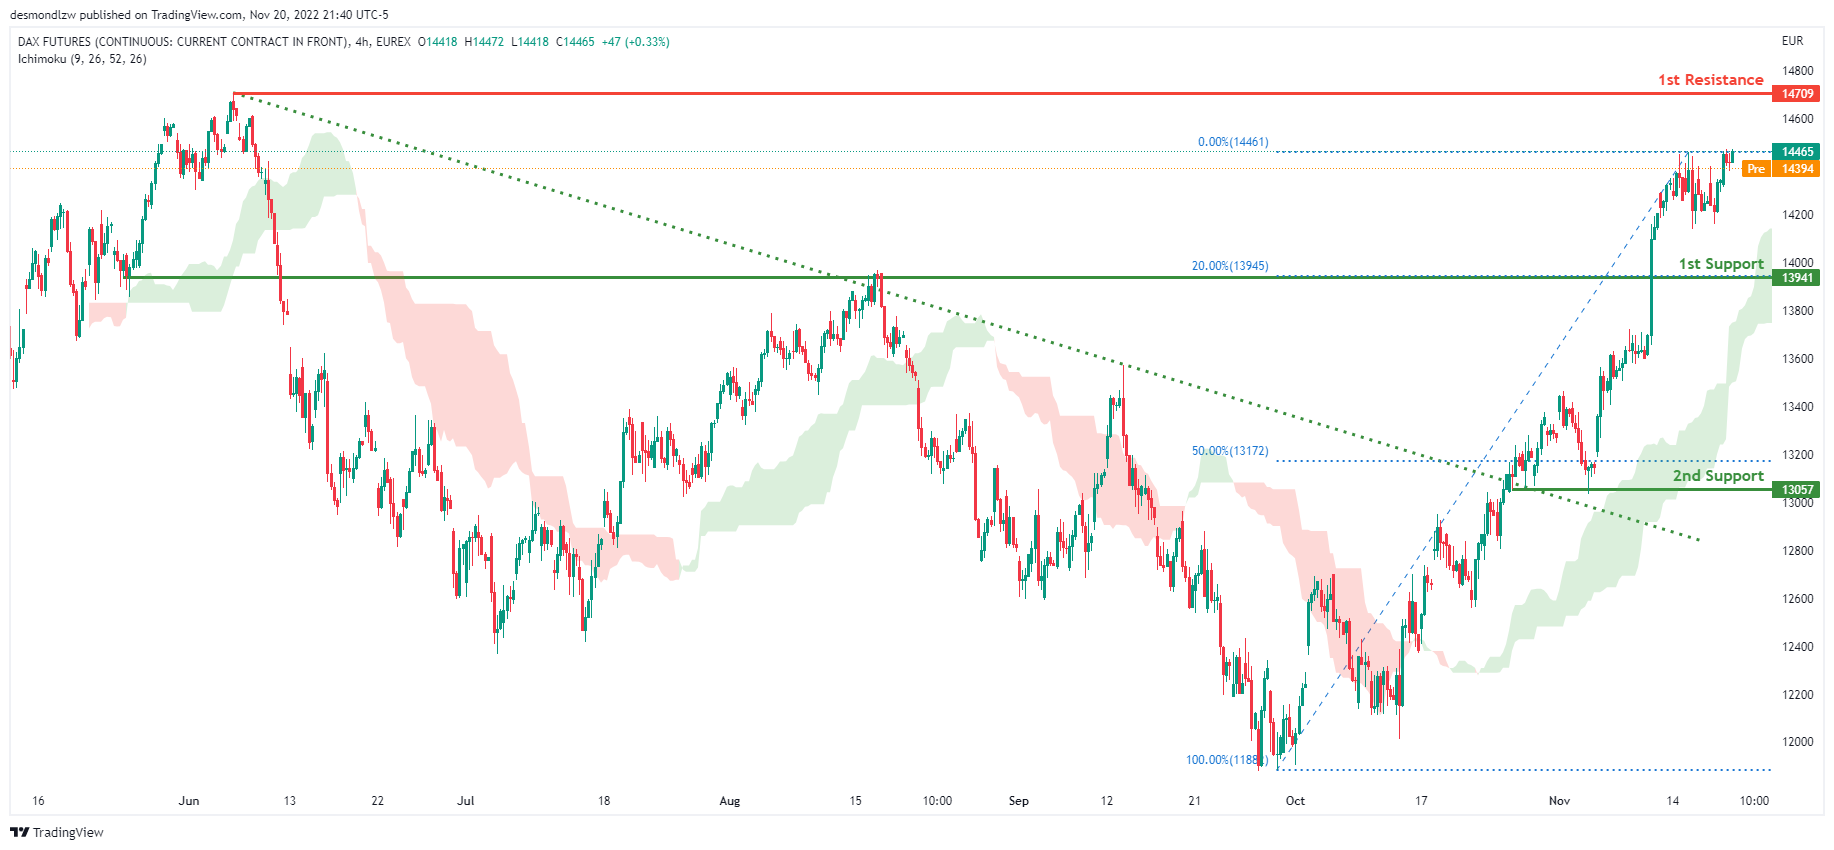
The H4 chart shows a bullish bias, with price breaking through the descending trendline and rising above the Ichimoku cloud. Price is expected to maintain its bullish momentum and rise to the first resistance level at 14709, where the previous swing high is located. Alternatively, the price could fall to the first support level at 13941, which corresponds to the 20% Fibonacci line.
Areas of consideration:
- H4 time frame, 1st resistance is at 14709
- H4 time frame, 1st support is at 13941
ETHUSD:
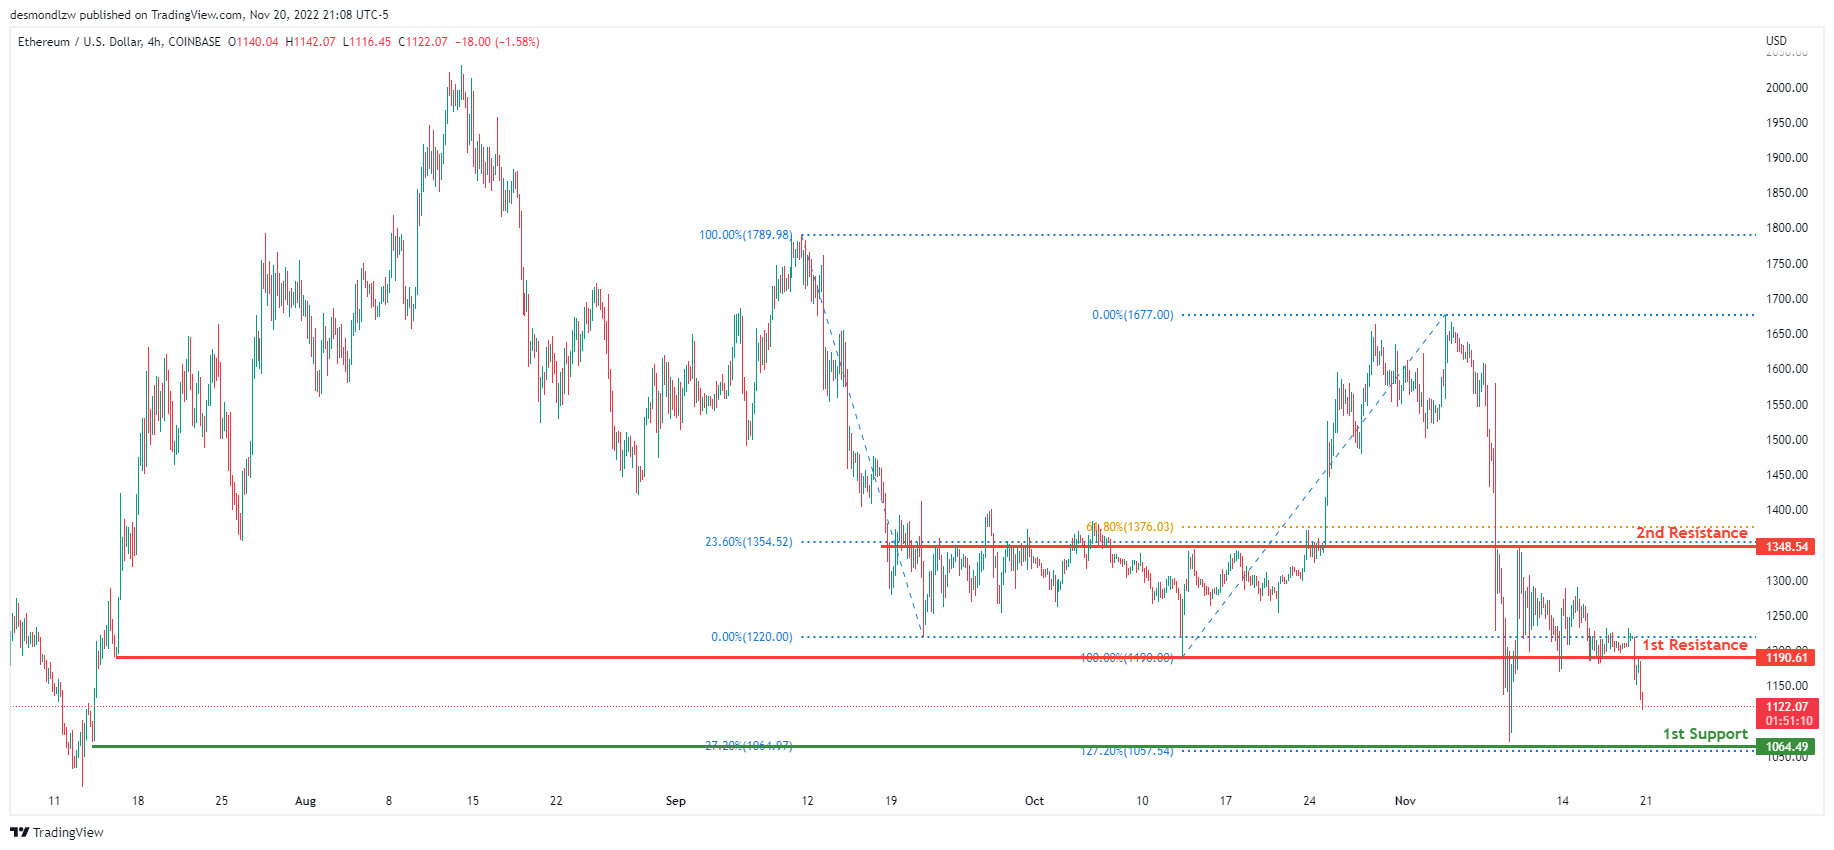
Looking at the H4 chart, my overall bias for XXX is bearish due to the current price being below the Ichimoku cloud, indicating a bearish market .If this bearish momentum continues, expect price to possibly head towards the 1st support at 1064.49, where the -27.2% Fibonacci expansion line and 127.2% Fibonacci extension line are located. In an alternate scenario, price could possibly head back up towards the 1st resistance level at 1190.61, where the previous swing low is located.
Areas of consideration:
- H4 time frame, 1st resistance of 1190.61
- H4 time frame, 1st support at 1064.49
BTCUSD:
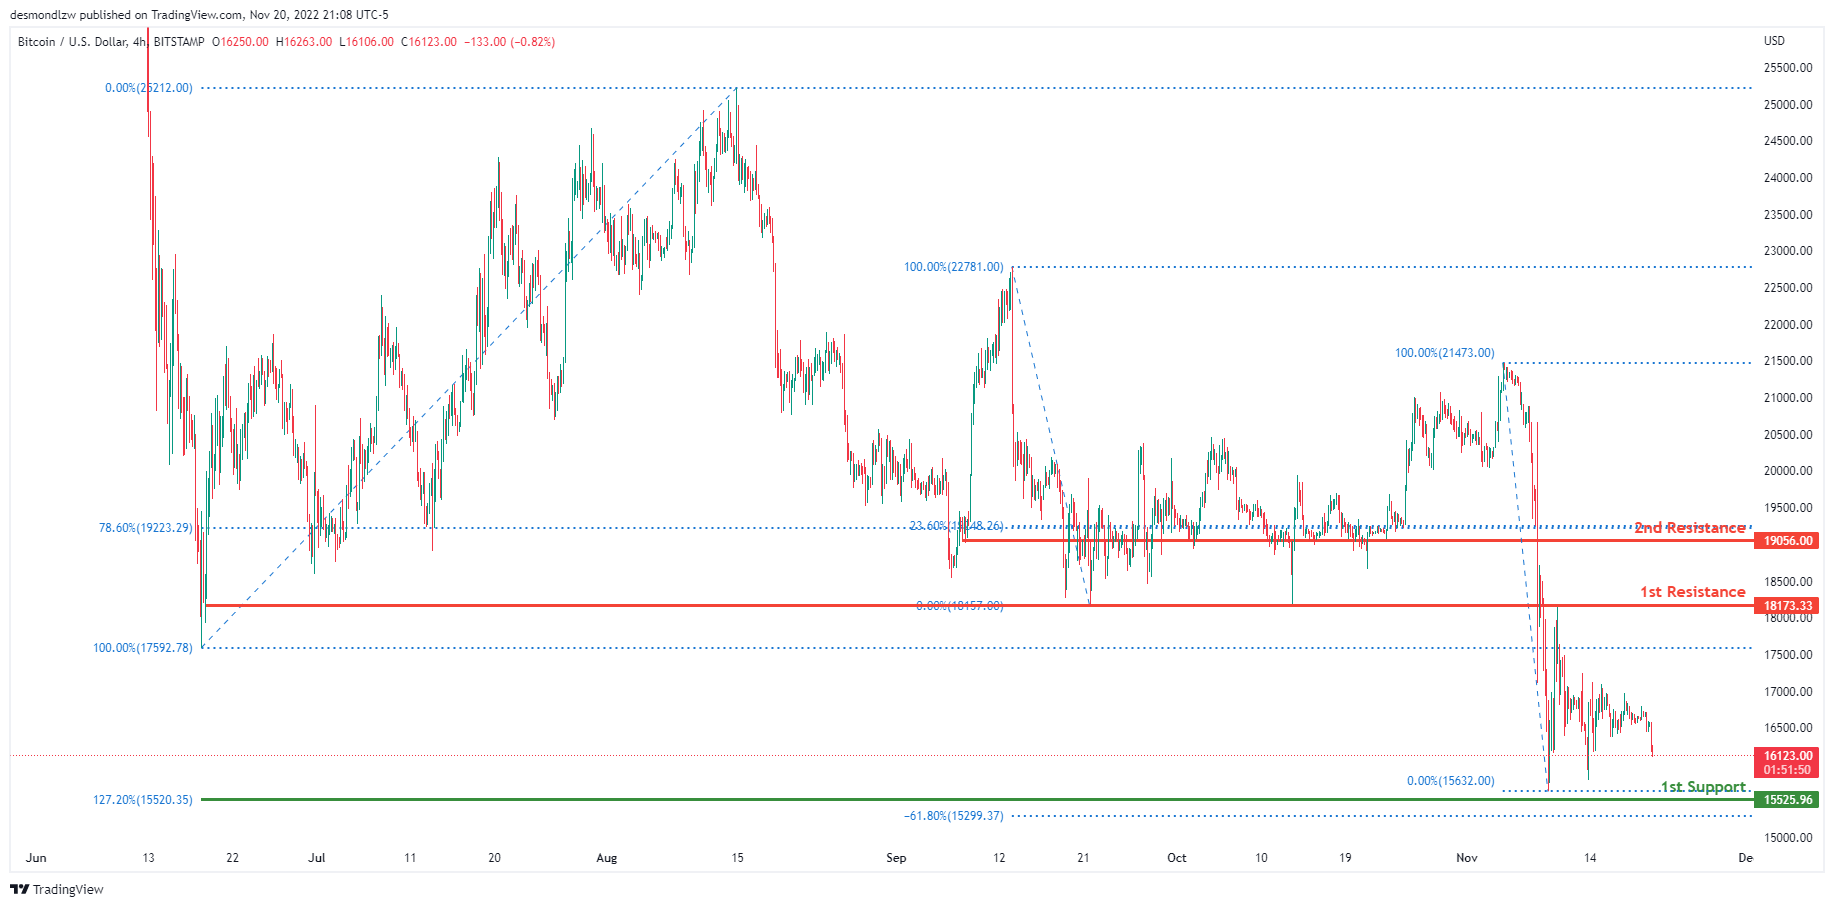
On the H4 chart, the overall bias for BTCUSD is bearish. To add confluence to this, the price is below the Ichimoku cloud which indicates a bearish market. If this bearish momentum continues, expect the price to head towards the 1st support line at 15525.96, where the 127.2% Fibonacci extension line and -61.8% Fibonacci expansion line is located. In an alternative scenario, price could head back up to retest the 1st resistance line at 18173.33, where the previous low and 0% Fibonacci line is located.
Areas of consideration:
- H4 time frame, 1st resistance 18173.33
- H4 time frame, 1st support at 15525.96
S&P 500:
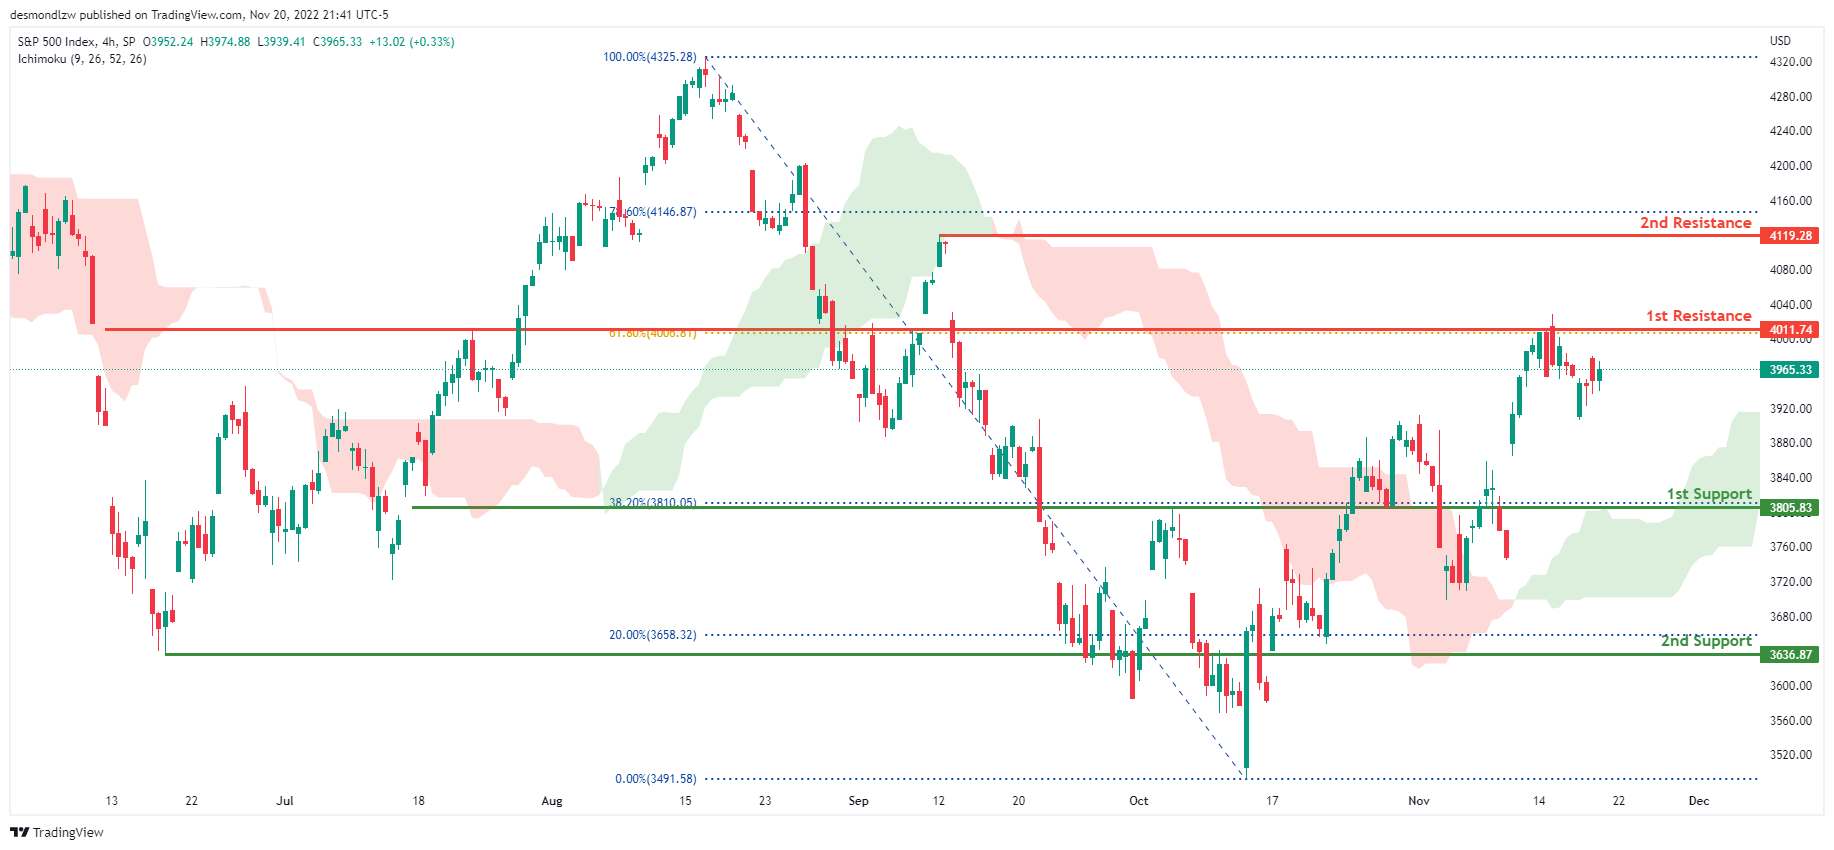
The overall bias for the S&500 on the H4 chart is bullish, with prices above the Ichimoku cloud. If the bullish momentum continues, the price will rise to the first resistance line at 4011.74, where the 61.8% Fibonacci line is located. If the first resistance line is broken, the second resistance line is at 4119.28, which is the previous swing high and the 78.6% Fibonacci line. In an alternate scenario, price could return to the first support line at 3805.83, where the 38.2% Fibonacci line is located.
Areas of consideration:
- H4 time frame, 1st support at 3805.83
- H4 time frame, 1st resistance at 4011.74
- H4 time frame, 2nd resistance at 4119.28
EUR/USD Starts Correction, Key Support Nearby
Key Highlights
- EUR/USD gained pace for a move above the 1.0400 resistance.
- A key bullish trend line is forming with support near 1.0280 on the 4-hours chart.
- GBP/USD remains elevated above the 1.1800 resistance zone.
- Oil price declined heavily below the $83.20 support zone.
EUR/USD Technical Analysis
The Euro started a steady increase above the 1.0150 and 1.0250 resistance levels against the US Dollar. EUR/USD even broke the 1.0320 resistance zone.
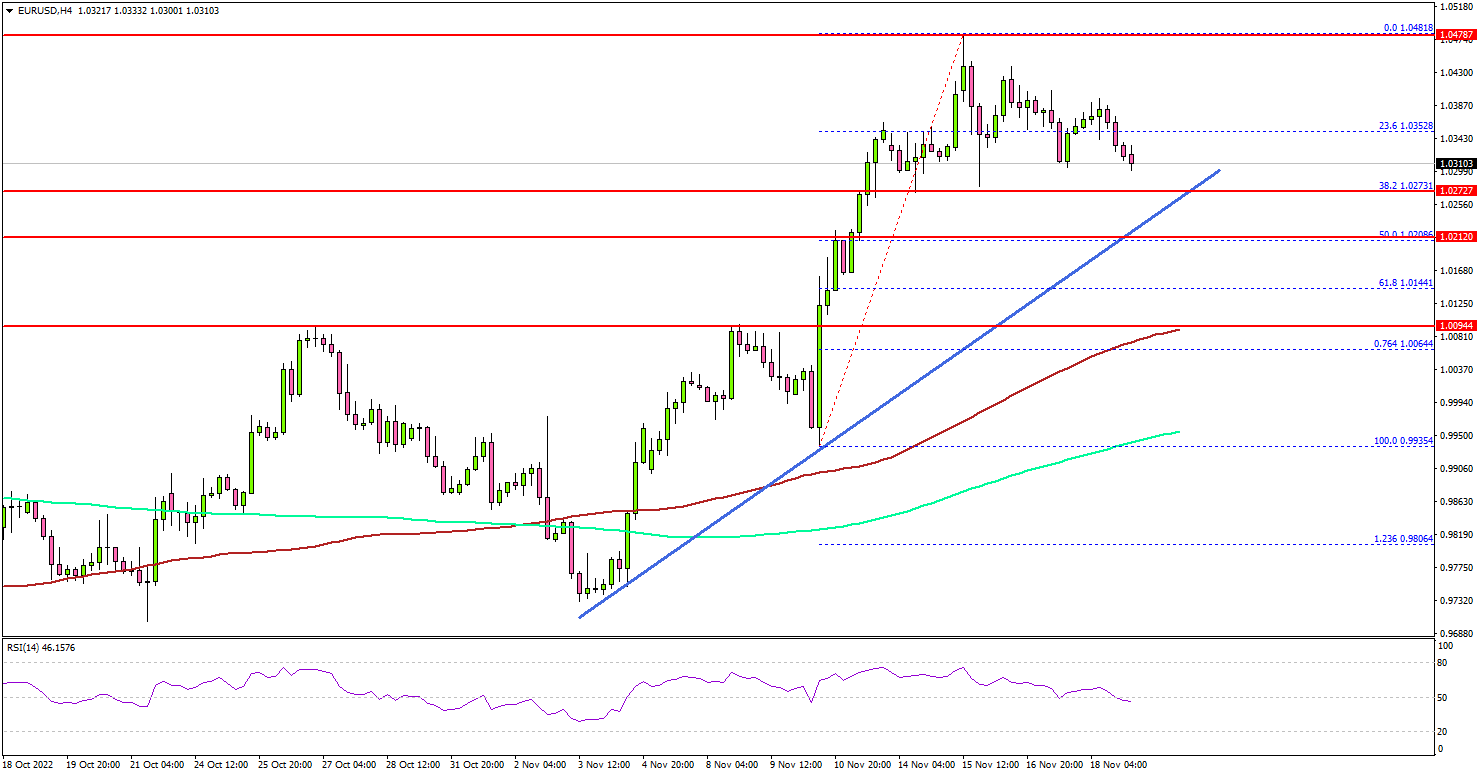
Looking at the 4-hours chart, the pair settled above the 1.0300 level, the 100 simple moving average (red, 4-hours) plus the 200 simple moving average (green, 4-hours).
It traded as high as 1.0481 and recently started a downside correction. It traded below the 1.0400 support level. There was a move below the 23.6% Fib retracement level of the upward move from the 0.9935 swing low to 1.0481 high.
An initial support is near the 1.0280 level. There is also a key bullish trend line forming with support near 1.0280 on the same chart.
The next major support is near the 1.0200 zone. It is near the 50% Fib retracement level of the upward move from the 0.9935 swing low to 1.0481 high. The main support sits at 1.0100. A close below the 1.0100 level might start another strong decline.
In the stated case, EUR/USD could decline towards the 1.0000 support. On the upside, an immediate resistance is near 1.0385 level. The next major resistance may perhaps be near 1.0400. Any more gains could set the pace for a move towards the 1.0480 resistance zone.
Looking at oil price, there was a major decline below the $84.00 and $83.20 levels before the bulls took a stand near the $78.80 level.
Economic Releases
- Chicago Fed National Activity Index for Oct 2022 – Forecast 0.10, versus 0.10 previous.
Dollar Ready for a Rebound as Risk Rally Loses Momentum
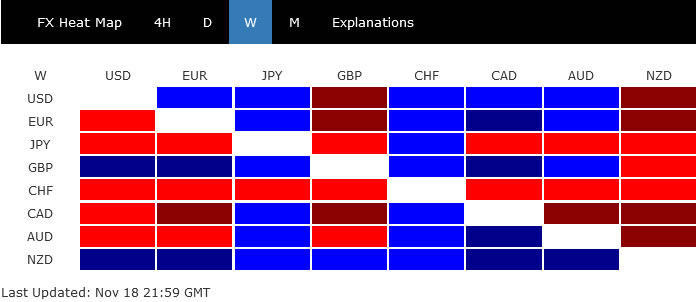
The post-CPI selloff in Dollar and rally in US stocks faded last week, after Fed officials talked down the significance of just one data point. While the greenback still lacked momentum for sustainable recovery, selloff has at least slowed. The greenback ended the week mixed together with Euro.
On the one hand New Zealand Dollar was the best performer, as traders look forward to a jumbo 75bps hike by RBNZ. Sterling followed as second, with no disastrous response to the UK government's new budget. Swiss Franc and Yen were the weakest ones while Canadian dollar followed, as weighed down by falling oil prices.
Looking ahead, there is prospect of finally a stronger rebound in Dollar, considering the risk of a near term pull back in stocks, and recovery in yields. Also, retreat in gold price and extended decline in oil could give the greenback a helping hand.
DOW losing upside momentum as Fed hawks returned
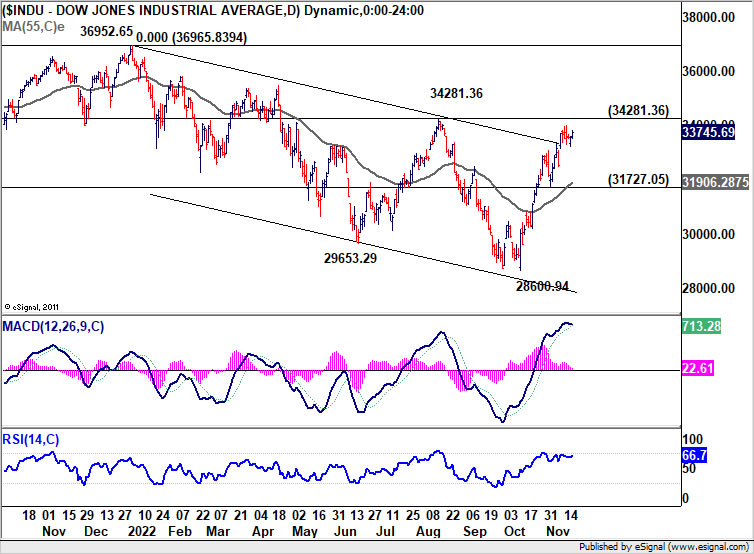
Rally in the US stock markets started to lost momentum after a chorus of Fed officials emphasized not to over interpret just one month of inflation data. Tightening is set to continue, and interest rates will stay at "sufficiently restrictive" levels until inflation shows sign of returning to target sustainably. So what is "sufficiently restrictive"? According to St. Louis Fed President James Bullard, rates could be anywhere between 5%-7%.
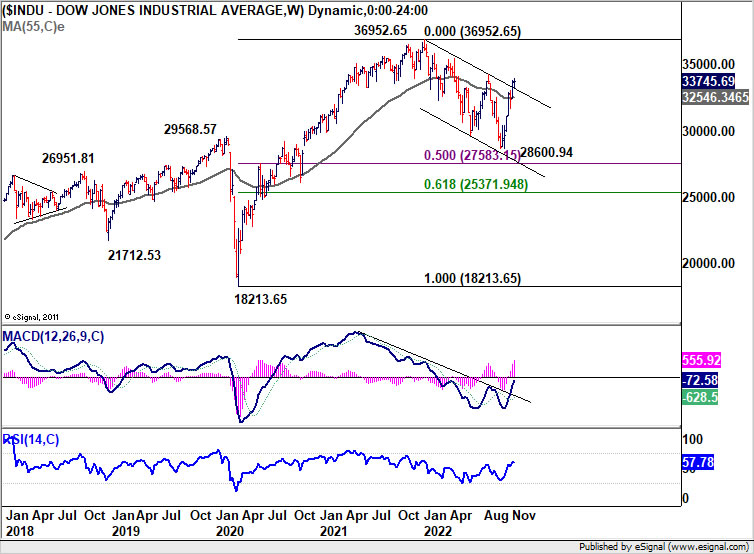
DOW closed the week nearly flat after engaging in sideway trading in very tight range. It's starting to lose upside momentum slightly as seen in daily MACD. While further rise cannot be ruled out, upside is likely to be limited by 34281.36 resistance on first attempt to bring a pull back. That could start to happen in the coming week or two.
But overall, near term bullish outlook will remain in favor as long as 31727.05 support holds. That is, corrective pattern from 36952.65 has completed with three waves down to 28600.94. Firm break of 3481.36 will pave the way to retest 36952.65. That might happen in the early part of next year.
10-year yield drawing support from 55 day EMA
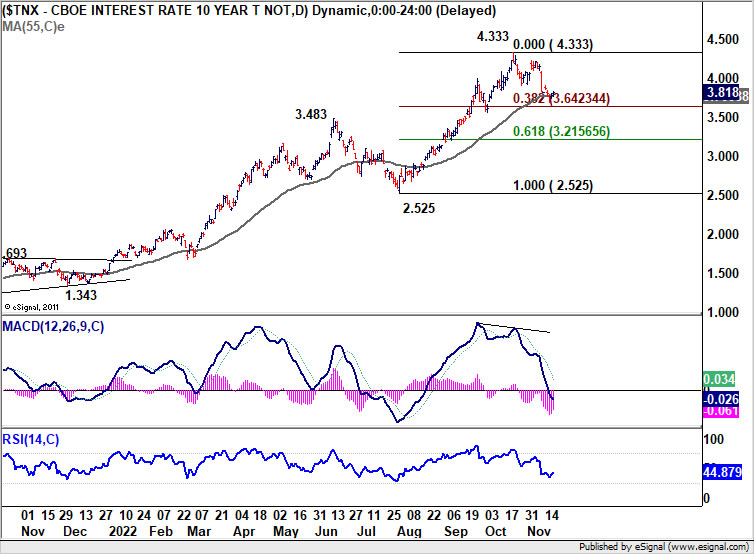
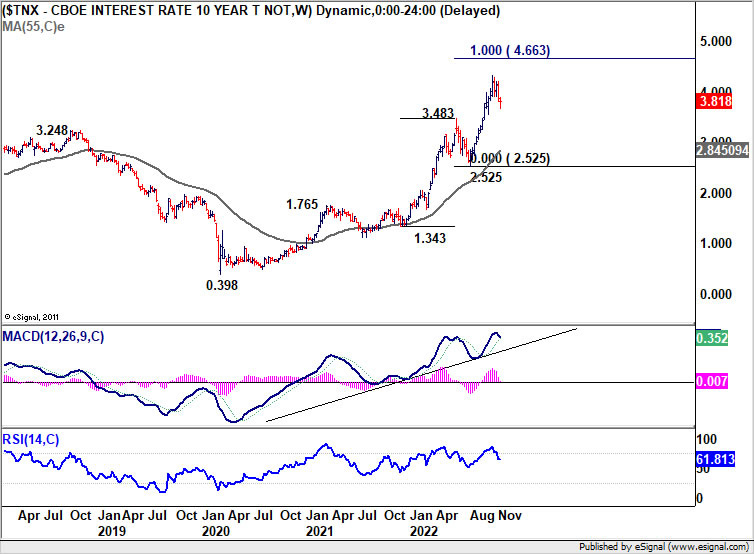
10-year yield stabilized after a brief dip to 3.692 and closed the week nearly flat too. Outlook is unchanged that it's merely in a correction to rise from 2.525. Strong support is expected from current zone of 55 day EMA (now at 3.768) and 38.2% retracement of 2.525 to 4.333 at 3.642 to bring rebound.
There is little prospect for TNX to break through 4.333 high in the near term. That is, range trading between 3.642/4.333 is envisaged.
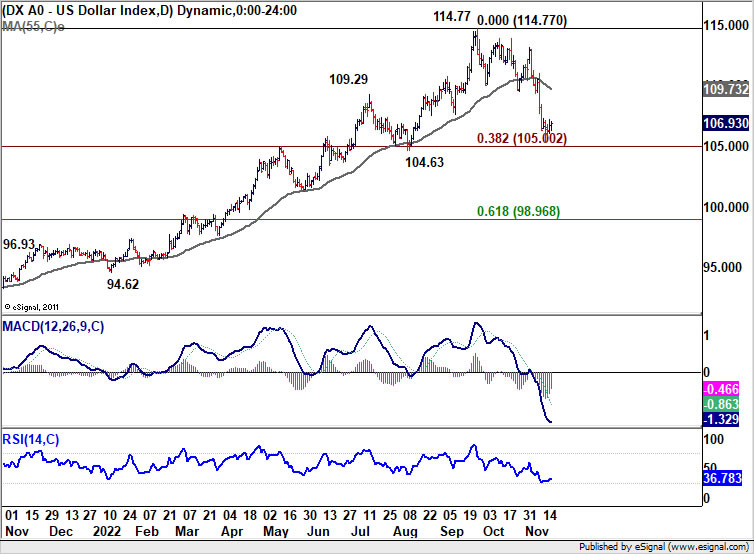
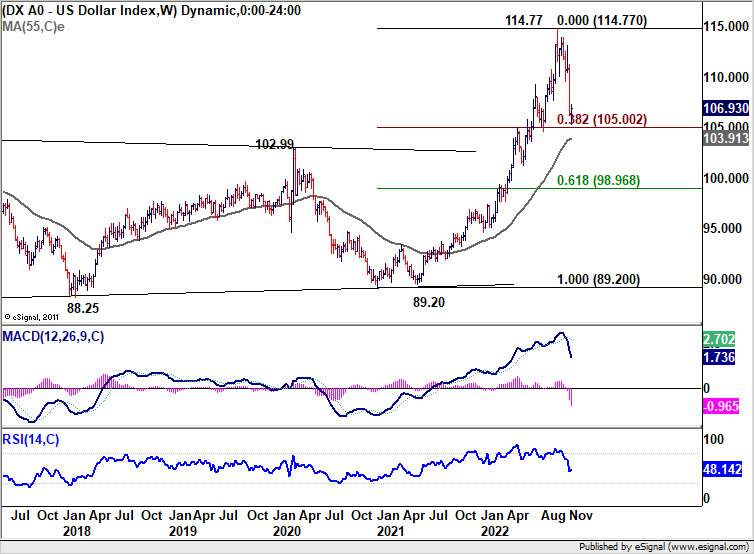
Rebound in Dollar index to happen any time
Dollar index closed the week slightly higher after initial dip to 105.34. DXY is now close to an important support zone at 104.63, 38.2% retracement of 89.20 to 114.77 at 105.00, and 55 week EMA at 103.91. So a rebound could happen any time. Break above last week's high at 107.27 could trigger buying back towards 55 day EMA (109.73).
The overall conditions for DXY to rebound should there if DOW does start the pull back as mentioned above, while 10-year yield also recovers.
WTI oil ready for down trend resumption
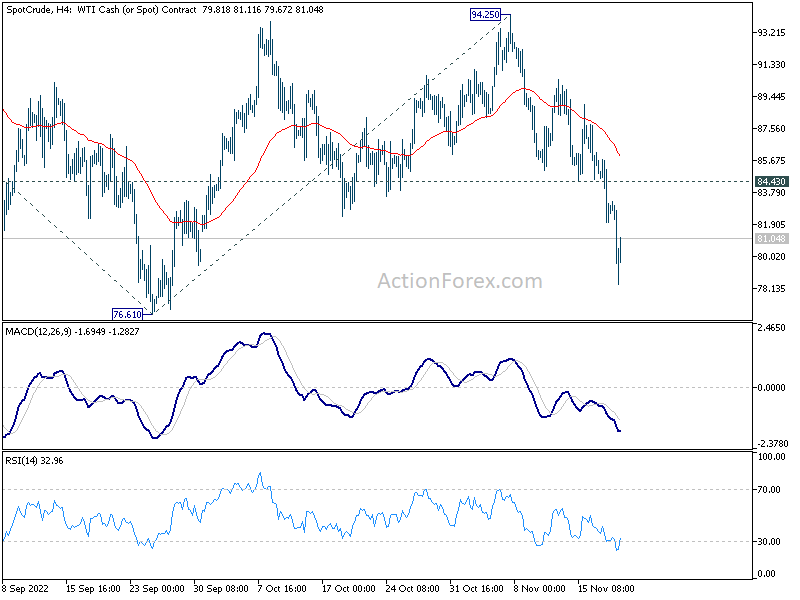
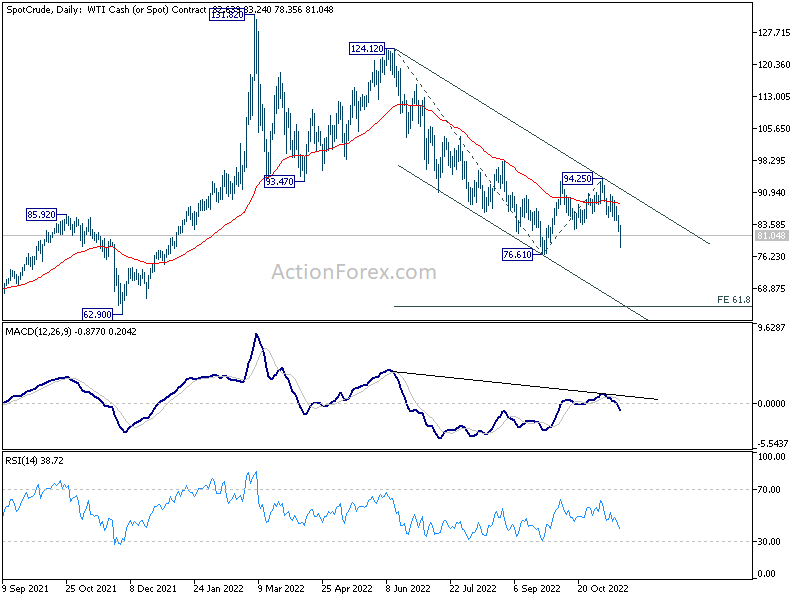
Development in oil prices could be used as a gauge to confirm overall risk sentiment. WTI oil logged a second weekly decline as weighed down by concern over China. While there were steps in easing the strict zero-COVID policy, skyrocketing infections could eventually force the government to reinstate tough lockdown measures. After all, unlike almost all other countries in the world, the vaccination status in China is a big unknown.
Last week's decline suggests that WTI's corrective rebound from 76.61 has completed with three waves up to 94.25. Immediate focus is now on 76.61 low. Firm break there will resume whole down trend from 131.82 high. Next target will be 61.8% projection of 124.12 to 76.61 from 94.25 at 64.88.
While it's indeed too early to tell whether the down trend would really hit the above mentioned target, a break through 76.61 should come in tandem with pull back in stocks, and a stronger recovery in Dollar.
Gold topped in short term, starting pull back
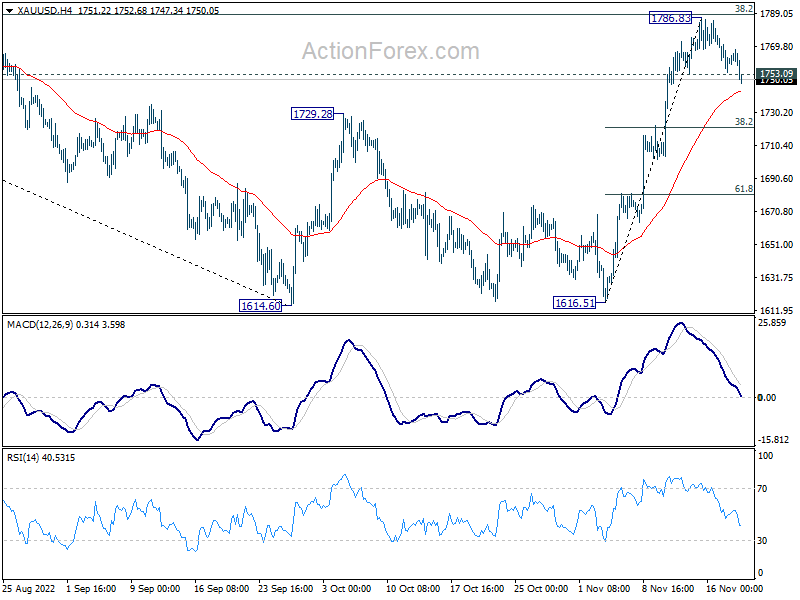
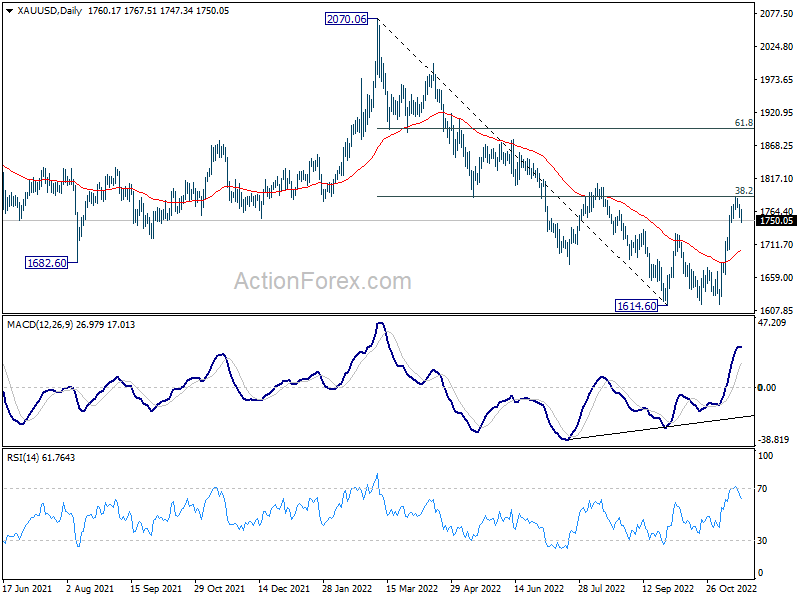
Taking about the prospect of a rebound in Dollar, Gold's pull back is also worth a note. The break of 1753.09 minor support last week indicates short term topping at 1786.83. That came just ahead of 38.2% retracement of 2070.06 to 1614.60 at 1788.58.
Deeper decline is in favor in Gold in the short term. Firm break of 4 hour 55 EMA (now at 1742.44) would pave the way to 38.2% retracement of 1616.51 to 1786.83 at 1721.76, or even further to 55 day EMA (now at 1702.80). If that happens, such pull back should be accompanied by a stronger rebound in Dollar in general.
NZD/USD lost momentum ahead of 0.6257 fibonacci level
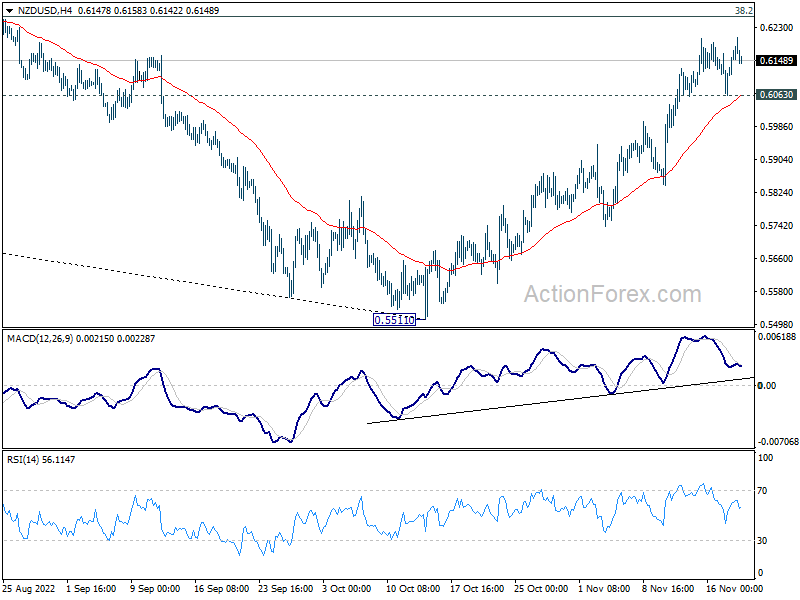
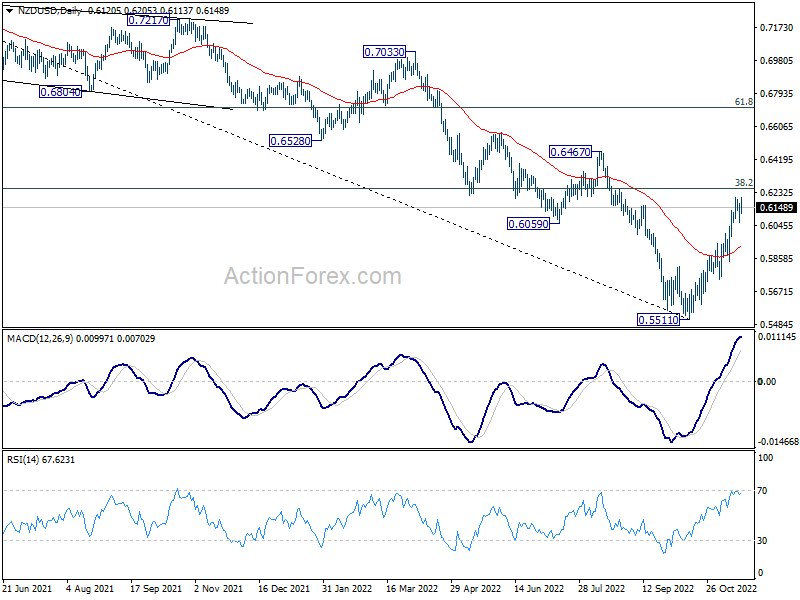
New Zealand Dollar ended as the strongest one last week, ahead of a jumbo 75bps rate hike by RBNZ in the coming Wednesday. Nevertheless, NZD/USD is clearly losing momentum ahead of 38.2% retracement of 0.7463 (2021 high) to 0.5511 at 0.6257.
Rejection by 0.6257, followed by break of 0.6063 minor support, will argue that a short term top is formed. Deeper retreat could then be seen back to 55 day EMA (now at 0.5927). If that happens, it would be another sign that Dollar's rebound is underway.
USD/CAD Weekly Outlook
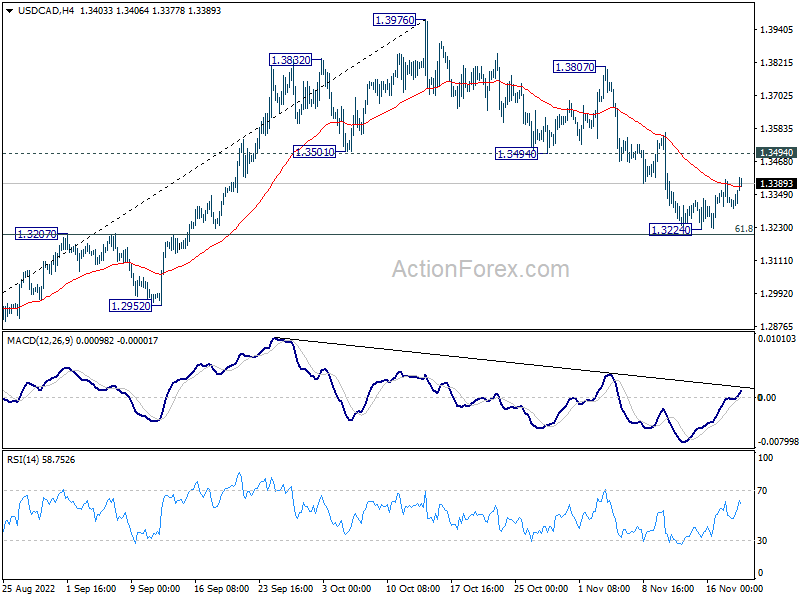
USD/CAD recover ahead of 1.3207 cluster support (61.8% retracement of 1.2726 to 1.3976 at 1.3204) last week. But upside is limited well below 1.3494 support turned resistance. Initial bias remains neutral this week first. On the upside, firm break of 1.3494 will indicate that correction from 1.3976 has completed at 1.3224. Intraday bias will be turned back to the upside for 1.3807/3976 resistance zone. However, on the downside, sustained break of 1.3204/7 will carry larger bearish implication and target 1.2952 support next.
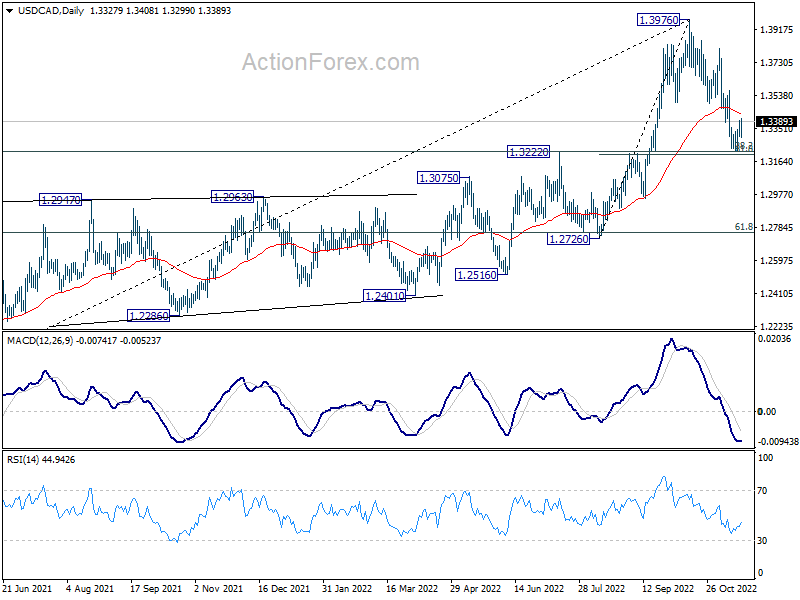
In the bigger picture, as long as 1.3222 cluster support (38.2% retracement of 1.2005 to 1.3976 at 1.3223) holds, larger up trend from 1.2005 (2021 low) is still expected to resume through 1.3976 high at a later stage. . However, firm break of 1.3222/3 will indicate that the trend might have reversed. Deeper fall would be seen to next cluster support at 1.2726 (61.8% retracement at 1.2758).
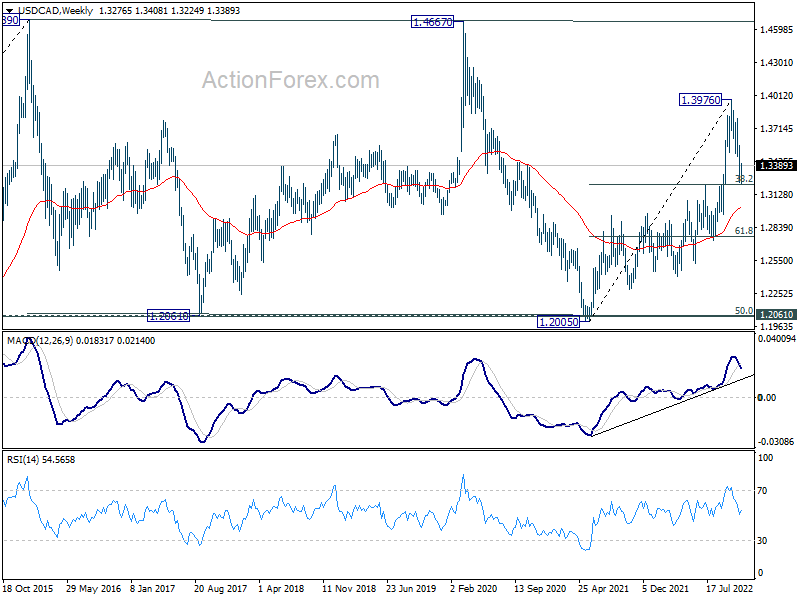
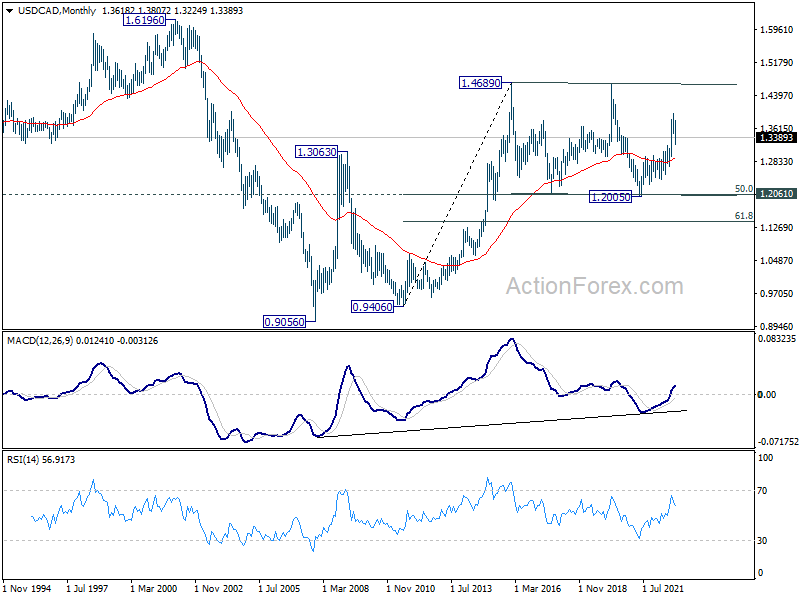
In the longer term picture, price actions from 1.4689 (2016 high) are seen as a consolidation pattern only, which might have completed at 1.2005. That is, up trend from 0.9506 (2007 low) is expected to resume at a later stage. This will remain the favored case as long as 1.2061 support holds, which is close to 50% retracement of 0.9406 to 1.4689 at 1.2048.
EUR/USD Weekly Outlook
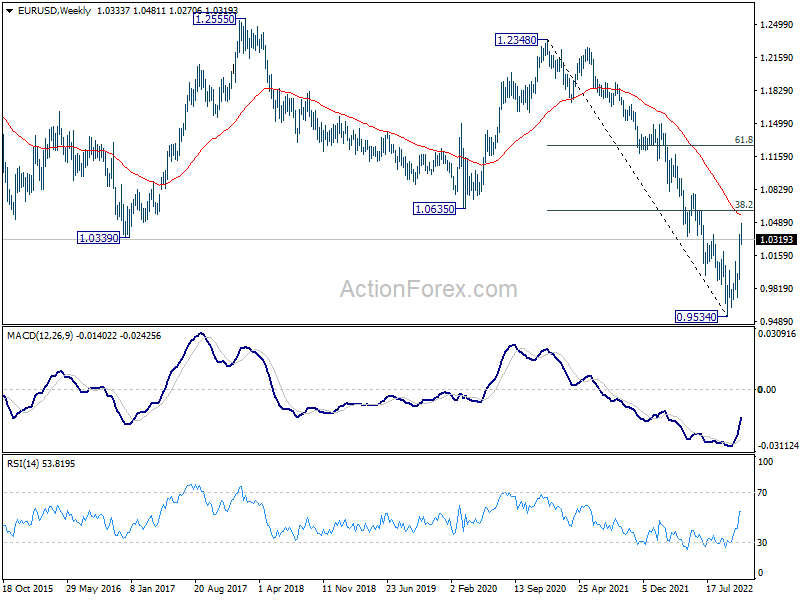
EUR/USD edged higher to 1.0481 last week but turned sideway. Initial bias remains neutral this week for consolidations. Downside of retreat should be contained by 1.0092 resistance turned support to bring another rally. On the upside, break of 1.0481 will resume the rise from 0.9534 and target 1.0609 fibonacci level.
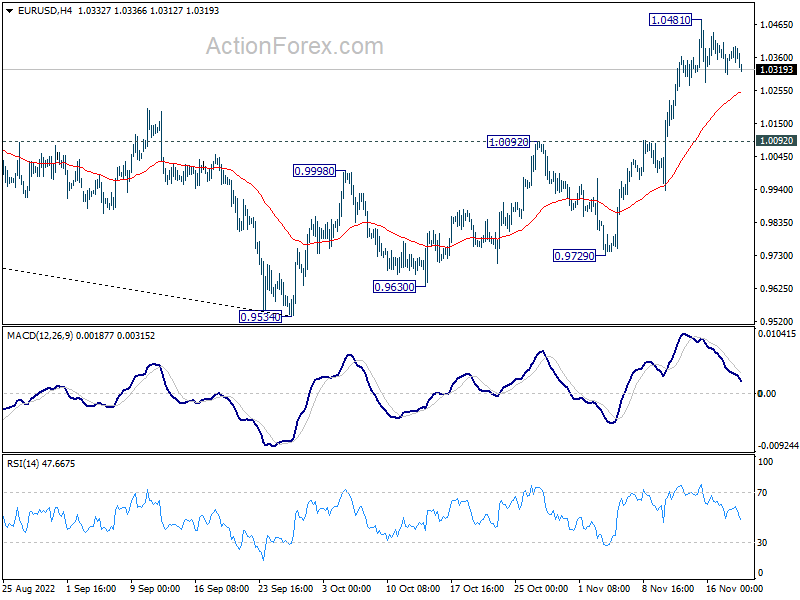
In the bigger picture, a medium term bottom was in place at 0.9534, on bullish convergence condition in daily MACD. Even as a corrective rise, rally from 0.9534 should target 38.2% retracement of 1.2348 (2021 high) to 0.9534 at 1.0609. Sustained trading above 55 week EMA (now at 1.0566) will raise the chance of trend reversal and target 61.8% retracement at 1.1273. This will now remain the favored case as long as 1.0092 resistance turned support holds.
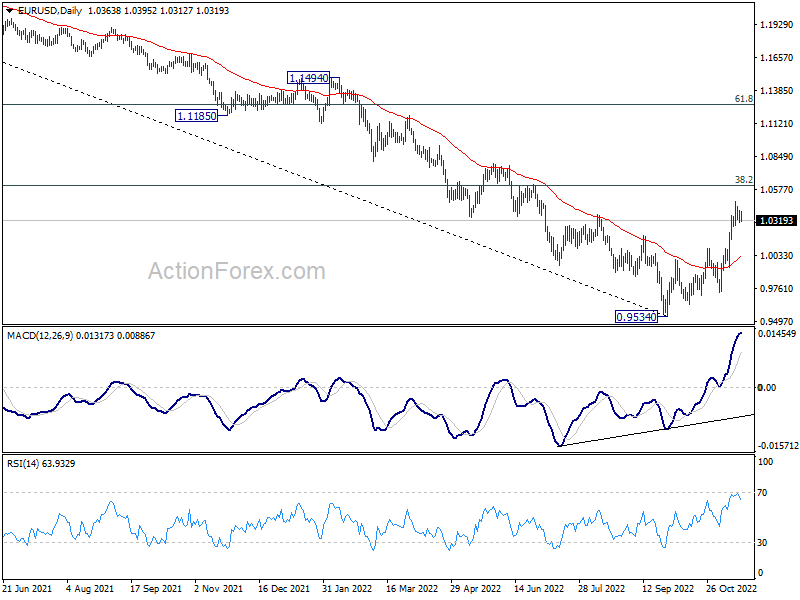
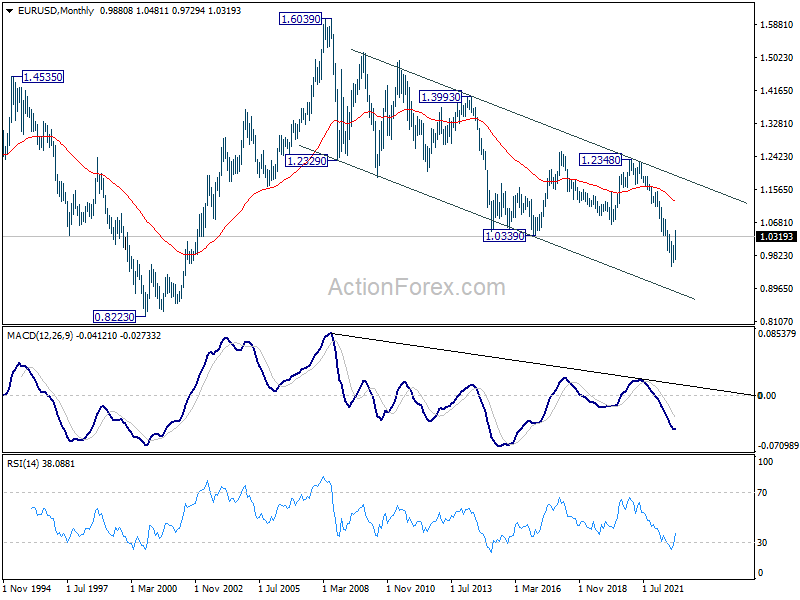
In the long term picture, as long as 1.0635 support turned resistance holds (2020 low), long term down trend from 1.6039 (2008) could still extend through 0.9534 at a later stage. However, sustained break of 1.0635 will confirm bottoming and at least turn long term outlook neutral.