

Sample Category Title
AUD/USD Weekly Outlook
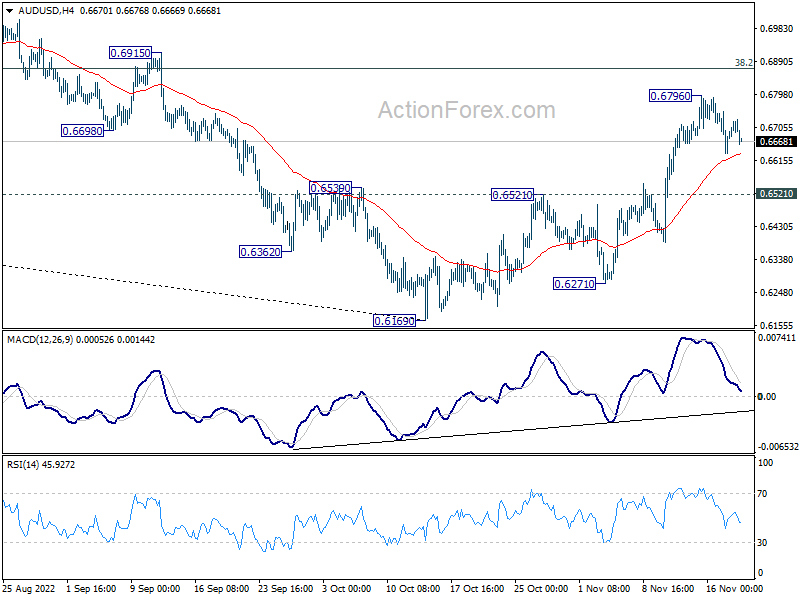
AUD/USD edged higher to 0.6796 last week but retreated. Initial bias stays neutral this week for consolidations. Further rally is expected as long as 0.6521 resistance turned support holds. On the upside, break of 0.6796 will resume the rise from 0.6169 to 0.6871 fibonacci level.
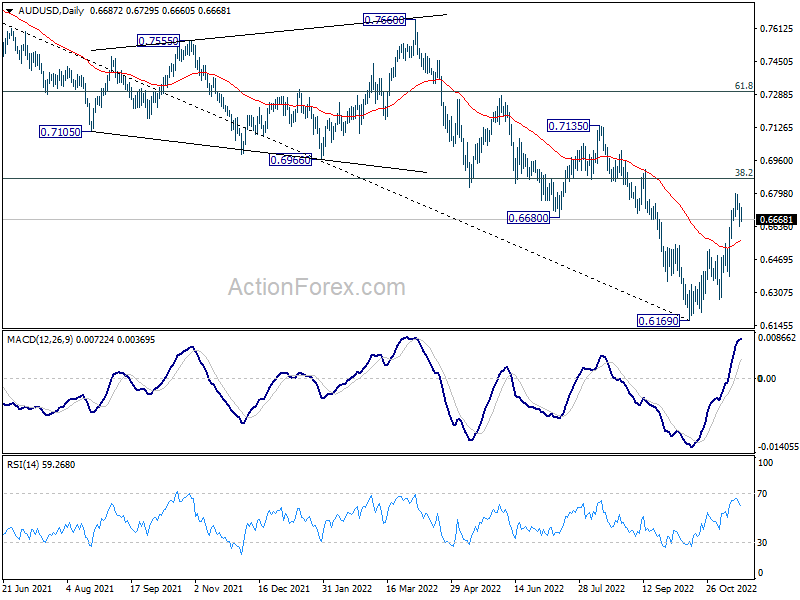
In the bigger picture, a medium term bottom is in place at 0.6160 already. But it's too early to call for trend reversal. Nevertheless, even as a corrective move, rise from 0.6169 should target 38.2% retracement of 0.8006 to 0.6169 at 0.6871. Sustained trading above 55 week EMA (now at 0.6934) will raise the chance of the start of a bullish up trend. This week now remain the favored case as long as 0.6521 resistance turned support holds.
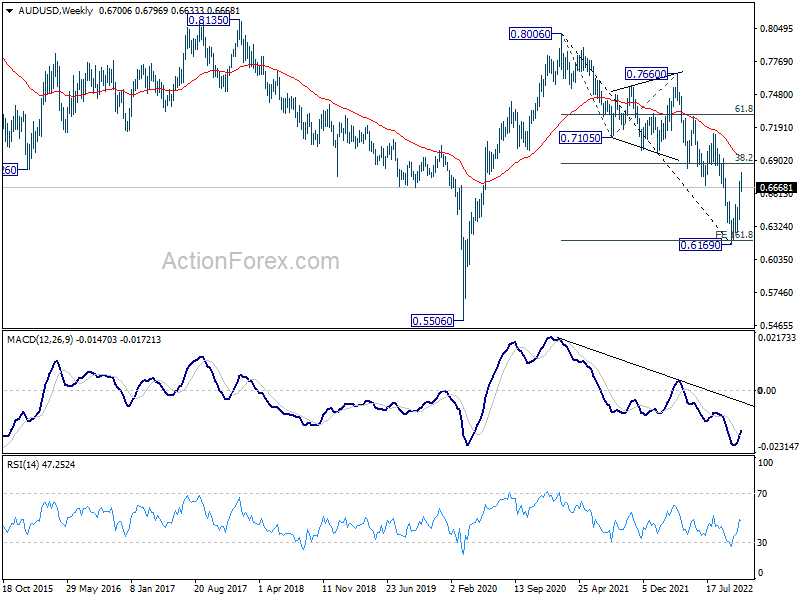
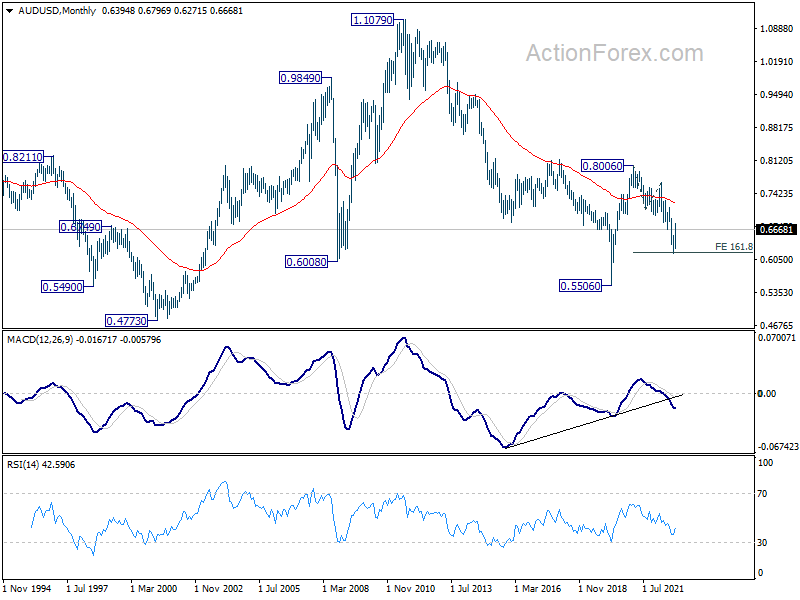
In the long term picture, the down trend from 0.8006 could still be seen as a corrective move, considering that it failed to break through 161.8% projection of 0.8006 to 0.7105 from 0.7660 at 0.6202 decisively. Strong rebound from current level will keep long term outlook neutral first. However, sustained break of 0.6202 will open up deep fall to retest 0.5506.
USD/CAD Weekly Outlook
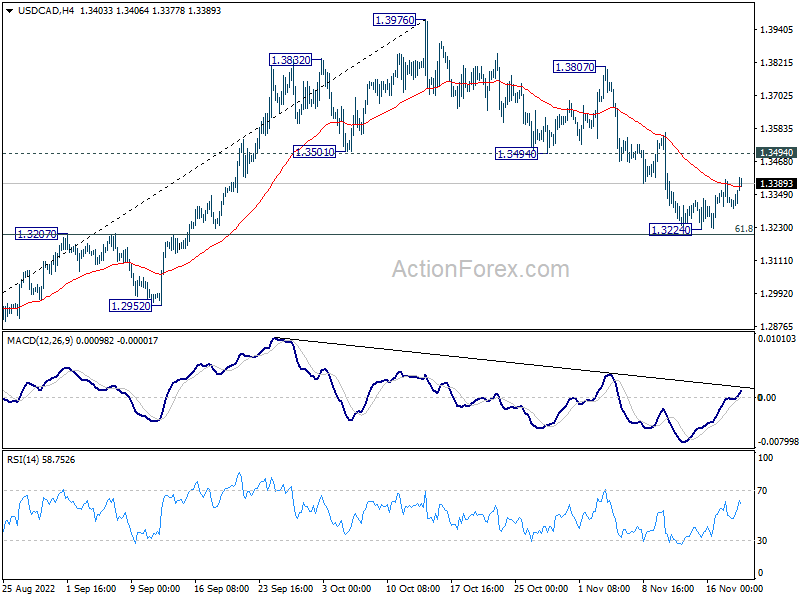
USD/CAD recover ahead of 1.3207 cluster support (61.8% retracement of 1.2726 to 1.3976 at 1.3204) last week. But upside is limited well below 1.3494 support turned resistance. Initial bias remains neutral this week first. On the upside, firm break of 1.3494 will indicate that correction from 1.3976 has completed at 1.3224. Intraday bias will be turned back to the upside for 1.3807/3976 resistance zone. However, on the downside, sustained break of 1.3204/7 will carry larger bearish implication and target 1.2952 support next.
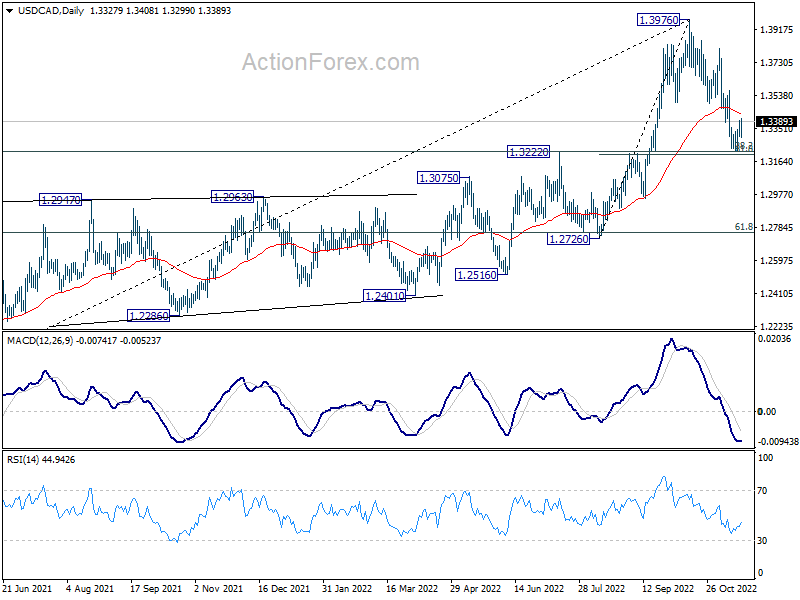
In the bigger picture, as long as 1.3222 cluster support (38.2% retracement of 1.2005 to 1.3976 at 1.3223) holds, larger up trend from 1.2005 (2021 low) is still expected to resume through 1.3976 high at a later stage. . However, firm break of 1.3222/3 will indicate that the trend might have reversed. Deeper fall would be seen to next cluster support at 1.2726 (61.8% retracement at 1.2758).
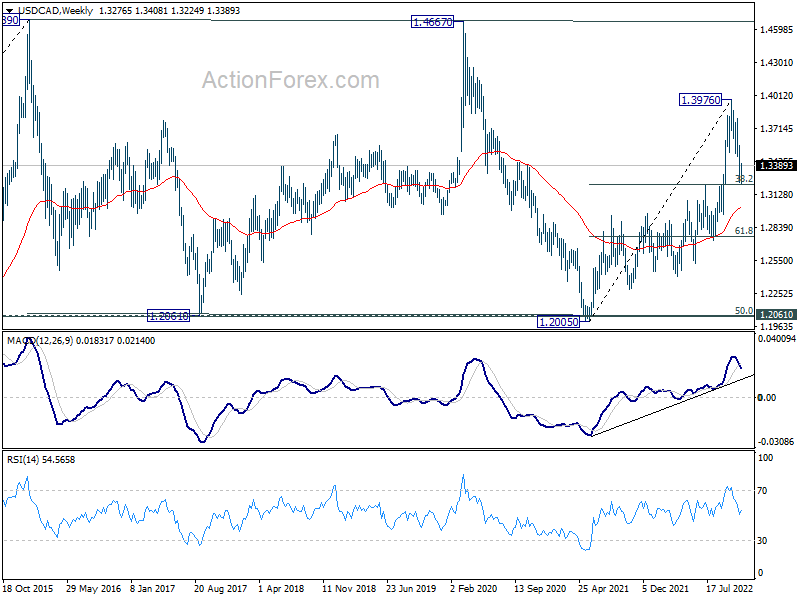
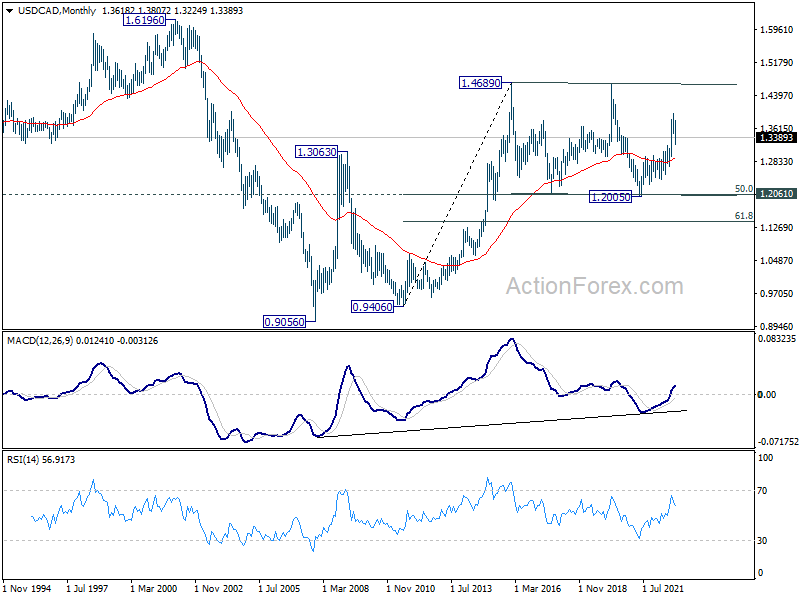
In the longer term picture, price actions from 1.4689 (2016 high) are seen as a consolidation pattern only, which might have completed at 1.2005. That is, up trend from 0.9506 (2007 low) is expected to resume at a later stage. This will remain the favored case as long as 1.2061 support holds, which is close to 50% retracement of 0.9406 to 1.4689 at 1.2048.
GBP/JPY Weekly Outlook
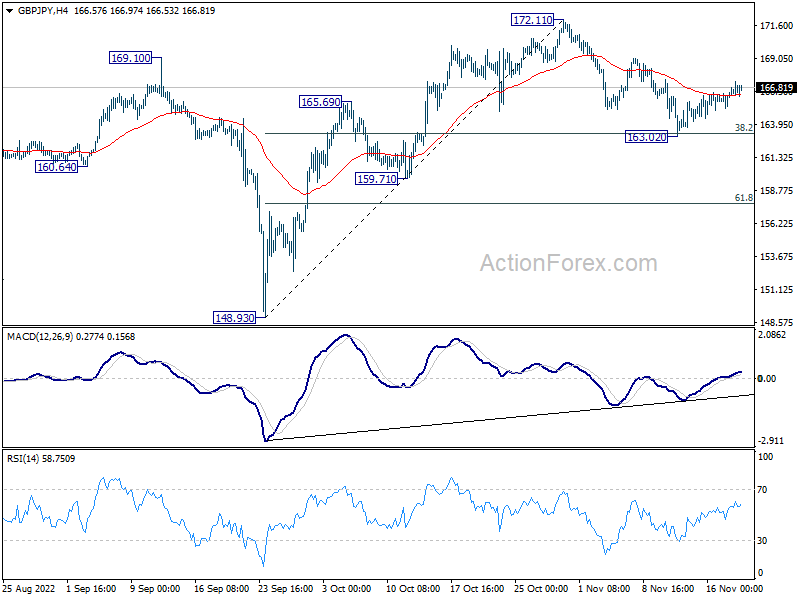
Last week's recovery suggests that GBP/JPY's correction from 172.11 has completed at 163.20, after hitting 38.2% retracement of 148.93 to 172.11 at 163.25. Initial bias is mildly on the upside for retesting 172.11 high first. On the downside, however, sustained trading below 38.2% retracement of 148.93 to 172.11 at 163.25 will bring deeper decline to 61.8% retracement at 157.78 and possibly below.
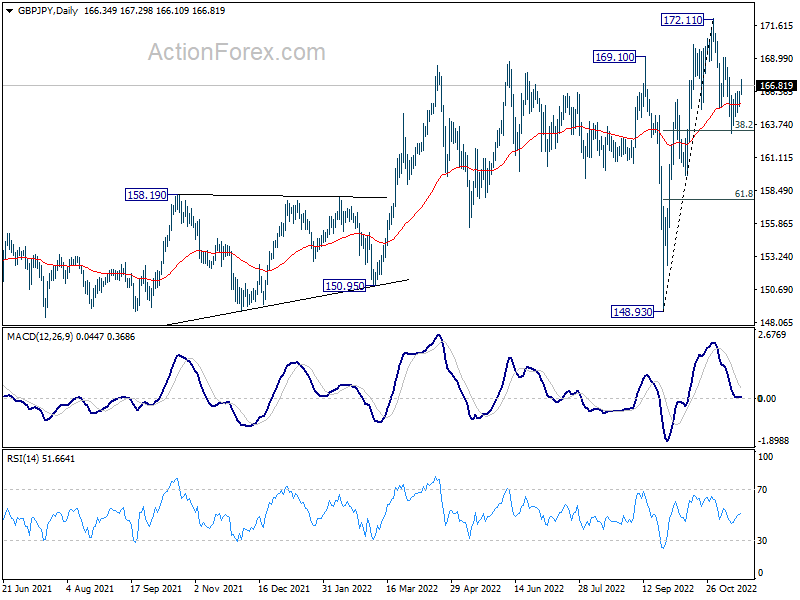
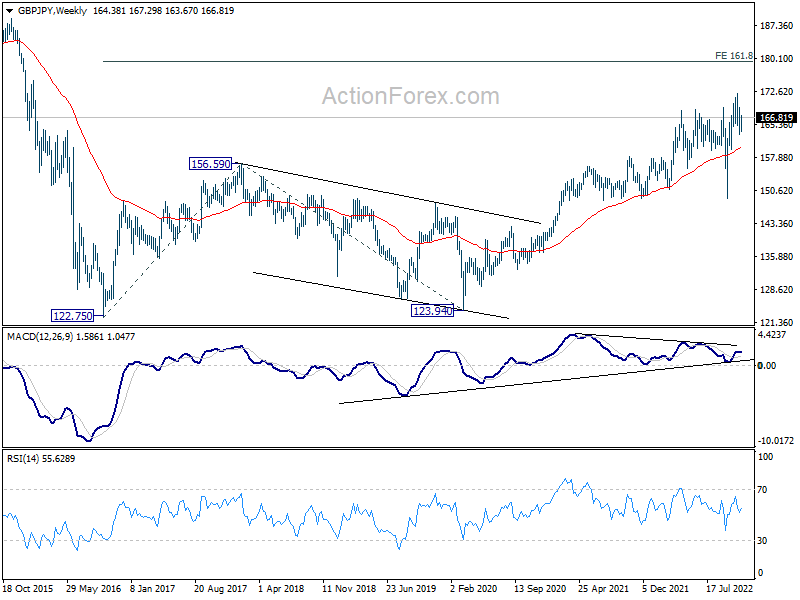
In the bigger picture, there is no clear sign of medium term topping yet. Up trend from 123.94 (2020 low) could still resume through 172.11 high at a later stage. However, firm break of 159.71 support will argue that it's already in correction to the up trend from 123.94, and deeper decline would be seen back towards 148.93 support.
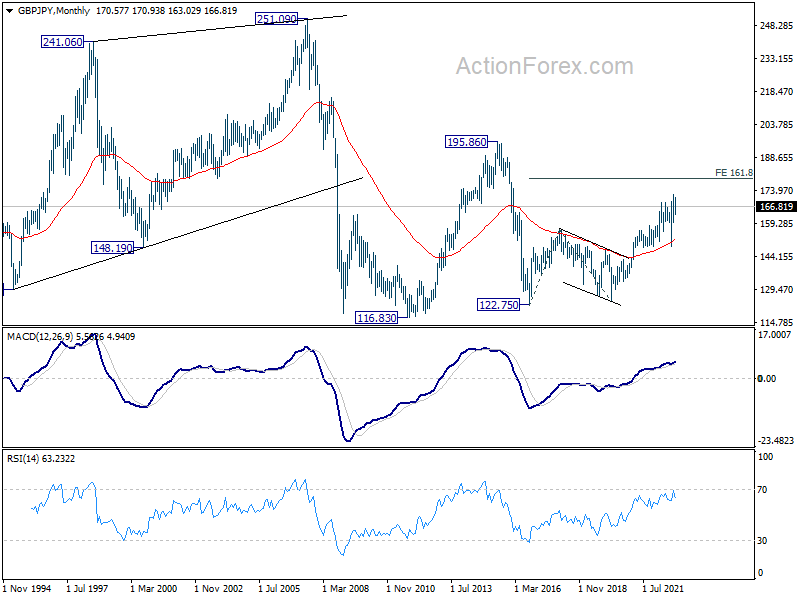
In the longer term picture, as long as 55 month EMA (now at 151.88) holds, rise from 122.75 could still extend higher at a later stage. Next target is 195.86 (2015 high).
EUR/JPY Weekly Outlook
EUR/JPY recovered last week but failed to sustain above 4 hour 55 EMA. Initial bias is turned neutral this week first. Correction from 148.38 might have completed at 142.54. Break of 147.09 resistance will indicate that larger up trend is ready to resume through 148.38 high. However, on the downside, sustained break of 142.65 will bring deeper fall to 61.8% retracement at 139.11 and possibly below.
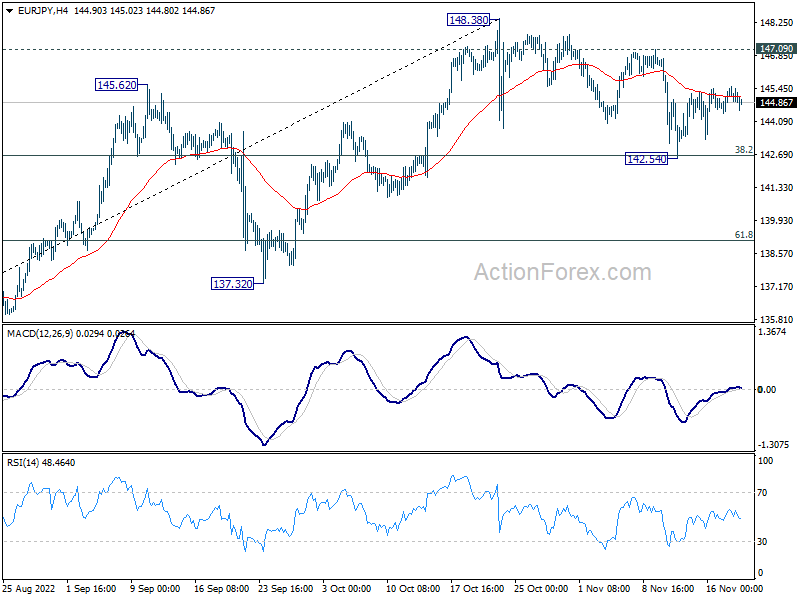
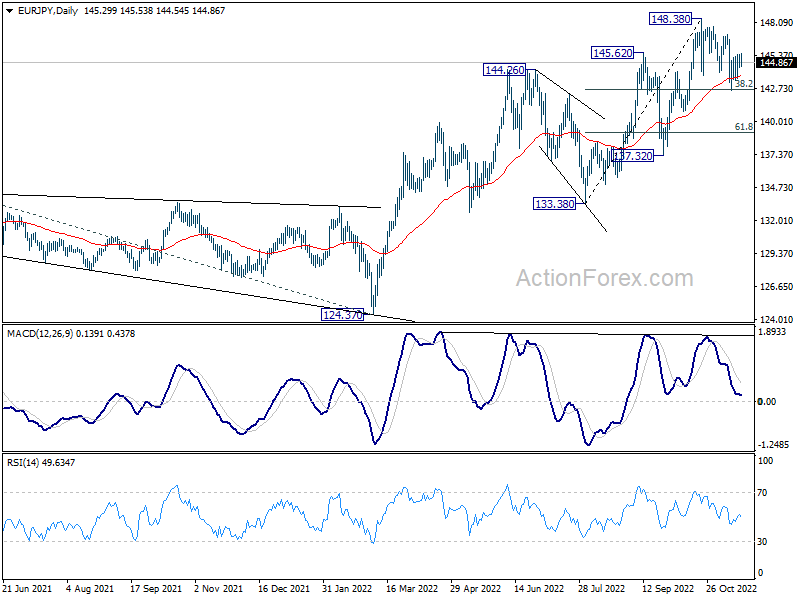
In the bigger picture, there is no clear sign of medium term topping yet. Up trend from 114.42 (2020 low) could still resume through 148.38 to 149.76 (2014 high). However, break of 137.32 support argue that a medium term correction has already started to correct the whole up trend from 114.42.
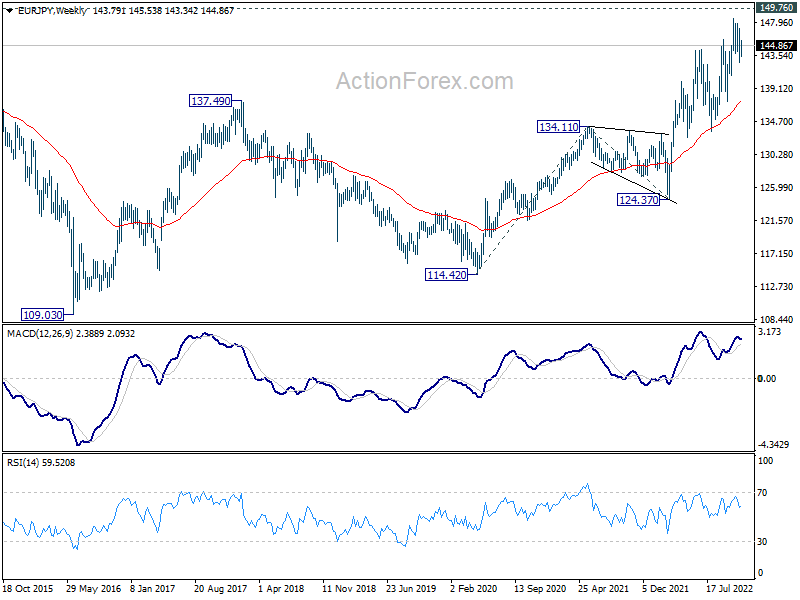
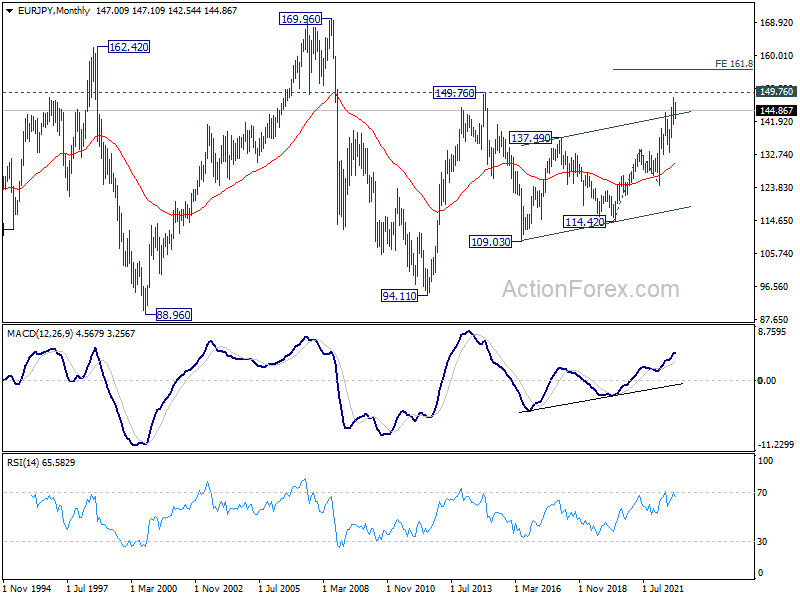
In the long term picture, outlook will stay bullish as long as 134.11 resistance turned support holds (2021 high). Sustained break of 149.76 (2014 high) will open up further rally, as resumption of the rise from 94.11 (2012 low), towards 169.96 (2008 high).
EUR/GBP Weekly Outlook
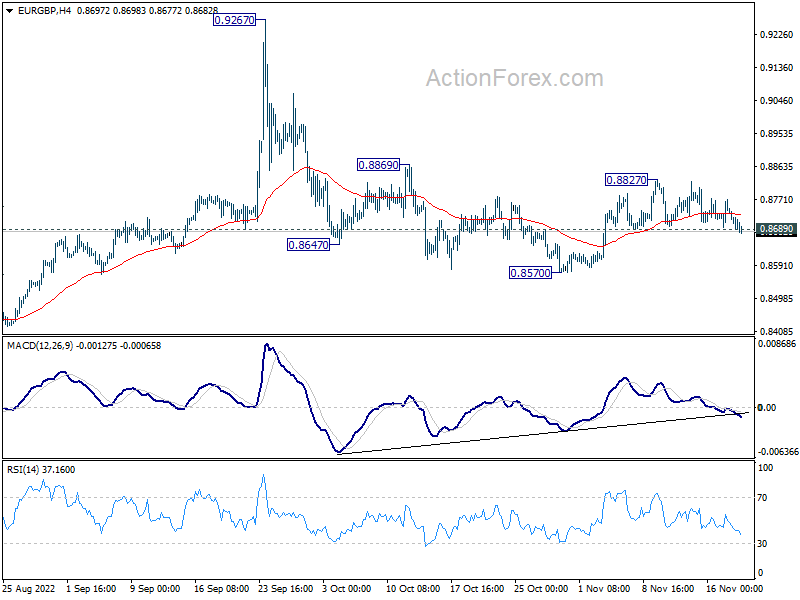
EUR/GBP's late breach of 0.8689 minor support argues that recovery from 0.8570 has completed at 0.8827. Initial bias is now on the downside this week for retesting 0.8570 support first. Firm break there will resume whole decline from 0.9267. On the upside, above 0.8827 will resume the rebound from 0.8570 and flip bias back to the upside instead.
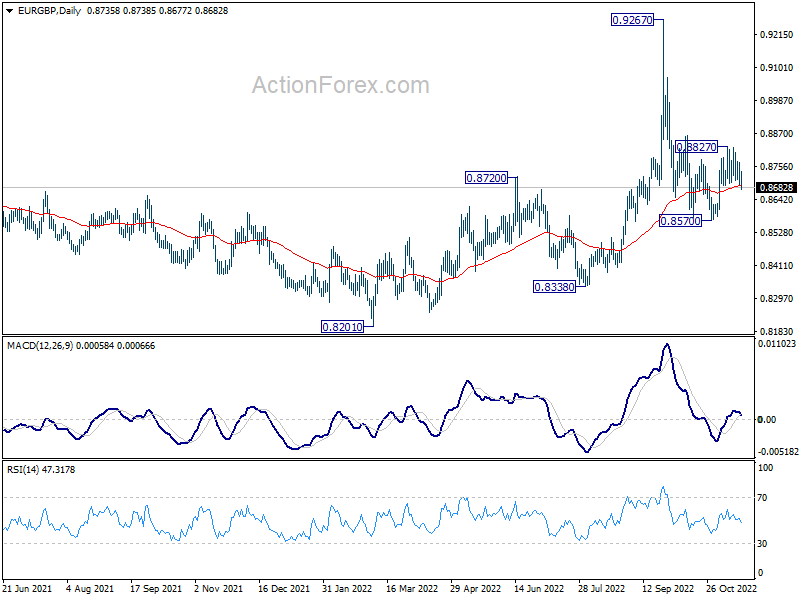
In the bigger picture, current development suggests that fall from 0.9267 is a down leg inside long term range pattern. Deeper fall could be seen towards 0.8201/8338 support zone. But strong support should be seen there to bring reversal. Nevertheless, firm break of 0.8869 resistance will turn favor to the case that such decline is merely a correction in the up trend from 0.8201. That is, further rally would be seen at a later stage through 0.9267.
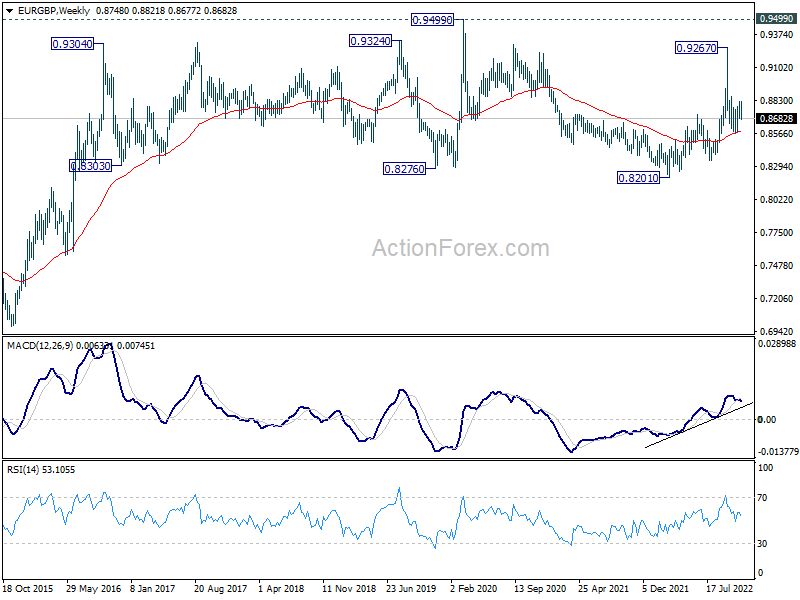
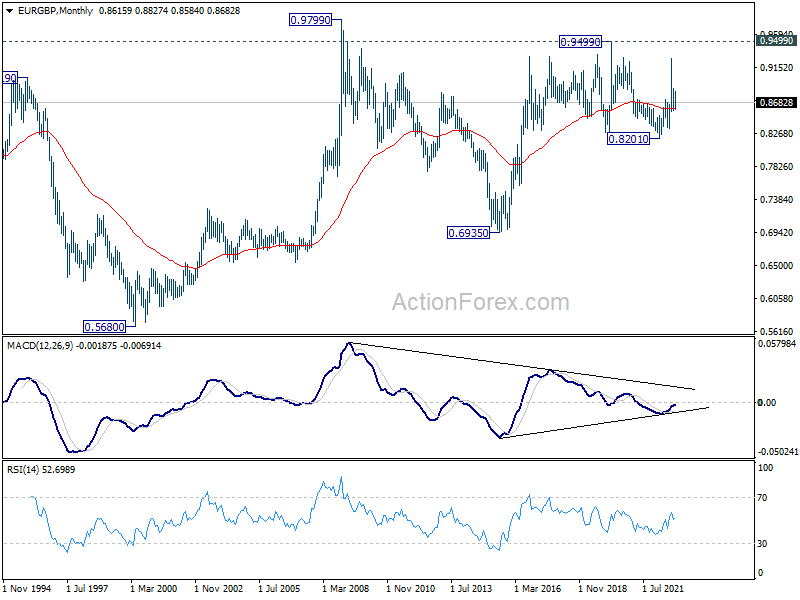
In the long term picture, long term range pattern is extending. But rise from 0.6935 (2015 low) is expected to extend at a later stage, to 0.9799 (2009 high).
EUR/AUD Weekly Outlook
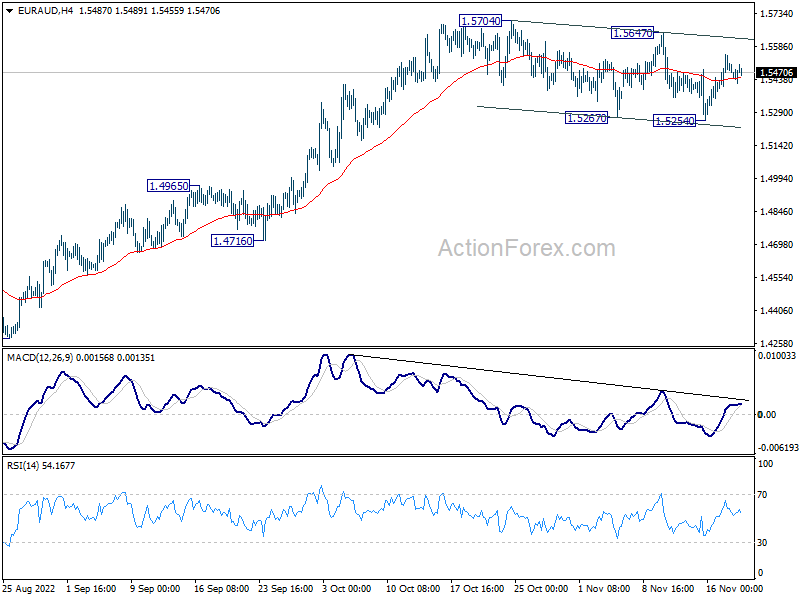
EUR/AUD recovered after dipping to 1.5254 last week and outlook is unchanged. Initial bias stays neutral this week first. While corrective pattern from 1.5704 might extend, downside should be contained by 55 day EMA (now at 1.5274) to bring rebound. On the upside, decisive break of 1.5704 will resume larger rise from 1.4281. However, sustained trading below 55 day EMA will bring deeper correction towards 1.4965 resistance turned support.
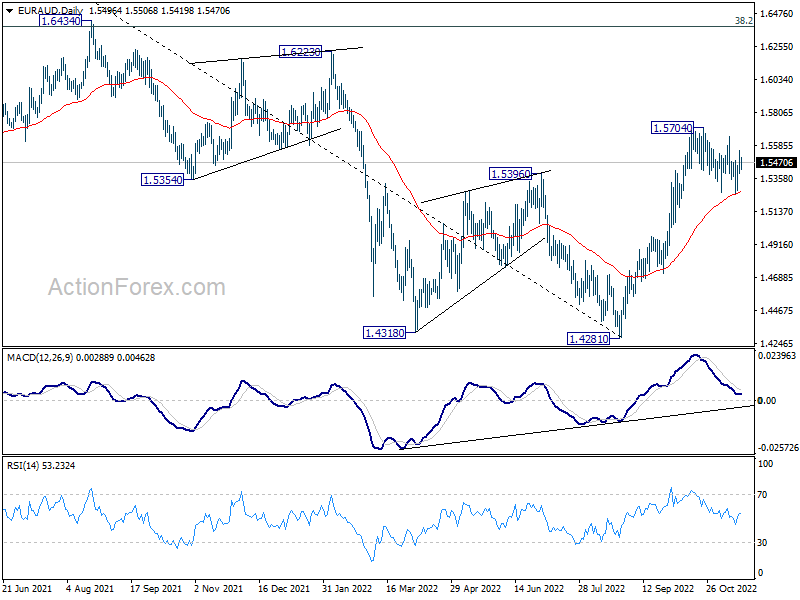
In the bigger picture, a medium term bottom should be in place at 1.4281, on bullish convergence condition in daily MACD. Further rise would be seen back to 1.6434 key resistance next. Break of 1.4965 resistance turned support is needed to indicate reversal. Otherwise, further rally will remain in favor.
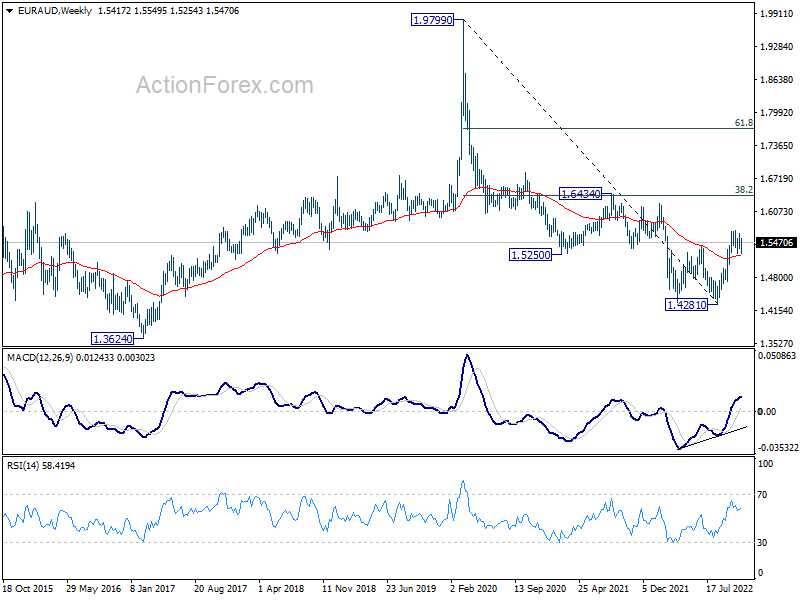
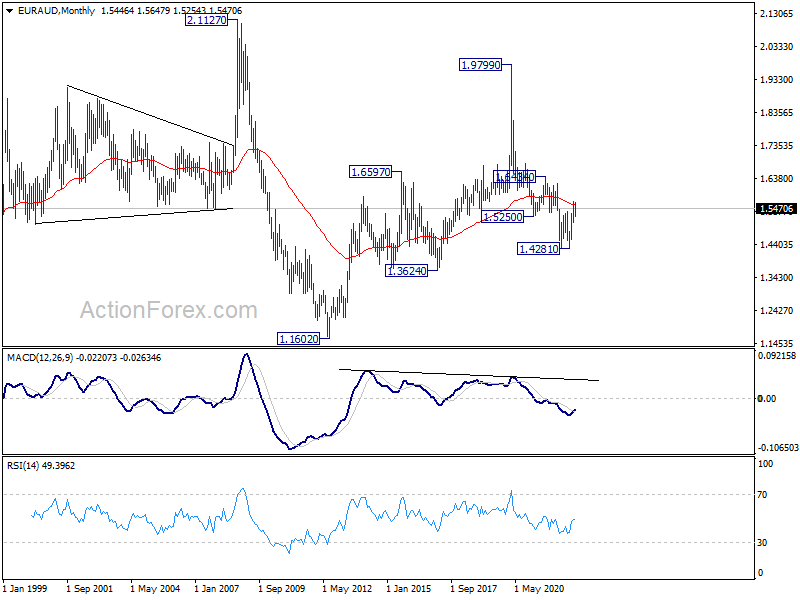
In the longer term picture, breach of 55 month EMA (now at 1.5600) raises the chance of medium term bullish reversal. Focus is back on 1.6434 cluster resistance, 38.2% retracement of 1.9799 (2020 high) to 1.4281 at 1.6389). Sustained break there will confirm and target 61.8% retracement at 1.7691.
EUR/CHF Weekly Outlook
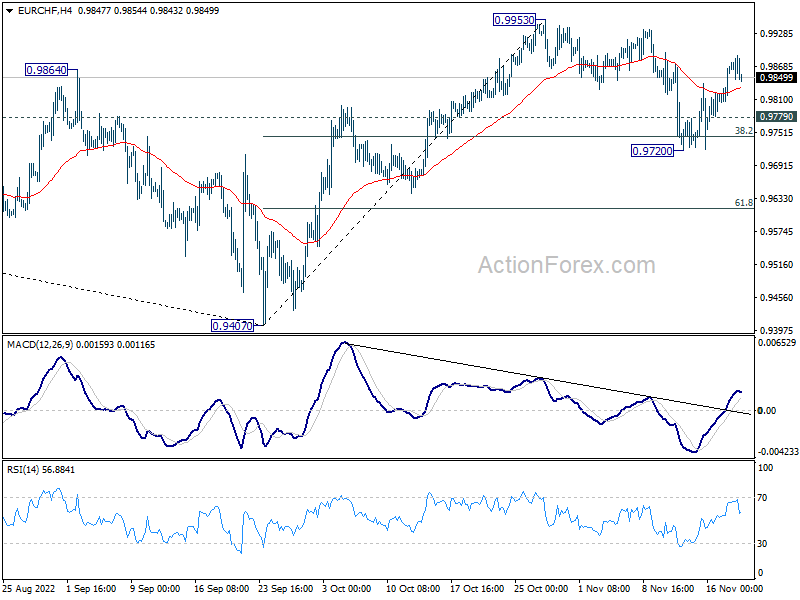
EUR/CHF's recovery last week suggests that pull back from 0.9953 has completed at 0.9720, after drawing support from 38.2% retracement of 0.9407 to 0.9953 0.9744. Initial bias is mildly on the upside this week for retesting 0.9953. Firm break there will resume the rally from 0.9407 to 1.0072 fibonacci level. However, break of 0.9779 will likely resume the fall from 0.9953 through 0.9720.
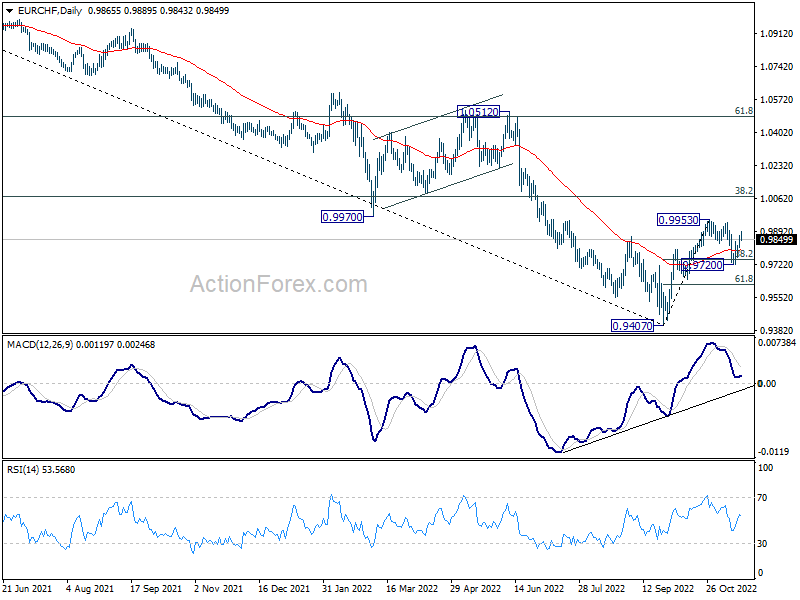
In the bigger picture, rejection by 0.9970 support turned resistance retains medium term bearishness. That is, while 0.9407 is a medium term bottom, price actions from there would develope into a corrective pattern rather than a reversal. Down trend resumption through 0.9407 is mildly favored at a later stage. This will remain the favored case now, as long 38.2% retracement of 1.1149 to 0.9407 at 1.0072 holds.
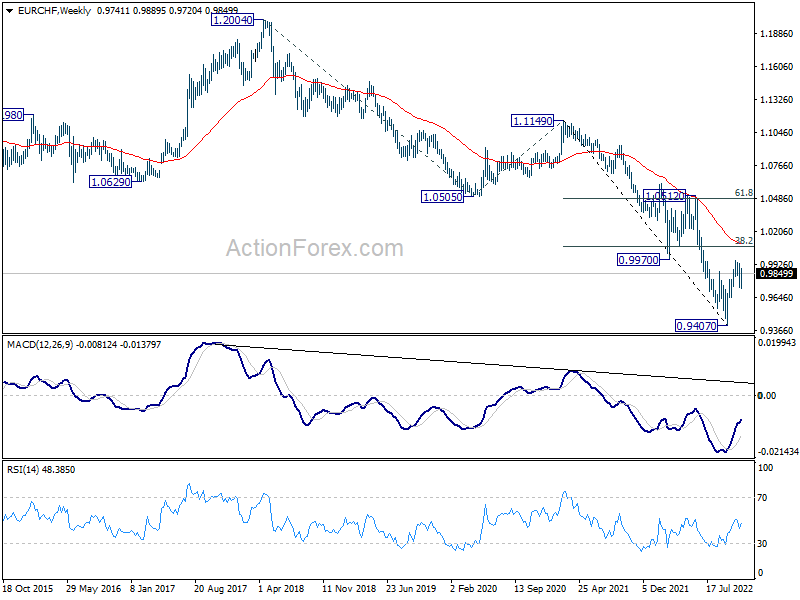
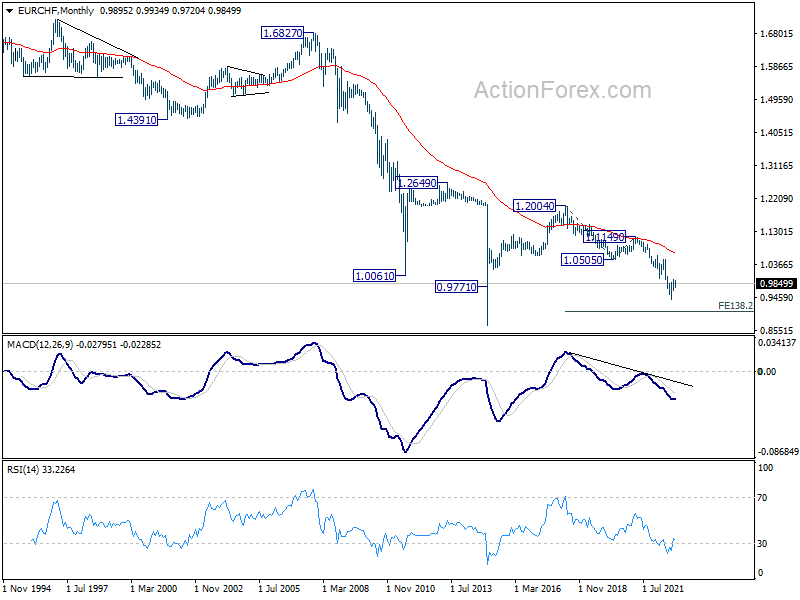
In the long term picture, capped well below 55 month EMA, EUR/CHF is seen as extending the multi-decade down trend. There is no prospect of a bullish reversal until firm break of 1.0505 support turned resistance (2020 low). In case of resumption, next target is 138.2% projection of 1.2004 to 1.0505 to 1.1149 at 0.9033.
Summary 11/21 – 11/25
Monday, Nov 21, 2022
| GMT | Ccy | Events | Consensus | Previous |
|---|---|---|---|---|
| 07:00 | EUR | Germany PPI M/M Oct | 0.90% | 2.30% |
| 07:00 | EUR | Germany PPI Y/Y Oct | 41.50% | 45.80% |
| 21:45 | NZD | Trade Balance (NZD) Oct | -1615M |
| GMT | Ccy | Events | |
|---|---|---|---|
| 07:00 | EUR | Germany PPI M/M Oct | |
| Forecast: 0.90% | Previous: 2.30% | ||
| 07:00 | EUR | Germany PPI Y/Y Oct | |
| Forecast: 41.50% | Previous: 45.80% | ||
| 21:45 | NZD | Trade Balance (NZD) Oct | |
| Forecast: | Previous: -1615M | ||
Tuesday, Nov 22, 2022
| GMT | Ccy | Events | Consensus | Previous |
|---|---|---|---|---|
| 07:00 | GBP | Public Sector Net Borrowing (GBP) Oct | 19.2B | |
| 09:00 | EUR | Eurozone Current Account (EUR) Sep | -20.3B | -26.3B |
| 13:30 | CAD | New Housing Price Index M/M Oct | 0.20% | -0.10% |
| 13:30 | CAD | Retail Sales M/M Sep | 1.10% | 0.70% |
| 13:30 | CAD | Retail Sales ex Autos M/M Sep | 1.00% | 0.70% |
| 15:00 | EUR | Eurozone Consumer Confidence Nov P | -26 | -28 |
| 22:00 | AUD | Manufacturing PMI Nov P | 52.7 | |
| 22:00 | AUD | Services PMI Nov P | 49.3 |
| GMT | Ccy | Events | |
|---|---|---|---|
| 07:00 | GBP | Public Sector Net Borrowing (GBP) Oct | |
| Forecast: | Previous: 19.2B | ||
| 09:00 | EUR | Eurozone Current Account (EUR) Sep | |
| Forecast: -20.3B | Previous: -26.3B | ||
| 13:30 | CAD | New Housing Price Index M/M Oct | |
| Forecast: 0.20% | Previous: -0.10% | ||
| 13:30 | CAD | Retail Sales M/M Sep | |
| Forecast: 1.10% | Previous: 0.70% | ||
| 13:30 | CAD | Retail Sales ex Autos M/M Sep | |
| Forecast: 1.00% | Previous: 0.70% | ||
| 15:00 | EUR | Eurozone Consumer Confidence Nov P | |
| Forecast: -26 | Previous: -28 | ||
| 22:00 | AUD | Manufacturing PMI Nov P | |
| Forecast: | Previous: 52.7 | ||
| 22:00 | AUD | Services PMI Nov P | |
| Forecast: | Previous: 49.3 | ||
Wednesday, Nov 23, 2022
| GMT | Ccy | Events | Consensus | Previous |
|---|---|---|---|---|
| 01:00 | NZD | RBNZ Rate Decision | 4.25% | 3.50% |
| 08:15 | EUR | France Manufacturing PMI Nov P | 47.0 | 47.2 |
| 08:15 | EUR | France Services PMI Nov P | 50.6 | 51.7 |
| 08:30 | EUR | Germany Manufacturing PMI Nov P | 45.2 | 45.1 |
| 08:30 | EUR | Germany Services PMI Nov P | 46.4 | 46.5 |
| 09:00 | EUR | Eurozone Manufacturing PMI Nov P | 46.5 | 46.4 |
| 09:00 | EUR | Eurozone Services PMI Nov P | 48.4 | 48.6 |
| 09:30 | GBP | Manufacturing PMI Nov P | 45.6 | 46.2 |
| 09:30 | GBP | Services PMI Nov P | 48.0 | 48.8 |
| 13:30 | USD | Initial Jobless Claims (Nov 18) | 224K | 222K |
| 13:30 | USD | Durable Goods Orders Oct | 0.40% | 0.40% |
| 13:30 | USD | Durable Goods Orders ex Transportation Oct | 0.10% | -0.50% |
| 14:45 | USD | Manufacturing PMI Nov P | 49.8 | 50.4 |
| 14:45 | USD | Services PMI Nov P | 47.7 | 47.8 |
| 15:00 | USD | Michigan Consumer Sentiment Nov F | 54.7 | 54.7 |
| 15:00 | USD | New Home Sales Oct | 575K | 603K |
| 15:30 | USD | Crude Oil Inventories | -5.4M | |
| 17:00 | USD | Natural Gas Storage | 64B |
| GMT | Ccy | Events | |
|---|---|---|---|
| 01:00 | NZD | RBNZ Rate Decision | |
| Forecast: 4.25% | Previous: 3.50% | ||
| 08:15 | EUR | France Manufacturing PMI Nov P | |
| Forecast: 47.0 | Previous: 47.2 | ||
| 08:15 | EUR | France Services PMI Nov P | |
| Forecast: 50.6 | Previous: 51.7 | ||
| 08:30 | EUR | Germany Manufacturing PMI Nov P | |
| Forecast: 45.2 | Previous: 45.1 | ||
| 08:30 | EUR | Germany Services PMI Nov P | |
| Forecast: 46.4 | Previous: 46.5 | ||
| 09:00 | EUR | Eurozone Manufacturing PMI Nov P | |
| Forecast: 46.5 | Previous: 46.4 | ||
| 09:00 | EUR | Eurozone Services PMI Nov P | |
| Forecast: 48.4 | Previous: 48.6 | ||
| 09:30 | GBP | Manufacturing PMI Nov P | |
| Forecast: 45.6 | Previous: 46.2 | ||
| 09:30 | GBP | Services PMI Nov P | |
| Forecast: 48.0 | Previous: 48.8 | ||
| 13:30 | USD | Initial Jobless Claims (Nov 18) | |
| Forecast: 224K | Previous: 222K | ||
| 13:30 | USD | Durable Goods Orders Oct | |
| Forecast: 0.40% | Previous: 0.40% | ||
| 13:30 | USD | Durable Goods Orders ex Transportation Oct | |
| Forecast: 0.10% | Previous: -0.50% | ||
| 14:45 | USD | Manufacturing PMI Nov P | |
| Forecast: 49.8 | Previous: 50.4 | ||
| 14:45 | USD | Services PMI Nov P | |
| Forecast: 47.7 | Previous: 47.8 | ||
| 15:00 | USD | Michigan Consumer Sentiment Nov F | |
| Forecast: 54.7 | Previous: 54.7 | ||
| 15:00 | USD | New Home Sales Oct | |
| Forecast: 575K | Previous: 603K | ||
| 15:30 | USD | Crude Oil Inventories | |
| Forecast: | Previous: -5.4M | ||
| 17:00 | USD | Natural Gas Storage | |
| Forecast: | Previous: 64B | ||
Thursday, Nov 24, 2022
| GMT | Ccy | Events | Consensus | Previous |
|---|---|---|---|---|
| 00:30 | JPY | Manufacturing PMI Nov P | 50.7 | 50.7 |
| 09:00 | EUR | Germany IFO Business Climate Nov | 85 | 84.3 |
| 09:00 | EUR | Germany IFO Current Assessment Nov | 93.6 | 94.1 |
| 09:00 | EUR | Germany IFO Expectations Nov | 77 | 75.6 |
| 12:30 | EUR | ECB Monetary Policy Meeting Accounts | ||
| 21:45 | NZD | Retail Sales Q/Q Q3 | -3.40% | -2.30% |
| 21:45 | NZD | Retail Sales ex Autos Q/Q Q3 | -3.30% | -1.60% |
| 23:30 | JPY | Tokyo CPI Core Y/Y Nov | 2.10% | 2.20% |
| GMT | Ccy | Events | |
|---|---|---|---|
| 00:30 | JPY | Manufacturing PMI Nov P | |
| Forecast: 50.7 | Previous: 50.7 | ||
| 09:00 | EUR | Germany IFO Business Climate Nov | |
| Forecast: 85 | Previous: 84.3 | ||
| 09:00 | EUR | Germany IFO Current Assessment Nov | |
| Forecast: 93.6 | Previous: 94.1 | ||
| 09:00 | EUR | Germany IFO Expectations Nov | |
| Forecast: 77 | Previous: 75.6 | ||
| 12:30 | EUR | ECB Monetary Policy Meeting Accounts | |
| Forecast: | Previous: | ||
| 21:45 | NZD | Retail Sales Q/Q Q3 | |
| Forecast: -3.40% | Previous: -2.30% | ||
| 21:45 | NZD | Retail Sales ex Autos Q/Q Q3 | |
| Forecast: -3.30% | Previous: -1.60% | ||
| 23:30 | JPY | Tokyo CPI Core Y/Y Nov | |
| Forecast: 2.10% | Previous: 2.20% | ||
Friday, Nov 25, 2022
| GMT | Ccy | Events | Consensus | Previous |
|---|---|---|---|---|
| 07:00 | EUR | Germany Gfk Consumer Confidence Dec | -45.3 | -41.9 |
| 07:00 | EUR | Germany GDP Q/Q Q3 F | 0.30% | 0.30% |
| GMT | Ccy | Events | |
|---|---|---|---|
| 07:00 | EUR | Germany Gfk Consumer Confidence Dec | |
| Forecast: -45.3 | Previous: -41.9 | ||
| 07:00 | EUR | Germany GDP Q/Q Q3 F | |
| Forecast: 0.30% | Previous: 0.30% | ||
Weekly Economic & Financial Commentary: Economic Resilience Continues to Challenge the Fed
Summary
United States: Even with Encouraging Inflation Developments, Economic Resilience Continues to Challenge the Fed
- In line with last week's CPI performance, the headline PPI increased 0.2% sequentially, two-tenths below expectations. The resiliency of the U.S. consumer was also on display, as total retail sales increased a stronger-than-expected 1.3% in October, boosted, in part, by a 1.3% jump in motor vehicles & parts and a 4.1% rise at gasoline stations. Weakness continued in the housing market, which is clearly in recession.
- Next week: Durable Goods Orders (Wed), New Home Sales (Wed)
International: What's Going On with Global Inflation?
- This week, October CPI data were released for the U.K., Canada and Japan, highlighting diverging paths for inflation in each economy. In the U.K., headline CPI inflation rose to 11.1% year-over-year, with the electricity, gas and other fuels category up nearly 90% compared to last year. Meanwhile, headline inflation in Canada has receded from a recent peak, coming in at 6.9%, but underlying price pressures continue to intensify. Last, Japan's inflation is much more contained compared to the U.K. and Canada, although prices are elevated by recent historical standards. Headline inflation quickened to 3.7% in October.
- Next week: Australia PMIs (Wed), Eurozone PMIs (Wed), U.K. PMIs (Wed)
Interest Rate Watch: Yield Curve Inversion Deepens
- Various points of the Treasury yield curve have inverted this year amid the Federal Reserve's aggressive policy tightening cycle. The spread between the yield on the two-year Treasury and the 10-year Treasury notes first turned negative in the spring and has become even more inverted in recent months, reaching a new low of -68 bps at the close on Thursday of this week.
Topic of the Week: The Economics of the 2022 World Cup
- What is expected to be the most viewed sporting event in world history is back, as 32 nations compete in Qatar starting on Sunday for the 2022 FIFA World Cup. We take a look at the economics of Qatar as well as our own predictions for the tournament.
The Weekly Bottom Line: Consumer Resilience on a Timer
U.S. Highlights
- Results from the midterm elections showed the Democrats maintained control of the Senate but lost their majority in the House of Representatives.
- U.S. housing data continue to slide in October, with housing starts down 4.1% m/m to 1.4 million units, while existing home sales fell 5.9% m/m to 4.3 million.
- Retail sales surprised to the upside in October, rising by 1.3% m/m. Gains were relatively broad based and suggest the U.S. consumer remains on a firm footing. Real consumer spending is set to accelerate to 3% in Q4.
Canadian Highlights
- Canadian consumer price inflation held steady at 6.9% year-on-year (y/y) in October, as CPI excluding food and energy decelerated slightly to 5.3% y/y (from 5.4% y/y previously).
- Rising gasoline prices and mortgage interest costs were major contributors to inflation in October, though food prices saw an encouraging deceleration.
- Housing sales saw a surprise bounce on the month, though prices continued to decline across the country. Housing starts also declined, though remain at elevated levels.
U.S. - Consumer Resilience on a Timer
After a week of ballot counting, results from the midterm elections showed that the Democrats maintained control of the Senate but lost their majority in the House of Representatives. With the Republican’s now having narrow control of the House, we have returned to a divided Congress, limiting prospects of new legislation over the next two years.
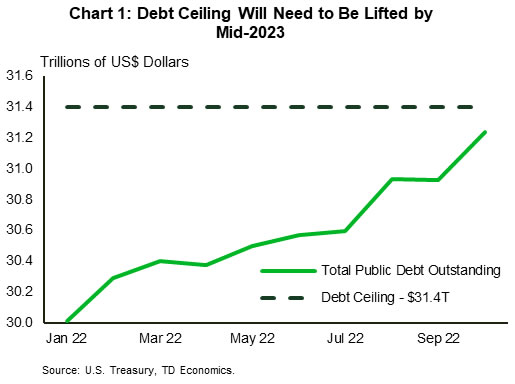
A partisan Congress raises the odds of another government shutdown or debt-ceiling showdown at some point next year (Chart 1). We could get a firsthand glimpse of what’s to come as early as next month when the current ‘continuing resolution’ funding government spending expires on December 16th. At a minimum, Congress will need to negotiate another short-term patch to keep the federal government open. The other challenge that will come up in the coming months is the need to raise the debt-ceiling. Fortunately, the U.S. Treasury is estimated to have enough wiggle room in its existing cash holdings to fund the government through at least mid-2023.
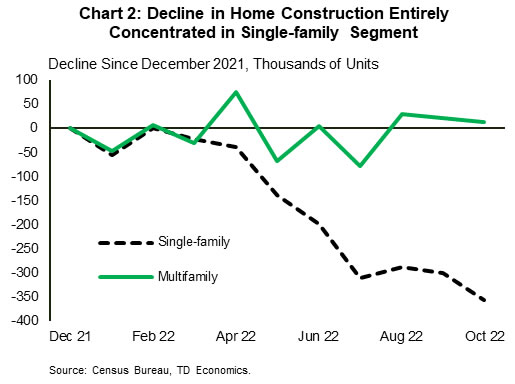
Looking to this week’s economic data, the impact of higher interest rates continued to tighten its grip on the housing sector. New home construction fell 4.2% m/m to 1.4 million units in October and is now down 19.4% since the beginning of the year. While the pullback continues to be concentrated across the single-family segment, the recent plateauing in multifamily permits suggests it too has peaked (Chart 2). Things look even more dire in the resale market. Mortgage rates reached 7.2% in October, and sales fell by another 5.9% m/m to 4.3 million and are now (outside of the pandemic lockdown period) at the lowest level since 2011. Inventory has remained tight so far and so the impact to prices has been small, with the median home price down just 3.5% from its peak. Because most homeowners hold mortgages originated at rates lower than today’s prevailing rate, listings are unlikely to spike like during the last housing crisis. As a result, the market will remain undersupplied for some time, limiting the downside pressure on prices.
In stark contrast to the housing sector, the U.S. consumer continued to show considerable staying power in October. Retail sales came in much better than expected, rising by 1.3% m/m. Indeed, some of the strength in October was already telegraphed earlier in the month when new vehicle sales jumped 10% m/m to 14.9 million units. However, even after stripping out autos, sales at gasoline stations, and building materials, the ‘control’ measure still rose by a healthy 0.8% m/m.
After incorporating the October retail sales data, our current tracking for Q4 GDP sits at 2.2%, with consumer spending expected to expand by 3%. This is an acceleration from Q3 and underscores the degree of resilience we’re still seeing from the U.S. consumer. However, it would be a stretch to believe that the rapid adjustment in interest rates won’t eventually take a toll. Let’s not forget, the Fed still has ‘a ways to go’ before even reaching its terminal rate. Moreover, it can take anywhere from 12-18 months to feel the full effect of higher interest rates. By this logic, we expect a broader demand adjustment to begin early next year, with growth expected to fall to a stall-speed in 2023.
Canada – Gasoline Prices Keep Inflation Burning
It was a busy week for Canadian economic data. With inflation showing more persistence in October's Consumer Price Index (CPI) data, Canadian yields rose across the curve on expectations that the Bank of Canada (BoC) will have to raise rates even more than previously thought. Adding to this was the release of housing data, which showed a surprise uptick in overall real estate sales activity even though prices continued to fall. Housing starts also declined, though remain at elevated levels.
Wednesday's release of the Canadian Consumer Price Index was the main event this week. As expected, the headline index reaccelerated by 0.6% month-on-month (m/m), from 0.4% m/m in September and effectively no price change in August. October's gain was largely attributed to the 9.2% m/m rise in gasoline prices, which caused CPI in year-on-year (y/y) terms to hold steady at 6.9%. Though the November tracking of gasoline prices indicates that this surge has abated, it goes to show how sensitive Canadian inflation is to externally driven products like gasoline.
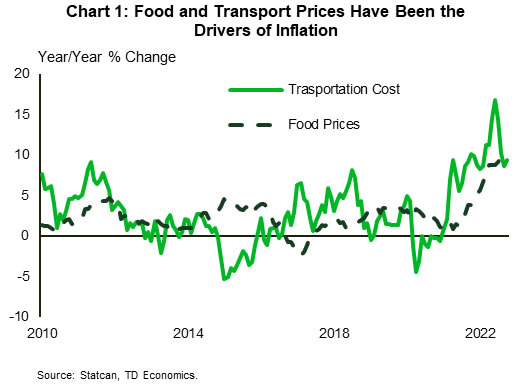
Food prices have also been a key source of inflation this year, and consumers got a bit of relief in October as prices decelerated to a 0.4% m/m gain. That is less than half the nearly 1% monthly average price increase that Canadian's have had to eat over the last eight months! Though this is moving in the right direction, the overall food basket remains elevated, up 10.1% over the last year (Chart 1).
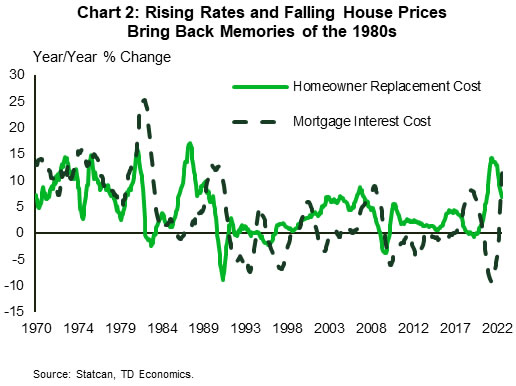
The other major category in focus was the rising price of shelter, which showed a large 0.8% m/m increase, translating to 10.8% y/y. Given the BoC's aggressive rate hikes over 2022, mortgage interest costs have risen over 11% y/y and are set to surge further as homeowners renew their mortgages at higher rates in the coming months (Chart 2). The drop in house prices (homeowners' replacement costs to be specific) has provided some offset . This previous source of inflationary pressure is likely to be deflationary over 2023. This trend was apparent in the recently released housing sales data. Though house sales increased for the first time in eight months (+1.3% m/m), the average house price dropped 0.6% m/m and is now down over 9% y/y.
The acceleration in overall inflation was a setback, but there are underlying trends in place that should cause inflation to decelerate in the coming months. Slowing global demand is expected to put further downward pressure on energy prices and rapidly declining shipping costs, the main drivers of high food and fuel inflation over the last year (assuming no new shock) should contribute to lower inflation in the coming months. The wildcard here is housing. There are significant lags from the impact of interest rate changes into CPI. With the BoC set to raise rates to 4% or higher in the coming months, it not only needs to assess the impact on economic growth, it is also needs to consider how its actions may continue to push shelter inflation even higher.