Sample Category Title
Dollar Clings to Correction
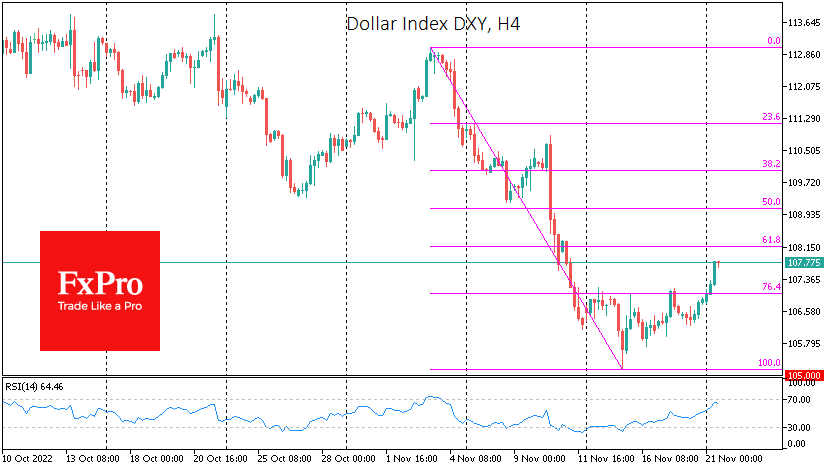
The Dollar Index has risen since last Tuesday, adding 2.5% to lows at 105.16. Speculators paused selling off the US currency in response to data and comments from Fed officials implying a higher interest rate target.
The dollar’s pullback could also be described as a market breather, implying a pause after a rather aggressive decline of almost 7% from November 4th to 15th.
Despite this rebound, major investment houses call the dollar generally overvalued and point out that now could be a good time for a trend reversal. We have discussed this before, noting both fundamental shifts (other central banks have caught up with the Fed in rate hikes, and the latter is signalling a rate cut) and historical patterns (the dollar’s response to global reversals cycles in monetary policy last about a year).
Nevertheless, from a short-term perspective, traders are better to be prepared that the DXY could rise to 108 or even 109 from the current 107.7 before we see the start of a new leg down.
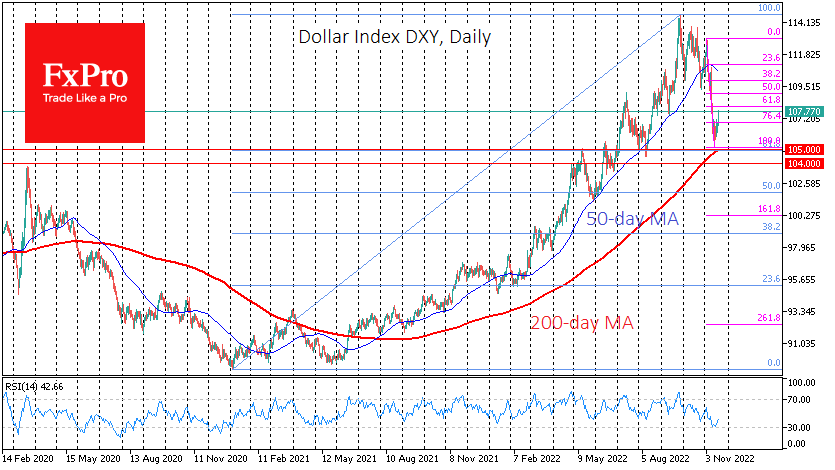
The dollar has been selling off at an elevated pace since November 4th. A consolidation below the 50-day MA is considered an essential first signal for breaking the trend. Interestingly, this line has quickly reversed from an uptrend to a downtrend, indicating that the overall tendency has changed.
The next and more reliable signal on the technical analysis side should be an anchoring below the 200-day MA, which the USD bulls effectively defended last week. Apart from that crucial curve, which the big market-makers use for trend-following purposes, the 61.8% retracement level of the DXY from the lows of January 2021 to the highs of late September passes around 105.
The most conservative technical approach suggests that the current DXY drawdown is a correction after the 20-month rise, followed by a new wave of growth. Nevertheless, the FX dynamics of DM currencies are just an example where we can say that trees don’t grow to the sky. The rule of mean reversal works here unless something breaks globally in the economy. The only such global breakdown would be the insolvency of Japan or another major country or the eurozone’s breakup. So far, while there is no such threat on the horizon, the end of the dollar 20-month uptrend is the main scenario.
If we are right, the dollar bears are taking profits and gaining liquidity before a new wave of a sell-off in the DXY, which might start this week or next week from levels between 108 and 109 and push it back below 100 before the end of the year.
Euro Drops Below 1.03 as Risk Aversion Climbs
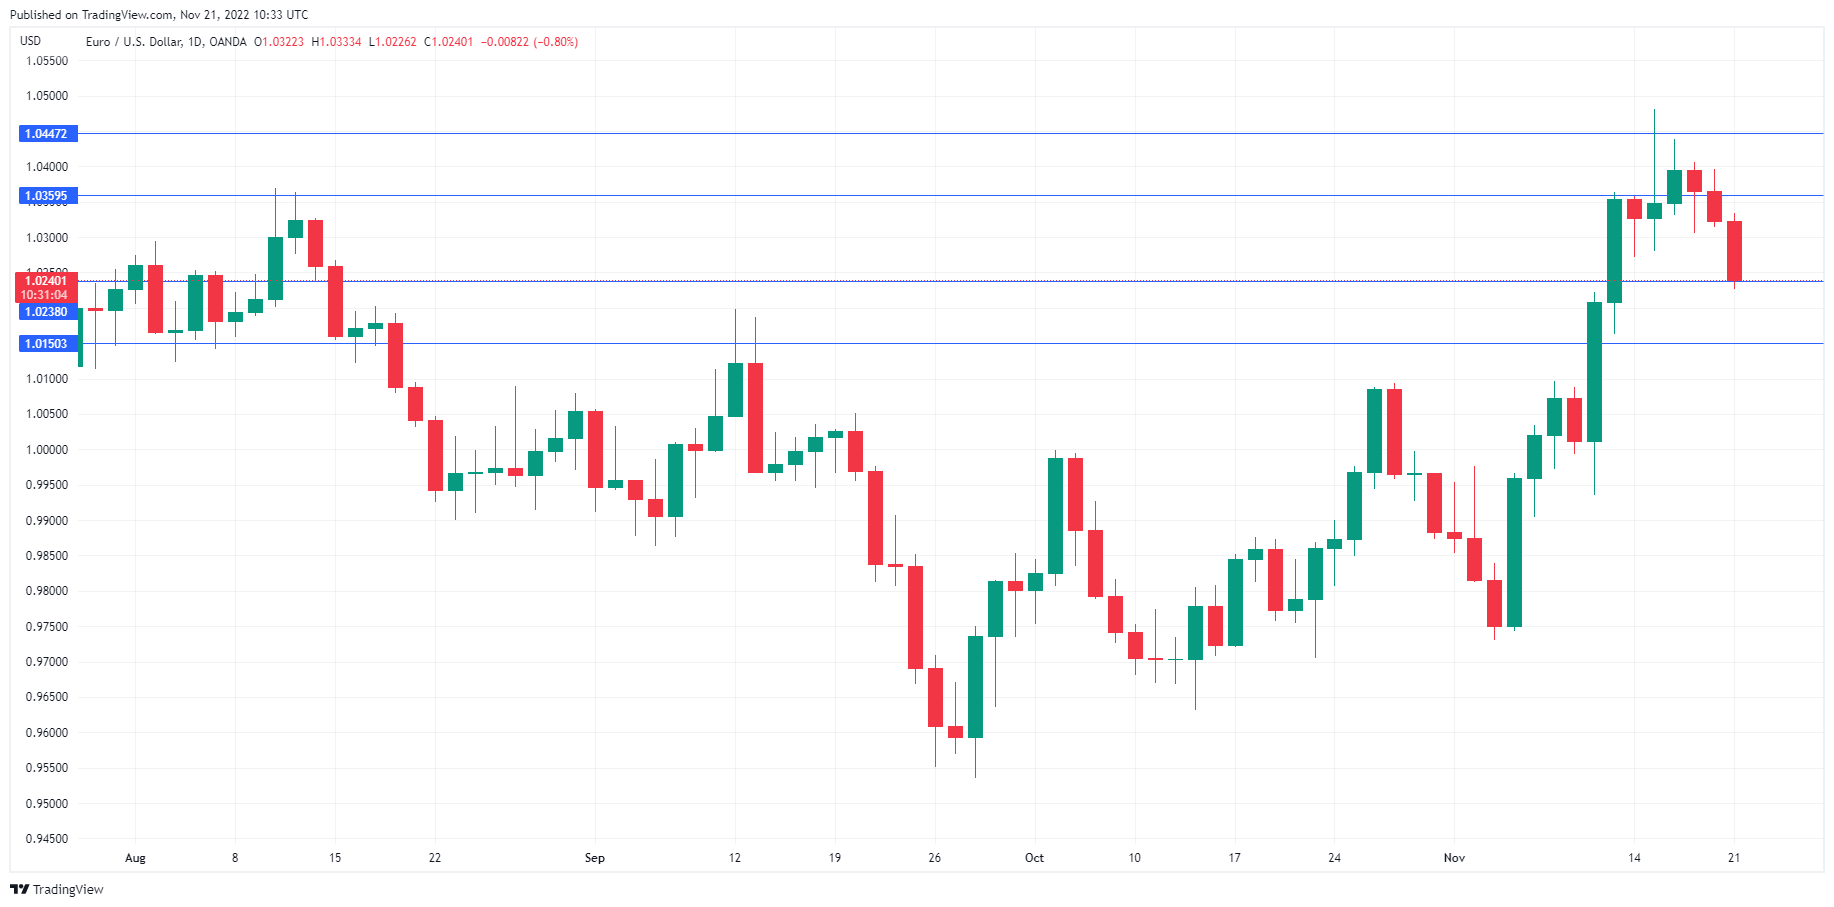
EUR/USD has resumed its downswing and is in negative territory on Monday. In the North American session, the euro is trading at 1.0238, down 0.81%.
The ECB holds its final policy meeting of the year on December 15th, and it’s practically a given that the ECB will raise rates. But by how much? The current benchmark rate of 1.50% is low compared to other central banks, but the ECB is well aware that a weak eurozone economy will have trouble absorbing further oversize hikes. The ECB’s rate-tightening cycle has been steep, with an increase of 200 basis points in just three months. Still, inflation continues to soar, hitting 10.6% in October, up from 9.9% a month earlier. With inflation in double-digits, there is strong pressure to deliver a 50-bp increase next month. However, policy doves would like to see slower rates of 25-bp in order to minimize an economic slowdown.
German PPI slides
There was a surprise from Germany’s PPI today, which fell by 4.2%, its first decline since May 2020. The consensus stood at 0.9%. Is the sharp decline a mere blip, or does it point to lower inflation in the eurozone’s largest economy? We’ll get a look at German and eurozone CPI reports next week, and a drop in inflation will raise speculation that inflation may have finally peaked.
The Federal Reserve’s barrage of hawkish statements from Fed members has chilled risk appetite and hopes of a Fed pivot. The US dollar has bounced back after taking a beating following the soft inflation report earlier this month. The Fed has long insisted that one or two reports showing inflation is lower does not make a trend, although risk sentiment has soared on every soft inflation report. If November’s inflation data is lower than anticipated, we can expect risk appetite to jump at the expense of the US dollar. The markets have priced in a 50-bp hike next month, although some Fed members have stated that a 75-bp move remains on the table.
EUR/USD Technical
- 1.0359 and 1.0447 are the next resistance lines
- EUR/USD is testing support at 1.0238. Below, there is support at 1.0150
CAD/JPY and AUD/JPY recover as Yen weakens
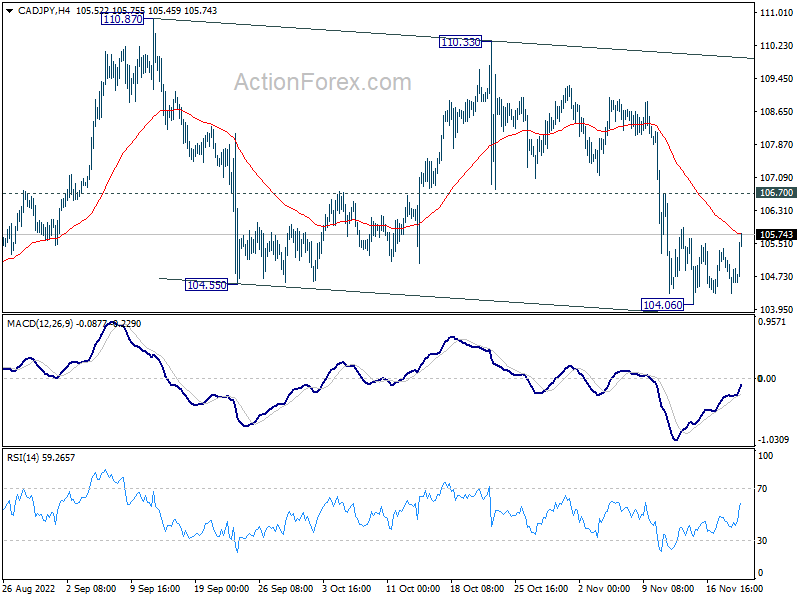
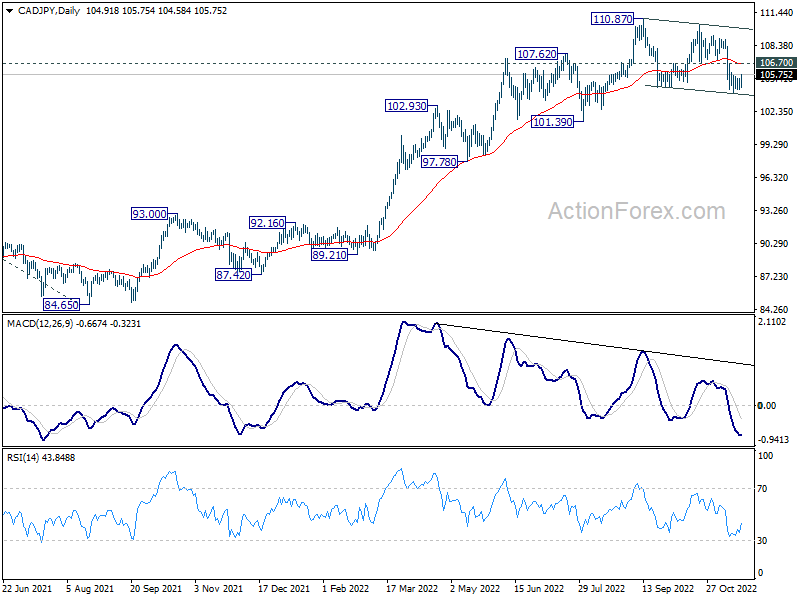
Yen trades broadly lower today following rebound in benchmark US and European yields. CAD/JPY is one of the top movers for the day. It's possible that whole corrective pattern from 110.87 has completed with three waves down to 104.06. Break of 106.70 resistance, and sustained trading above 55 day EMA will affirm this case, and bring further rise to retest 110.33/110.87 resistance zone.
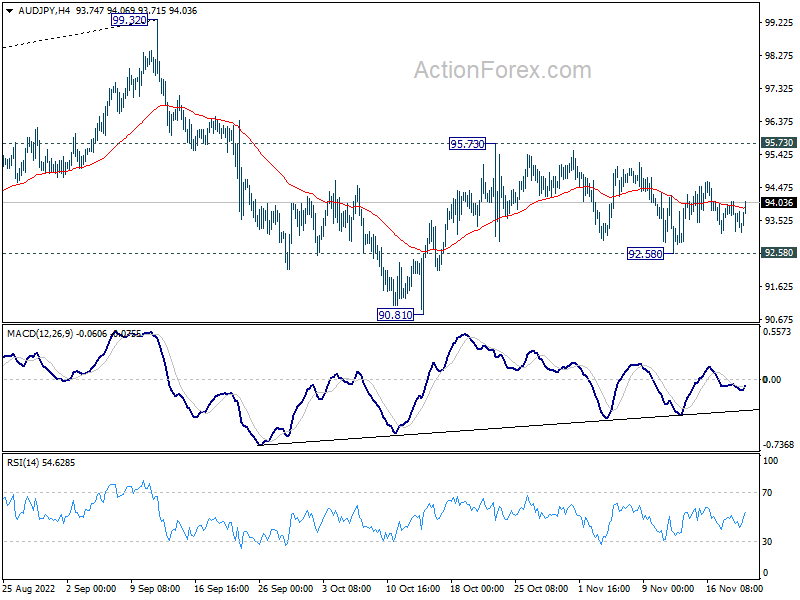
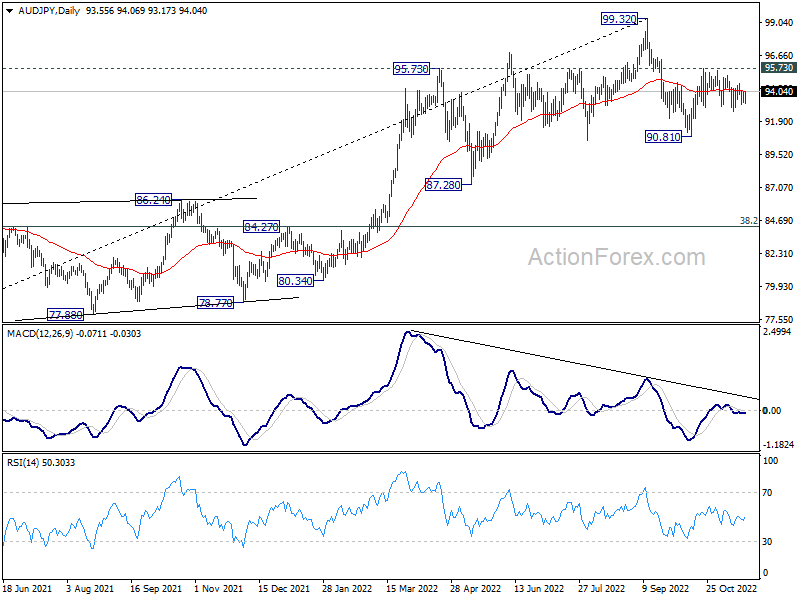
AUD/JPY also rises mildly today but stays well below 95.73 resistance. Firm break there will affirm the case that pull back from 99.32 has completed at 90.81. Rise form 90.81 should then resume and target a test on 99.32 high.
USDJPY Bears Take a Breather after 2½-month Low
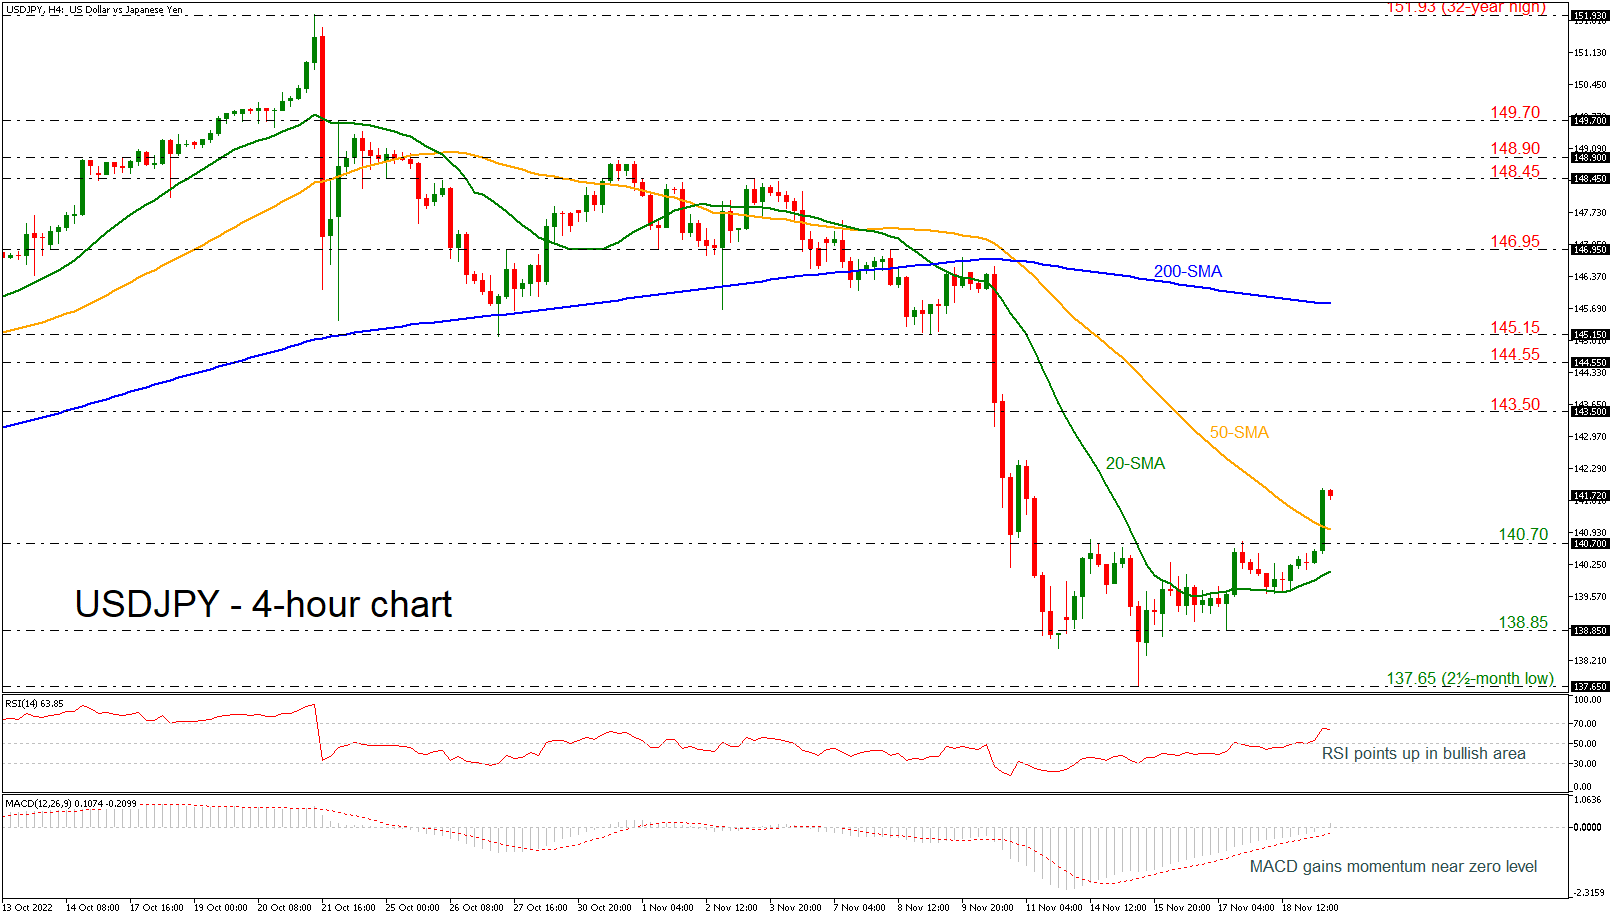
USDJPY showed some significant improvement in the previous 4-hour session, extending the bullish structure above the 140.70 barrier and the 50-period simple moving average (SMA). The RSI is sloping slightly down above the neutral threshold of 50, while the MACD has advanced above the zero level.
In the event the bulls hold control, the 143.50 resistance will come first into view. A violation at this point may see another challenging battle around the 144.55-145.15 restrictive region. If buyers claim that zone this time, the 200-period SMA at 145.80 could immediately add some downside pressure.
Should the bears dominate, driving the price below the 50-period SMA and the key level of 140.70, the spotlight will shift to the 20-period SMA at 140.10, where any step lower will take the pair towards 138.85 and the previous trough of 137.65, which is a two-and-a-half month low.
In brief, although USDJPY continues to face unfavorable trend signals, the odds for an upturn seem to be growing, with the confirmation expected to come above the 200-period SMA.
ECB: Lane: One platform for 75bps hike is no longer there
ECB Chief Economist Philip Lane said in an interview that "we expect to raise rates further". But "each meeting is different" and "one platform for considering a very large hike, such as 75 basis points, is no longer there."
"When we were at zero, that did not correspond to anyone's idea of the interest rate level necessary. Going to 1.5 per cent is still below where we need to go," he said. "But the more you've already done on a cumulative basis, that changes the pros and cons of any given increment."
"I don't think December is going to be the last rate hike" he said. "Trying to jump forward to February, to March, to May or June next year, I think it's too early to have very strong views at this point... The more relevant argument than whether to pause is to move at the appropriate time to smaller increments."
Bitcoin Tests the Strength of Support
Market picture
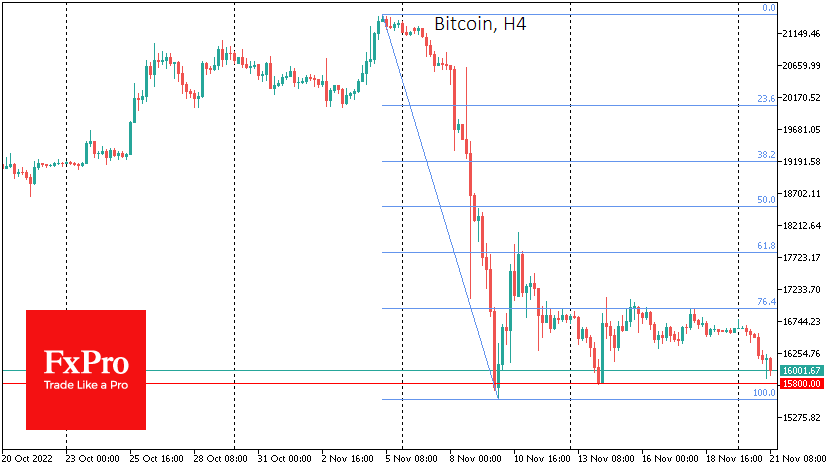
Bitcoin has lost 4% in the past 24 hours, once again testing the strength of the $16K area. Ethereum is down 7.8% overnight to $1120. Other leading altcoins in the top 10 were down 5.5% (BNB) to 10.6% (Dogecoin).
Total cryptocurrency market capitalisation, according to CoinMarketCap, sank to $795bn, losing 4.9% overnight and 5.6% for the week. The cryptocurrency fear and greed index is down to 21 points by Monday versus 24 just over a week ago.
Bitcoin failed to develop a rebound last week, facing an intensified sell-off near $17K and about 23.6% of the move down from 5 to 10 November. Such a weak rebound indicates solid bearish pressure, forcing us to expect another move towards the lower boundary at $15.8K. A consolidation below that level could start a new downside wave with a potential target of $12K. However, this is a very distant target, while round levels of $15K and $14K could be the intermediate ones.
News background
Bitcoin’s mining difficulty continues to increase, rewriting an all-time high. The falling price has resulted in the first cryptocurrency being mined at a loss on average. The falling price and high interest rates make us expect miner activity to drop and a subsequent decrease in difficulty. However, there could likely be a brief struggle for market share amongst miners: with bankruptcies and takeovers. This will be interesting.
According to the Nansen report, the collapse of FTX was directly linked to Terra’s failure in May. The unrealised loss of the “average” long-term bitcoin investor reached 33%, according to Glassnode’s calculations.
The impact of the FTX collapse will still be evident for the foreseeable future, according to a statement to investors from venture capital firm Multicoin Capital. Many players will cease to exist, putting pressure on the liquidity of the crypto market.
Some major crypto exchanges have suspended accepting deposits and withdrawals in Stablecoins, which are hosted on the Solana blockchain. The decision was made due to Solana’s association with the collapsed FTX exchange, which used the blockchain’s power.
The Australian unit of consultancy firm KPMG has said that meta-universes have the real potential to change many areas of life. In doing so, large companies will contribute to the technology’s adoption.
EURUSD Retraces Lower as 200-day SMA Rejects Advance
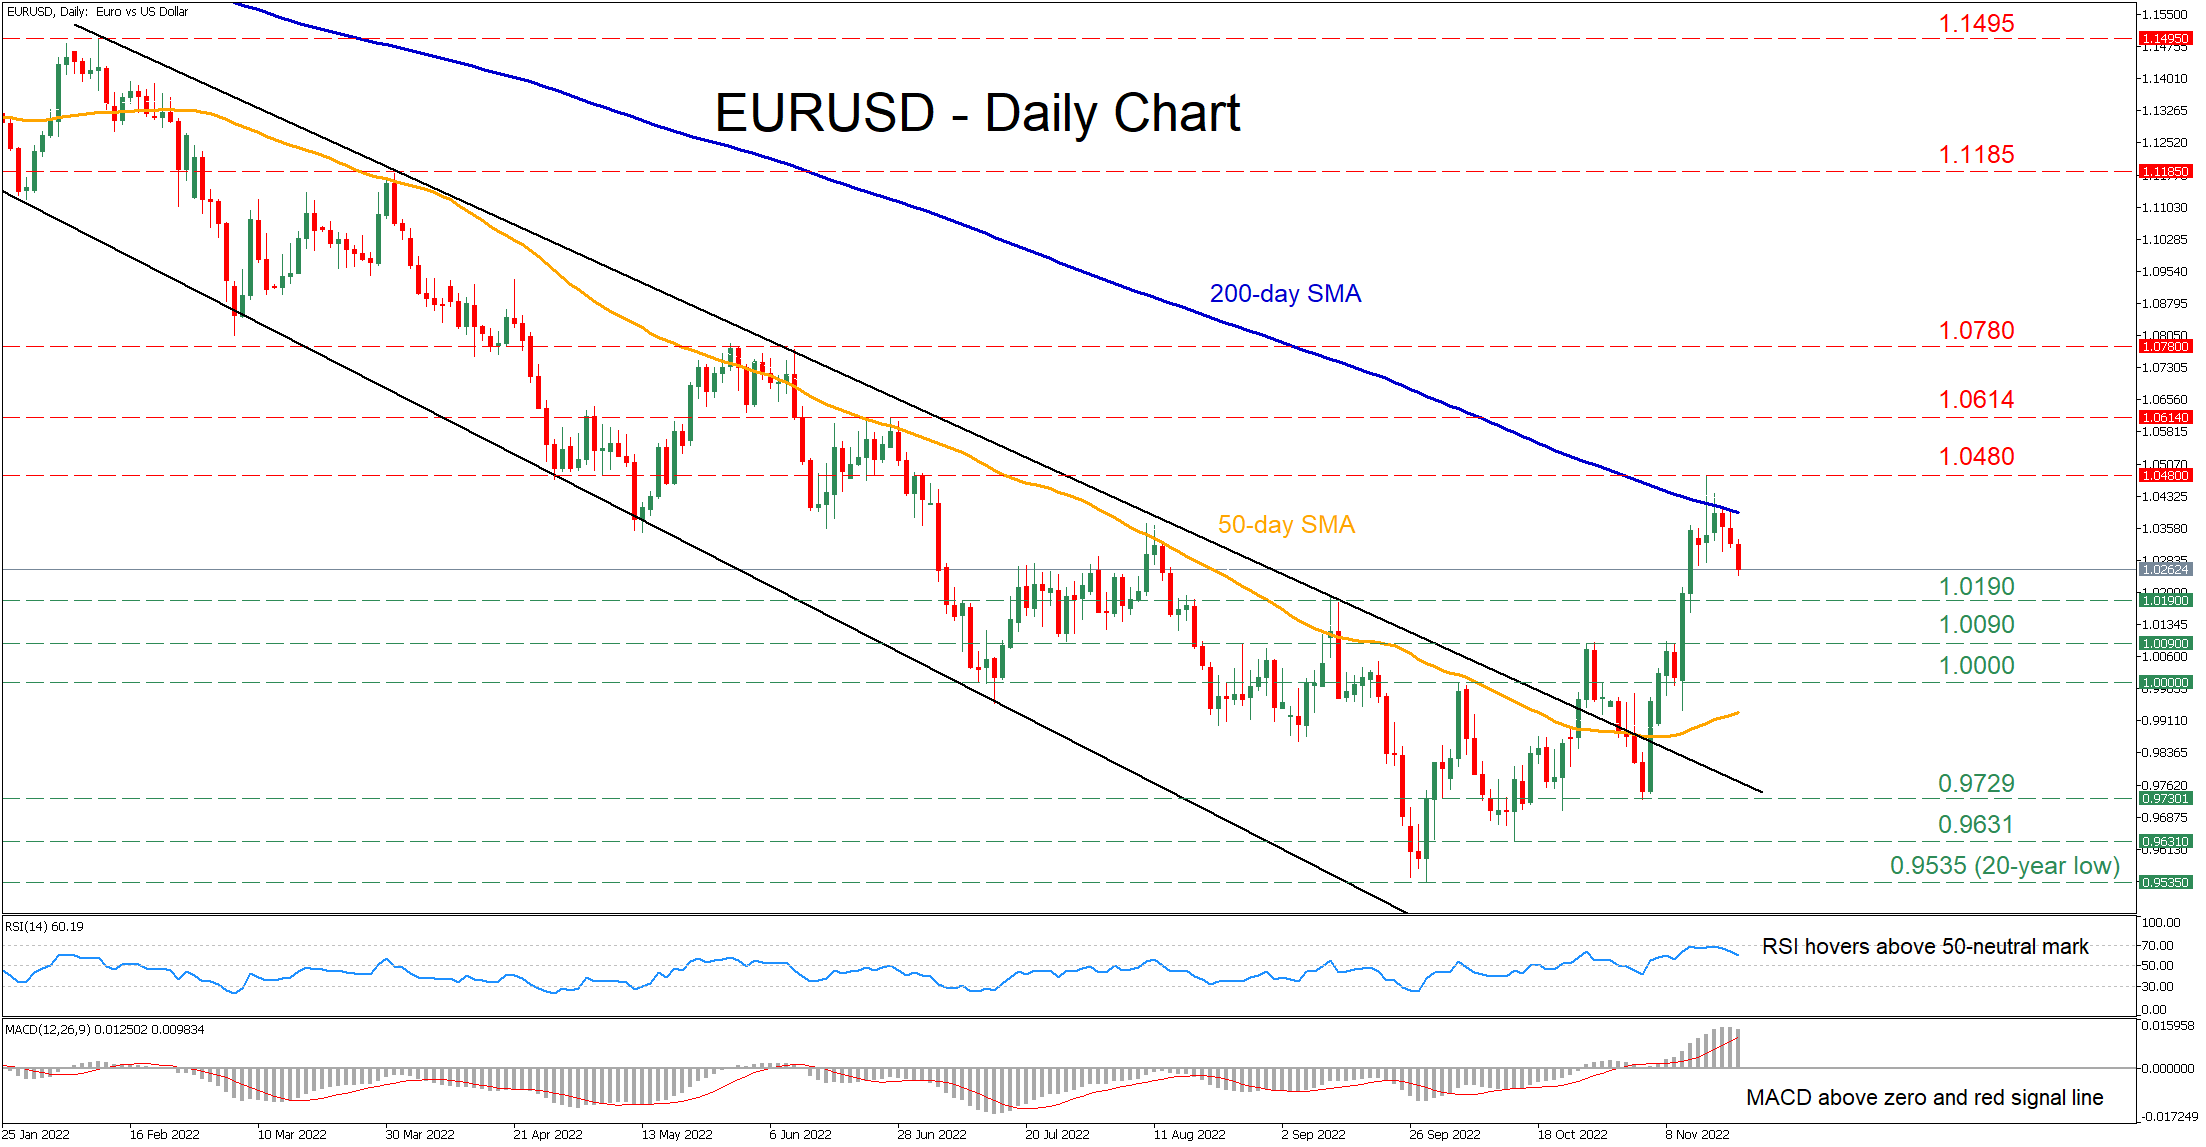
EURUSD has been attempting a rebound in the short term after escaping its descending channel to the upside. However, in the past few daily sessions, the advance has paused as the price has been constantly held down by the 200-day simple moving average (SMA).
The short-term oscillators currently suggest that bullish forces are waning but remain in control. Specifically, the RSI is pointing downwards above its 50-neutral mark, while the MACD histogram is softening above both zero and its red signal line.
Should selling pressures intensify further, the September high of 1.0190 could act as the first line of defence. Sliding beneath that floor, the spotlight could turn to 1.0090 before the crucial parity region comes under examination. Failing to halt there, the price may then test the November low of 0.9729.
To the upside, if bullish forces re-emerge and push the price above the 200-day SMA, initial resistance might be encountered at the recent high of 1.048. Conquering this barricade, the bulls could then aim at the June resistance of 1.0614. Even higher, the 1.0780 hurdle could prove a tough one for the price to overcome.
Overall, EURUSD appears to be experiencing a minor pullback after the 200-day SMA capped its upside. Therefore, breaking above the latter could signal the resumption of the pair’s short-term uptrend.
EURUSD: Bull-Trap and Risk Aversion Boost Fresh Bears
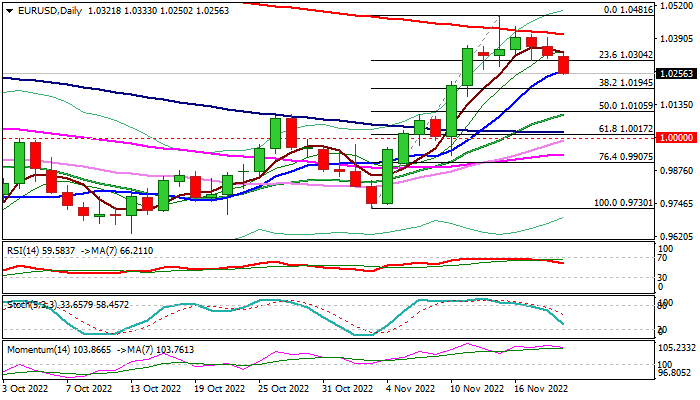
The Euro holds in red for the third straight day, deflated by fresh risk aversion, with early Monday’s acceleration lower, pushing the price to the lowest since Nov 11.
bears broke initial Fibo support at 1.0304 (23.6% of 0.9730/1.0481) and cracked ascending 10DMA (1.0266), generating further bearish signals.
Reversal pattern is forming on weekly chart, though more evidence is still needed for confirmation, with near-term action being weighed by a bull-trap on daily chart, following repeated rejections above falling 200DMA.
Sustained break of 10DMA would further weaken near-term structure, but extension below pivotal Fibo support at 1.0194 (Fibo 38.2%) is needed to accelerate reversal and expose key supports at 1.0023/1.0000 zone (100DMA / Fibo 61.8% / parity).
Fading bullish momentum on daily chart, add to negative signals, with near-term action expected to remain biased lower while holding below falling 200DMA (1.0407).
Res: 1.0304; 1.0336; 1.0407; 1.0481.
Sup: 1.0194; 1.0163; 1.0090; 1.0023.
RBNZ Might Need to Slam the Brakes in November as Economy Heats Up
The Reserve Bank of New Zealand will hold its last policy meeting of the year on Wednesday (01:00 GMT) and another rate hike is on the cards. After five consecutive 50-basis-point rate increases, policymakers will be pondering an even larger move in December, as, far from the economy cooling, inflationary pressures are at risk of boiling over. With the US dollar under strain from speculation about the Federal Reserve pivoting in the opposite direction, the New Zealand dollar could enjoy a substantial boost should there be a hawkish surprise.
Too hot
Throughout this global tightening cycle, the RBNZ has been at the forefront of the race to raise borrowing costs. However, whilst some sectors of the economy, such as housing, have started to feel the weight of the multiple rate hikes, things are heating up on other fronts.
The labour market in particular has yet to respond to the official cash rate being at the highest in more than seven years. The unemployment rate – at 3.3% – is the lowest in decades thanks to ongoing labour shortages that have pushed up wage growth to the highest on record. Additionally, after a poor second quarter, consumer spending has picked up again in recent months.
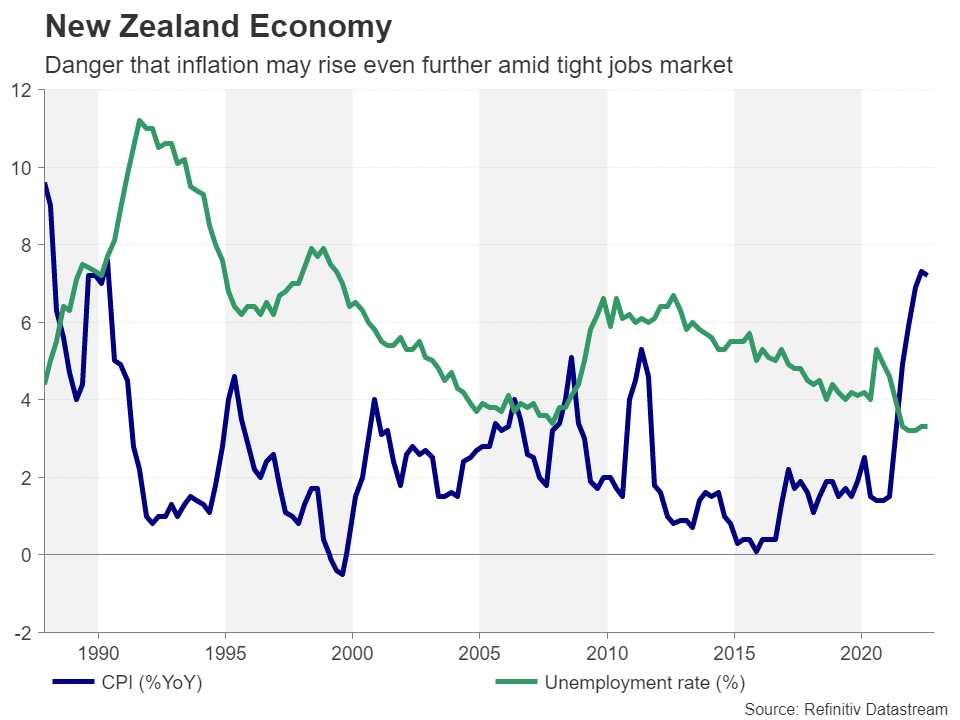
More importantly, inflation in the third quarter was considerably hotter than expected, with the annual rate of CPI easing only marginally to 7.2% - well above the RBNZ’s target band of 1-3%. But the worries about simmering inflationary pressures don’t stop there. Inflation expectations according to the RBNZ’s own survey have started to creep up again, likely raising alarm bells within the Monetary Policy Committee.
Time to join the triple hike club?
All this has led investors to price in higher odds of a 75-bps increase in November versus a 50-bps one, assigning a probability of about 60%. Looking at the RBNZ’s last set of economic projections from August, a 75-bps increment seems unlikely as the cash rate was seen peaking slightly above 4%. Raising by 75 bps would immediately take rates above this terminal level to 4.25%. It would also involve quite a significant revision to overall forecasts in the updated quarterly Monetary Policy Statement due to be published the same day.
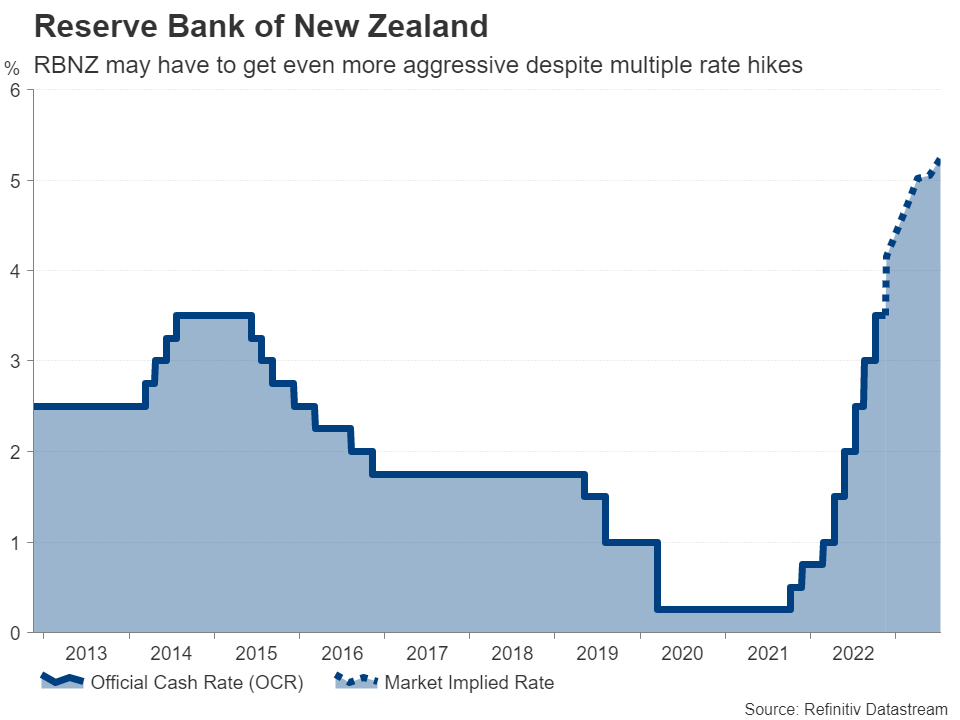
The RBNZ might not be comfortable taking such a big leap in one go, especially as it wasn’t that long ago when Governor Adrian Orr was describing the tightening cycle as “very mature” to signal that there aren’t many rate hikes left to go. Having said that, the October meeting minutes did reveal that the decision was between 50 and 75 bps. Furthermore, the next meeting after this isn’t until February 2023, so policymakers might not want to risk playing it safe when the data picture has altered so dramatically.
A hawkish boost for the kiwi
Either way, the projection of the terminal rate looks set to be revised higher, and even if there is only a ‘smaller’ hike of 50 bps, it would almost certainly be accompanied by a hawkish statement. Hence, there is scope for the New Zealand dollar to extend its recent gains, which for now, appear to have stalled just below the $0.6200 level.
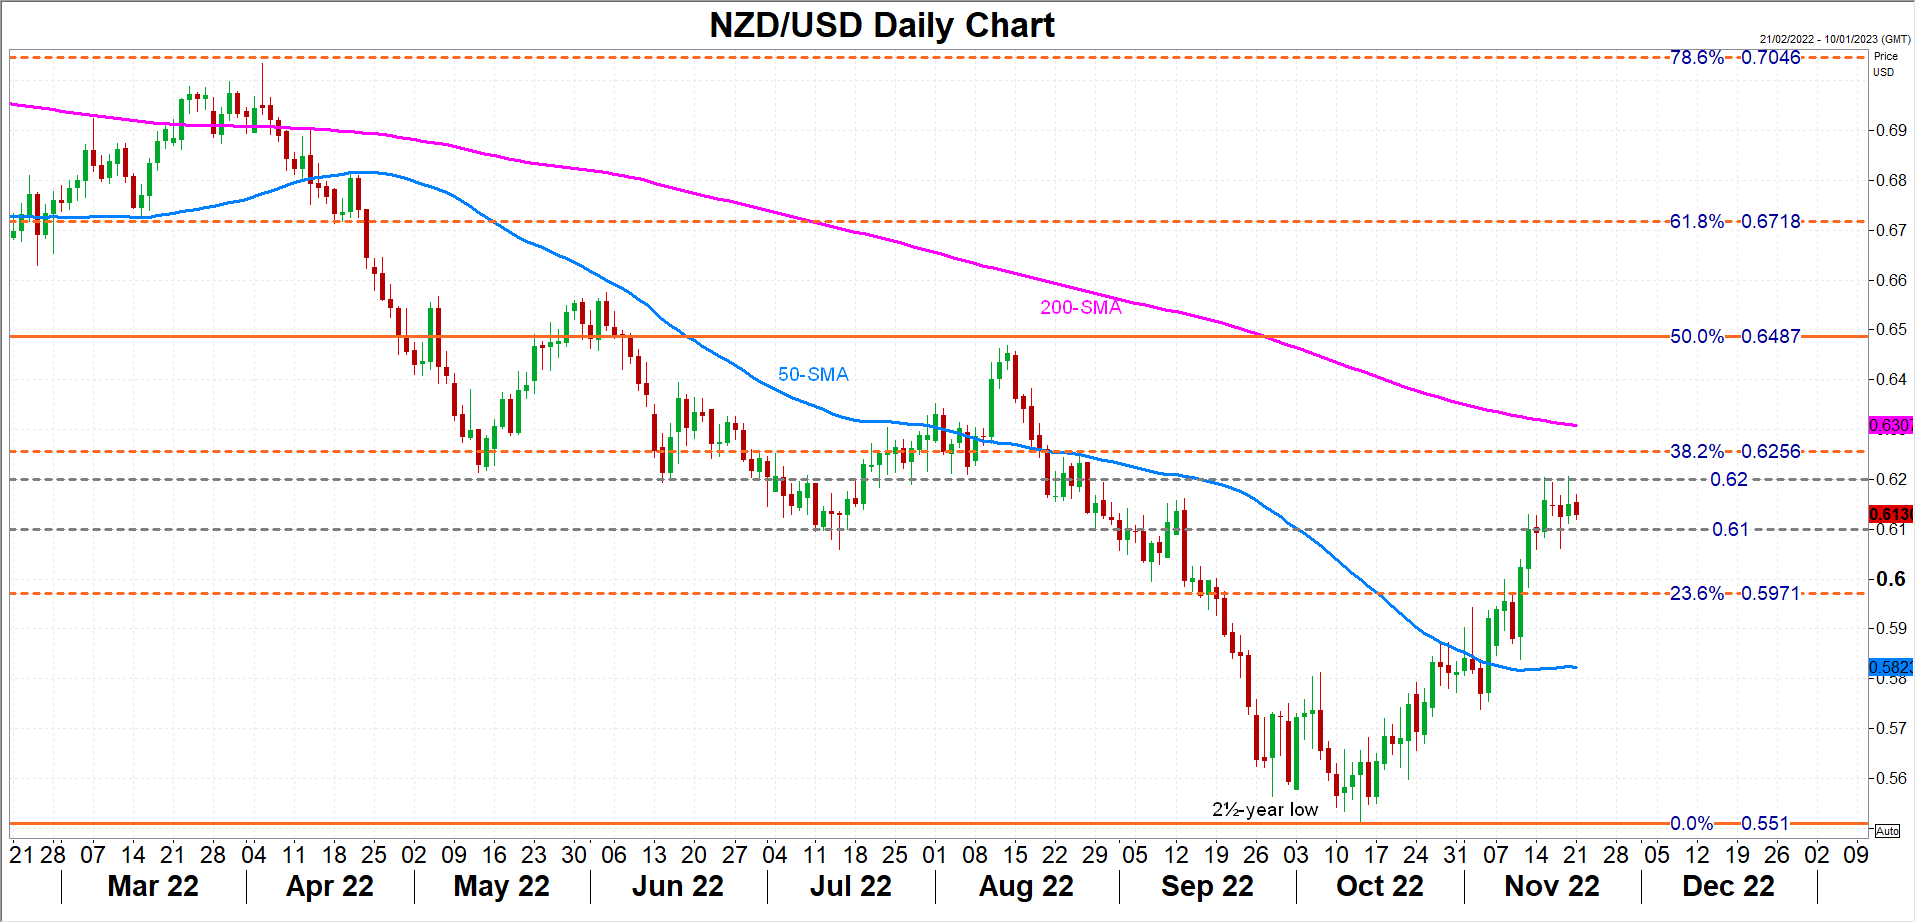
Given that a 75-bps increase isn’t fully priced in, the kiwi could overtake the 38.2% Fibonacci retracement of the 2021-2022 downtrend to meet its 200-day moving average (MA) slightly above $0.6300 in the event of such an announcement. But further gains, specifically towards the August highs and the 50% Fibonacci of $0.6487, would depend on how high the Bank sees the adjusted terminal rate to be.
However, this is also what could trigger a selloff. Should the RBNZ predict the cash rate peaking below the market implied terminal rate of around 5%, the kiwi could be knocked all the way down to the 50-day MA at $0.5823.
It’s worth keeping in mind, though, that now that the US dollar appears to have potentially topped out, the upside swings could well be greater than the downside ones.
Dollar Index: Dollar Regains Traction on Fresh Safe-haven Buying
The dollar index extends acceleration from last Friday and hits one-week high in early Monday, lifted by renewed risk aversion.
Traders move into safety on fresh rise in new Covid cases in China, which prompted tighter restrictions, with capital Beijing most populous districts being hit the most.
China’s zero-Covid tolerance policy drives the volatility higher in such situation, as tough restrictions impact economic activity and markets await signals whether the government will start easing its policy soon.
Fresh safe-haven buying lifted the dollar index, signaling fresh direction after the price was in sideways mode last week, consolidating recent strong fall.
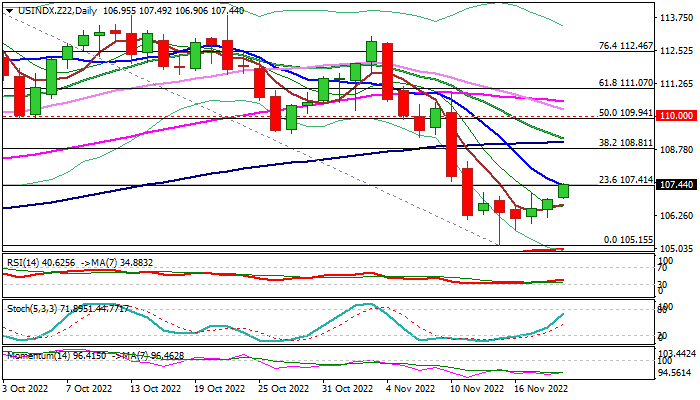
Initial reversal signals are developing on daily chart as fresh gains cracked first pivot at 107.41 (Fibo 23.6% of 114.72/105.15 fall, reinforced by 10DMA), with sustained break here to firm near-term structure and expose next important barriers at 108.81/109.05 (Fibo 38.2% / 100DMA).
North-heading daily indicators support the action, though momentum is still deeply in the negative territory, but weekly bear-trap under Fibo 61.8% of 101.29/114.72) underpins the action.
Recovery needs lift through 109 zone and violation of the base of thick daily cloud (109.61) to confirm reversal signal and open way for further recovery.
Otherwise, recovery will remain fragile and at risk of stall that would signal better opportunities to re-enter larger downtrend off Sep 29 peak (114.72).
Res: 108.30; 108.81; 109.05; 109.61.
Sup: 107.90; 106.68; 105.70; 105.15.