

Sample Category Title
NZ goods exports rose 14% yoy in Oct, imports surged 24% yoy
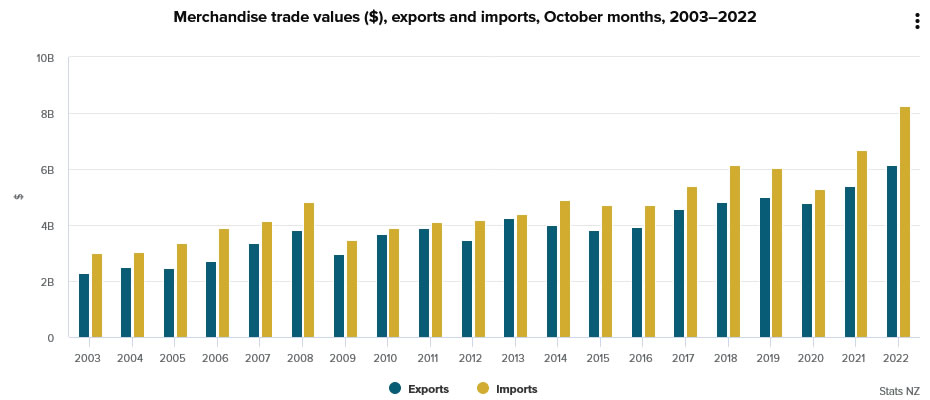
New Zealand goods exports rose 14% yoy to NZD 6.1B in October. Goods imports rose 24% yoy to NZD 8.3B. Trade deficit widened from NZD -1.7B to NZD -2.1B, much larger than expectation of NZD -1.7B.
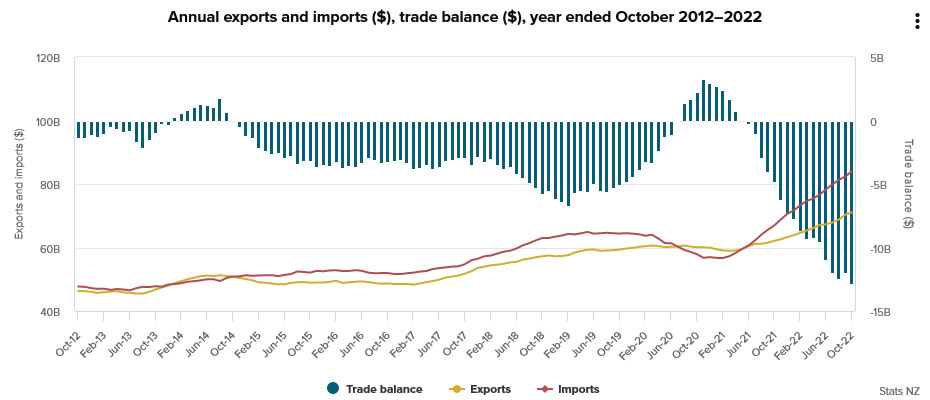
Annual goods expects, comparing with the year ended October 2021, rose 14% to NZD 71.1B. Annual goods imports rose 25% to NZD 84.0B. Annual trade deficit swelled to fresh record of NZD -12.9B, comparing to NZD -4.9B a year ago.
Fed Mester: Makes sense that we can slow down a bit
Cleveland Fed President Loretta Mester said yesterday, "we're at a point where we're going to enter a restrictive stance of policy. At that point, I think it makes sense that we can slow down a bit the ... pace of increases."
"We're still going to raise the funds rate, but we're at a reasonable point now where we can be very deliberate in setting monetary policy," she added.
"I think we can slow down from the 75 at the next meeting. I don't have a problem with that, I do think that's very appropriate," Mester said. "But I do think we're going to have to let the economy tell us going forward what pace we have to be at."
"Right now my forecast is that we're going to see some real, good progress on inflation next year," Mester said. "We won't be back to 2%, but we'll see some meaningful progress next year. But if we don't see that, then we're going to have to make sure our policy really reacts to the incoming information. So I can't tell you today what the path going forward will be."
Fed Daly: Premature to take anything off the table
San Francisco Fed President Mary Daly said yesterday that "it's premature in my mind to take anything off the table", regarding the size of rate hike in December. She added. "I'm going into the meeting with the full range of adjustments that we could make on the table.
Daly also said recent CPI data was "way too early to cause a turning point on inflation... One month does not a victory make. It doesn't give me comfort. We will need more good months of data before call this a turning point."
"As we work to bring policy to a sufficiently restrictive stance -- the level required to bring inflation down and restore price stability -- we will need to be mindful," Daly also said. "Adjusting too little will leave inflation too high. Adjusting too much could lead to an unnecessarily painful downturn."
ECB Centeno: Many conditions in place for less than 75bps hike
ECB Governing Council member Mario Centeno was asked yesterday about whether the central bank should hike by less that 75bps in December. He said, "I think there are conditions in place -- many conditions -- for the increase to be less than that number".
Centeno also noted that "rates in Europe continue to be roughly half those in the United States", and that's a good indicator of the difference between the economic fundamentals of the two regions. He also urged restraint in wage growth and company margins as that "could help the ECB a lot in combating inflation".
GBP/USD Could Resume Upsides Unless It Breaks This Support
Key Highlights
- GBP/USD climbed higher and tested the 1.2000 resistance zone.
- A major bullish trend line is forming with support near 1.1740 on the 4-hours chart.
- Crude oil price gained bearish momentum below the $80.00 support.
- Canada’s retail sales could decline 0.7% in Sep 2022 (MoM).
GBP/USD Technical Analysis
The British Pound started a major increase above the 1.1650 and 1.1750 resistance levels against the US Dollar. GBP/USD even broke the 1.1800 resistance zone.
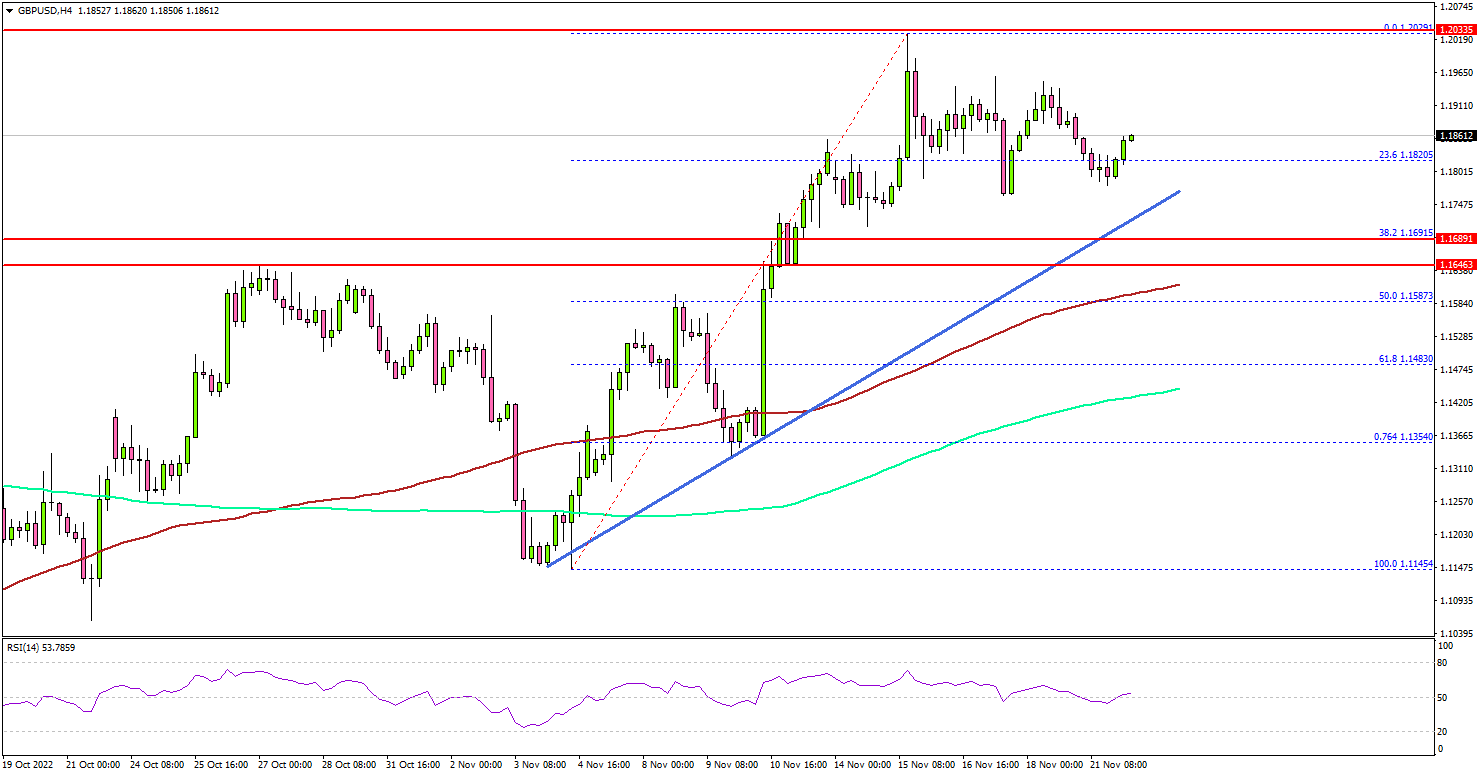
Looking at the 4-hours chart, the pair settled above the 1.1700 level, the 100 simple moving average (red, 4-hours) plus the 200 simple moving average (green, 4-hours).
It traded as high as 1.2029 and recently started a downside correction. It traded below the 1.1950 support level. There was a move below the 23.6% Fib retracement level of the upward move from the 1.1145 swing low to 1.2029 high.
An initial support is near the 1.1750 level. There is also a major bullish trend line forming with support near 1.1740 on the same chart.
The next major support is near the 1.1700 zone, below which the pair might test the 100 simple moving average (red, 4-hours). It is near the 50% Fib retracement level of the upward move from the 1.1145 swing low to 1.2029 high.
The main support sits at 1.1500. A close below the 1.1500 level might start another strong decline. In the stated case, GBP/USD could decline towards the 1.1200 support.
On the upside, an immediate resistance is near 1.1920 level. The next major resistance may perhaps be near 1.2000. Any more gains could set the pace for a move towards the 1.2250 resistance zone.
Looking at oil price, the bears remained in action and there was a strong decline below the $80.00 support zone.
Economic Releases
- Canadian Retail Sales for Sep 2022 (MoM) – Forecast -0.7%, versus +0.7% previous.
- Canadian Retail Sales ex Autos for Sep 2022 (MoM) – Forecast -0.4%, versus +0.7% previous.
EURUSD Wave Analysis
- EURUSD under bearish pressure
- Likely to fall to support level 1.02
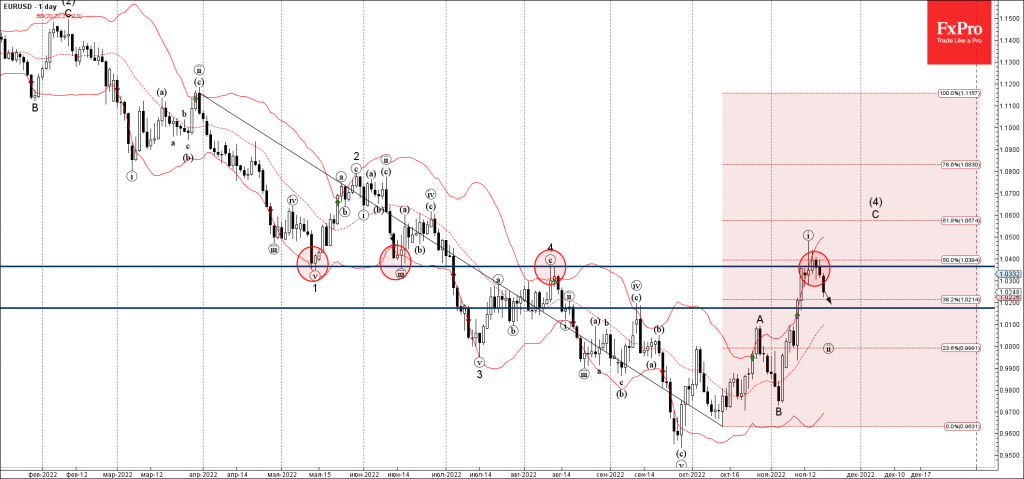
EURUSD under the strong bearish pressure after the pair reversed down from the pivotal resistance level 1.037 (former monthly low from May and June, and the monthly high from August) – standing near the upper weekly Bollinger Band.
The downward reversal from the resistance level 1.037 started wave (ii) of the active C-wave from the start of November.
EURUSD can be expected to fall further toward the next support level 1.02 (former monthly high from September).
AUDUSD Wave Analysis
- AUDUSD reversed from resistance level 0.6725
- Likely to fall to support level 0.6500
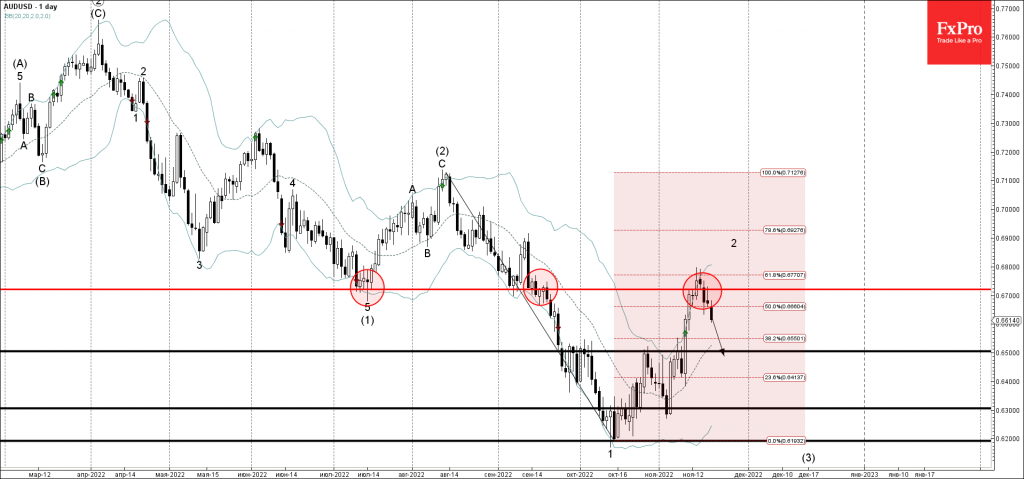
AUDUSD recently reversed down from the key resistance level 0.6725 (former multi-month low from July), strengthened by the upper daily Bollinger Band and by the 61.8% Fibonacci correction of the downward impulse 1 from August.
The downward reversal from the resistance level 0.6725 stopped the previous short-term corrective wave 2 from October.
Given the strongly bullish USD sentiment seen today – AUDUSD can be expected to fall further toward the next support level 0.6500 (former resistance from October).
The Last Frontier for USD and Gold
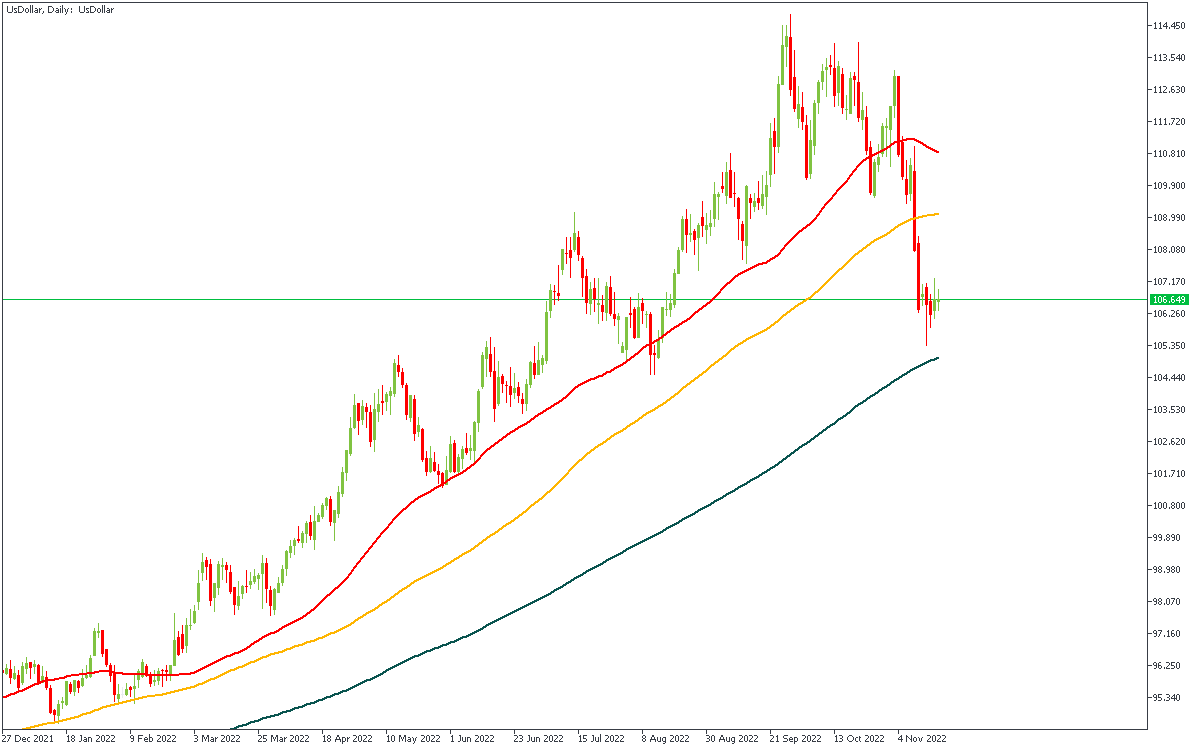
Suddenly, the US Dollar Index fell 6.70% over the last two weeks, marking the biggest decrease in the currency since 2020. This movement greatly impacted stocks, other currencies, and gold. In this article, FBS experts focus on the XAUUSD pair as a main antagonist of the dollar. Economic analysis, valuable tips, and price forecasts are in this article.
What stands behind the dollar’s fallout?
The uptrend in the USD that lasted almost two years. It may now seem that the US currency is finally ready to reverse to the downside. The decrease started on November 4, when the US Office for National Statistics released the Non-farm employment change (NFP) data. The two previous releases pushed the USD up, that’s why it was surprising that high NFP pulled the USD down.
The US dollar strengthened after September’s and October’s NFP because the strong labor market signaled to the Fed that the American economy was still hotter than needed. Thus, it was evident that the Fed would increase the interest rate to decrease the speed of rising prices. In November, however, the sentiment started to change because NFP was still lower than in previous months, meaning that the labor market finally started to cool down.
The USD decrease sped up when the US monthly CPI data came out on November 10. A 0.4% rise vs. 0.6% forecast was taken as “the end of the recession,” sending risky assets to the moon and the USD below the 100-daily moving average. Finally, the US PPI, another measure of consumer inflation, turned out to be lower than expected (0.2% vs. 0.4% forecast).
All this created massive pressure on the US dollar index, pushing it to a three-month low and boosting EURUSD, stocks, and gold. Even so, why did gold skyrocket?
Gold and the USD interconnection
When Federal Reserve hikes rates, it makes money more expensive. To put it simply, higher interest rates increase deposit yields and loan interest. Thus, people and companies slow down spending and try to save more money for the future. The economy slows, and currency becomes more expensive, rising against other currencies. All that creates price pressure for gold, pushing it lower when the Fed fights inflation and insists on hawkish measures.
Here’s how it works:
- The inflation goes up, and the amount of the USD in circulation increases. Thus, the USD starts to decline.
- Fed applies monetary measures (interest rate increases and decrease of money supply)
- The USD starts growing, putting pressure on the XAUUSD (gold).
- The dollar weakens as the tightening process slows down, and gold soars.
The correlation between these two assets is better to see than to read about. Also, consider checking the FBS website for more analysis on gold and USD movements.
As for now, we have come to the most exciting part of the USD-gold price correlation, which is the change in the global trend.
Gold price forecast
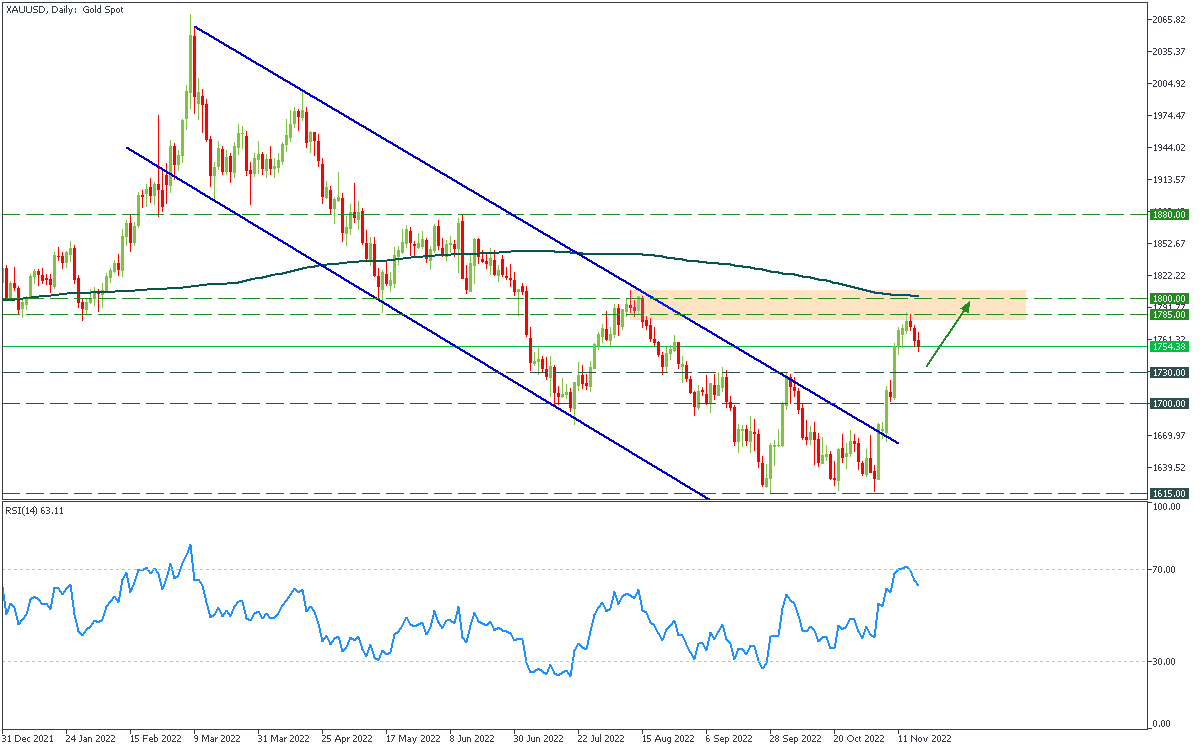
Both the USD and XAUUSD approached the most important indicator of the trend – the 200-daily moving average. This level acts as a support for the dollar and as a resistance for gold. In both cases, the breakout of this level will signal a change in the long-term trend.
If the USD breaks the level of 105.00, gold will be extremely bullish. However, it’s important to notice that 200-period MA is a solid barrier. Assets usually take several attempts to break and form a price swing in the direction of the breakout. Therefore, we consider gold will correct from the area of $1785-1800 and reach the support of $1730, the last price high. After that, we need to look closely at actual economic data. More bearish news for the USD would add momentum to gold movements, and the metal may rise to $1880.
In summary, gold has more chances to grow than in the previous eight months. And with FBS, you can trade gold wherever you want, buying and selling the asset in seconds.
Sunset Market Commentary
Markets
Markets started the week with a Chinese inspired, admittedly modest, risk-off. The reaction of authorities to a new wave of Covid infections raised questions on an easing in the country’s zero-Covid policy. The change in sentiment on Chinese markets also illustrates that good news which, together with lower interest rates, supported the recent risk rally remains fragile and can turn from one day to another. Will Chinese production/demand recover as hoped for? Will a less harsh European winter prevent an sharp economic downturn? Will global growth succeed the hoped for soft landing despite tighter global monetary conditions? Answers to these and other questions remain highly uncertain and can change instantly. Whatever, risky assets see the glass half empty rather than half full today. Chinese equity indices lost up to 1.87% (Hang Seng) with modest spill-over effects on EMU (EuroStoxx -0.3%) and US markets (mixed to modestly lower, Nasdaq -0.4%). Uncertainty on global demand also weighs on cyclical commodities like copper (-1.0%+) or oil with Brent declining further to $84 p/b).
The ‘risk-off’ repositioning at least brought clarity on the fate of the dollar. The recent correction has gone far enough. The Fed might slow the pace of rate hikes in December, but remains a frontrunner in the anti-inflation campaign. After tentative signs of bottoming last week, the DXY jumped from an open sub 107 to currently trade near 107.75. EUR/USD’s failure to close last week above the 1.0350/68 area caused USD shorts against the euro to throw the towel. At 1.024, the pair again fell prey to the forces of gravity and is at risk of falling below an uptrend line in place since early this month. No safe haven allures for the yen, with USD/JPY decisively returning north of 140 (cur.141.5). In this respect, the Swiss franc performs better with EUR/CHF easing back to the 0.981 area. Sterling is holding up fairly well. EUR/GBP dropped below minor support near 0.869 to currently trade at 0.8675, but the short-term consolidation pattern in place since early October remains firm.
Interest rate markets initially didn’t show a clear directional trend, but yields finally turned south as US traders joined. US and German yields lose 3/5 bps. European swaps are ceding 5 (2-y)/8 (30-y) bps. ECB talk included an MNI-interview with ECB Lane who stroke a balanced tone. He acknowledged that there might still be additional follow-through from higher energy prices into retail prices. Supportive fiscal policy also has implications for inflation and wages are rising above normal. However, with respect to the pace of further rate hikes, Lane indicated that, even as further steps are necessary, the case for a next 75 bps step has become less strong after the tightening the central bank has already done earlier this year. He didn’t give clear hint on the peak cycle rate.
News Headlines
Swedish home prices plunged by 3% m/m in October, Sweden’s Valueguard housing index revealed today. The drop increases the peak-to-trough decline to 14%, bringing it already close to the Riksbank’s expected 18%. One of Europe’s hottest housing markets is now in the worst rout since the 1990s amid soaring inflation and mammoth rate hikes by the Riksbank to counter it. At its meeting in September, the central bank raised the policy rate by 100 bps to 1.75%. It is expected to deliver another 75 bps move later this week. Sweden’s housing market and indebted households have long been a concern for regulators and the Riksbank. The issue is increasingly acute with declining house prices combined with rising – and often variable – mortgage rates impacting consumer balance sheets and spending. It may prompt the Riksbank to shift to a lower tightening gear after Thursday. EUR/SEK tested the 11 big figure today but is currently trading just south of that level.
Czech National Bank deputy governor Mora said inflation may accelerate slightly again after having printed a sharp decline to 15.1% y/y – thanks to government energy subsidies. He does expect price growth to be near its peak and to slow dramatically next year. Mora added that he wanted to lift rates at the previous meeting by 75 bps to bring inflation back to 2% as quickly as possible, even if it comes with a recession. But he found no majority support. The CNB deputy governor does not expect interest rates will rise at his final two meetings in December and February. EUR/CZK depreciates marginally today from an intraday high around 24.40 to 24.34 currently.