Sample Category Title
ECB’s Lagarde: Rates in “good place”, Europe can capture AI gains through application
Speaking at a conference in Washington, ECB President Christine Lagarde reiterated that Eurozone monetary policy is in a “good place,” repeating guidance that the current rate setting remains appropriate. The remarks signal that the ECB is not actively considering a policy shift, as inflation stabilizes and growth remains resilient.
Lagarde emphasized that the ECB will continue to assess incoming data and remain "agile", but her tone suggested confidence in the existing stance. The message reinforces expectations of stability in near-term meetings, with policy adjustments contingent on material changes in inflation or financial conditions.
Turning to structural growth, Lagarde argued that Europe can still capitalize on artificial intelligence even if it does not dominate the development of cutting-edge models. She noted that history shows economic value often lies in broad application rather than invention alone, particularly in manufacturing and industrial sectors.
Tariff “Plan B”: Why Market Ignores the Looming 150-Day Clock on New Import Taxes, Gold Up 2.4%
- The U.S. Supreme Court struck down the administration's use of the International Emergency Economic Powers Act (IEEPA) to impose sweeping global tariffs.
- President Trump has already signaled a pivot to using Section 122 of the Trade Act of 1974 to propose a new 15% "bridge tax," indicating that the "peak tariff" era may be a temporary ceiling before new volatility returns.
- Why are safe havens rallying in the aftermath of the decision?
On Friday February the US Supreme Court delivered a landmark 6–3 decision in Learning Resources, Inc. v. Trump, striking down the administration’s use of the International Emergency Economic Powers Act (IEEPA) to impose sweeping global tariffs.
The ruling had sparked a notable rally in risk assets including equities and international currencies as market participants priced in a shift from "tariff chaos" toward a more regulated, though still complex, trade environment.
However, once the dust settled market participants were left with more questions than answers. This has led to a rally in safe havens such as Gold to start the week while risk assets experienced a selloff.
The questions for everyone is what are driving these moves?
The factors driving prices and volatility
Reduction of "Policy Shocks"
The primary driver of the risk-on rally last Friday was the removal of the President’s ability to impose sudden, unilateral tariff hikes under the guise of national emergencies. Since early 2025, the market has lived under the constant threat of "Twitter-style" trade policy where rates could jump 10% to 25% overnight.
By ruling that IEEPA does not grant the executive branch the "extraordinary power to raise revenue," the Court has effectively dismantled the administration's primary tool for aggressive trade maneuvers. The ruling "reduces trade policy uncertainty at the margin," allowing businesses to plan capital expenditures without the fear of an immediate supply-chain "shock."
The $175 Billion "Refund Rally"
Perhaps the most tangible catalyst for risk assets is the prospect of massive corporate refunds. Since the IEEPA-based tariffs were implemented in February 2025, the U.S. government has collected an estimated $130 billion to $175 billion in duties.
With the Court declaring these collections illegal, a door has opened for importers to claw back these funds. This potential "fiscal injection" is being viewed by some economists as a late-cycle stimulus. For sectors like retail, automotive, and technology, which absorbed much of the initial cost, the promise of significant cash-back on balance sheets has sent stock prices climbing.
Global Relief and Currency Stabilization
Outside the US, the ruling acted as a pressure-release valve for export-heavy economies. Risk assets in Canada, Mexico, and across Asia surged following the news.
- The "Loonie" and the Peso: The Canadian dollar and Mexican peso strengthened as the "fentanyl/border" tariffs were invalidated.
- European Equities: Indices like the FTSE 100 and the DAX hit near-record highs, led by carmakers and luxury goods manufacturers (e.g., Diageo and BMW) that had been heavily penalized by reciprocal duties.
Lower Inflationary Tailwinds
Risk assets thrive in a low-inflation environment because it allows the Federal Reserve more room to cut interest rates. The invalidation of IEEPA tariffs which accounted for approximately 60% of the total tariff revenue collected over the last year, removes a significant "tax" on consumers.
While the administration has already proposed "Plan B" workarounds using Section 122 of the Trade Act of 1974, these alternative paths are legally more narrow and slower to implement, leading markets to believe the "peak tariff" era has passed.
Looking Ahead: A temporary ceiling?
Just hours after the US Supreme Court blocked the administration’s "Liberation Day" emergency tariffs, President Donald Trump pivoted by announcing a new round of trade restrictions. This time, the administration is invoking Section 122 of the 1974 Trade Act, a provision designed to address "international payment problems" by allowing surcharges of up to 15% for a 150-day window.
While these tariffs technically expire unless Congress intervenes, the President could theoretically bypass this limit by letting the surcharge lapse and immediately declaring a new emergency to restart the clock, creating a perpetual tariff cycle. Though the White House initially signaled a 10% rate effective February 24, Trump quickly increased the figure to 15% the following day. Because these measures rely on a different legal statute, they are currently exempt from the recent Supreme Court ruling.
Despite this tactical shift, the use of Section 122 invites significant legal vulnerability. The provision is a relic of the gold standard and fixed exchange rate era; because it was finalized just as that global financial system collapsed, it has never actually been utilized in practice.
Proving a "balance of payments crisis" in a modern economy where the balance of payments is technically always in balance, presents a difficult hurdle for government lawyers.
Consequently, these new tariffs may serve primarily as a stalling tactic or "smoke and mirrors" while the administration prepares a more robust case under Section 301 of the same law. While Section 301 targets unfair trade practices and agreement violations, it requires a more rigorous and time-consuming investigation before it can be implemented.
Safe haven demand surges
Safe haven demand began surging late on Friday when President Trump announced he may use other means to enact his tariff policy.
This has left market participants in a state of limbo and thus the demand for safe haven assets has surged.
The Supreme Court’s ruling last Friday served as a powerful reminder of the constraints on executive authority, suggesting that the American system of checks and balances remains functional.
Nevertheless, it would be a mistake to assume President Trump will view this legal setback as an opportunity to quietly retreat from his protectionist agenda. Recent announcements following the court's decision underscore his commitment to trade barriers, signaling that he has no intention of abandoning his favorite economic tool.
As a result, market uncertainty has resurfaced, and with European leaders increasingly showing their own willingness to retaliate, the potential for a full-scale trade escalation is significantly higher today than it was a year ago.
Technical Analysis - Gold (XAU/USD)
From a technical standpoint, Gold has continued its surge and breached the $5207 handle.
Gold looks poised to continues its trajectory and make a run for the all-time highs.
This will depend on either a catalyst such as a US-Iran situation.
For now though immediate resistance is at 5250 before the 5300 handle comes into focus.
Looking at pullback and markets may look toward the 5100 handle as a point of support before the 5000/oz psychological level comes into focus.
Gold (XAU/USD) Four-Hour Chart, February 23, 2026
Source:TradingView.Com (click to enlarge)
Precious Metals Breakout: Silver (XAG/USD) and Gold (XAU/USD) Tariffs Outlook
- Silver and Gold dominate commodity flows after the latest tariff turmoil.
- Demarking from their peers in the metals space, the two best performers are breaking out. Will it continue?
- Intraday timeframe analysis for XAG/USD (Silver) and XAU/USD (Gold).
It has been a wild ride for metals in 2026 and bulls are back to prop up the best performers of the asset class to a renewed breakout.
After a three week correction period, Silver and Gold are now attempting to revisit their all-time records.
Recent US tariff chaos has brought renewed uncertainty in global Markets, may it be around trade or even geopolitics, allowing precious metals to attract some interest.
A little reminder of the situation: we’ve entered a chaotic new chapter in the trade wars. After the Supreme Court officially dismantled the IEEPA Liberation Day tariffs last Friday, President Trump immediately pivoted to his plan B.
Within hours, he invoked Section 122 of the Trade Act of 1974—a Nixon-era policy designed to fix balance-of-payments deficits—to slap a 10% (quickly raised to 15%) global surcharge on imports.
This measure is temporary (150 days) leading to immediate uncertainty on future US trade policies, normally expiring on July 23-24.
With $133 billion in illegal duties already collected under the now-defunct IEEPA regime (expiring tomorrow), the government is facing a budgetary nightmare as businesses line up for refunds. This is a huge compromise to the Administration's entire gameplan.
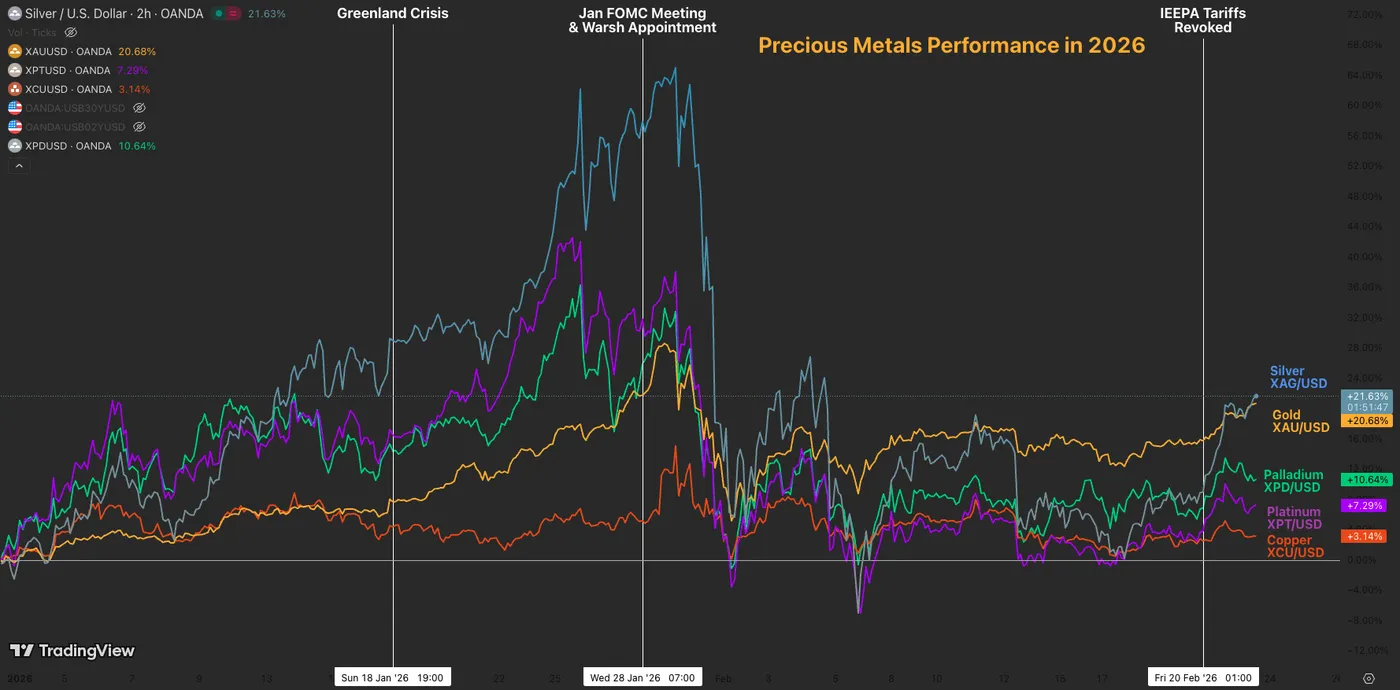
Metals performance in 2026 – Source: TradingView, February 23, 2026.
Gold are actually the dominant performers in the asset class, while Palladium, Platinum, and Copper struggle to gain significant momentum (broadly unchanged on the year).
Both the Yellow and Grey metals are getting propped up from recent tariff developments and Middle East anxiety.
The divergence in today's action shows one thing: the metals run is going to be more bumpy in the coming days.
What was seen as a broad Dollar debasement is now considered a trickier play, with only a few regional products and assets outperforming, while the others remain dormant or even sell off. The same could be said about Equities.
As explored countless times in our previous pieces, we are entering an age in which investors will have to be meticulous about where to place their pawns.
The age of random selection and everything rallying is now well over.
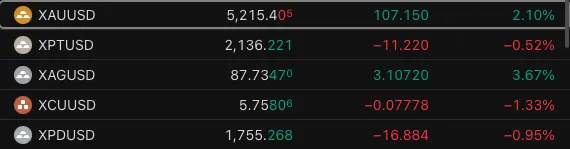
Daily Metal Performance (14:56 ET) – Source: TradingView. XAG = Silver, XAU = Gold, XCU = Copper, XPT = Platinum, XPD = Palladium
In the meantime, we will dive into an intraday timeframe analysis for Gold (XAU/USD) and Silver (XAG/USD) to spot where the ongoing breakout is taking us.
Gold to Silver Overview
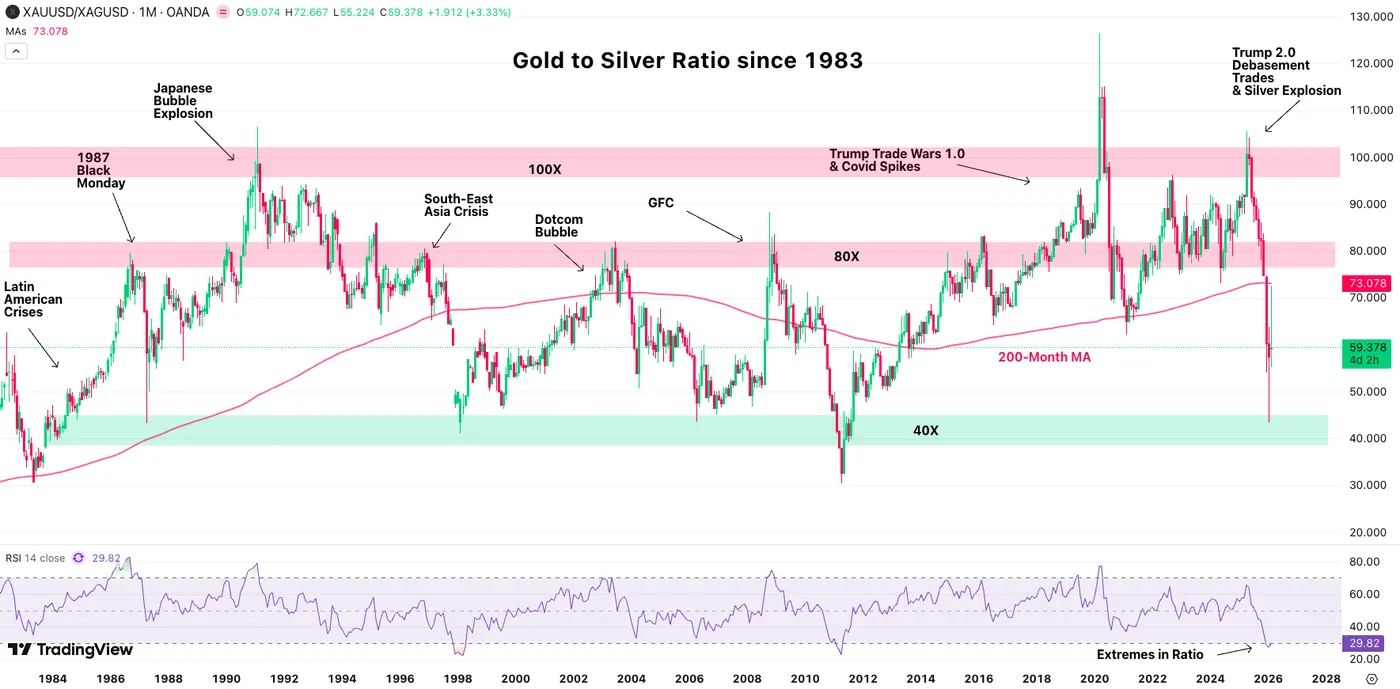
Gold/Silver Ratio Monthly Chart. February 23, 2026 – Source: TradingView
The Gold/Silver Ratio eased significantly from 100X to the current 60X level, right in the middle of the "Buy Gold at 40X, Sell Gold at 80X adage" zone.
Silver seems to be taking the momentum back in today's action but remains in a rough spot: Positioning, albeit less extreme than a month ago, could lead to less potential upside.
Asset Managers are still deemed to be heavily invested in precious metals, so keep a close eye on upcoming times.
Gold (XAU/USD) 4H Chart and levels
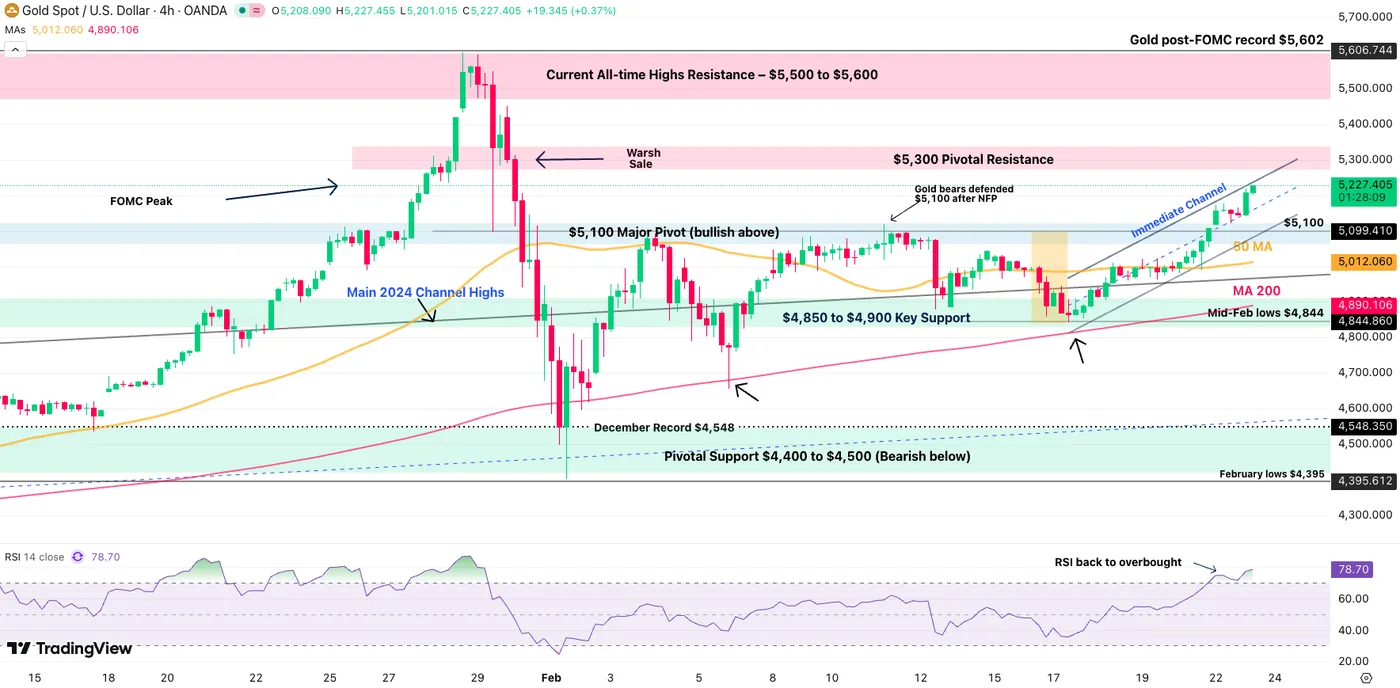
Gold (XAU/USD) 4H Chart, February 23, 2026 – Source: TradingView
Gold is back to a very bullish price action, evolving in a Tight bull channel ever since reaching $4,844 in Mid-February.
Despite the ongoing consequential rally, late buyers will have to be careful as prices reach the channel's upper bound and overbought RSI levels.
A pullback to $5,100 would provide the most interesting entries (given that sellers don't push Gold below). This level acts as a key magnet and Pivot level for price action bull/bear dominance.
If bulls manage to push the metal above $5,300 without a pullback however, a run to the $5,600 should soon follow.
Keep a very close eye on the 4H 200 MA, which acted as major support throughout the entire trend.
Technical Levels to watch for Gold (XAU/USD):
Resistance Levels:
- $5,230 Channel Top (intraday highs)
- $5,300 Pivotal Resistance
- $5,400 mini-resistance
- Current All-time Highs – $5,500 to $5,600
- Key Fibonacci Projection $5,800 to $5,900
Support Levels:
- $5,100 Major Pivot (bullish above)
- Mid-Feb lows $4,844
- Pivotal Support $4,400 to $4,500 – Bearish below
- Main Support $3,880 to $4,050
- $3,200 to $3,500 Major Support
Silver (XAG/USD) Daily Chart and levels
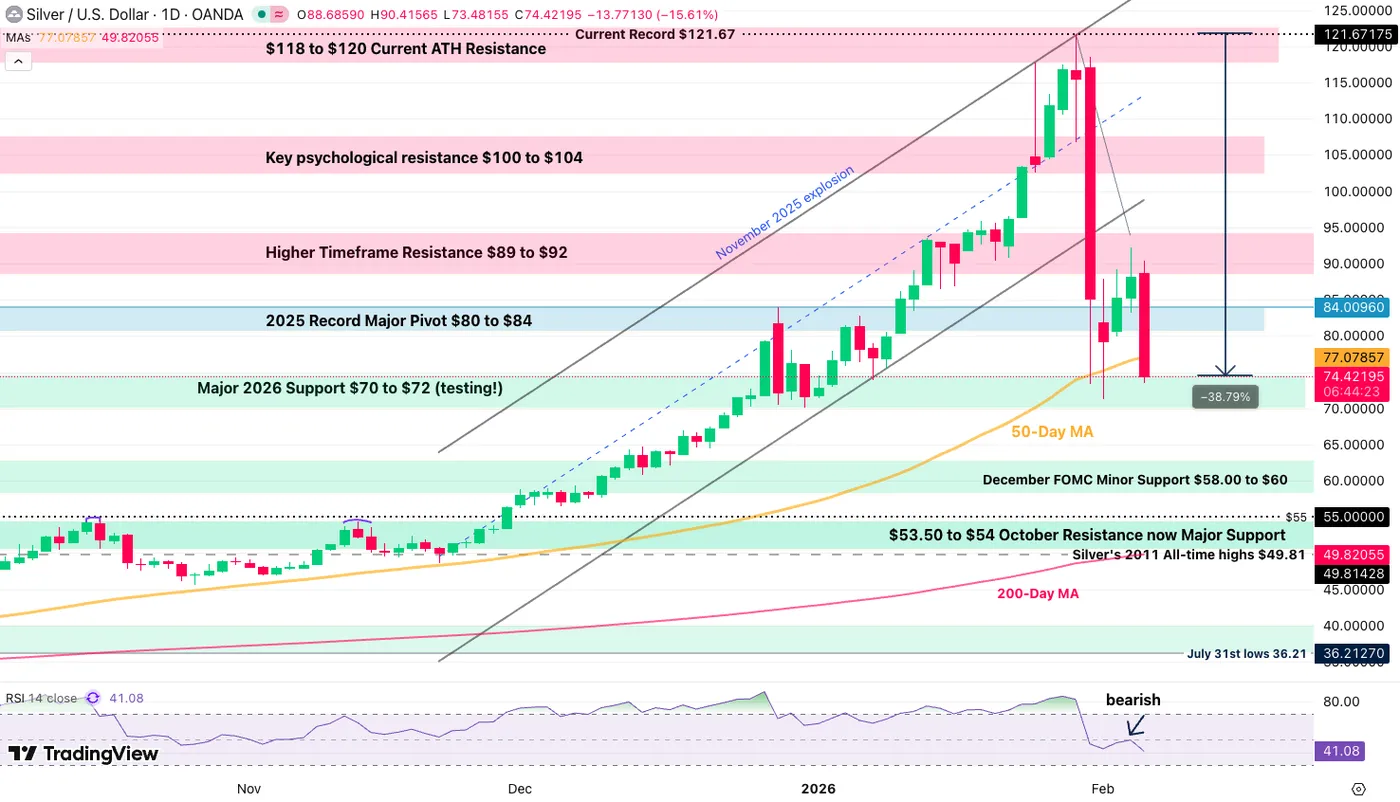
Silver (XAG/USD) 4H Chart, February 23, 2026 – Source: TradingView
Silver is also back to a very impressive bullish momentum, getting close to reaching $90 after breaching its 4H 200-Period MA.
Traders will have to be careful of the $90 to $95 higher timeframe resistance which acted as such in the early February rebound, particularly as overbought RSI conditions are arising.
Rejecting that area could take the action back to $84 which acts as a major pivot and could provide interesting dip-buying levels, similarly as what is seen in Gold.
- Any close above the February highs ($92.20), should lead to a retest of $100.
Technical Levels to watch for Silver (XAG/USD):
Resistance Levels:
- Feb 4 highs $92.20
- Higher Timeframe Resistance $90 to $95
- Key psychological resistance $100 to $104
- Current Record $121.67
Support Levels:
- 2025 Record Pivot $82 to $84
- Key Momentum Support $76 to $77.50
- Major 2026 Support $70 to $72
- February lows $64
- $53.50 to $54 October Resistance now Major Support
Safe Trades!
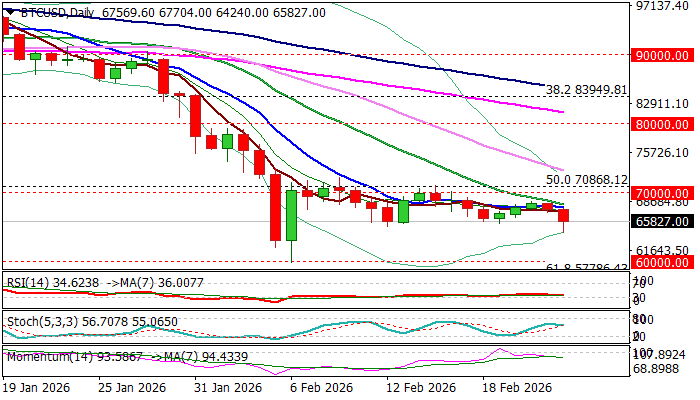
BTCUSD Falls to Three-Week Low on US Tariff Uncertainty
Bitcoin remains in red and holding above new three-week low on Monday, deflated by growing uncertainty over US tariffs.
Fresh extension lower cracked important supports at 65.5/65K zone (higher base) but need to register a clear break lower to validate developing negative signal and open way for retest of key 60K support zone (psychological / Feb 6 spike low, the lowest since Oc1 2024).
Firmly bearish daily technical studies support the notion, with falling 10DMA (67800) to cap upticks and keep intact upper breakpoint at 70K.
Res: 67450; 67800; 68700; 70000
Sup: 65800; 65000; 64120; 62060
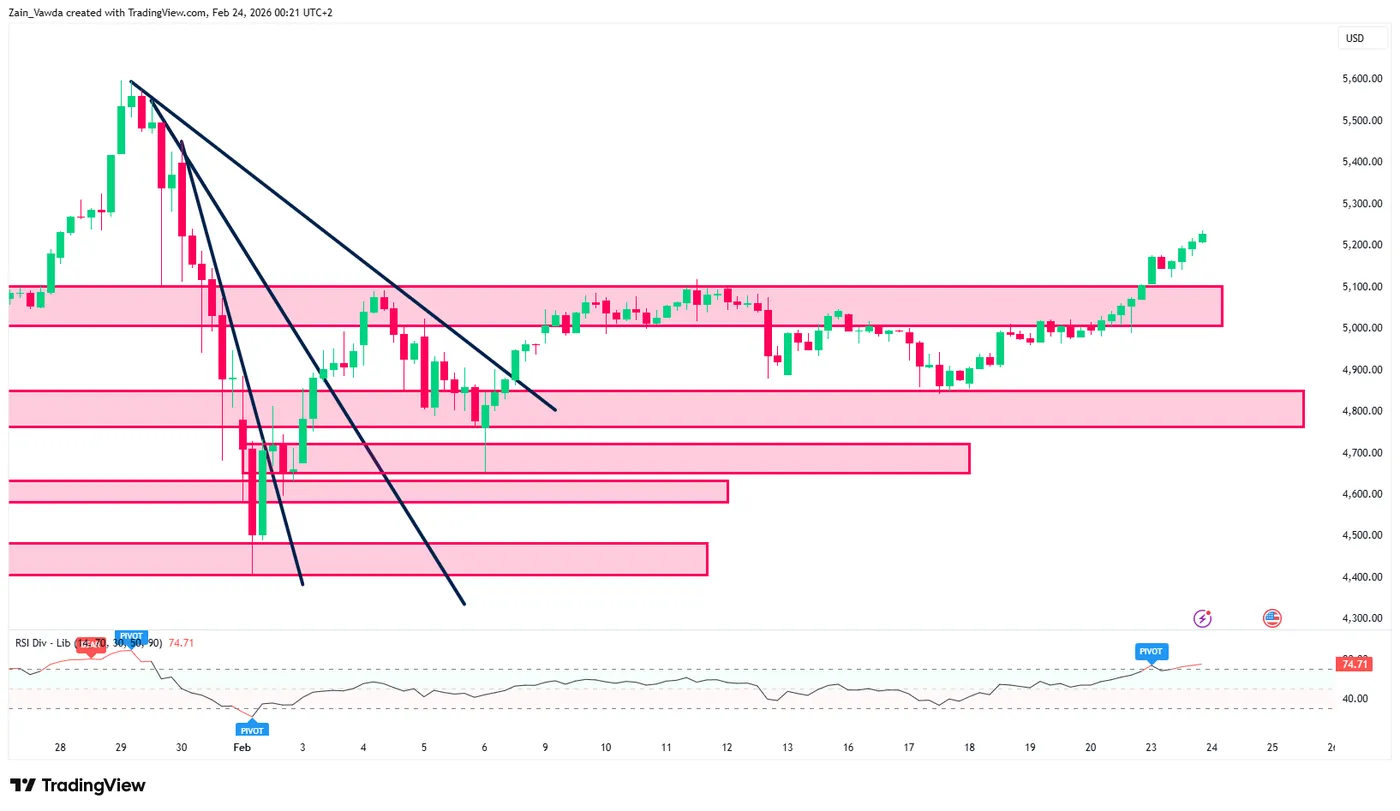
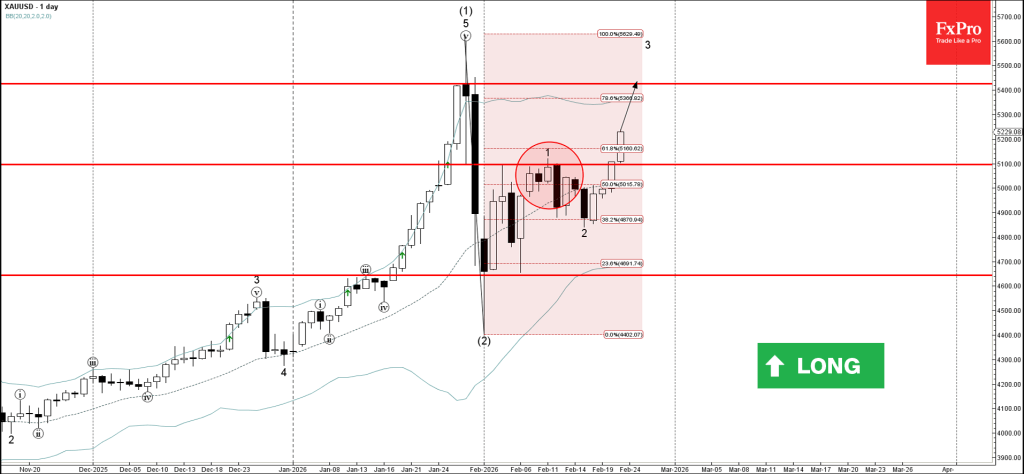
Gold Wave Analysis
Gold: ⬆️ Buy
- Gold broke resistance zone
- Likely to rise to resistance level 5420.00
Gold recently broke the resistance zone between resistance level 5100.00 (which stopped the earlier impulse wave 1) and the 61.8% Fibonacci correction of the downward ABC correction (2) from January.
The breakout of the resistance level 5100.00 accelerated the active short-term impulse wave 3 which belongs to the intermediate impulse wave (3) from January.
Given the strong multi-month uptrend, Gold can be expected to rise to the next resistance level 5420.00 (former key resistance from January).
Eco Data 2/24/26
| GMT | Ccy | Events | Act | Cons | Prev | Rev |
|---|---|---|---|---|---|---|
| 01:00 | CNY | 1-Y Loan Prime Rate | 3.00% | 3.00% | 3.00% | |
| 01:00 | CNY | 5-Y Loan Prime Rate | 3.50% | 3.50% | 3.50% | |
| 14:00 | USD | S&P/CS Composite-20 HPI Y/Y Dec | 1.40% | 1.50% | 1.40% | |
| 14:00 | USD | Housing Price Index M/M Dec | 0.10% | 0.30% | 0.60% | 0.70% |
| 15:00 | USD | Consumer Confidence Feb | 91.2 | 88.2 | 84.5 | 89 |
| 15:00 | USD | Wholesale Inventories Dec F | 0.20% | 0.20% | 0.20% |
| 01:00 | CNY |
| 1-Y Loan Prime Rate | |
| Actual | 3.00% |
| Consensus | 3.00% |
| Previous | 3.00% |
| 01:00 | CNY |
| 5-Y Loan Prime Rate | |
| Actual | 3.50% |
| Consensus | 3.50% |
| Previous | 3.50% |
| 14:00 | USD |
| S&P/CS Composite-20 HPI Y/Y Dec | |
| Actual | 1.40% |
| Consensus | 1.50% |
| Previous | 1.40% |
| 14:00 | USD |
| Housing Price Index M/M Dec | |
| Actual | 0.10% |
| Consensus | 0.30% |
| Previous | 0.60% |
| Revised | 0.70% |
| 15:00 | USD |
| Consumer Confidence Feb | |
| Actual | 91.2 |
| Consensus | 88.2 |
| Previous | 84.5 |
| Revised | 89 |
| 15:00 | USD |
| Wholesale Inventories Dec F | |
| Actual | 0.20% |
| Consensus | 0.20% |
| Previous | 0.20% |
Sunset Market Commentary
Markets
The US Supreme Court (SCOTUS) injected a fresh dose of uncertainty by striking down president Trump’s signature IEEPA tariffs end last week. Trump responded by introducing a flat 15% global rate (using a different legal base) that keeps the average tariff rate +/- the same. This Section 122 (balance of payment emergency) levy comes with a max term of 150 days during which the Trump administration will build country- or product-specific cases to apply tariffs based on for example Section 232 (threat to national security and used as basis for current levies on steel, copper and aluminum) or Section 301 (unfair foreign trade policies, used particularly against China). For some, the situation isn’t dramatically different from before. The euro area for example had struck a 15% tariff deal and the exemptions agreed are still applicable today. The European Parliament nevertheless decided to freeze the approval of the deal given the uncertainty. Others, including the UK (10% in the trade deal) are worse off, while the likes of China, India and Brazil see their rates currently lower. Needless to say the latter will now be dragging their feet in the ongoing negotiations. Trump already threatened countries “that play games” with higher tariffs. Apart from what the SCOTUS decision means for the earlier trade deals, there are open questions in terms of tariff repayment to US importers. This matter needs to be brought to lower courts and could spell the beginning of a long legal battle that probably only big-enough companies are willing to fight. It also brings the outsized US deficits back into the attention. In the Congressional Budget Office’s fiscal update earlier this month, tariffs would recoup some $3tn of the $4.7tn (over the next decade) in Trump’s deficit-widening Big Beautiful Bill.
What it all means going forward is impossible to tell at this stage. So markets kicked off today the way you’d expect them to: with caution. European stocks slipped in the red but then gradually recovered. WS opens with 0.5% losses. Core bonds whipsawed and are currently marginally higher on the day, Treasuries outperforming Bunds. Net daily changes in the US vary between -0.4-2.8 bps. Bund yields are down around 1-1.5 bps. The US dollar initially lost ground through rising risk premia but found a stronger footing in European dealings. EUR/USD is now changing hands in the 1.18 area, virtually unchanged from Friday’s closing level (which factored in some minor USD weakness after the SCOTUS ruling got public). There was some volatility in DXY too before steadying near 97.64. JPY outperforms in the G10 landscape, pushing USD/JPY down to 154.6. Sterling trades resilient near the EUR/GBP’s YtD highs (0.873).
News & Views
Statistics Poland today reported stronger than expected January retail sales. On a seasonally adjusted basis, real sales were up 0.5% M/M and 5.1% compared to January 2025. On a non-seasonally adjust basis, sales decreased by 17.8%. Even so, the agency analyzed that sales were higher in most product groups compared to the same period last year. This especially applies to textiles, clothing, footwear (by 17.6%), furniture, radio, TV and household appliances (by 10.5%), pharmaceuticals, cosmetics (by 9.6%). Sales of food, beverages and tobacco products also rose 4.2% Y/Y. A decrease in sales was noted in the group motor vehicles, motorcycles, parts (by 4.5%). Decent sales data come as the National Bank of Poland (NBP) next week holds a policy meeting. Despite decent domestic demand, markets are positioned for the NBP to deliver a finetuning rate cut, lowering the policy rate by 25 bps to 3.75% as inflation (2.2% Y/Y in January) returned to the 2.5% target. The zloty continues to trade within an extremely tight sideways consolidation pattern against the euro with EUR/PLN hovering near 4.22.
The Business Confidence indicator of the National Bank of Belgium (NBB) dropped sharply in February, dropping from -8.8 in January to -13.7 and more than reversing the January uptick. Confidence fell back to a similarly low level as in May of last year. All sectors worsened, except for the building industry. Trade recorded the largest decline in confidence. While demand expectations and forecasts of orders to suppliers improved significantly last month, they fell by even more this month. In the manufacturing industry, all components of the confidence indicator declined. Along with a significant deterioration in the assessment of total order books, expectations concerning both demand and employment turned much more pessimistic while stock levels were viewed considerably more negatively. Confidence in business-related services dropped for the third consecutive month on more dire views on current and future levels of activity.
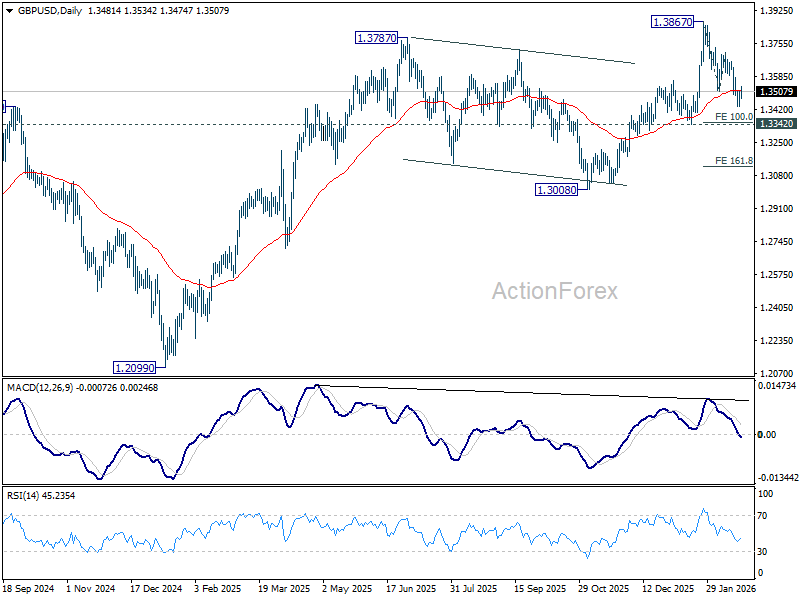
GBP/USD Mid-Day Outlook
Daily Pivots: (S1) 1.3438; (P) 1.3476; (R1) 1.3518; More...
GBP/USD is staying in tight range above 1.3432 temporary low and intraday bias remains neutral. For now, fall from 1.3867 is seen as correcting the whole rise from 1.2099. Risk will stay on the downside as long as 1.3711 resistance holds. Below 1.3432 will target 1.3342 support first. Firm break there will solidify this case, and target 161.8% projection of 1.3867 to 1.3507 from 1.3711 at 1.3129.
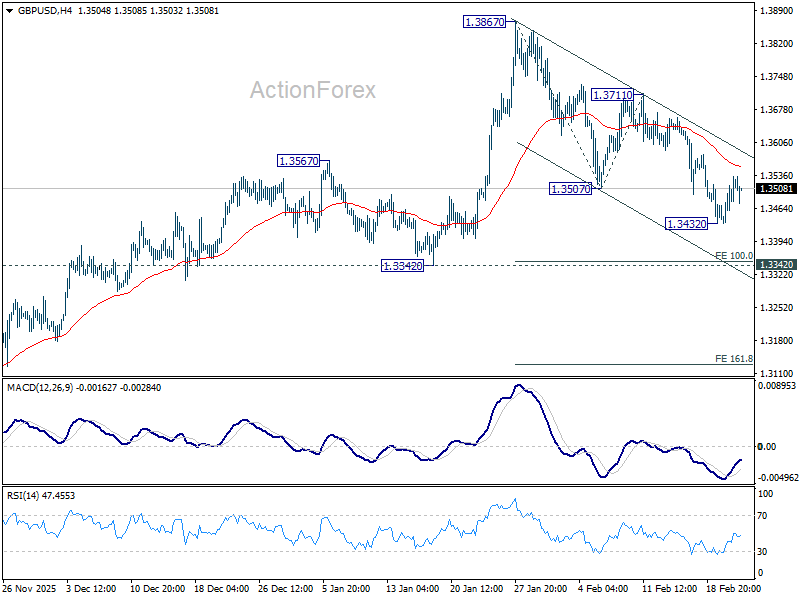
In the bigger picture, as long as 1.3008 support holds, rise from 1.3051 (2022 low) should still be in progress for 1.4284 key resistance (2021 high). Decisive break there will add to the case of long term bullish trend reversal. However, firm break of 1.3008 will raise the chance of medium term bearish reversal and target 1.2099 support next.
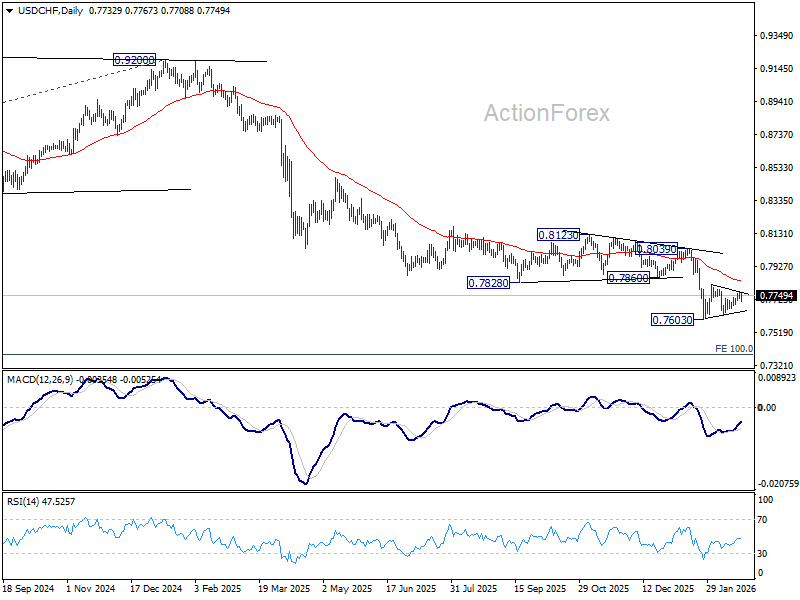
USD/CHF Mid-Day Outlook
Daily Pivots: (S1) 0.7736; (P) 0.7754; (R1) 0.7777; More….
USD/CHF recovered after hitting 55 4H EMA, but stays below 0.7771 temporary top. Intraday bias remains neutral first. Consolidation pattern from 0.7603 could extend further. In case of stronger rise, upside upside should be limited by 55 D EMA (now at 0.7834) to complete the pattern. On the downside, below 0.7627 will bring retest of 0.7603. Firm break there will resume larger down trend, and target 0.7382 projection level next. However, sustained break of 55 D EMA will indicate that a larger scale corrective bounce in underway and target 0.8039 resistance next.
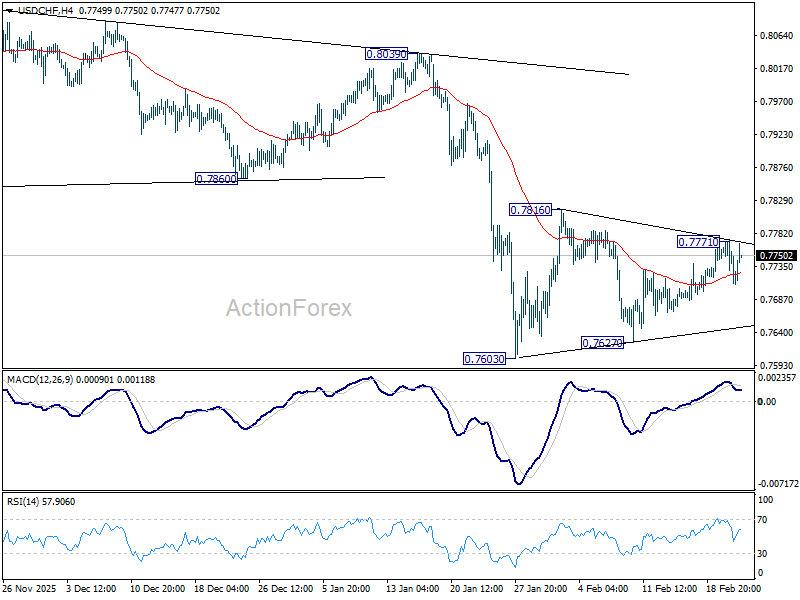
In the bigger picture, down trend from 1.0342 (2017 high) is still in progress. Next target is 100% projection of 1.0146 (2022 high) to 0.8332 from 0.9200 at 0.7382. In any case, outlook will stay bearish as long as 0.8123 resistance holds.
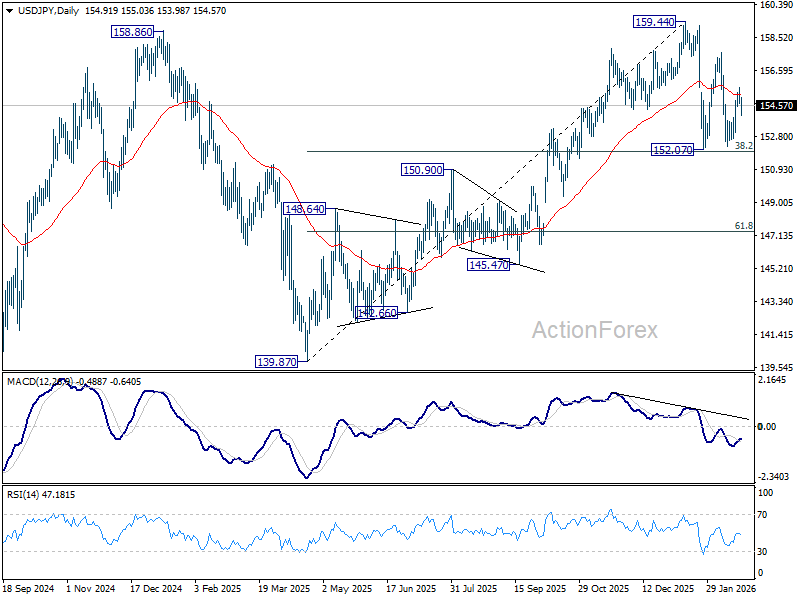
USD/JPY Mid-Day Outlook
Daily Pivots: (S1) 154.65; (P) 155.14; (R1) 155.57; More...
USD/JPY recovered after brief initial dip today, but stays below 155.63 temporary top. Intraday bias stays neutral. On the upside, above 155.63 will resume the rally from 152.25 and target 157.65 first. Overall, with 38.2% retracement of 139.87 to 159.44 at 151.96 intact, price actions from 159.44 are seen as a corrective pattern. Also rise from 139.87 is expected to resume through 159.44 at a later stage.
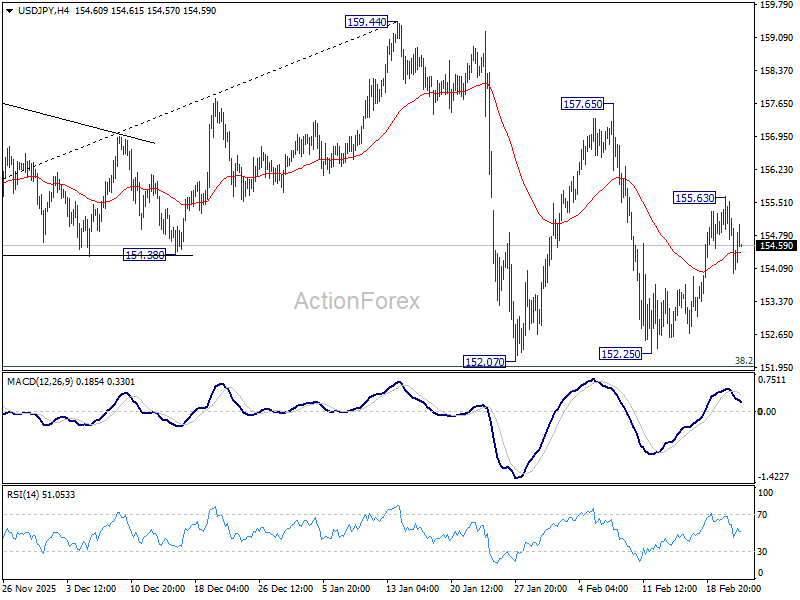
In the bigger picture, outlook is unchanged that corrective pattern from 161.94 (2024 high) should have completed with three waves at 139.87. Larger up trend from 102.58 (2021 low) could be ready to resume through 161.94. This will remain the favored case as long as 55 W EMA (now at 151.93) holds. However, sustained break of 55 W EMA will argue that the pattern from 161.94 is extending with another falling leg.