Sample Category Title
XAU/USD : Break Above Recent Range Top Generates Fresh Bullish Signal
Gold extended rally from $4850 zone higher base into fourth consecutive day and hit the highest since Jan 30 in early trading on Monday.
Fresh wave of safe-haven demand was boosted by the latest decision of the US Supreme Court to rule out all Trump’s tariffs that added pressure on US dollar and deepened uncertainty, also fueled by heated geopolitical situation.
Technical picture has further improved on Friday’s close above $5100 (former range top) and has also registered repeated weekly close above $5000 (psychological/50% retracement of $5598/$4402 correction).
Daily Tenkan and Kijun-sen form a bull-cross that contributes to positive signals, although fading bullish momentum and overbought stochastic warning that bulls may face headwinds.
In current fundamental configuration, bulls should remain in control with consolidation / limited dips to ideally hold above $5100 (reverted to support) to offer better levels to re-enter bullish market for acceleration towards $5200/$5300 and $5363 (upper 20-d Bollinger band) in extension.
Res: 5176; 5200; 5300; 5363.
Sup: 5100; 5080; 5053; 5000.
EUR/USD Mid-Day Outlook
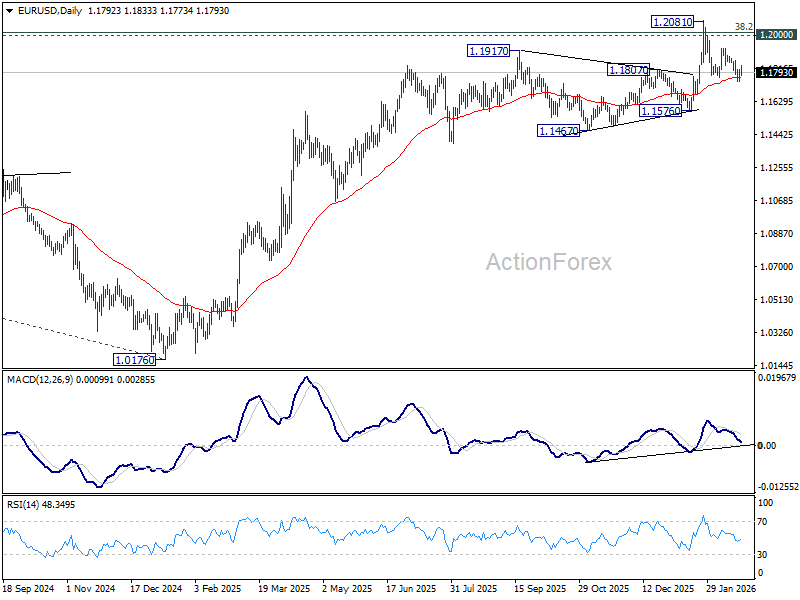
Daily Pivots: (S1) 1.1747; (P) 1.1778; (R1) 1.1811; More….
EUR/USD retreated mildly after hitting 55 4H EMA but stays above 1.1740 temporary low. Intraday bias stays neutral for the moment. Near term risk will remain on the downside as long as 1.1928 resistance holds. Below 1.1740 will target 1.1576 support next. Firm break there should confirm rejection by 1.2 key psychological level and turn near term outlook bearish.
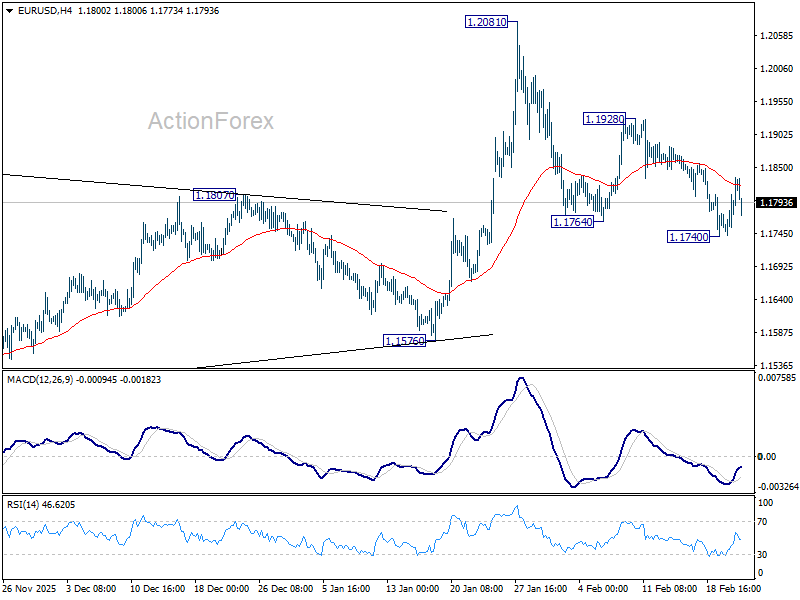
In the bigger picture, as long as 55 W EMA (now at 1.1494) holds, up trend from 0.9534 (2022 low) is still in favor to continue. Decisive break of 1.2 key psychological level will add to the case of long term bullish trend reversal. Next medium term target will be 138.2% projection of 0.9534 to 1.1274 from 1.0176 at 1.2581. However, sustained trading below 55 W EMA will argue that rise from 0.9534 has completed as a three wave corrective bounce, and keep long term outlook bearish.
Waller’s Shift Helps Dollar Recover from Early Losses
Dollar stabilized and recovered notably in early US trading after an initial selloff, supported by remarks from Fed Governor Christopher Waller. Waller, widely regarded as one of the more dovish voices on the Federal Reserve Board, signaled that the case for holding rates in March has strengthened following robust January employment data.
Waller was one of the two dovish dissenters at the January FOMC meeting. His openness to a March hold marks a shift in tone and suggests that the balance within the FOMC may be adjusting after the stronger-than-expected non-farm payroll report. The data appeared to reduce concerns over labor market deterioration, reshaping the near-term policy debate.
Admittedly, a March hold has long been the market’s base case, with probabilities already near fully priced. Waller’s comments did not dramatically alter immediate expectations. However, the symbolic importance of a prominent dove aligning with the hold narrative carries weight for forward guidance.
Indeed, markets have nudged up the probability of a June hold to around 50%, reflecting the view that easing may be delayed if labor conditions remain firm. Waller’s shift reinforces the perception that rate cuts are not imminent and that policy may remain restrictive longer than previously anticipated.
Meanwhile, global markets continue to weather US tariff uncertainty with relative composure. Major European indices are largely treading water, with only modest losses in Germany’s DAX. US equity futures are softer but far from disorderly.
In a social media post Monday, US President Donald Trump renewed criticism of the Supreme Court following its ruling against his tariff program. He vowed to pursue alternative trade authorities but offered no specifics. For now, markets appear to be waiting for clarity rather than reacting aggressively.
Currency performance reflects selective positioning rather than panic. Yen leads gains, followed by Sterling and Euro, while Dollar and Swiss Franc sit mid-pack. Australian Dollar is the weakest performer, trailed by Kiwi and Loonie, though moves remain measured.
In Europe, at the time of writing, FTSE is up 0.09%. DAX is down -0.54%. CAC is down -0.02%. UK 10-year yield is down -0.015 at 4.341. Germany 10-year yield is down -0.005 at 2.736. Earlier in Asia, Japan and China were on holidays. Hong Kong HSI rose 2.53%. Singapore Strait Times rose 0.47%.
Fed’s Waller: Strong payrolls could tilt his stance towards March hold
Fed Governor Christopher Waller said in a speech that recent economic data, particularly January’s employment report, came in “substantially stronger” than expected, suggesting labor market risks may have "diminished". He noted that the initial estimate showed the US economy created more jobs in January than in the previous nine months combined, a development that surprised both policymakers and market participants.
Despite the upbeat signal, Waller cautioned that one strong month does not establish a trend. He emphasized that the Fed will receive additional employment and inflation data before the March 17–18 FOMC meeting, along with updates on job openings and retail sales. Only if February data confirm continued labor market strength alongside progress toward the 2% inflation target would his outlook turn “a bit more positive.”
In that scenario, Waller said his policy preference could “tilt toward a pause” at the upcoming meeting. However, he stressed the need for confirmation before adjusting his stance.
Addressing the recent Supreme Court ruling on tariffs, Waller downplayed its policy implications. He reiterated that tariffs tend to have only temporary effects on inflation and said he focuses on underlying price trends. Following traditional central bank practice, he intends to “look through” tariff-driven price moves, suggesting the ruling is unlikely to significantly alter his view on the appropriate stance of monetary policy.
BoE's Taylor signals 2–3 cuts may be needed to reach neutral
Alan Taylor reinforced his dovish stance in remarks at a Deutsche Bank event in London today, arguing that inflation risks are shifting away from stickiness and toward undershooting the 2% target. He suggested weakening demand and softening labor market now pose greater downside risks to price pressures than previously feared.
While acknowledging that services CPI remains “slightly concerning” at around 4.4%, Taylor described the persistence as a temporary lag rather than a structural issue. He said the broader disinflation trend remains intact, even if services inflation has not cooled as quickly as hoped.
Pointing to what he called a “pessimistic outlook” for the UK job market, Taylor argued that policy remains too restrictive and justified a faster pace of easing. He sees scope for two to three additional rate cuts before the Bank Rate approaches a theoretical neutral level.
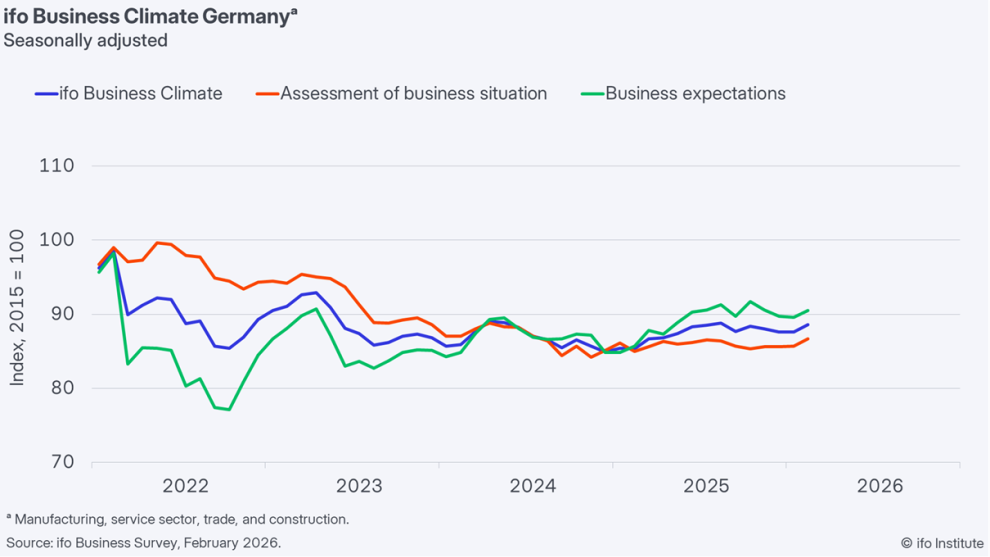
Germany Ifo improves to 88.6 in February, recovery signals emerge
Germany’s business sentiment improved in February, with the Ifo Institute Business Climate Index rising from 87.6 to 88.6, slightly above expectations of 88.4. Current Assessment Index climbed notably from 85.6 to 87.6, beating forecasts of 86.1. Expectations Index edged up from 89.6 to 90.5, in line with consensus.
Sector breakdown shows broad-based improvement. Manufacturing sentiment rose from -12.3 to -11.3, while services moved back into positive territory at 0.1 from -2.6. Construction also improved, narrowing losses from -14.3 to -11.5. Trade as the weakest component, slipping further to -21.8 from -21.1.
The institute noted companies were more satisfied with current conditions and increasingly optimistic about the outlook, describing the data as “first signs of recovery.” While levels remain subdued by historical standards, February’s improvement reinforces the view that Germany may be emerging from stagnation, offering cautious support to broader Eurozone growth expectations.
EUR/USD Mid-Day Outlook
Daily Pivots: (S1) 1.1747; (P) 1.1778; (R1) 1.1811; More….
EUR/USD retreated mildly after hitting 55 4H EMA but stays above 1.1740 temporary low. Intraday bias stays neutral for the moment. Near term risk will remain on the downside as long as 1.1928 resistance holds. Below 1.1740 will target 1.1576 support next. Firm break there should confirm rejection by 1.2 key psychological level and turn near term outlook bearish.
In the bigger picture, as long as 55 W EMA (now at 1.1494) holds, up trend from 0.9534 (2022 low) is still in favor to continue. Decisive break of 1.2 key psychological level will add to the case of long term bullish trend reversal. Next medium term target will be 138.2% projection of 0.9534 to 1.1274 from 1.0176 at 1.2581. However, sustained trading below 55 W EMA will argue that rise from 0.9534 has completed as a three wave corrective bounce, and keep long term outlook bearish.
Fed’s Waller: Strong payrolls could tilt his stance towards March hold
Fed Governor Christopher Waller said in a speech that recent economic data, particularly January’s employment report, came in “substantially stronger” than expected, suggesting labor market risks may have "diminished". He noted that the initial estimate showed the US economy created more jobs in January than in the previous nine months combined, a development that surprised both policymakers and market participants.
Despite the upbeat signal, Waller cautioned that one strong month does not establish a trend. He emphasized that the Fed will receive additional employment and inflation data before the March 17–18 FOMC meeting, along with updates on job openings and retail sales. Only if February data confirm continued labor market strength alongside progress toward the 2% inflation target would his outlook turn “a bit more positive.”
In that scenario, Waller said his policy preference could “tilt toward a pause” at the upcoming meeting. However, he stressed the need for confirmation before adjusting his stance.
Addressing the recent Supreme Court ruling on tariffs, Waller downplayed its policy implications. He reiterated that tariffs tend to have only temporary effects on inflation and said he focuses on underlying price trends. Following traditional central bank practice, he intends to “look through” tariff-driven price moves, suggesting the ruling is unlikely to significantly alter his view on the appropriate stance of monetary policy.
BoE’s Taylor signals 2–3 cuts may be needed to reach neutral
Alan Taylor reinforced his dovish stance in remarks at a Deutsche Bank event in London today, arguing that inflation risks are shifting away from stickiness and toward undershooting the 2% target. He suggested weakening demand and softening labor market now pose greater downside risks to price pressures than previously feared.
While acknowledging that services CPI remains “slightly concerning” at around 4.4%, Taylor described the persistence as a temporary lag rather than a structural issue. He said the broader disinflation trend remains intact, even if services inflation has not cooled as quickly as hoped.
Pointing to what he called a “pessimistic outlook” for the UK job market, Taylor argued that policy remains too restrictive and justified a faster pace of easing. He sees scope for two to three additional rate cuts before the Bank Rate approaches a theoretical neutral level.
Gold Price Rises to Highest Level Since Early February
As shown on the XAU/USD chart today, gold climbed above $5,170, reaching its highest level so far this month. The main bullish factors are:
- → US tariff uncertainty – after the Supreme Court struck down Trump’s tariffs on Friday, the US president reinstated them, initially at 10% and then announcing an increase to 15% on Saturday.
- → Heightened geopolitical tensions – media reports indicate that the US is prepared not only for targeted strikes against Iran but also for a longer military operation. The presence of two aircraft carrier groups in the region raises the risk of direct confrontation, traditionally boosting gold demand.
- → End of the Chinese holiday season – the People’s Bank of China, pursuing a reserve diversification strategy away from the US dollar, may continue purchasing physical gold.
Technical Analysis of XAU/USD
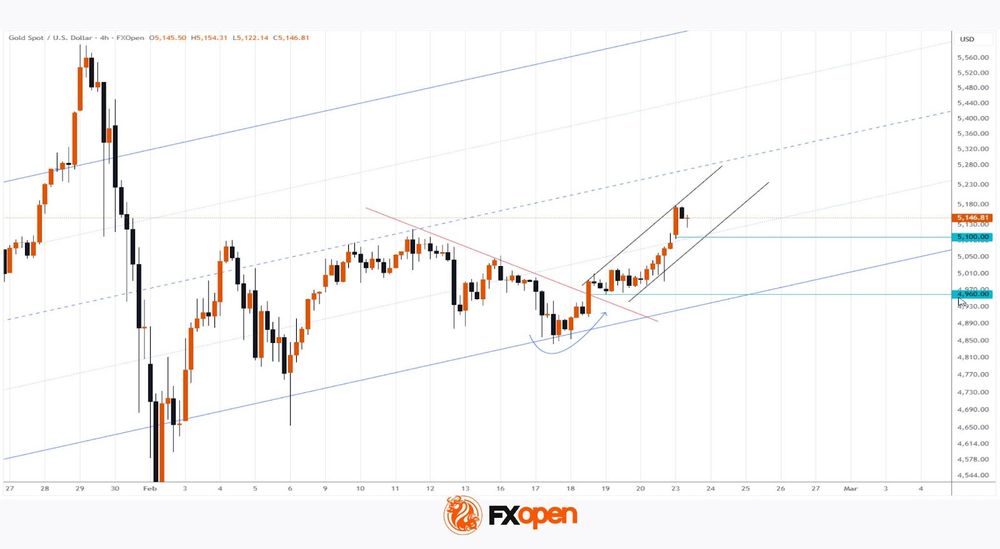
On 17 February, analysis of gold price movements confirmed the long-term ascending channel and highlighted:
- → Bearish activity visible through the descending resistance line (R);
- → Bulls could rely on the channel’s lower boundary as support.
Indeed (as the arrow shows), the market remained within the channel. Moreover, bulls broke above the resistance line (R), which then acted as support around $4,960.
This formed an upward trajectory (black lines). Bullish behaviour is notable around $5,100, where price:
- → Gapped higher at the open;
- → Rose above the line dividing the lower half of the channel into two quarters.
Considering the chart, it is reasonable to suggest bulls currently hold the initiative, supported by fundamentals. They may aim for the channel’s median, with $5,100 providing support in case of a pullback.
Start trading commodity CFDs with tight spreads (additional fees may apply). Open your trading account now or learn more about trading commodity CFDs with FXOpen.
This article represents the opinion of the Companies operating under the FXOpen brand only. It is not to be construed as an offer, solicitation, or recommendation with respect to products and services provided by the Companies operating under the FXOpen brand, nor is it to be considered financial advice.
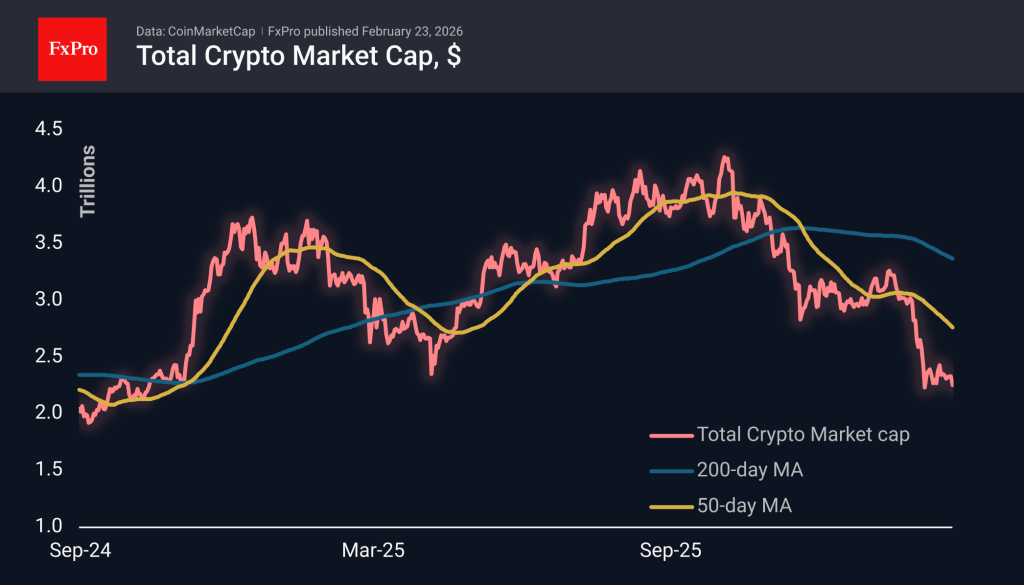
Crypto Bears Have Confirmed Their Control
Market Overview
The crypto market cap has lost about 3.5% over the past 24 hours to $2.25 trillion. At its lowest point at the start of the day, the price fell to $2.22 trillion, which is not far from the lows of February 5–6. It seems that bears have gathered enough strength to try to complete the consolidation of the last couple of weeks during the hours of lowest liquidity. Among the top coins, Solana and Bitcoin Cash are taking the biggest hit, losing over 7%, while Tron is doing better than most, losing only 0.3%.
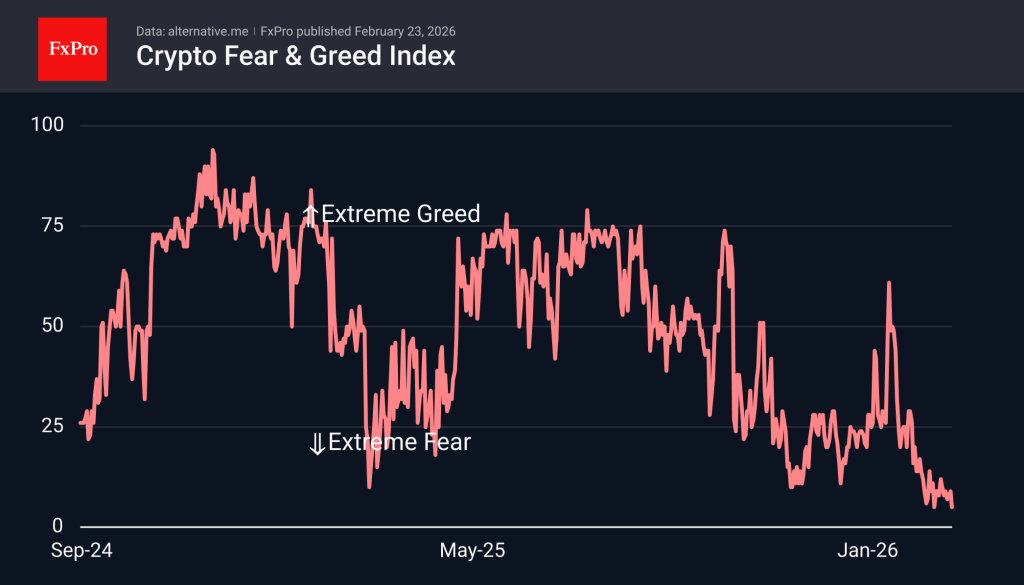
The sentiment index fell to 5, repeating the lows of February 12 and dropping this low for only the third time in history. According to the indicator, such a decline is a good point for long-term purchases. However, the last time there was a relatively long dip into single digits was in June 2022, and steady growth only began at the start of 2023. So, the lows of the sentiment index do not necessarily coincide with the lows of the crypto market prices.
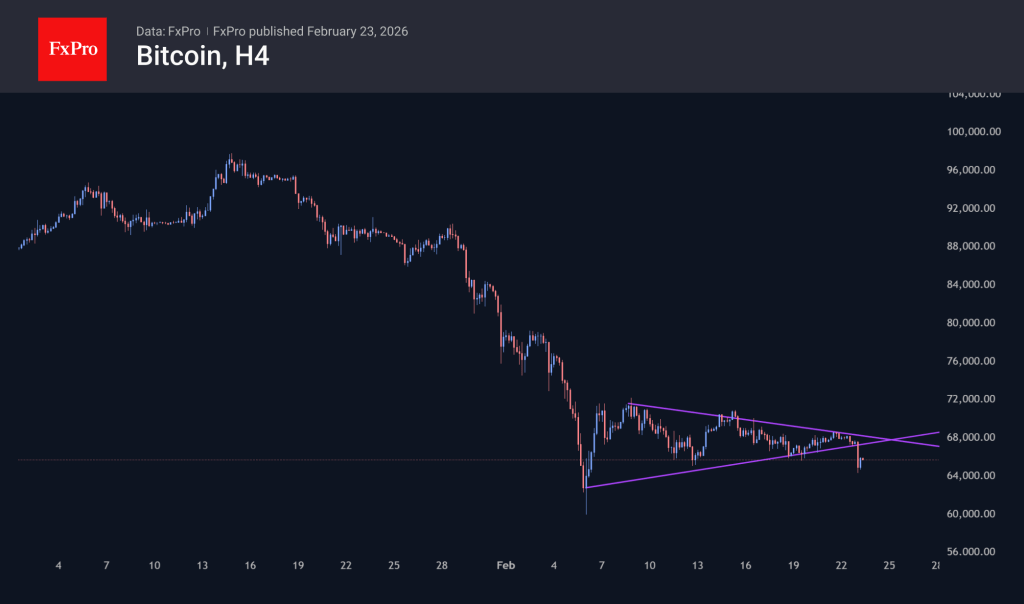
Bitcoin fell to $64.2K at the start of the day on Monday, recovering to around $66K by the start of active trading in Europe. Despite an attempt at recovery in the last few hours, the bears on the chart showed who is in control, leaving the downward resistance in place and pushing BTC below the support level. Without a dramatic change in sentiment, the market may fall to $60K as early as this week.
News Background
The total capitalisation of cryptocurrencies has fallen by $730 billion in 100 days. CryptoQuant calls this an “unprecedented rate of capital outflow,” which is accelerating the contraction of the crypto market.
Retail traders are actively buying BTC at every dip, while institutional investors have sold a “huge amount” of the asset over the past five weeks, Santiment notes.
The situation is exacerbated by a negative trend in Bitcoin’s on-chain metrics — on-chain transaction volumes, the number of new addresses, and network growth rates are steadily declining.
In the coming weeks, BTC could break through the $60,000 mark and fall to support levels around $50,000–55,000. By the end of the year, Bitcoin could fall even lower, warns crypto industry veteran and Ballet CEO Bobby Lee.
Mining company Bitdeer sold its entire stock of bitcoins to support its operations — about 943 BTC. Miners’ revenues have been steadily declining since October 2025.
BNP Paribas has chosen Ethereum for a pilot project to explore the possibilities of tokenising money market funds.
Germany Ifo improves to 88.6 in February, recovery signals emerge
Germany’s business sentiment improved in February, with the Ifo Institute Business Climate Index rising from 87.6 to 88.6, slightly above expectations of 88.4. Current Assessment Index climbed notably from 85.6 to 87.6, beating forecasts of 86.1. Expectations Index edged up from 89.6 to 90.5, in line with consensus.
Sector breakdown shows broad-based improvement. Manufacturing sentiment rose from -12.3 to -11.3, while services moved back into positive territory at 0.1 from -2.6. Construction also improved, narrowing losses from -14.3 to -11.5. Trade as the weakest component, slipping further to -21.8 from -21.1.
The institute noted companies were more satisfied with current conditions and increasingly optimistic about the outlook, describing the data as “first signs of recovery.” While levels remain subdued by historical standards, February’s improvement reinforces the view that Germany may be emerging from stagnation, offering cautious support to broader Eurozone growth expectations.
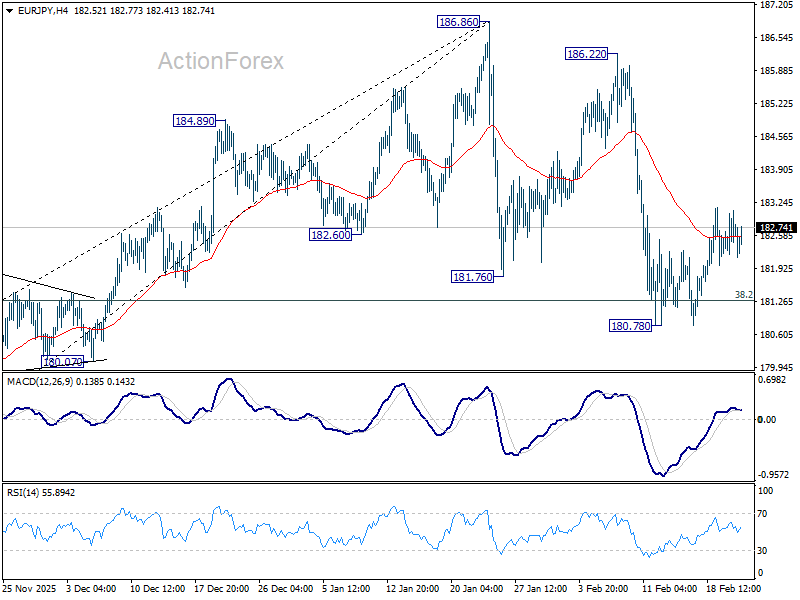
EUR/JPY Daily Outlook
Daily Pivots: (S1) 182.27; (P) 182.68; (R1) 183.14; More...
Intraday bias in EUR/JPY stays mildly on the upside this point. Fall from 186.86 might have completed after hitting 38.2% retracement of 172.24 to 186.86 at 181.27. Stronger rebound would be seen back to retest 186.22/86 resistance zone. However, sustained break of 181.27 will argue that fall from 186.86 is correcting whole up trend from 154.77, and bring deeper decline.
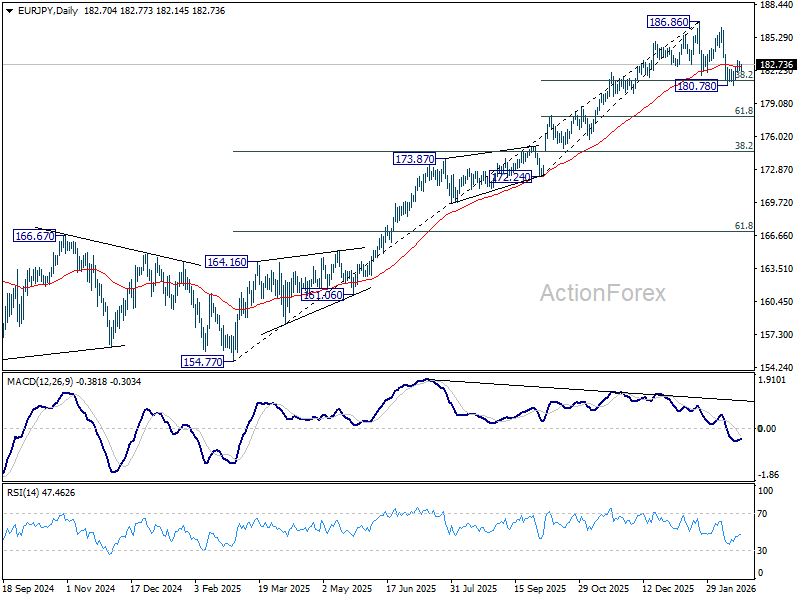
In the bigger picture, considering bearish divergence condition in D MACD and break of 55 D EMA, a medium term top could be formed at 186.86 already. Deeper correction would be seen but downside should be contained by 38.2% retracement of 154.77 to 186.86 at 174.60 to bring rebound. Meanwhile, firm break of 186.86 will resume larger up trend to 78.6% projection of 124.37 to 175.41 from 154.77 at 194.88 next.
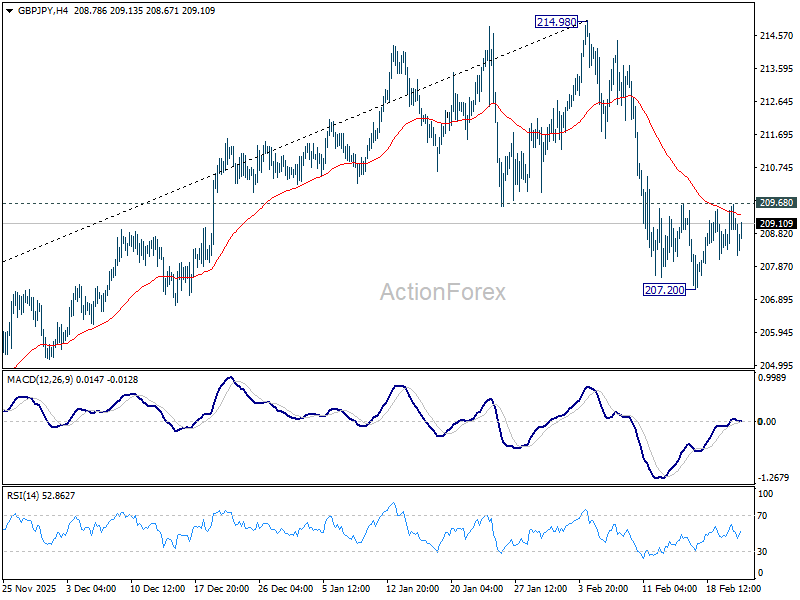
GBP/JPY Daily Outlook
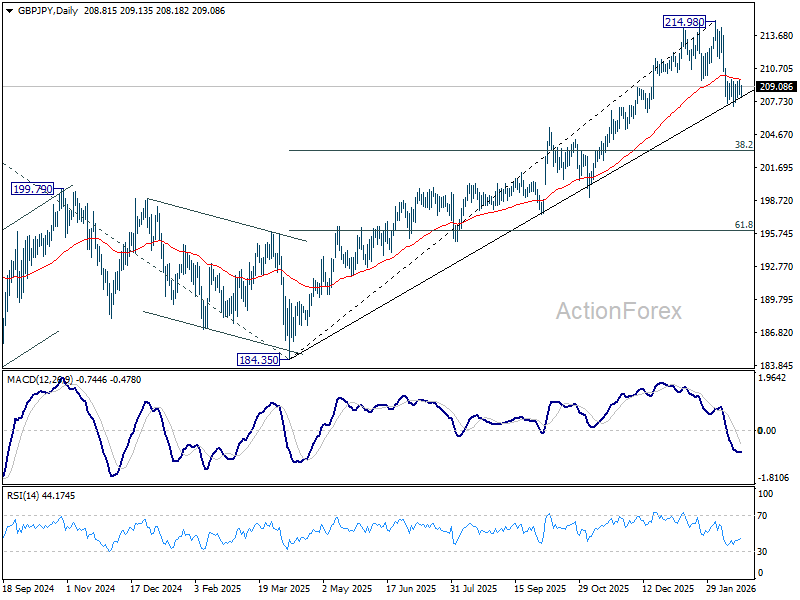
Daily Pivots: (S1) 208.39; (P) 209.03; (R1) 209.68; More...
Intraday bias in GBP/JPY remains neutral as range trading continues. On the downside, break of 207.20 will extend the corrective fall from 214.98 to 38.2% retracement of 184.35 to 214.98 at 203.27. Nevertheless, firm break of 209.68 will turn bias back to the upside for stronger rebound first.
In the bigger picture, considering the break of 55 D EMA (now at 209.68), a medium term top could be formed at 214.98. Deeper correction would be seen, but downside should be contained by 38.2% retracement of 184.35 to 214.98 at 203.27. On the upside, break of 214.98 will resume larger up trend from from 123.94 (2020 low), and target 61.8% projection of 148.93 (2022 low) to 208.09 (2024 high) from 184.35 at 220.90.