Sample Category Title
First Impressions: NZ Retail Trade – Discretionary Spending Continuing to Climb
NZ retail spending surprised to the upside again in Q4, with gains in discretionary spending underpinning a 0.9%qtr rise. We expect lower interest rates will support further gains over 2026.
December quarter retail sales
- Retail sales (volume of goods sold): +0.9% (Prev: +1.9%)
- Westpac f/c: +0.6%, Market: +0.6%
- Core retail sales (volume of goods sold): +1.5% (Prev: +1.2%)
- Nominal retail sales: +1.4% (Prev: +1.8%)
Year to December
- Volume of goods sold: 4.4%
- Nominal sales: 4.9%
Discretionary spending on the rise.
The December quarter saw another solid increase in retail sales.
Nominal spending rose by 1.4% over the quarter and is up 4.9% on the same time a year ago.
Importantly, that increase isn’t just a result of price increases. The amount of goods that consumers are actually taking home was up 0.9% in December quarter and is up 4.4% over the past year. That was above our and market forecasts for a 0.6% rise.
This is the fifth quarter in a row that we’ve seen a solid rise in retail spending. That corresponds to the period over which the RBNZ was cutting the OCR. And looking under the surface, the increase in spending has been centred on discretionary spending areas, which tend to be more sensitive to interest rates. For instance, spending on electronics, furniture and hardware were all up 2% over the past quarter. We also saw gains in spending on recreational items (+5%) and clothing (+3%).
On top of increased spending on goods, spending on hospitality and dining out has also been climbing (though some of that will reflect increased spending by tourists).
The only areas where we saw spending fall in the December quarter were vehicle sales (through that followed a large increase in the previous quarter) and grocery spending. In the case of groceries, some of that decline may reflect a shift to dining out.
Outlook
Looking ahead, the RBNZ has signalled that the easing cycle has come to an end. However, many households are still rolling off earlier higher fixed mortgage rates and are refixing and lower at ones, in some cases, at rates that are 100 to 200bps lower. That process will continue for several months yet. And the related easing in average borrowing costs will help to support spending through 2026.
While the pickup in spending is an encouraging sign for retailers, in some cases consumers are actually purchasing items from low-cost online / offshore retailers. As a result, many domestic retailers are still facing tough trading conditions. This is a particular issue in sectors like apparel.
Implications for GDP growth
We’re forecasting GDP growth of 0.6% in the December quarter. Today’s result was ahead of our expectations, though much of that will relate to imported goods. We’ll take a closer look at how our forecast for GDP growth is shaping up over the next couple of weeks as additional data on December quarter activity is released.
Markets Weekly Outlook – The Gavel Falls on Global Tariffs as Inflationary Fears Return to the Fold
Week in review - Tariffs and inflation
- The US Supreme Court struck down the administration's broad global tariffs under an emergency act (IEEPA). However, the administration is pivoting to alternative legal tools.
- US financial markets reacted positively to the tariff ruling but had to contend with a disappointing 1.4% GDP report and higher-than-expected inflation data (PCE price index up 0.4% MoM).
- A 5% weekly gain in oil prices, combined with persistent inflation data, has brought inflationary pressures back to the fore.
- The market's attention shifts to high-stakes corporate earnings especially Nvidia, as the bellwether for the AI boom and crucial economic data, including the Australian Monthly CPI and US Consumer Confidence.
When looking back at the week that was, there is no place better to start than the Supreme Court ruling in the United States.
In a significant legal blow to the administration, the US Supreme Court ruled on February 20, 2026, that President Trump exceeded his constitutional authority by using the International Emergency Economic Powers Act (IEEPA) to bypass Congress and impose broad global tariffs.
While the 6–3 decision effectively strikes down the legal justification for many of the administration's "Liberation Day" and fentanyl-related levies, it does not mean the end of trade restrictions.
The ruling specifically targets the use of emergency statutes for taxation, yet leaves intact several other tariffs such as those on steel, aluminum, and certain auto parts that are grounded in different legal frameworks like Section 232 or Section 301.
Consequently, while the court has dismantled the specific "emergency" scaffolding the President relied upon, the administration has already signaled it will pivot to alternative statutory tools to keep its wider trade agenda standing.
What is the way forward?
The Supreme Court’s decision focused strictly on the boundaries of executive power rather than the merits of trade protectionism, meaning the administration's broader tariff objectives remain very much alive. While the previous legal justifications have been stripped away, they are being rapidly replaced by new statutory foundations, ushering in a volatile transition period for the global economy.
Businesses now face a period of deep instability as they navigate the unlikely prospect of receiving full refunds for past duties and the high probability of "replacement tariffs" that will restore costs to their previous levels.
Ultimately, while the specific legal "scaffolding" has been dismantled, the administration is already rebuilding its trade barriers; regardless of the court's stance on the Constitution, the era of high tariffs appears far from over.
Source: ING, Macrobond
How did markets react?
US financial markets reacted positively to the Supreme Court's decision on Friday with all three major indexes climbing immediately following the ruling and securing a winning week overall.
While investors were encouraged by the legal blow to the administration’s trade barriers, they also had to weigh a disappointing GDP report showing growth slowing to 1.4% alongside higher-than-expected inflation data.
Treasury yields moved upward as the loss of tariff revenue sparked concerns over a widening fiscal deficit and increased bond supply.
Internationally, the optimism was even more pronounced; Europe’s STOXX 600 index surged to a new all-time high, and gold prices continued their ascent as a weakening dollar and persistent geopolitical uncertainty fueled demand for safe-haven assets.
The continued rise in Gold prices is a nod to the uncertainty which Friday's decision brings despite the optimism. In short, the decision in some ways brings more questions than answers.
Inflation back to the fore
The US PCE price index rose 0.4% month-over-month in December 2025, following a 0.2% increase in November, the most since February and above market expectations of 0.3%.
This coupled with a 5% weekly gain for Oil prices has reignited fears of inflationary pressures returning which would complicate matters for the global economy.
In December 2025, the European Central Bank projected that a 14% spike in oil prices would potentially add 0.5 percentage points to eurozone inflation over the long term, while shaving a modest 0.1 percentage points off annual growth.
This outlook is particularly sensitive to Europe’s heavy reliance on imported energy, which often causes the Euro to weaken against the Dollar as fuel costs rise. Since those projections were made, oil prices have already climbed by that exact 14% margin, bringing the ECB’s cautionary scenario into reality.
Meanwhile, across the Atlantic, the Federal Reserve expressed concern in its January 2026 meeting minutes about the persistent risk of inflation remaining above target, even suggesting that future interest rate hikes could be necessary.
Despite these hawkish signals from central bankers, investors appear relatively unfazed, continuing to price in two rate cuts for the year, a sentiment supported by the fact that domestic gasoline prices remain near multi-year lows, providing a crucial psychological buffer for the markets.
If oil prices do continue to rise and the geopolitical situation in the Middle East continues to escalate, there may be real risks to the inflationary outlook moving forward.
The Week Ahead
The week ahead sees the focus shift from macroeconomic policy debates to high-stakes corporate earnings and inflation data.
The AI Litmus Test: Nvidia and Software Earnings
The primary catalyst for Wall Street will be Nvidia’s quarterly report. As the bellwether for the artificial intelligence boom, Nvidia’s results and guidance will determine if the massive valuations in the semiconductor sector remain justified.
Beyond hardware, the spotlight moves to the "software layer" of AI. Results from Salesforce, Snowflake, Intuit, Zoom, and Zscaler will be scrutinized to see if enterprise spending on AI software is finally translating into significant revenue growth. These reports follow a period of market stagnation caused by hawkish Fed signals and rising geopolitical tensions.
Central Banks and the "balancing act" Dilemma
Central banks face a difficult balancing act, often described as a choice between fighting persistent inflation and supporting slowing growth.
United States: On Wednesday, the CB Consumer Confidence index will be a vital indicator of whether high interest rates and inflation are finally breaking the American consumer’s resilience.
Australia: Wednesday also brings the Monthly CPI indicator. If inflation remains above the RBA’s target band, markets may price in a higher probability of a March rate hike.
Japan: The market will watch a speech by BoJ’s Takada on Thursday for hints regarding the timing of further policy normalization, alongside Friday's Industrial Production and Retail Sales data.
Energy and Geopolitics
Rising oil prices (with Brent Crude seeing recent volatility) remain a wildcard. Tensions between the US and Iran have added a risk premium to energy markets, complicating the inflation outlook for central banks. Investors will monitor whether energy costs continue to climb, potentially forcing a "higher for longer" interest rate environment.
Summary of Key Dates:
- Feb 24 (Tue): US Factory Orders.
- Feb 25 (Wed): Nvidia Earnings; AU Monthly CPI; US Consumer Confidence.
- Feb 26 (Thu): Salesforce & Snowflake Earnings; BoJ Takada Speech.
- Feb 27 (Fri): Japan Industrial Production; US Jobless Claims.
Market Sentiment: Expect a "show me the money" attitude from investors. If AI leaders fail to beat high expectations or if inflation prints hot in Australia and Europe, the current market divergence where the ASX 200 has outperformed lagging US indices, could widen.
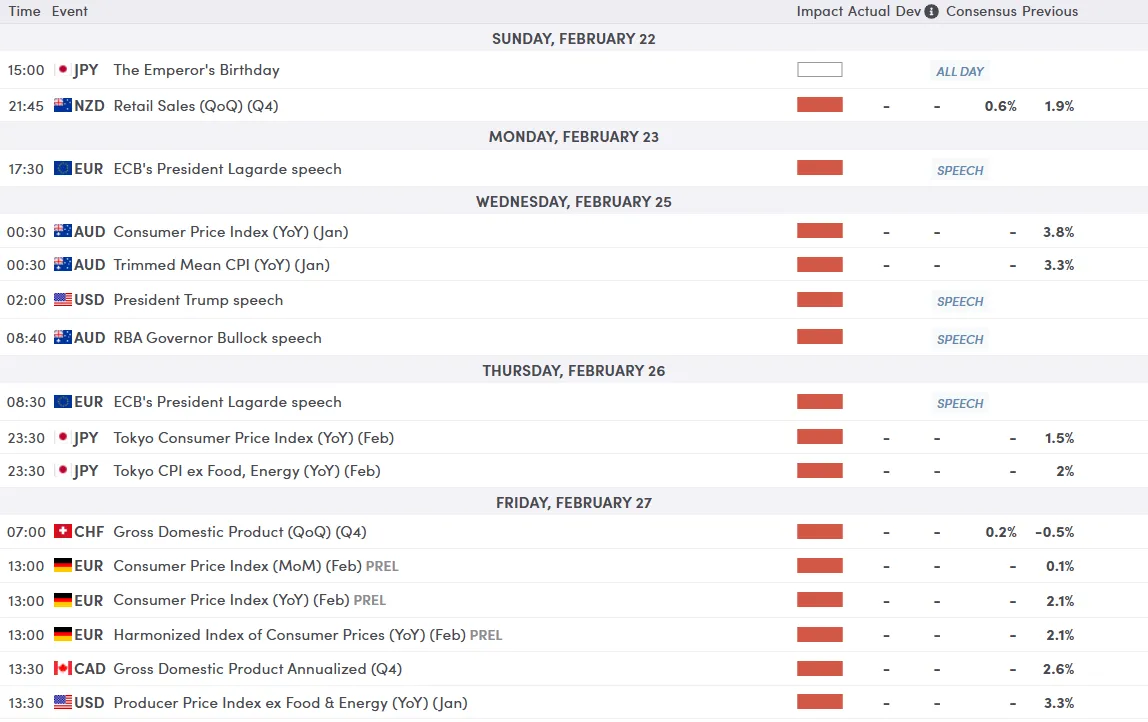
For all market-moving economic releases and events, see the MarketPulse Economic Calendar. (click to enlarge)
Chart of the Week - US Dollar Index (DXY)
From a technical perspective, the US dollar index (DXY) has had an impressive week and rally which finally ran out of steam around the 98.00 handle.
Without a daily candle close above the 98.00 handle, the overall bearish trend remains intact despite the strong rally.
If the DXY is able to break higher there is a confluence level just above which houses the 100 and 200-day MA and rests around the 98.50 handle.
It will be an intriguing week for the US dollar as markets fully digest the Supreme Court tariff decision and the Trump administrations response.
US Dollar Index (DXY) Daily Chart, February 20, 2026

Source:TradingView.Com (click to enlarge)
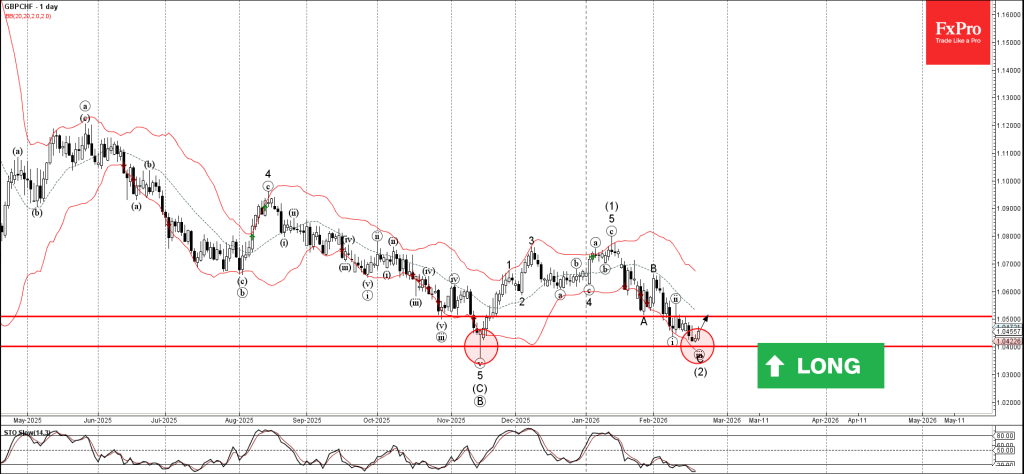
GBPCHF Wave Analysis
GBPCHF: ⬆️ Buy
- GBPCHF reversed from support zone
- Likely to rise to resistance level 1.0500
GBPCHF recently reversed up from the support zone between strong support level 1.0400 (which stopped the daily downtrend with the daily Hammer in November) and the lower daily Bollinger Band.
The upward reversal from the support level 1.0400 stopped the c-wave of the earlier medium-term ABC correction (2) from January.
Given the strength of support level 1.0400 and the oversold daily Stochastic, GBPCHF can be expected to rise to the next resistance level 1.0500 (former support from the end of January).
Eco Data 2/23/26
| GMT | Ccy | Events | Act | Cons | Prev | Rev |
|---|---|---|---|---|---|---|
| 21:45 | NZD | Retail Sales Q/Q Q4 | 0.90% | 0.60% | 1.90% | |
| 21:45 | NZD | Retail Sales ex Autos Q/Q Q4 | 1.50% | 0.40% | 1.20% | |
| 07:30 | CHF | PPI M/M Jan | -0.20% | 0.10% | -0.20% | |
| 07:30 | CHF | PPI Y/Y Jan | -2.20% | -1.80% | ||
| 09:00 | EUR | Germany IFO Business Climate Feb | 88.6 | 88.4 | 87.6 | |
| 09:00 | EUR | Germany IFO Current Assessment Feb | 86.7 | 86.1 | 85.7 | |
| 09:00 | EUR | Germany IFO Expectations Feb | 90.5 | 90.5 | 89.5 | 89.6 |
| 15:00 | USD | Factory Orders M/M Dec | -0.70% | 1.10% | 2.70% |
| 21:45 | NZD |
| Retail Sales Q/Q Q4 | |
| Actual | 0.90% |
| Consensus | 0.60% |
| Previous | 1.90% |
| 21:45 | NZD |
| Retail Sales ex Autos Q/Q Q4 | |
| Actual | 1.50% |
| Consensus | 0.40% |
| Previous | 1.20% |
| 07:30 | CHF |
| PPI M/M Jan | |
| Actual | -0.20% |
| Consensus | 0.10% |
| Previous | -0.20% |
| 07:30 | CHF |
| PPI Y/Y Jan | |
| Actual | -2.20% |
| Consensus | |
| Previous | -1.80% |
| 09:00 | EUR |
| Germany IFO Business Climate Feb | |
| Actual | 88.6 |
| Consensus | 88.4 |
| Previous | 87.6 |
| 09:00 | EUR |
| Germany IFO Current Assessment Feb | |
| Actual | 86.7 |
| Consensus | 86.1 |
| Previous | 85.7 |
| 09:00 | EUR |
| Germany IFO Expectations Feb | |
| Actual | 90.5 |
| Consensus | 90.5 |
| Previous | 89.5 |
| Revised | 89.6 |
| 15:00 | USD |
| Factory Orders M/M Dec | |
| Actual | -0.70% |
| Consensus | 1.10% |
| Previous | 2.70% |
Tariffs, Fed and Iran: Three Tests, One Resilient Market
Global markets were forced to face three major developments last week, each capable on its own of destabilizing sentiment. Instead of buckling under the weight of legal, monetary, and geopolitical shocks, investors responded with surprising composure.
At the end of the week came a landmark legal decision in the US that struck at the core of the administration’s trade strategy. What initially appeared to be a dramatic policy reversal quickly morphed into something more nuanced. The headline shock faded almost as quickly as it arrived.
Before that, the Fed delivered minutes that were more hawkish than anticipated. Hopes for a smooth glide path toward rate cuts were tempered, and the policy debate subtly widened. Yet even that failed to meaningfully dent risk appetite.
Meanwhile, tensions between the U.S. and Iran escalated to levels not seen in years. The rhetoric sharpened, timelines narrowed, and analysts began openly discussing conflict probabilities. Oil and precious metals responded swiftly.
But broader markets? They hesitated rather than panicked. Equity indexes held firm, Treasury yields stabilized, and high-beta currencies remained resilient. If there was fear, it was selective.
The clearest signal came from foreign exchange. Rather than fleeing risk, investors rotated into it. The week’s top performer was not a defensive cross but one typically associated with global growth. That alone speaks volumes about the market’s underlying confidence.
A Legal Setback, Not a Policy Reversal: Tariffs Reconfigured
The long-awaited U.S. Supreme Court ruling on President Donald Trump’s sweeping tariff policy finally arrived late on Friday, delivering what appeared at first glance to be a decisive blow. In a 6–3 decision, the Court ruled that the International Emergency Economic Powers Act (IEEPA) does not grant the president authority to impose broad, country-wide tariffs without congressional approval. The so-called “Liberation Day” tariffs, which had ranged from 10% to 50% on nearly all trading partners, were effectively invalidated.
From a constitutional standpoint, the decision was significant. It reaffirmed limits on executive authority and potentially opened the door for importers to seek refunds on an estimated USD 160–200 billion in duties collected since 2025. In legal terms, it was a landmark moment.
In market terms, however, it barely registered.
Within hours of the ruling, the administration pivoted. A temporary 10% global tariff was imposed under Section 122 of the Trade Act of 1974, a statute designed to address balance-of-payments concerns. While capped at 150 days without congressional approval, it effectively replaced much of the invalidated structure in the short run.
Simultaneously, new Section 301 and Section 232 investigations were launched, laying the groundwork for more durable, sector-specific measures. Steel, aluminum, automotive, and lumber tariffs remain intact under national security provisions. The trade war did not end—it simply changed its legal scaffolding.
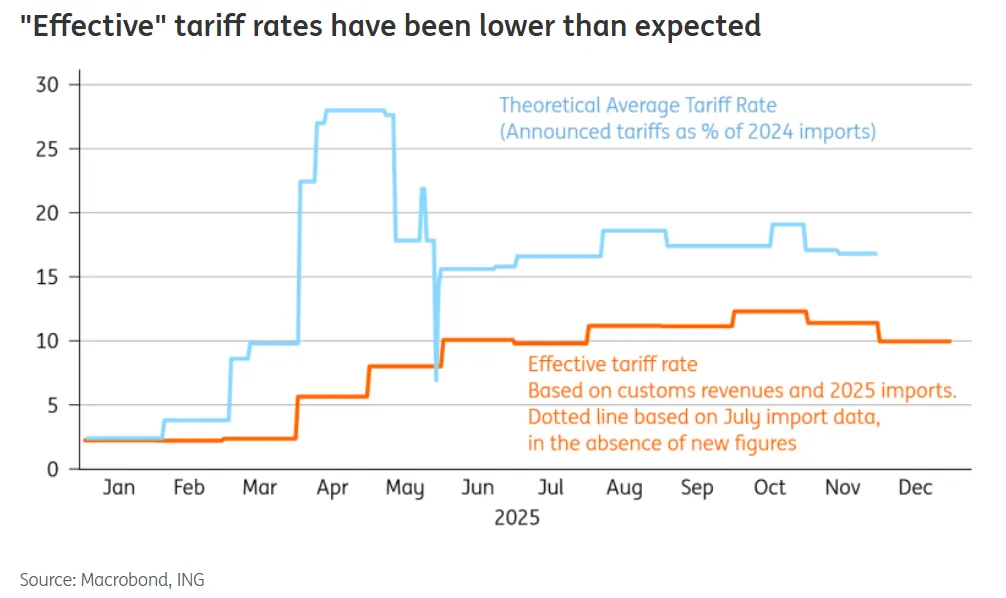
The practical implication is that the average U.S. tariff rate may fluctuate, potentially moving from roughly 15% back toward 8–10%. But the broader message is unchanged: tariffs are not disappearing. They are becoming more targeted, more complex, and more embedded.
Investors appear to have concluded that trade friction is now a structural feature of the global economy. Whether imposed under emergency powers or through traditional trade statutes, the direction of policy remains restrictive.
In that sense, the Supreme Court ruling was less a turning point than a transition—from sweeping, across-the-board tariffs to a more intricate, sector-by-sector trade confrontation. Markets, having already priced in persistent trade tension, treated it largely as a wash.
Hawkish Pause: The Fed Reopens the Door to Two-Sided Risk
If markets were expecting reassurance from the Federal Reserve last week, they did not get it. The minutes from the January 27–28 FOMC meeting revealed a tone that was distinctly more hawkish than anticipated, challenging the narrative of an orderly glide path toward rate cuts.
Investors had largely framed the current stance as a “dovish pause” — a temporary hold before easing resumes. Instead, the minutes suggested something closer to a “hawkish pause.” Policymakers emphasized that inflation risks remain alive, and several participants argued that the Committee should adopt explicitly “two-sided” language in its guidance.
That shift matters. Two-sided language implies that rate hikes are not entirely off the table. While no immediate tightening is imminent, the mere reintroduction of that possibility underscores how conditional the easing cycle has become.
Crucially, the “vast majority” of officials judged that downside risks to employment have moderated. With the labor market seen as stabilizing rather than deteriorating, the Fed appears to feel it has room to wait. Patience, not urgency, now defines the policy stance.
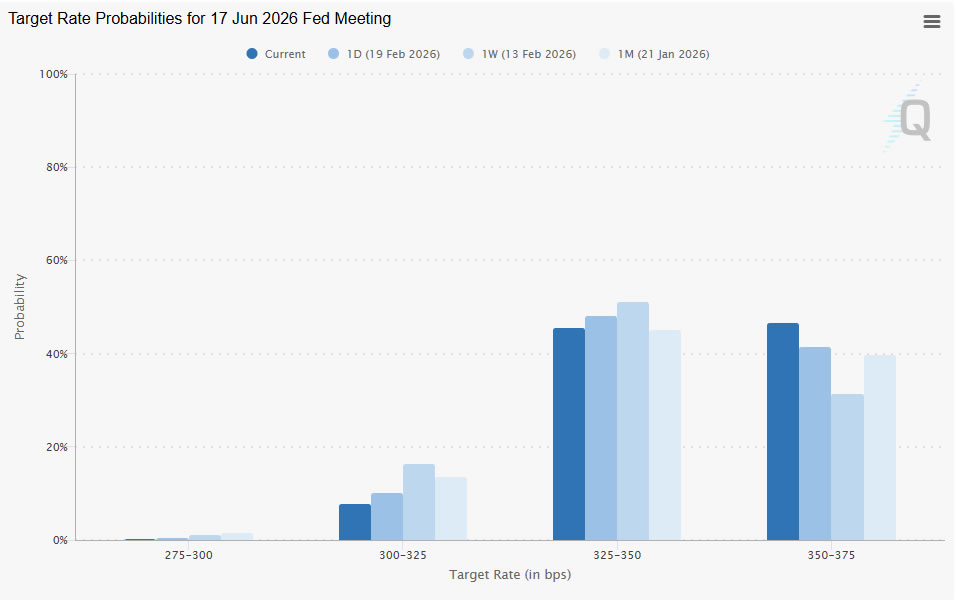
Market pricing adjusted, but only modestly. Odds of a March cut fell further, while expectations for June softened at the margin from 69% to 54%. Yet there was no wholesale repricing of the rate path.
War Premium Returns: Markets Weigh a Narrowing Diplomatic Window
Geopolitical risk re-entered the spotlight last week as tensions between the US and Iran escalated sharply. Rhetoric hardened, diplomatic timelines narrowed, and the market began to price in a non-trivial probability of conflict.
President Trump’s explicit “10-day” decision window transformed a slow-moving standoff into a defined countdown. That framing alone was enough to reintroduce a measurable war premium into oil and precious metals, even if broader markets remained composed.
The core difficulty lies in the widening gap between the two sides’ red lines. Washington is reportedly pushing for a sweeping framework that would effectively dismantle Iran’s nuclear and missile capabilities. Tehran, by contrast, views those programs as existential safeguards against regime change.
The situation is increasingly a collision course. Regional experts and intelligence briefings suggest that the perceived probability of military confrontation has risen to levels not seen in decades, with some framing the odds as close to even.
Yet markets are drawing a distinction between elevated risk and imminent action. While crude prices surged and gold caught a bid, equity indices and high-beta currencies showed limited signs of stress.
For now, investors appear to be adopting a wait-and-see posture. The war premium has returned — but it remains contained to assets most directly exposed to energy supply disruption and geopolitical tail risk.
Equities Hold the Line, Yields Stabilize
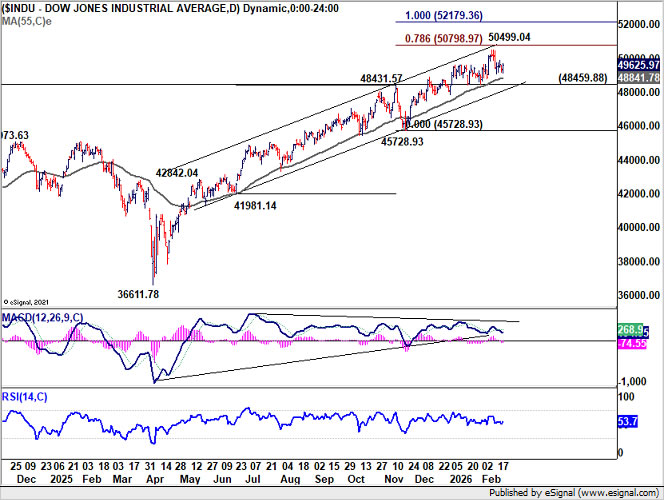
Despite the convergence of trade uncertainty, hawkish Fed signals, and rising geopolitical tension, US equity markets showed remarkable stability. On the surface, at least, risk appetite appears intact, with major indexes consolidating just below record highs rather than retreating.
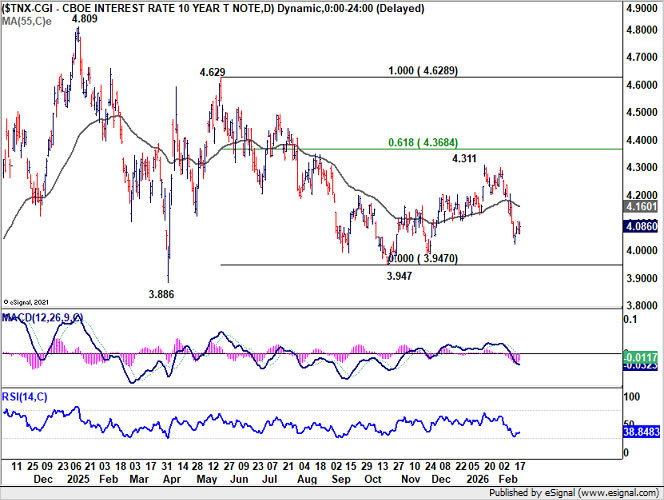
Technically, DOW continued to trade in tight range beneath 50,499.04 peak. The broader technical outlook remains bullish, with scope for another leg higher toward 78.6% projection of 41,981.14 to 48,431.57 from 45,728.93 at 50,798.97. Firm break there would confirm renewed upside momentum and open the door toward 100% projection at 52,179.36.
Yet beneath the surface, caution is quietly building. Daily momentum indicators are flashing bearish divergence, suggesting upside conviction may be fading. Decisive break below 48,349.88 support would argue that a medium-term top is already in place, potentially marking the start of a broader correction to the whole up trend from 36,611.78 (2025 low).
10-year yield recovered after dipping to 4.025, but quickly recovered. While further fall is expected as long as 55 D EMA (now at 4.160) holds, strong support could emerge between 3.947 (October low) and 4.000 psychological level to floor downside.
Dollar Index Gains Tactical Support, But Easing Cycle Still Ahead
Dollar drew modest support last week as markets recalibrated expectations following the more hawkish FOMC minutes. Reduced odds of near-term easing gave the greenback a tactical boost, particularly against lower-yielding currencies. However, the move lacked strong follow-through.
Expectations remain that the policy stance will gradually turn less restrictive, particularly once Kevin Warsh formally assumes the Fed chairmanship. Under that leadership, rate cuts are still anticipated, though probably delivered later and at a less aggressive pace than previously priced.
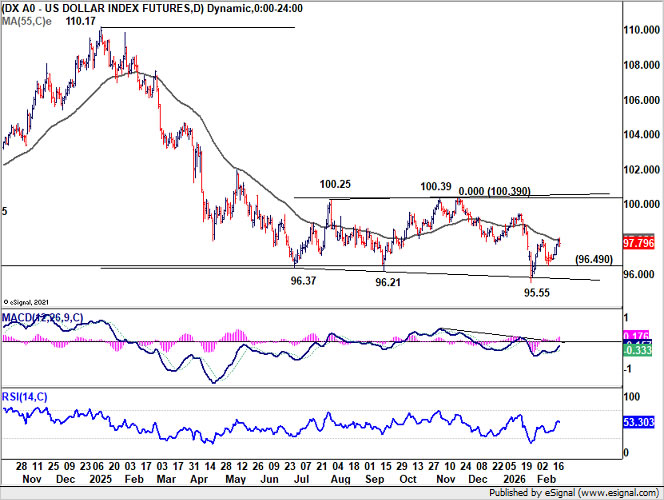
Dollar Index resumed its rebound from the 95.55 short-term low and briefly pushed above its 55 D EMA (now at 97.59). That technical break suggests short-term momentum has improved, but it does not yet alter the bigger picture.
The broader structure still points to a corrective recovery rather than the start of a fresh bull cycle. Price action from 96.37 can be interpreted either as a completed three-wave pattern at 100.39 or as part of a larger expanding triangle. In both cases, upside should be capped below 100.39 resistance. Meanwhile, below 96.49 support will bring retest of 95.55 low. Firm break there will resume the medium term down trend.
AUD/JPY Signals Calm: Risk Appetite Overrides Macro Noise
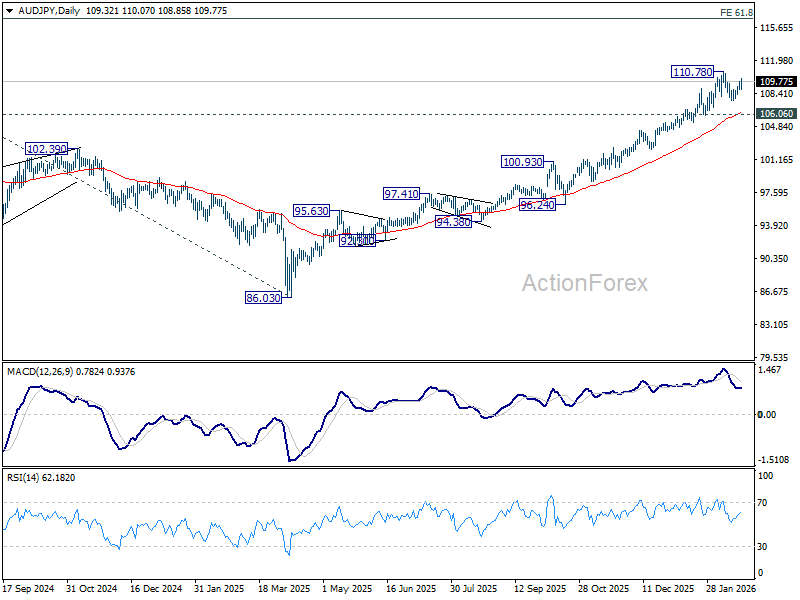
Among all the macro crosscurrents last week, AUD/JPY stood out as the clearest expression of investor sentiment. The cross ended as the top mover, gaining around 1.7% — a performance that would be highly unlikely in an environment of genuine panic.
The rally reflects a combination of domestic and global drivers. In Australia, expectations for further tightening from the RBA firmed following hawkish meeting minutes and a resilient labor market report. On the Japanese side, the Yen’s earlier post-election strength appears to be fading. As risk appetite stabilized, the currency resumed its familiar inverse relationship with global equities.
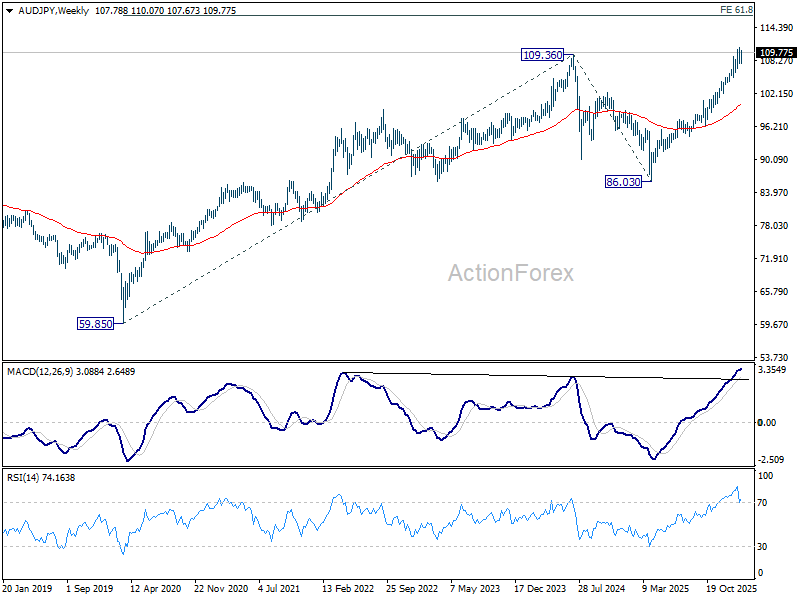
Technically, while more near-term consolidation below 110.78 cannot be ruled out, downside should be contained by 106.06 support, which sits near 55 D EMA (now at 106.23). As long as that floor holds, the broader uptrend remains intact, with the next medium-term target at 61.8% projection of 59.85 (2020 low) to 109.36 (2024 high) from 86.03 (2025 low) at 116.60. However, decisive break below 106.06 would send a very different signal — one of deteriorating risk sentiment - and drag AUD/JPY down for deeper correction.
EUR/CHF Weekly Outlook
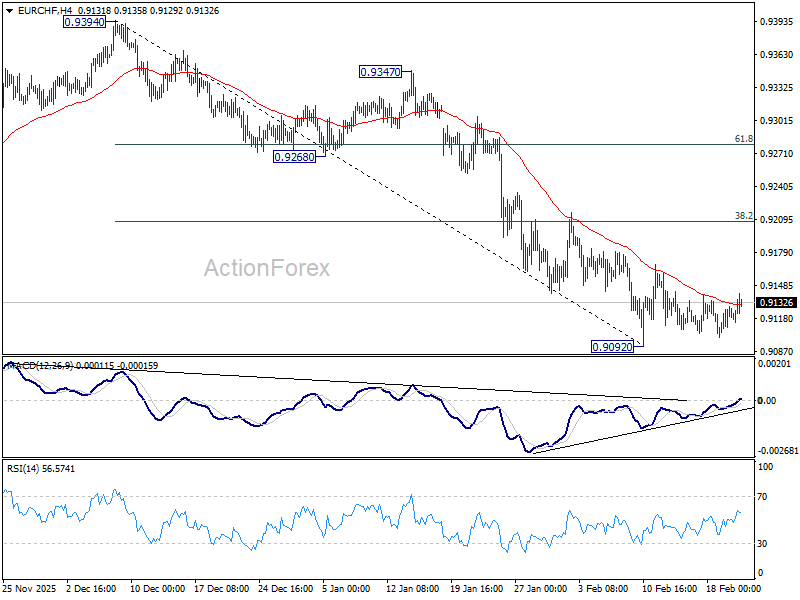
EUR/CHF stayed in range trading above 0.9092 low last week. Current development suggests that 0.9092 is already a short term bottom, and slightly lengthier consolidation is underway. Strong rebound might be seen to But upside should be limited by 38.2% retracement of 0.9394 to 0.9092 at 0.9207. On the downside, firm break of 0.9092 will resume larger down trend.
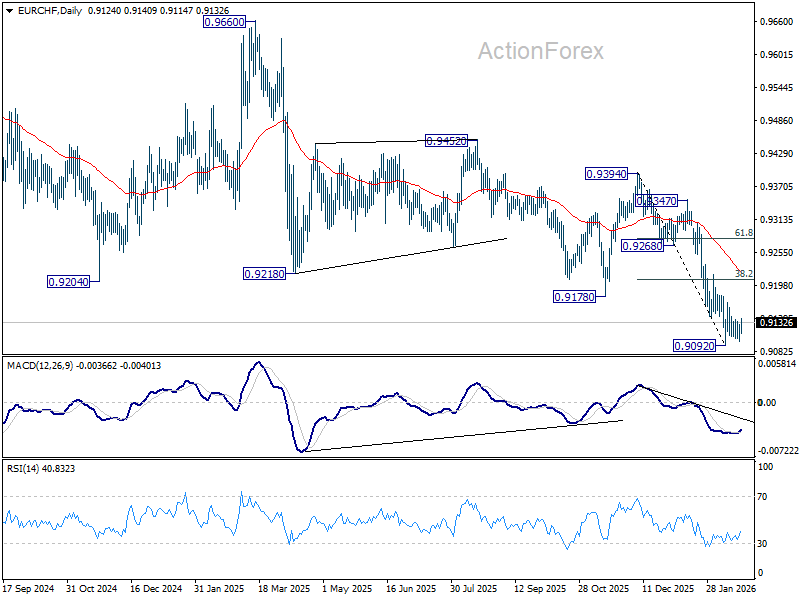
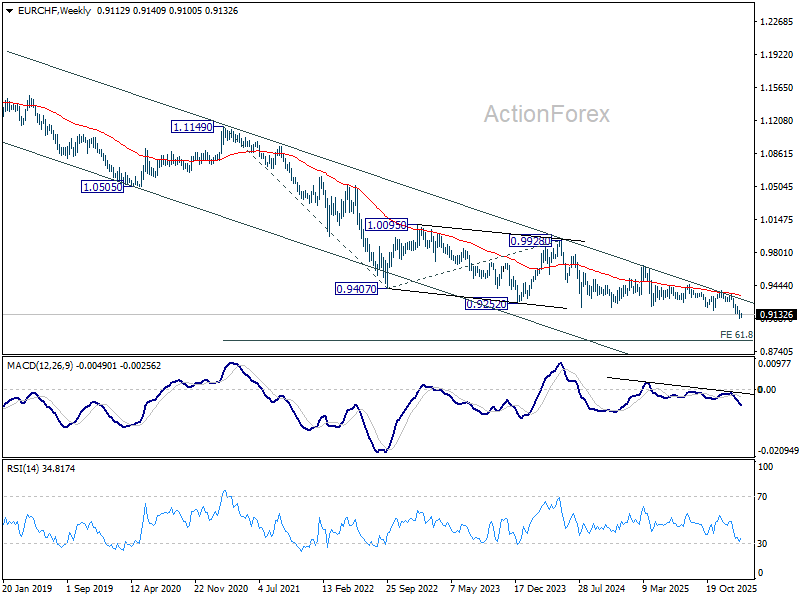
In the bigger picture, down trend from 0.9928 (2024 high) is still in progress with falling 55 W EMA (now at 0.9326) intact. Next target is 61.8% projection of 1.1149 to 0.9407 from 0.9928 at 0.8851. Outlook will stay bearish as long as 0.9394 resistance holds, in case of rebound.
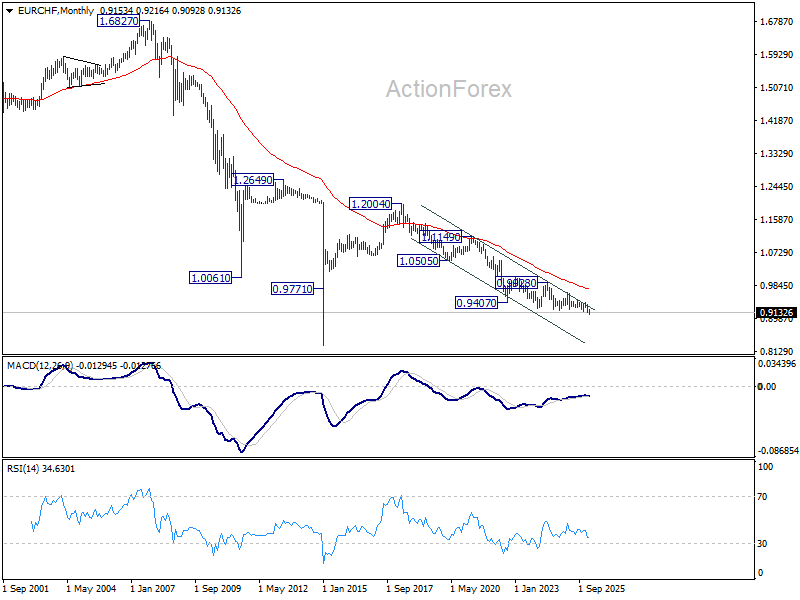
In the long term picture, EUR/CHF is also holding well inside long term falling trend channel. Down trend from 1.2004 (2018 high) is still in progress. Outlook will continue to stay bearish as long as falling 55 M EMA (now at 0.9739) holds.
EUR/USD Weekly Outlook
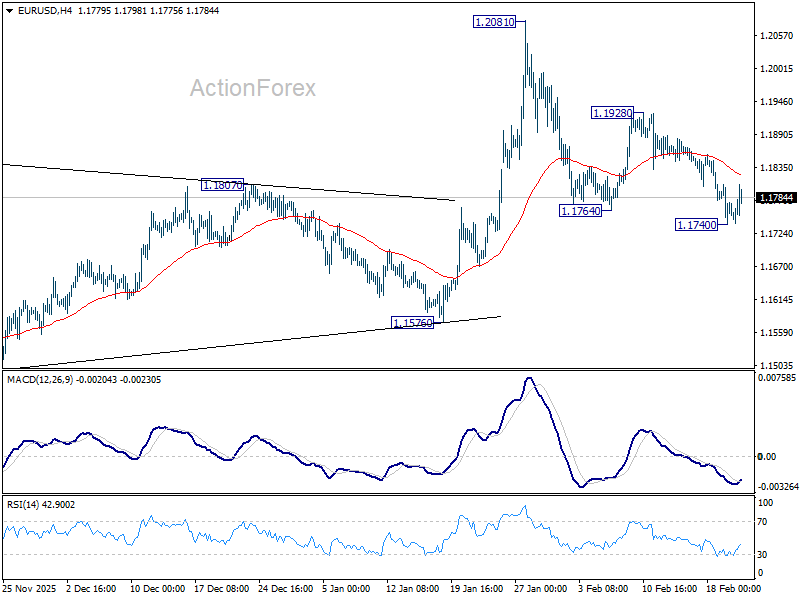
EUR/USD's fall from 1.2081 extended lower last week but recovered after hitting 1.1740. Initial bias is turned neutral this week first. But risk will stay on the downside as long as 1.1928 resistance holds. Below 1.1740 will target 1.1576 support next. Firm break there should confirm rejection by 1.2 key psychological level and turn near term outlook bearish.
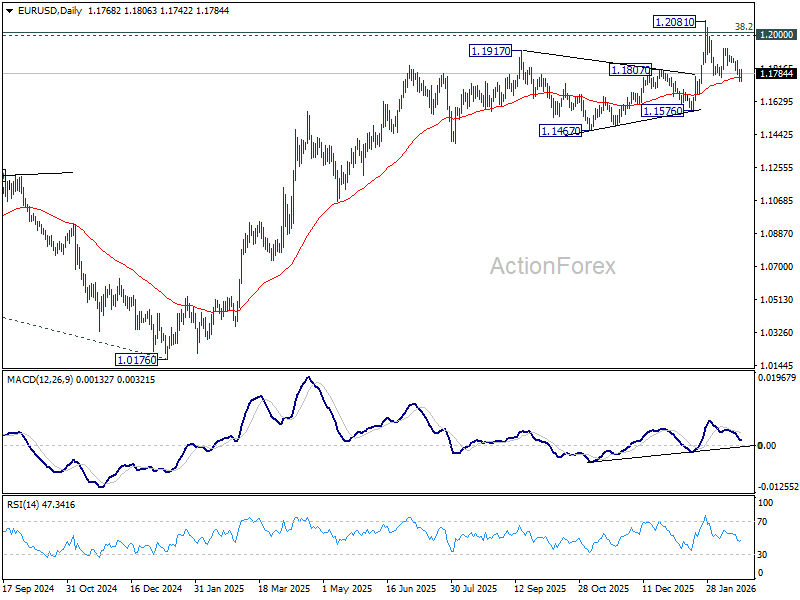
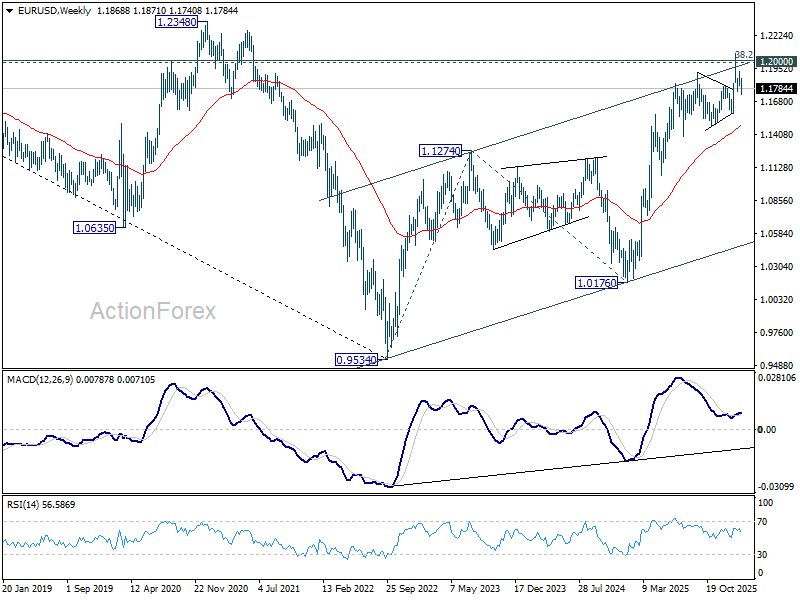
In the bigger picture, as long as 55 W EMA (now at 1.1471) holds, up trend from 0.9534 (2022 low) is still in favor to continue. Decisive break of 1.2 key psychological level will add to the case of long term bullish trend reversal. Next medium term target will be 138.2% projection of 0.9534 to 1.1274 from 1.0176 at 1.2581. However, sustained trading below 55 W EMA will argue that rise from 0.9534 has completed as a three wave corrective bounce, and keep long term outlook bearish.
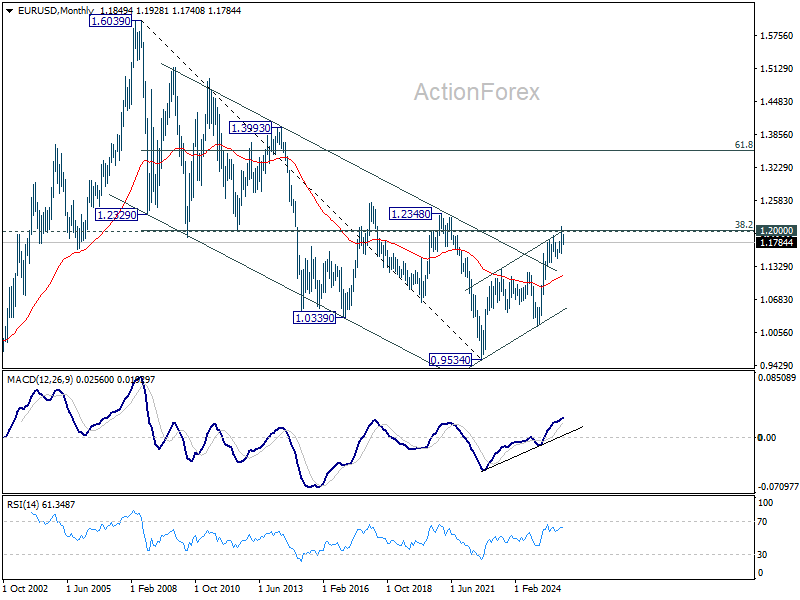
In the long term picture, 38.2% retracement of 1.6039 to 0.9534 at 1.2019, which is close to 1.2000 psychological level is the key for the outlook. Rejection by this level will keep the multi decade down trend from 1.6039 (2008 high) intact, and keep outlook neutral at best. However, decisive break of 1.2000/19, will suggest long term bullish trend reversal, and target 61.8% retracement at 1.3554.
USD/JPY Weekly Outlook
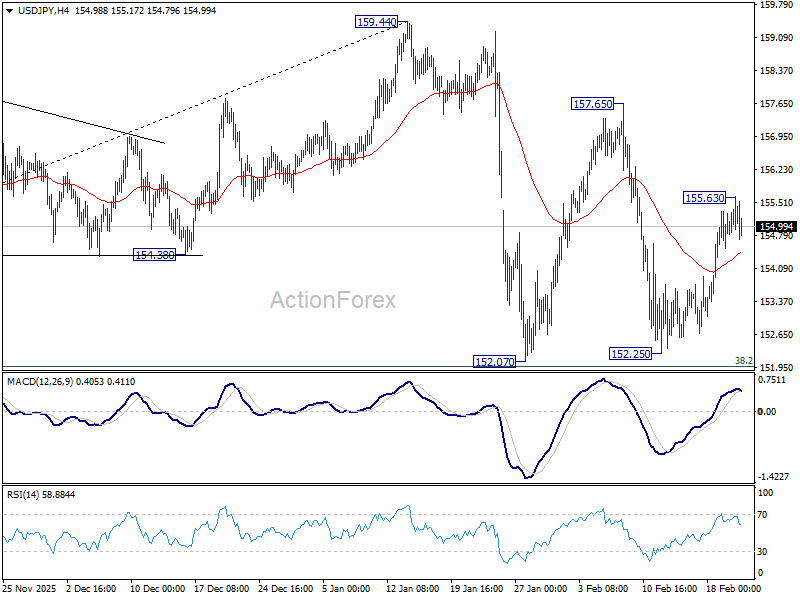
USD/JPY's strong rebound last week suggests that fall from 157.65 has completed at 152.25. Initial bias is turned neutral this week firs. On the upside, above 155.63 will resume the rally from 152.25 and target 157.65 first. Overall, with 38.2% retracement of 139.87 to 159.44 at 151.96 intact, rise from 139.87 is expected to resume through 159.44 at a later stage.
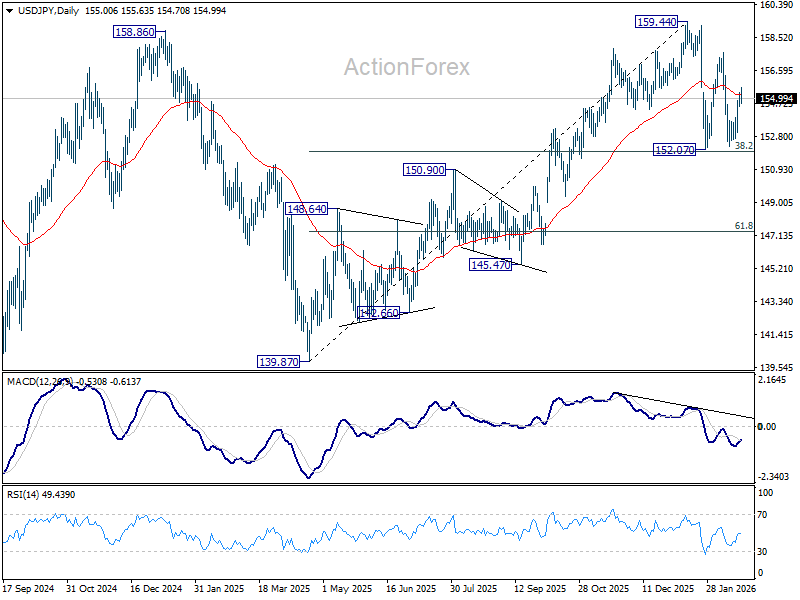
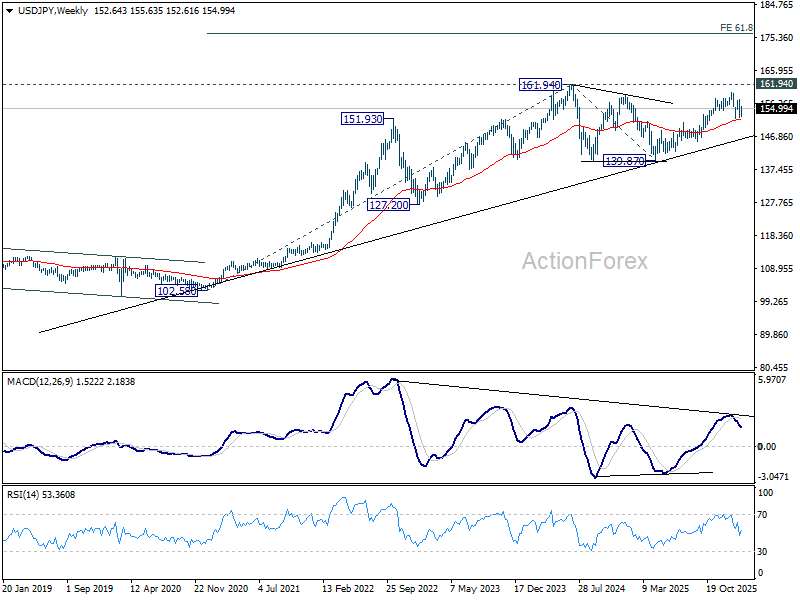
In the bigger picture, outlook is unchanged that corrective pattern from 161.94 (2024 high) should have completed with three waves at 139.87. Larger up trend from 102.58 (2021 low) could be ready to resume through 161.94. This will remain the favored case as long as 55 W EMA (now at 151.71) holds. However, sustained break of 55 W EMA will argue that the pattern from 161.94 is extending with another falling leg.
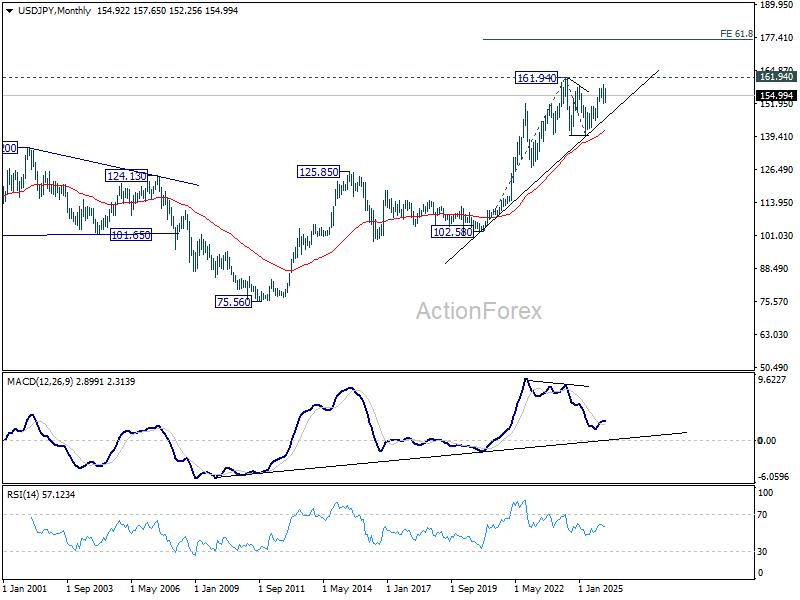
In the long term picture, up trend from 75.56 (2011 low) is still in progress and might be ready to resumption. Firm break of 161.94 will target 61.8% projection of 102.58 (2020 low) to 161.94 (2024 high) from 139.87 at 176.55 in the medium term. Long term outlook will stay bullish as long as 139.87 support holds, even in case of deep pullback.
GBP/USD Weekly Outlook
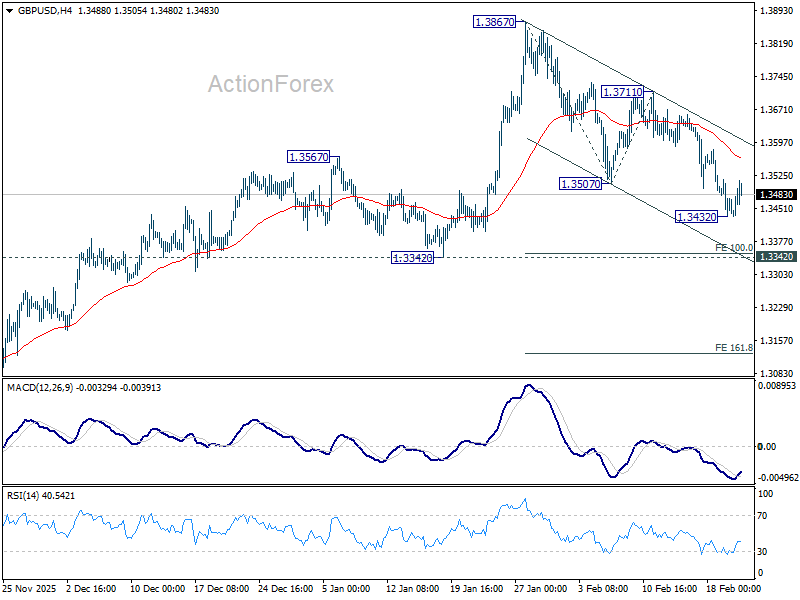
GBP/USD's fall from 1.3867 extended lower last week but recovered after hitting 1.3432. Initial bias remains neutral this week first. Current development argues that it's already correcting the whole rise from 1.2099. Risk will stay on the downside as long as 1.3711 resistance holds. Below 1.3432 will target 1.3342 support first. Firm break there will solidify this case, and target 161.8% projection of 1.3867 to 1.3507 from 1.3711 at 1.3129.
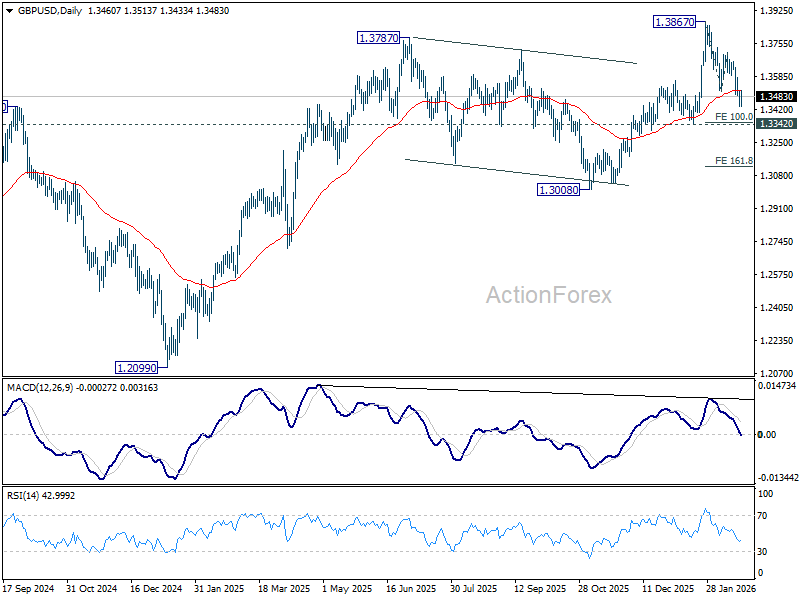
In the bigger picture, as long as 1.3008 support holds, rise from 1.3051 (2022 low) should still be in progress for 1.4284 key resistance (2021 high). Decisive break there will add to the case of long term bullish trend reversal. However, firm break of 1.3008 will raise the chance of medium term bearish reversal and target 1.2099 support next.
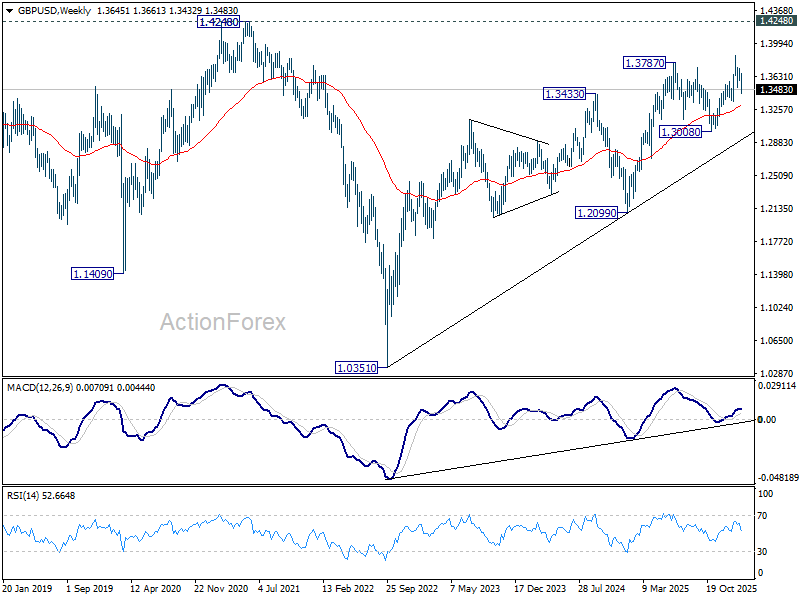
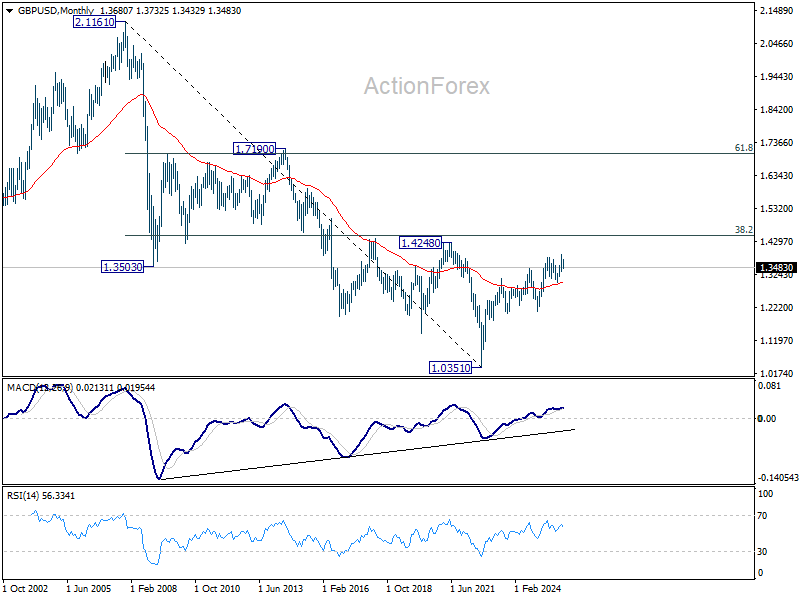
In the long term picture, as long as 1.4248/4480 resistance zone holds (38.2% retracement of 2.1161 to 1.0351 at 1.4480), the long term outlook will remain bearish. That is, price actions from 1.3051 are seen as a corrective pattern to down trend from 2.1161 (2007 high) only. Nevertheless, decisive break of 1.4248/4480 will be a strong sign of long term bullish reversal.
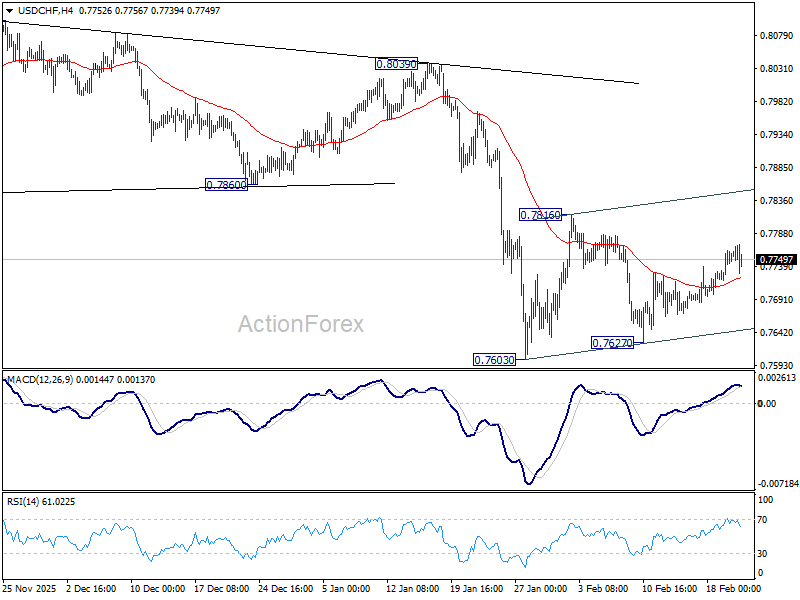
USD/CHF Weekly Outlook
USD/CHF's consolidation pattern from 0.7603 extended with another rising leg last week, and outlook is unchanged. Initial bias remains neutral this week first. Stronger rebound cannot be ruled out but upside should be limited by 55 D EMA (now at 0.7841) to complete the pattern. On the downside, break of 0.7603 will resume larger down trend, and target 0.7382 projection level next. However, sustained break of 55 D EMA will indicate that a larger scale corrective bounce in underway and target 0.8039 resistance next.
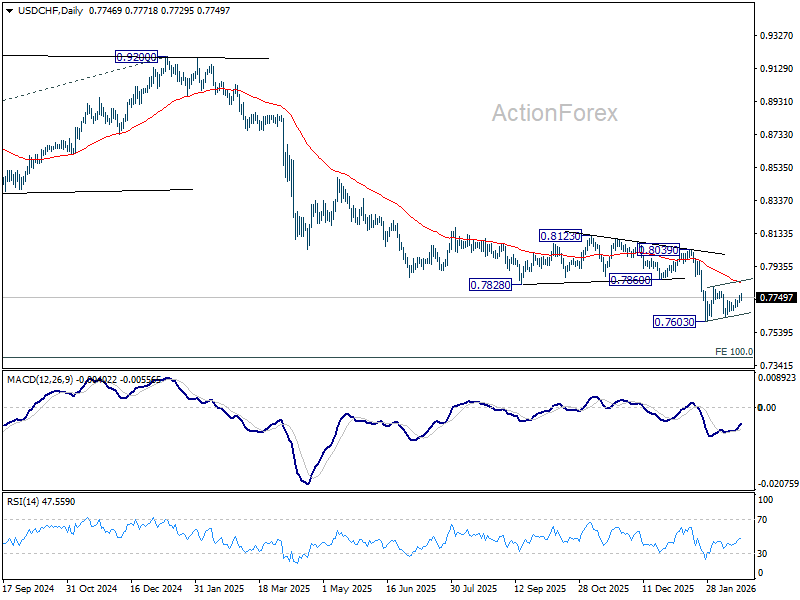
In the bigger picture, down trend from 1.0342 (2017 high) is still in progress. Next target is 100% projection of 1.0146 (2022 high) to 0.8332 from 0.9200 at 0.7382. In any case, outlook will stay bearish as long as 0.8123 resistance holds.
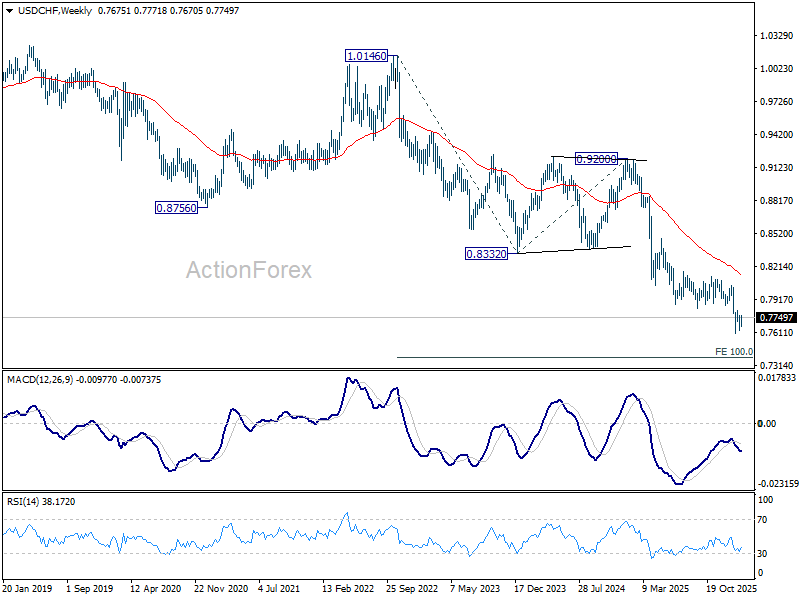
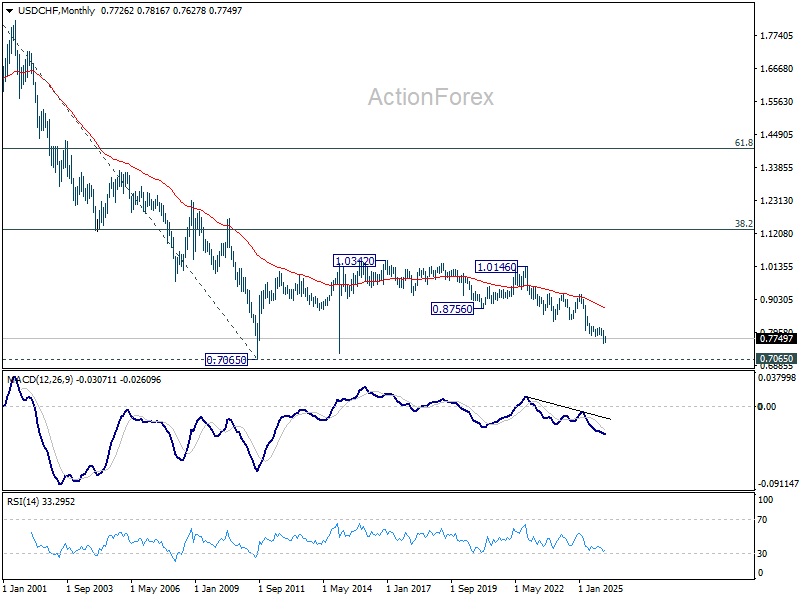
In the long term picture, price action from 0.7065 (2011 low) are seen as a corrective pattern to the multi-decade down trend from 1.8305 (2000 high). It's uncertain if the fall from 1.0342 is the second leg of the pattern, or resumption of the downtrend. But in either case, outlook will stay bearish as long as 0.8756 support turned resistance holds (2021 low). Retest of 0.7065 should be seen next.
AUD/USD Weekly Report
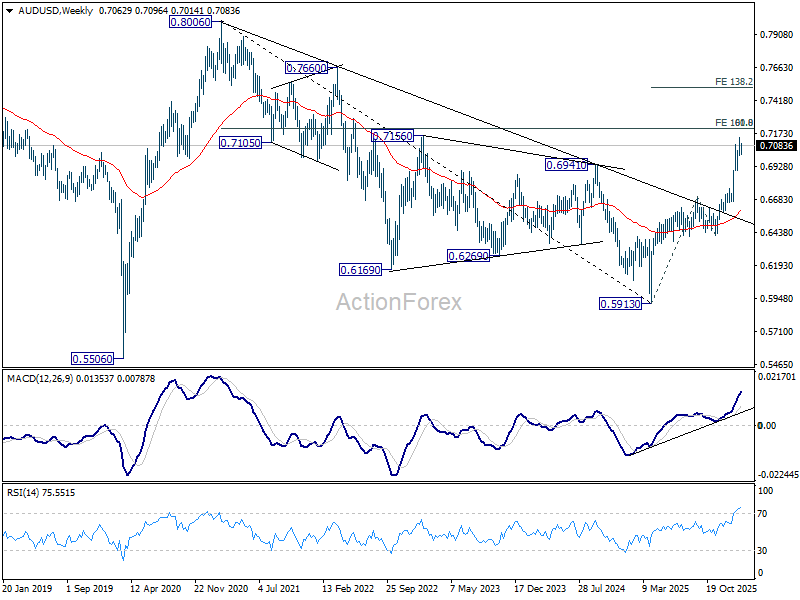
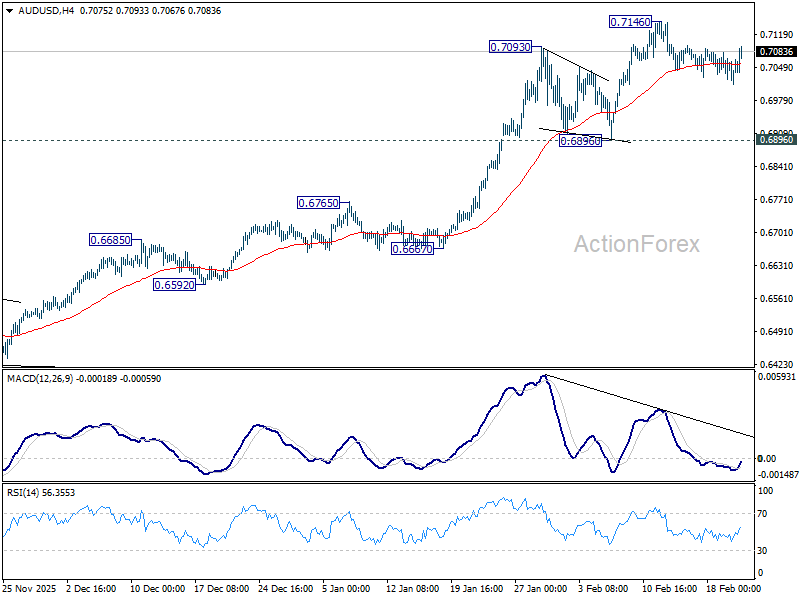
AUD/USD stays in consolidations below 0.7146 last week and outlook is unchanged. Initial bias stays neutral this week first. Deeper retreat cannot be ruled out, but downside should be contained above 0.6896 support. On the upside, above 0.7146 will resume larger up trend to 100% projection of 0.5913 to 0.6706 from 0.6420 at 0.7213.
In the bigger picture, current development argues that rise from 0.5913 (2024 low) is reversing whole down trend from 0.8006 (2021 high). Further rally should be seen to 61.8% retracement of 0.8006 to 0.5913 at 0.7206. This will remain the favored case as long as 0.6706 resistance turned support holds, even in case of deep pullback.
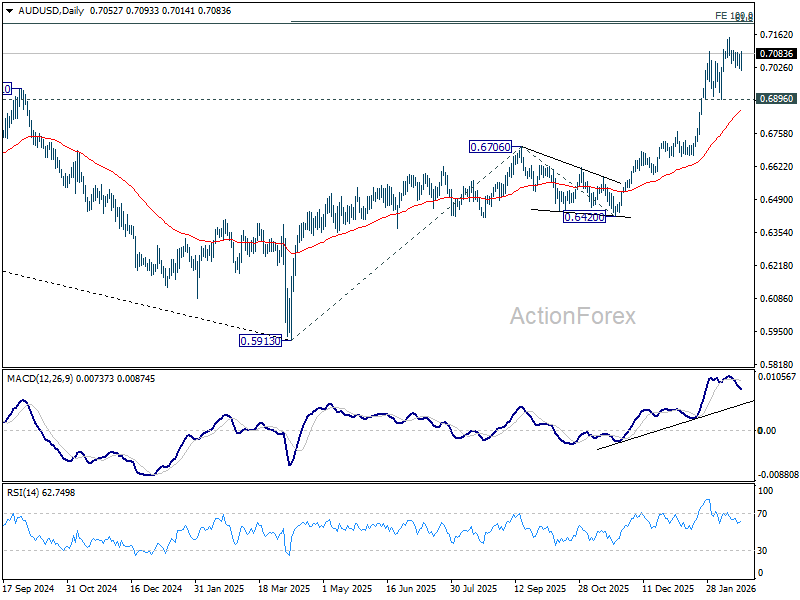
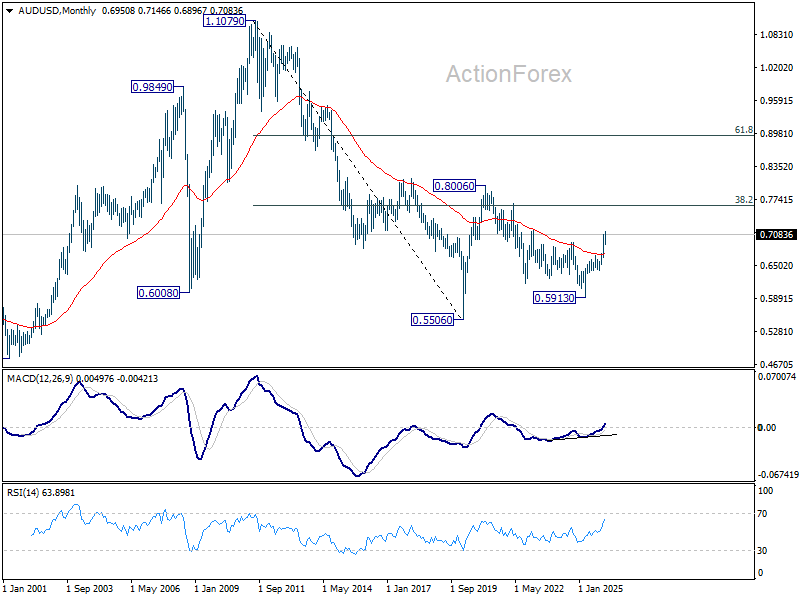
In the long term picture, rise from 0.5913 is seen as the third leg of the whole pattern from 0.5506 (2020 low). It's still early to judge if this is an impulsive or corrective pattern. But in either case, further rise should be seen back to 0.8006 and possibly above.