
Sample Category Title
AUD/USD and NZD/USD Flash Early Signs of Bullish Recovery
AUD/USD is attempting a fresh increase from 0.7015. NZD/USD is consolidating and could aim for a move above 0.6000 in the short term.
Important Takeaways for AUD/USD and NZD/USD Analysis Today
- The Aussie Dollar remained supported above 0.7000 and recovered losses against the US Dollar.
- There was a break above a key declining channel with resistance at 0.7070 on the hourly chart of AUD/USD at FXOpen.
- NZD/USD is consolidating above 0.5965 and 0.5950.
- There was a break above a declining channel with resistance at 0.5960 on the hourly chart of NZD/USD at FXOpen.
AUD/USD Technical Analysis
On the hourly chart of AUD/USD at FXOpen, the pair formed a base above 0.7000. The Aussie Dollar started a decent increase above 0.7035 against the US Dollar to enter a short-term positive zone.
There was a break above a key declining channel with resistance at 0.7070. The bulls even pushed the pair above the 61.8% Fib retracement level of the downward move from the 0.7147 swing high to the 0.7015 low and the 50-hour simple moving average.
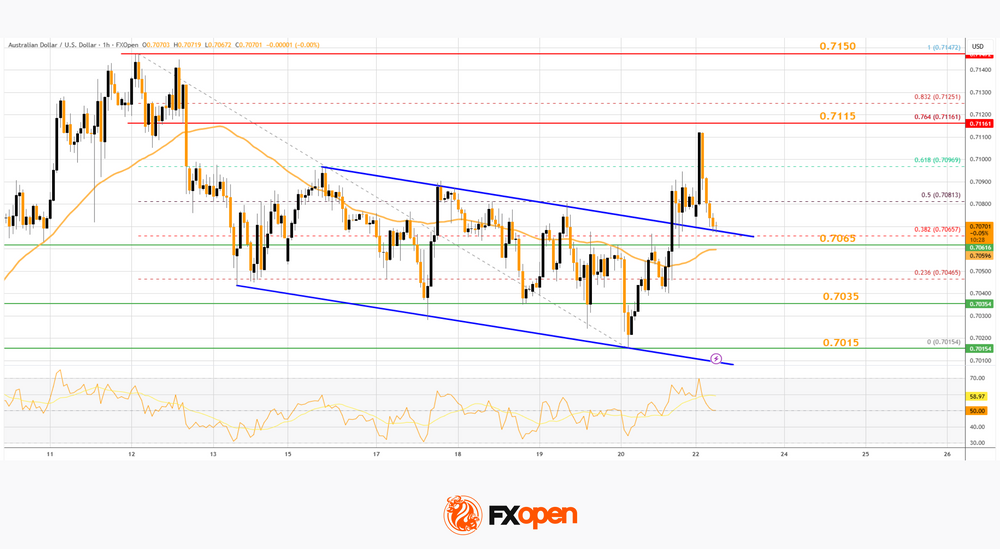
The AUD/USD chart indicates that the pair could struggle to clear the 76.4% Fib retracement at 0.7115. The first major hurdle for the bulls could be 0.7150.
An upside break above 0.7150 might send the pair further higher. The next major target might be 0.7220. Any more gains could clear the path for a move toward 0.7300. If there is no close above 0.7115, the pair might start a fresh decline.
Immediate bid zone could be near 0.7065 and the 50-hour simple moving average. The next area of interest is 0.7035. If there is a downside break below 0.7035, the pair could extend its decline toward 0.7015. Any more losses might signal a move toward 0.6965.
NZD/USD Technical Analysis
On the hourly chart of NZD/USD on FXOpen, the pair also followed AUD/USD. The New Zealand Dollar failed to stay above 0.6020 and corrected gains against the US Dollar.
The pair dipped below 0.5965 and the 50-hour simple moving average and 0.5830. A low was formed at 0.5937, and the pair is now attempting to recover losses. There was a move above the 50% Fib retracement level of the downward move from the 0.6052 swing high to the 0.5937 low.
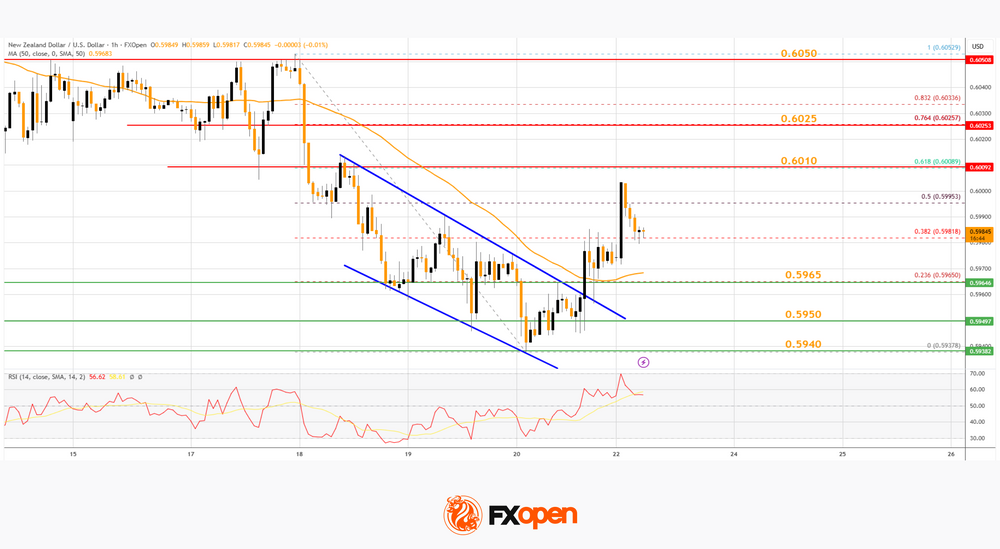
Besides, there was a break above a declining channel with resistance at 0.5960. The NZD/USD chart suggests that the RSI is above 50, signaling a short-term positive bias. On the upside, the pair is facing resistance near 0.6010.
The next major hurdle for buyers could be near the 76.4% Fib retracement at 0.6025. A clear move above 0.6025 might even push the pair toward 0.6050. Any more gains might clear the path for a move toward the 0.6122 pivot zone in the coming sessions.
On the downside, there is support forming near 0.5965 and the 50-hour simple moving average. If there is a downside break below 0.5965, the pair might slide toward 0.5940. Any more losses could lead NZD/USD into a bearish zone to 0.5900.
Trade over 50 forex markets 24 hours a day with FXOpen. Take advantage of low commissions, deep liquidity, and spreads from 0.0 pips (additional fees may apply). Open your FXOpen account now or learn more about trading forex with FXOpen.
This article represents the opinion of the Companies operating under the FXOpen brand only. It is not to be construed as an offer, solicitation, or recommendation with respect to products and services provided by the Companies operating under the FXOpen brand, nor is it to be considered financial advice.
Go Back to Go – Do Not Pass Go
Surprise! The US Supreme Court ruled most import tariffs — as imposed by the Trump administration under the Emergency Economic Powers Act (IEEPA) — illegal, invalidating an estimated $130–$160 billion in tariff revenues.
Trump was furious. He called many people many names and said that he will find other ways to keep tariffs — the central piece of his international policy — alive, and that he is now imposing new 10% tariffs globally. And that was hiked to 15% on Saturday… What a mess!
No one knows what’s next. The White House said that the bilateral deals that have been agreed remain valid, but no one understands how trade partners can be imposed an additional 15% and still keep their original trade agreement. Meanwhile, the new 15% tariff itself cannot last forever, given that the legal provisions President Trump invoked only allow for temporary duties.
There is also no clarity regarding whether and how the US will refund companies that were subjected to tariffs illegally and have probably already passed these costs on to clients.
But in the aftermath of the first year with tariffs, the US trade deficit ballooned to the largest levels since 1960, and a recent New York Fed study showed that Americans — companies and households — have shouldered almost 90% of the tariffs imposed on the world by their government. Trump was furious after that study came out too… obviously.
In summary, it feels like a “Go Back to GO. Do Not Pass GO.” moment in terms of trade uncertainty. We’re back to square one, and the knock-on effects on companies, industries, countries and US debt levels are blurry again.
So what does it all mean for the markets?
Naturally, the ruling was perceived as great news by companies hit by tariffs and asking for refunds, while US sovereign yields were marginally higher on the idea that refunding companies for tariffs that should never have been collected will increase US debt — now approaching the $39trn mark.
The US dollar index slipped from a three-week high, while gold and silver have been rallying since tariff talk returned to the headlines. The Nikkei, European and US futures are notably down into the open this Monday morning as tariff uncertainty re-enters the arena, while the Hang Seng index — back from the Lunar New Year break — is diverging positively, led by technology stock gains, as the Kospi pulled back from a fresh ATH.
All in all, the week will be full of Trump and tariff news, and the latter could help commodities extend their rally, weigh on the US dollar, and pressure tariff- and trade-sensitive sectors and indices. In this context, the FTSE 100 should outperform peers, while mainland European indices could come under renewed pressure.
Good news for Europe is that Eurozone and UK PMIs beat expectations last week. And with inflation now back to the 2% policy target, the European Central Bank (ECB) could provide support if needed.
That’s not the case for the US, though. Data released last Friday showed that US growth slowed much more than expected last quarter (from 4.4% to 1.4% versus 2.8% expected by analysts) — dragged down by a record-long government shutdown (which lasted almost half of the three-month period), softer consumer spending (in line with Walmart’s weak forecast) and weaker trade (you know why). Meanwhile, price pressures rose faster in December; Core PCE, the Federal Reseve’s (Fed) preferred gauge of inflation, returned to the 3% mark — the highest level in two years — pushing Fed doves to further trim their rate-cut bets despite the soft-looking GDP number. The chances for a June rate cut stand close to a coin flip. Happily, the Fed could still inject liquidity to put a floor under any potential selloff, as they have been doing since last summer.
Zooming into the other major topics of the moment: a software company called RingCentral, specialized in cloud communications, jumped 30% on Friday after delivering strong quarterly earnings that beat expectations — confirmation that many companies may have been overly hit by fears that AI will destroy their business. Strong earnings could help them out of the water. Salesforce, Snowflake and Zoom earnings will be closely watched this week.
But the AI anxiety trade continues to look for its next victim. On Friday, cybersecurity software companies took a dip in the chilly water after Anthropic introduced a new tool that “scans codebases for security vulnerabilities and suggests targeted software patches for human review.” CrowdStrike and Cloudflare fell 8%, while the Global X Cybersecurity ETF fell nearly 5% and closed at its lowest level since November 2023. A story to follow.
This week is Nvidia earnings week! Nvidia is due to release its earnings on Wednesday after the close and is expected to deliver strong results that will likely beat expectations. The last time Nvidia disappointed investors was before the AI buzz started, before 2023. Plus, strong TSMC results and Big Tech’s eye-popping spending plans play in Nvidia’s favour. Yet investors will dig into the numbers, especially to see how much of the revenue Nvidia reports has actually been received. More broadly, strong results from Nvidia won’t reduce rising stress around massive AI spending, which is increasing the debt levels of Nvidia’s Big Tech clients — who could eventually be forced to trim their plans if investors push back by selling their stocks.
Let’s see. It will be another week full of tariff drama and earnings!
USD/CHF Daily Outlook
Daily Pivots: (S1) 0.7736; (P) 0.7754; (R1) 0.7777; More….
USD/CHF dips mildly today but overall outlook is unchanged. Initial bias stays neutral and consolidations from USD/CHF's consolidation pattern from 0.7603 could extend further. In case of stronger rise, upside upside should be limited by 55 D EMA (now at 0.7834) to complete the pattern. On the downside, below 0.7627 will bring retest of 0.7603. Firm break there will resume larger down trend, and target 0.7382 projection level next. However, sustained break of 55 D EMA will indicate that a larger scale corrective bounce in underway and target 0.8039 resistance next.
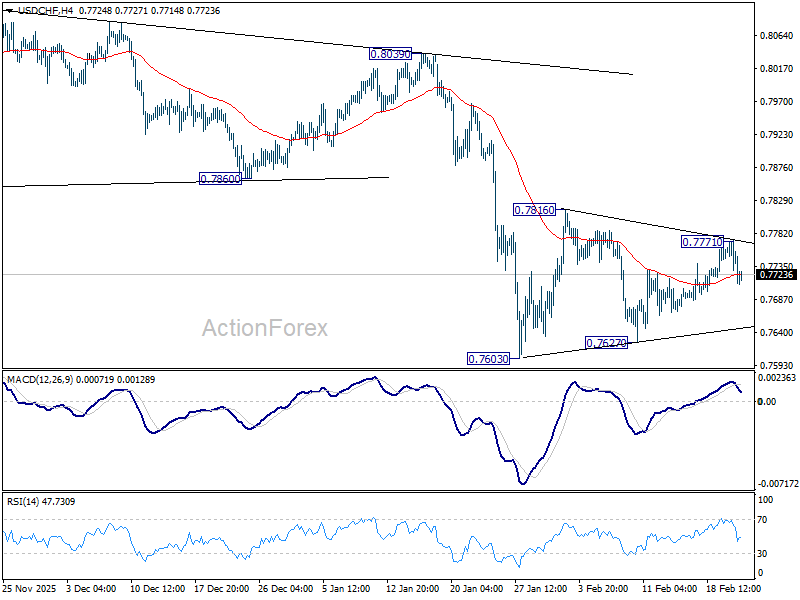
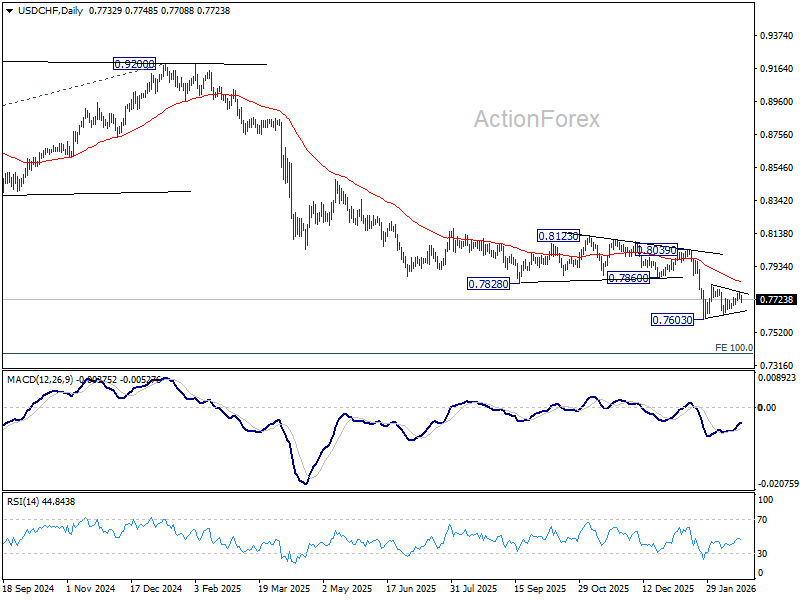
In the bigger picture, down trend from 1.0342 (2017 high) is still in progress. Next target is 100% projection of 1.0146 (2022 high) to 0.8332 from 0.9200 at 0.7382. In any case, outlook will stay bearish as long as 0.8123 resistance holds.
Dollar Bears the Brunt While Tariff Chaos Fails to Rattle Asia
While US tariff chaos dominated headlines, its market impact has been surprisingly contained. Equities in Asia are brushing aside the latest escalation. In South Korea, the Kospi extended gains for a third consecutive session to fresh highs, signaling confidence that trade rhetoric has not yet translated into real economic disruption. Hong Kong’s Hang Seng Index also advanced strongly, reinforcing the view that regional investors are willing to look through Washington’s turbulence. Japanese markets were closed for holiday, limiting broader regional participation.
Currency markets paint a more nuanced picture. The clear underperformer is Dollar. The Supreme Court’s ruling against reciprocal tariffs and subsequent developments have shifted the debate beyond trade policy and into the realm of constitutional stability. For investors, the legal framework underpinning US trade measures now appears fluid and potentially contested. That perception of institutional instability is weighing on the Dollar more than the tariff level itself. It is no longer framed simply as a trade war, but as a legal and governance issue. This shift has helped fuel safe-haven flows into precious metals, with Gold and Silver extending gains alongside lingering Middle East war risk.
Among major currencies, Yen is the strongest performer, followed by Swiss Franc and Euro. Traditional defensive currencies are benefiting from Dollar weakness rather than outright risk aversion. Kiwi and Sterling sit mid-pack, reflecting balanced positioning. Australian Dollar is softer on the day but largely consolidating recent strength. Traders are reluctant to take fresh positions ahead of this week’s Australian CPI release, which could solidify expectations for further tightening by the RBA. Canadian Dollar is also under modest pressure, though downside is cushioned by firm oil prices. Markets are awaiting Q4 GDP data, which will determine whether the BoC can maintain its current policy stance without reopening easing debate.
Overall, the Supreme Court ruling is viewed as a procedural setback rather than a structural reversal of US trade policy. President Donald Trump’s quick move to raise global tariffs from 10% to 15% reinforces that the broader agenda remains intact.
International reaction, though, highlights increasing tension. The European Commission demanded clarity from Washington, insisting that terms of last year’s EU–US trade agreement be respected. “A deal is a deal,” officials stressed, highlighting concerns that unilateral changes undermine negotiated commitments.
India is reportedly rescheduling trade talks with Washington, pending evaluation of the latest developments. Meanwhile, China’s Commerce Ministry said it is conducting a “full assessment” of the ruling and urged the US to lift unilateral tariffs, warning that continued confrontation is harmful.
Lagarde says “I’m not done,” reaffirms commitment to ECB's term
In an interview with CBS on Sunday, ECB President Christine Lagarde dismissed speculation that she could leave the the central bank before the end of her mandate. Reports had suggested an early departure might serve as political insurance to allow the French president to influence succession. Lagarde responded clearly that her “baseline” plan is to serve until the end of her term.
Lagarde emphasized her focus remains firmly on price stability and financial stability, highlighting that inflation has returned to target while growth, though not strong, is resilient at around 1.5%. She highlighted record-low unemployment across the euro area as evidence that policy normalization has achieved tangible results. However, she cautioned that consolidation is still required to safeguard those gains.
Her remarks aim to reinforce continuity at a time when markets are sensitive to leadership stability within major central banks. By stating “I’m not done,” Lagarde sought to anchor expectations that policy direction at the ECB will remain steady, with no abrupt shift tied to political developments.
Tariff chaos and war risk put 5,530 in sight for Gold; Silver eyes 94+
Gold and silver extended their surge into early week trading, propelled by a “perfect storm” of US tariff confusion and escalating Middle East tension. The move defied earlier bearish expectations and marked a clear resumption of the rebound that began in early February.
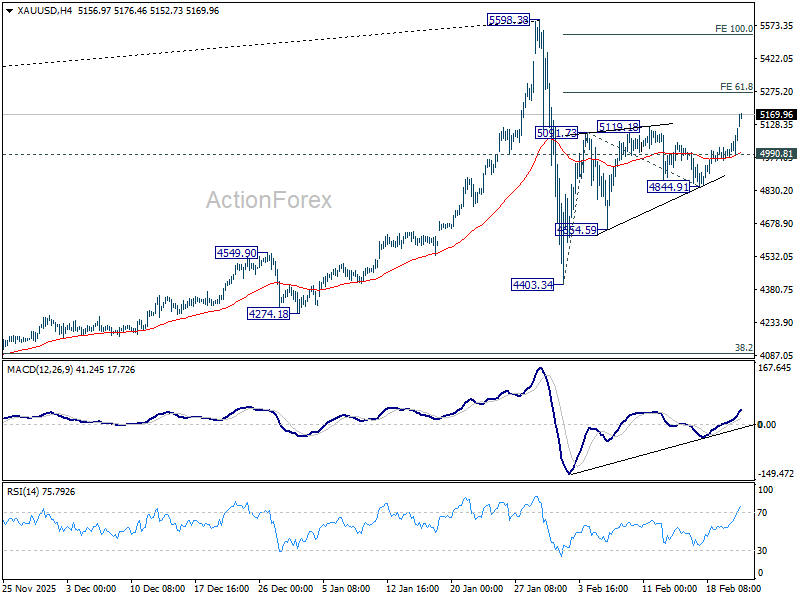
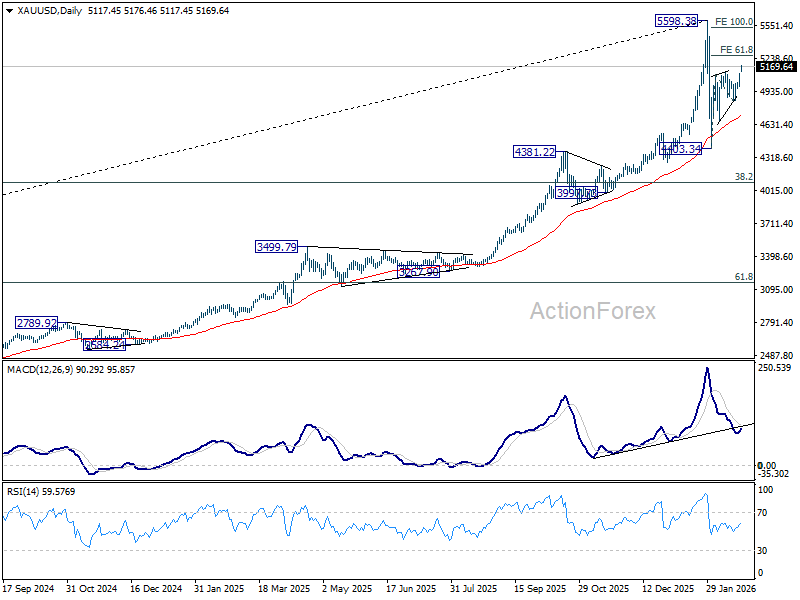
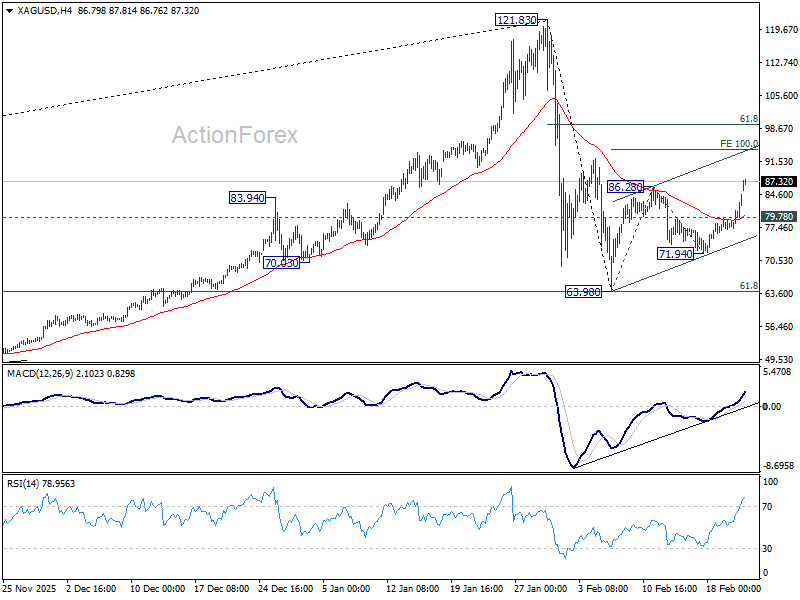
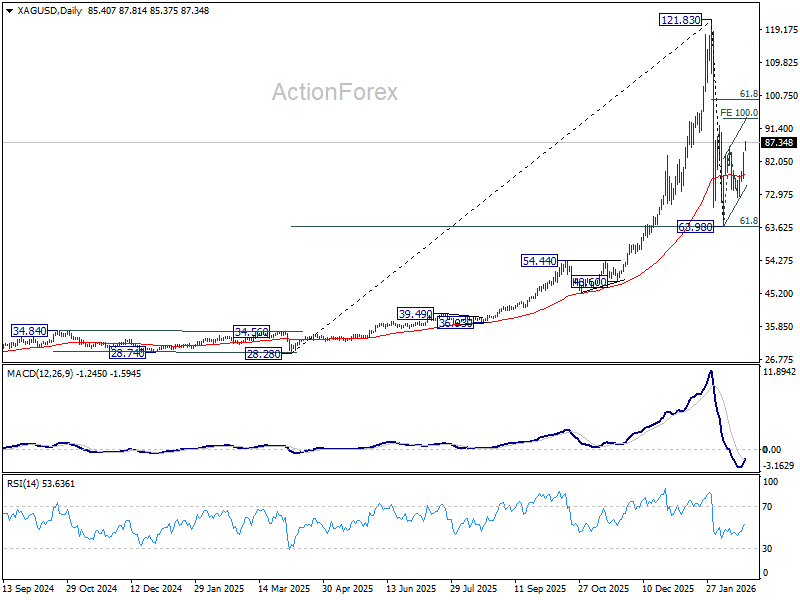
In the near term, Gold’s decisive move back above 5,000 psychological level marks a clear turn in momentum. Further rise is expected to 5,270. Should geopolitical tensions escalate further, Gold has scope to extend toward 5,530. Silver is also advancing, with 94 emerging as the next target, though gains are likely to encounter resistance near 100 level. Given that the rally is being driven primarily by geopolitical risk rather than broad reflation dynamics, Gold is expected to outperform in terms of structure.
The primary catalyst remains policy instability in Washington. After the US Supreme Court struck down the administration’s reciprocal tariffs last week, President Donald Trump quickly countered by announcing a 10% blanket tariffs increase, but then be raised to 15% “effective immediately", as written in a Truth Social post.
The complication lies in implementation. A formal White House proclamation signed Friday night maintained a 10% tariff rate effective 12:01 a.m. ET on February 24. Whether the higher rate is immediate or delayed matters less than the broader takeaway: policy direction appears fluid and unpredictable. For markets, uncertainty around legal basis, enforcement timing and tariff collection creates credibility risk.
At the same time, geopolitical risk in the Middle East has intensified. The White House issued a 10-to-15-day ultimatum for Iran to sign a new nuclear agreement, backed by a visible US military build-up. Key dates now anchor volatility expectations: nuclear talks are scheduled to resume in Geneva on February 26, full US naval deployment is expected in early March, and the unofficial deadline falls between March 5 and March 10.
In the background, additional support is emerging from Asia. Monday marked the first full trading session for many regional markets after Lunar New Year. Physical demand from China is re-entering a market already primed by last week’s developments. Broad-based Dollar softness has added incremental support.
Technically, Gold’s rebound from 4,403.34 resumed decisively after breaking above 5119.18 resistance. The move confirms that the second leg of the corrective pattern from 5598.38 high remains in progress. As long as 4990.81 holds as near-term support, further gains are favored.
Silver’s break above 86.28 similarly confirms continuation of its rebound from 63.98, viewed as the second leg of the corrective pattern from 121.83 peak. Upside remains intact while 79.78 holds, with 100% projection of 63.98 to 86.28 from 71.94 at 94.24 as next target. That said, Silver’s upside should be capped near 61.8% retracement of 121.83 to 63.98 at 99.73 to conclude the rebound.
Aussie CPI test, Canada GDP risk: Data week ahead
The final week of February finds global markets in a state of high alert. While investors are still grappling with US trade policy and geopolitical tensions, the focus is also on some "hard data" of inflation and growth. This week is defined by two high-stakes events that could trigger high volatility in the markets, and two "silent killers" that have the power to derail the current market equilibrium.
The High-Stakes Events:
First major event arrives from Australia. January Monthly CPI Indicator lands Wednesday, just weeks after the RBA raised rates to 3.85% with a hawkish tone. Headline CPI is expected to ease slightly to 3.7%, but focus will be on Trimmed Mean inflation — the RBA’s preferred gauge of underlying price pressure.
If Trimmed Mean prints at 3.3% or higher, market conviction around a May hike will harden further. Traders already assign high probability to another 25bps increase to 4.10%. Further out, implied yields suggest cash rate could peak between 4.20% and 4.45% into late 2026 should Q1 inflation fail to show meaningful moderation.
Friday shifts focus to Canada. Q4 GDP will test whether economic resilience is holding under tariff pressure. Bank of Canada remains on hold at 2.25%, and the OIS curve implies little policy change through year-end, with December 2026 pricing near 2.26%.
However, a flat or negative GDP reading could alter that narrative. It might force policymakers to reconsider easing, particularly if domestic demand shows strain.
The Silent Killers:
A potentially disruptive release is Tokyo CPI on Friday. As leading indicator for national inflation, it provides an early read on price momentum in Japan. Core CPI has eased to 2%, yet service inflation remains sticky, suggesting wage dynamics may still be firm. However, a weaker than expected Tokyo print would cast some doubts of whether BoJ is ready to act again in the near term.
US PPI also lands Friday and now carries elevated importance. After January FOMC minutes reintroduced hike optionality, producer price pressures are no longer secondary. Persistent input costs, especially linked to tariffs, would give hawkish members further justification to delay rate cuts.
Below are some highlights for the week:
United States (USD):
- Conference Board Consumer Confidence - Tuesday
- Producer Price Index (PPI) - Friday
- Fed Speakers: Several officials, including Governor Christopher Waller, are scheduled to speak.
Eurozone (EUR):
- German Ifo Business Climate - Monday
- Preliminary February Inflation (CPI) - Thursday/Friday: Major releases from Germany, France, and Spain.
Japan (JPY):
- Tokyo CPI - Friday
- Industrial Production & Retail Sales - Friday
Canada (CAD):
- Q4 GDP - Friday
Australia (AUD):
- Australia Monthly CPI Indicator - Wednesday
China (CNY):
- Loan Prime Rate (LPR) Decision - Tuesday
USD/CHF Daily Outlook
Daily Pivots: (S1) 0.7736; (P) 0.7754; (R1) 0.7777; More….
USD/CHF dips mildly today but overall outlook is unchanged. Initial bias stays neutral and consolidations from USD/CHF's consolidation pattern from 0.7603 could extend further. In case of stronger rise, upside upside should be limited by 55 D EMA (now at 0.7834) to complete the pattern. On the downside, below 0.7627 will bring retest of 0.7603. Firm break there will resume larger down trend, and target 0.7382 projection level next. However, sustained break of 55 D EMA will indicate that a larger scale corrective bounce in underway and target 0.8039 resistance next.
In the bigger picture, down trend from 1.0342 (2017 high) is still in progress. Next target is 100% projection of 1.0146 (2022 high) to 0.8332 from 0.9200 at 0.7382. In any case, outlook will stay bearish as long as 0.8123 resistance holds.
Trump Launches Global Tariff of 15% After SCOTUS Ruling
In focus today
In Germany, the February Ifo index is released. We expect an improvement as the PMI report last Friday was surprisingly strong on all parameters, particularly the manufacturing sector which recorded growth for the first time since ECB started hiking rates in 2022.
Overnight in China, Loan Prime Rates are expected to remain unchanged, marking another non-event. Historically, adjustments to these rates only occur following changes to the reverse repo rate, which has remained stable since May.
This week offers a light macroeconomic calendar, leaving room for geopolitics to remain a key market driver. On Tuesday, focus turns to US consumer confidence and President Trump's State of the Union address, while Friday brings the release of euro area flash HICP and US PPI figures.
Geopolitical tensions are in focus as US and Iranian negotiators are set to meet in Geneva on Thursday to discuss an Iranian nuclear proposal. Polymarket currently assigns a 21% probability of a US strike on Iran by 1 March and 57% by 31 March. Join us tomorrow, Tuesday 24 February, 13-13.30 CET, for a webinar hosted by our Chief Economist covering geopolitics, Minna Kuusisto. Get a walk-through of the key need-to-knows and what-ifs regarding the tensioned situation in the Middle East.
Economic and market news
What happened since Friday
In the US, the Supreme Court ruled 6-3 against President Trump's IEEPA tariffs, with Chief Justice Roberts and two Trump appointees joining the liberal justices. Trump criticised the ruling, calling the majority "disloyal to the Constitution" and claiming the court was influenced by foreign interests. In response, Trump announced a 15% universal tariff rate under Section 122 of the Trade Act of 1974, which permits tariffs for 150 days before requiring congressional approval - aligning with our base case. Uncertainty over IEEPA payment refunds remains. The European Parliament's trade chief plans to propose freezing ratification of the US-EU trade deal during today's extraordinary meeting of the EP negotiating team, citing unclear US trade policy and the need for legal clarity. Markets reaction has been relatively modest, with the 10-year UST higher and the dollar weaker.
Friday's US data provided mixed signals. February PMIs showed manufacturing declining to 51.2 (prior: 52.4), reflecting a broad weakening across output, selling prices and new orders. The services index remained more stable at 52.3 (prior: 52.7), with new orders and employment weakening slightly but selling prices index rising.
Q4 GDP growth fell short at 1.4% Q/Q annualised (cons: 3.0%), driven by weaker net exports and public spending, likely related to the shutdown. Notably, the net export component reflects tariff-driven swings in international trade flows rather than changes in final demand. Excluding these effects, growth still slowed down towards the end of the year, though more modestly. While AI-related capex spending accelerated, it was offset by weaker private consumption, particularly on goods.
Finally, December's PCE inflation surprised to the topside, with headline at 2.9% y/y (cons: 2.8%) and core at 3.0% y/y (cons: 2.9%).
In the euro area, the February flash composite PMI rose to 51.9 (cons: 51.5), driven by manufacturing PMI at 50.8 (cons: 50.0), its highest level since ECB started hiking rates in 2022. Services PMI rose to 51.8 (cons: 51.9). The rising price indexes in the manufacturing sector suggest some goods price pressures are slowly emerging. Overall, the data was a hawkish surprise, supporting the ECB's "good position".
Additionally, the ECB's negotiated wages indicator rose to 2.95% y/y in Q4 from 1.9% y/y in Q3 driven by one-off inflation compensation payments rather than signalling renewed wage pressures. Wage growth continues to cool as labour demand eases, with the broader ECB-preferred compensation per employee measure, due 6 March, offering a fuller picture.
Equities: Global equities had a strong day on Friday, up about 0.5%, driven by the cyclical stocks and the large cap stocks. S&P500 rose 0.7%, Nasdaq by 0.9% and Russell 2000 virtually unchanged. Stoxx600 was 0.8% higher. Vix dipped below 20. The Mag7 companies were in the driver seat with particular Alphabet and Meta coming higher. The knee jerk-reaction to SCOTUS ruling invalidating Trump's reciprocal tariffs was seen as positive, albeit we caution on expecting a relief rally on the back of the ruling.
FI and FX: The knee-jerk reaction following the US Supreme Court ruling was for the unusual combination of higher rates and weaker USD. The changes were however relatively modest. Focus at the start of the week will be on the union speech by President Trump tomorrow which will be particularly interesting given the latest trade policy developments as well as the geopolitical developments surrounding Iran.
Lagarde says “I’m not done,” reaffirms commitment to ECB’s term
In an interview with CBS on Sunday, ECB President Christine Lagarde dismissed speculation that she could leave the the central bank before the end of her mandate. Reports had suggested an early departure might serve as political insurance to allow the French president to influence succession. Lagarde responded clearly that her “baseline” plan is to serve until the end of her term.
Lagarde emphasized her focus remains firmly on price stability and financial stability, highlighting that inflation has returned to target while growth, though not strong, is resilient at around 1.5%. She highlighted record-low unemployment across the euro area as evidence that policy normalization has achieved tangible results. However, she cautioned that consolidation is still required to safeguard those gains.
Her remarks aim to reinforce continuity at a time when markets are sensitive to leadership stability within major central banks. By stating “I’m not done,” Lagarde sought to anchor expectations that policy direction at the ECB will remain steady, with no abrupt shift tied to political developments.
Tariff chaos and war risk put 5,530 in sight for Gold; Silver eyes 94+
Gold and silver extended their surge into early week trading, propelled by a “perfect storm” of US tariff confusion and escalating Middle East tension. The move defied earlier bearish expectations and marked a clear resumption of the rebound that began in early February.
In the near term, Gold’s decisive move back above 5,000 pscyholgoical level marks a clear turn in momentum. Further rise is expected to 5,270. Should geopolitical tensions escalate further, Gold has scope to extend toward 5,530. Silver is also advancing, with 94 emerging as the next target, though gains are likely to encounter resistance near 100 level. Given that the rally is being driven primarily by geopolitical risk rather than broad reflation dynamics, Gold is expected to outperform in terms of structure.
The primary catalyst remains policy instability in Washington. After the US Supreme Court struck down the administration’s reciprocal tariffs last week, President Donald Trump quickly countered by announcing a 10% blanket tariffs increase, but then be raised to 15% “effective immediately", as writen in a Truth Social post.
The complication lies in implementation. A formal White House proclamation signed Friday night maintained a 10% tariff rate effective 12:01 a.m. ET on February 24. Whether the higher rate is immediate or delayed matters less than the broader takeaway: policy direction appears fluid and unpredictable. For markets, uncertainty around legal basis, enforcement timing and tariff collection creates credibility risk.
At the same time, geopolitical risk in the Middle East has intensified. The White House issued a 10-to-15-day ultimatum for Iran to sign a new nuclear agreement, backed by a visible US military build-up. Key dates now anchor volatility expectations: nuclear talks are scheduled to resume in Geneva on February 26, full US naval deployment is expected in early March, and the unofficial deadline falls between March 5 and March 10.
In the background, additional support is emerging from Asia. Monday marked the first full trading session for many regional markets after Lunar New Year. Physical demand from China is re-entering a market already primed by last week’s developments. Broad-based Dollar softness has added incremental support.
Technically, Gold’s rebound from 4,403.34 resumed decisively after breaking above 5119.18 resistance. The move confirms that the second leg of the corrective pattern from 5598.38 high remains in progress. As long as 4990.81 holds as near-term support, further gains are favored.
Silver’s break above 86.28 similarly confirms continuation of its rebound from 63.98, viewed as the second leg of the corrective pattern from 121.83 peak. Upside remains intact while 79.78 holds, with 100% projection of 63.98 to 86.28 from 71.94 at 94.24 as next target. That said, Silver’s upside should be capped near 61.8% retracement of 121.83 to 63.98 at 99.73 to conclude the rebound.
Aussie CPI test, Canada GDP risk: Data week ahead
The final week of February finds global markets in a state of high alert. While investors are still grappling with US trade policy and geopolitical tensions, the focus is also on some "hard data" of inflation and growth. This week is defined by two high-stakes events that could trigger high volatility in the markets, and two "silent killers" that have the power to derail the current market equilibrium.
The High-Stakes Events:
First major event arrives from Australia. January Monthly CPI Indicator lands Wednesday, just weeks after the RBA raised rates to 3.85% with a hawkish tone. Headline CPI is expected to ease slightly to 3.7%, but focus will be on Trimmed Mean inflation — the RBA’s preferred gauge of underlying price pressure.
If Trimmed Mean prints at 3.3% or higher, market conviction around a May hike will harden further. Traders already assign high probability to another 25bps increase to 4.10%. Further out, implied yields suggest cash rate could peak between 4.20% and 4.45% into late 2026 should Q1 inflation fail to show meaningful moderation.
Friday shifts focus to Canada. Q4 GDP will test whether economic resilience is holding under tariff pressure. Bank of Canada remains on hold at 2.25%, and the OIS curve implies little policy change through year-end, with December 2026 pricing near 2.26%.
However, a flat or negative GDP reading could alter that narrative. It might force policymakers to reconsider easing, particularly if domestic demand shows strain.
The Silent Killers:
A potentially disruptive release is Tokyo CPI on Friday. As leading indicator for national inflation, it provides an early read on price momentum in Japan. Core CPI has eased to 2%, yet service inflation remains sticky, suggesting wage dynamics may still be firm. However, a weaker than expected Tokyo print would cast some doubts of whether BoJ is ready to act again in the near term.
US PPI also lands Friday and now carries elevated importance. After January FOMC minutes reintroduced hike optionality, producer price pressures are no longer secondary. Persistent input costs, especially linked to tariffs, would give hawkish members further justification to delay rate cuts.
Below are some highlights for the week:
United States (USD):
- Conference Board Consumer Confidence - Tuesday
- Producer Price Index (PPI) - Friday
- Fed Speakers: Several officials, including Governor Christopher Waller, are scheduled to speak.
Eurozone (EUR):
- German Ifo Business Climate - Monday
- Preliminary February Inflation (CPI) - Thursday/Friday: Major releases from Germany, France, and Spain.
Japan (JPY):
- Tokyo CPI - Friday
- Industrial Production & Retail Sales - Friday
Canada (CAD):
- Q4 GDP - Friday
Australia (AUD):
- Australia Monthly CPI Indicator - Wednesday
China (CNY):
- Loan Prime Rate (LPR) Decision - Tuesday
EUR/USD Weakness Persists — Markets Brace for Next Leg Lower
Key Highlights
- EUR/USD started a fresh decline from 1.1925 and dipped below 1.1840.
- A key declining channel is forming with resistance at 1.1815 on the 4-hour chart.
- GBP/USD is again moving below the 1.3600 support.
- Gold could aim for a fresh move toward $5,300.
EUR/USD Technical Analysis
The Euro failed to settle above 1.1900 against the US Dollar. EUR/USD dipped below 1.1880 and 1.1840 to enter a bearish zone.
Looking at the 4-hour chart, the pair settled below 1.1840 and the 100 simple moving average (red, 4-hour). The pair even dipped below the 200 simple moving average (green, 4-hour) before the bulls appeared near 1.1740.
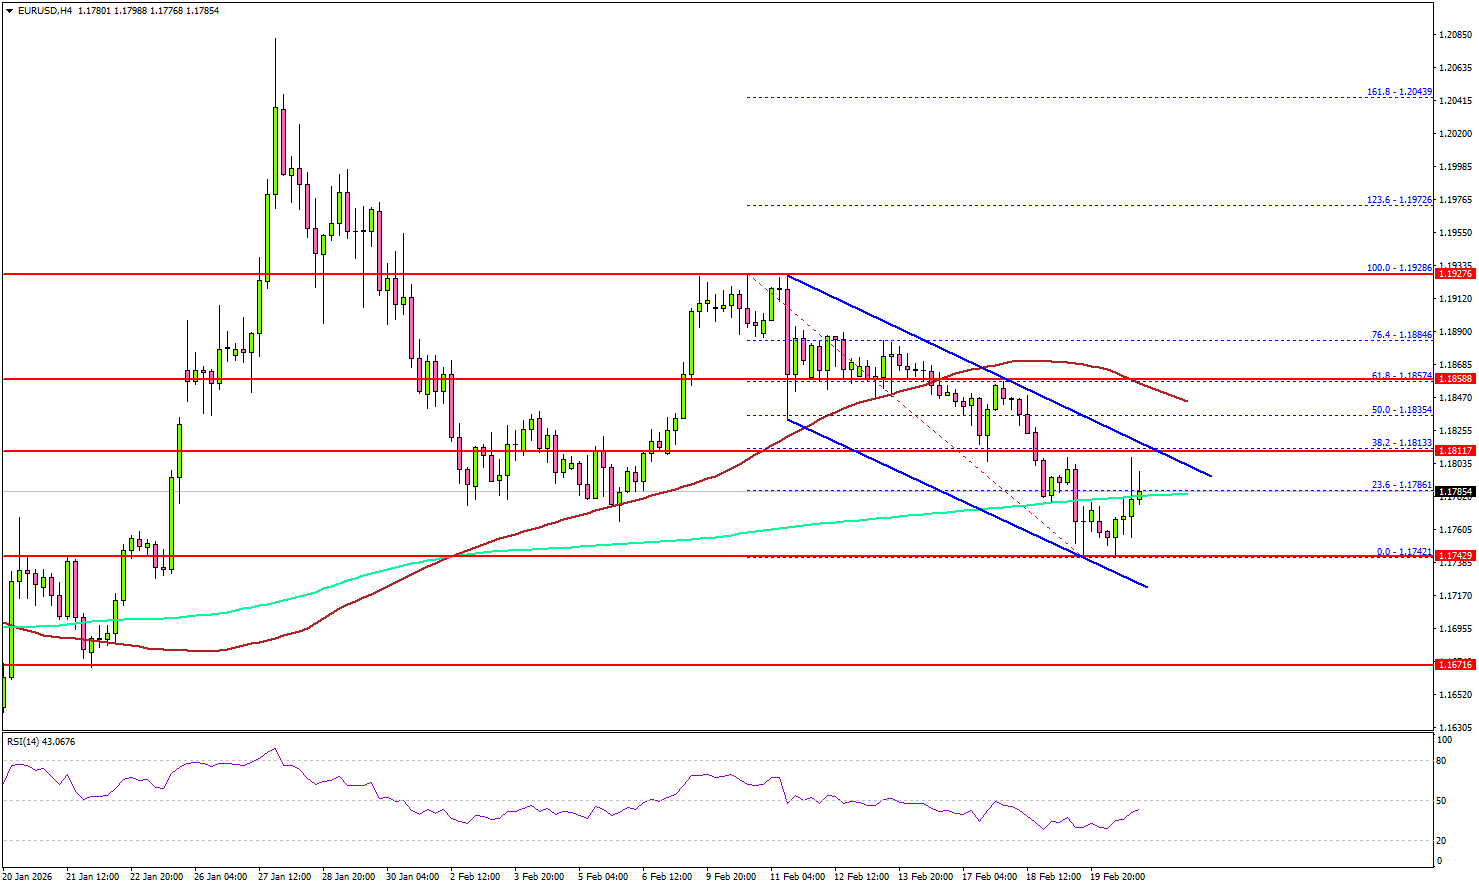
The pair is now consolidating losses above 1.1740. There was a move above the 23.6% Fib retracement level of the downward move from the 1.1928 swing high to the 1.1742 low.
On the upside, the pair is now facing hurdles near 1.1815 and the 38.2% Fib retracement level of the downward move from the 1.1928 swing high to the 1.1742 low. There is also a key declining channel forming with resistance at 1.1815.
The next stop for the bulls might be 1.1850 and the 100 simple moving average (red, 4-hour). A close above 1.1850 could open the doors for more gains. In the stated case, the bulls could aim for a move to 1.1900. The main resistance sits near 1.1925.
Immediate support could be 1.1740. The first major area for the bulls might be near 1.1670. The main support sits at 1.1620, below which the pair might gain bearish momentum. In the stated case, it could even revisit 1.1500.
Looking at GBP/USD, the pair is again moving lower and might continue to move down if there is a close below 1.3420.
Upcoming Key Economic Events:
- German IFO Business Climate Index for Feb 2026 – Forecast 88.4, versus 87.6 previous.
- US Factory Orders for Dec 2025 (MoM) - Forecast +1.1%, versus +2.7% previous.
Tariff Tensions Return as Gold Holds and Stocks Face Pressure
On Friday, the U.S. Supreme Court ruled against the Trump administration’s global tariff policy, which helped U.S. stocks close slightly higher in quiet trading. However, the decision reportedly made President Trump angry, and over the weekend he announced plans to raise tariffs to 15% on imports from all countries, bringing back trade uncertainty. Stronger-than-expected U.S. Durable Goods data and Fed minutes showing policymakers divided on interest rates helped support the U.S. dollar.
In Japan, the 10-year government bond yield fell after Prime Minister Sanae Takaichi promised responsible and proactive fiscal policy. Japan’s GDP was weaker than expected, and inflation slowed to 2% in January, the slowest pace in two years.
Rising tensions between the U.S. and Iran pushed oil prices higher. Bitcoin moved sideways as interest stayed low after its recent sharp drop, while gold continued to test higher levels as investors looked for safety.
Markets This Week
U.S. Stocks
The Dow Jones had a quiet week, with investors cautious about buying at higher levels. Friday’s rise, following the decision to stop tariffs, may prove short-lived if Trump responds with further action. In the short term, sideways to lower movement looks most likely, with the risk of a sharp drop if trade war fears increase. Resistance is at 50,000, 50,500, 51,000, and 51,500, while support is at 49,000, 48,500, and 48,000.
Japanese Stocks
The Nikkei moved sideways last week as investors focused on Takaichi’s new policies and whether they can support further gains. However, the weekly close below the 10-day moving average suggests a short-term pullback is more likely, especially with the market already up around 10% this year. Resistance is seen at 58,000円, 59,000円, and 60,000円, while support is at 56,000円, 55,000円, 54,000円, and 53,000円.
USD/JPY
USD/JPY held key yearly support and pushed higher after the Fed meeting suggested that U.S. interest rate cuts may take longer than some in the market expected. The rebound from support near 152 is a positive sign, but the 10-day moving average is still pointing lower. For now, looking for selling opportunities on rallies may be the better approach this week. Resistance is at 156, 158, and 159, while support is at 153, 152, 151, and 150.
Gold
Gold tested lower at the start of the week as the market struggled to move away from the key $5,000 level. A stronger U.S. dollar also encouraged some selling pressure. However, the weekly close was positive as buyers returned toward the end of the week, with concerns around U.S. trade policy supporting safe-haven demand. Resistance is seen at $5,100, $5,200, and $5,500, while support is at $4,900, $4,850, $4,800, and $4,650.
Crude Oil
Developments in Iran continue to drive crude oil price moves. Prices moved back toward resistance as tensions increased at the end of the week. A move above $67 on further escalation could offer a short-term buying opportunity for traders. However, for now, the market remains in a range despite the geopolitical risks. Resistance remains at $66.50, $70, and $75, while support is at $60, $55, and $50.
Bitcoin
Bitcoin remained out of favor last week, with prices stuck at lower levels and limited interest from traders. If trade tensions increase as Trump reacts to the block on his tariffs, this could trigger further downside pressure in the week ahead. Resistance is at $70,000, $75,000, $80,000, and $85,000, while support is at $65,000, $60,000, and $55,000.
This Week’s Focus
- Monday: U.S. Factory Orders
- Tuesday: U.S. CB Consumer Confidence
- Wednesday: Australia CPI, Japan BoJ Core, E.U. CPI
- Friday: Japan Tokyo Core CPI and Industrial Production, U.S. PPI and Construction Spending
With tariffs back in the news, market volatility could increase this week. The main economic event will be Friday’s U.S. PPI data, which may affect inflation and rate expectations. Oil traders will also watch Iran closely to see if tensions rise further.