

Sample Category Title
Technical Outlook and Review
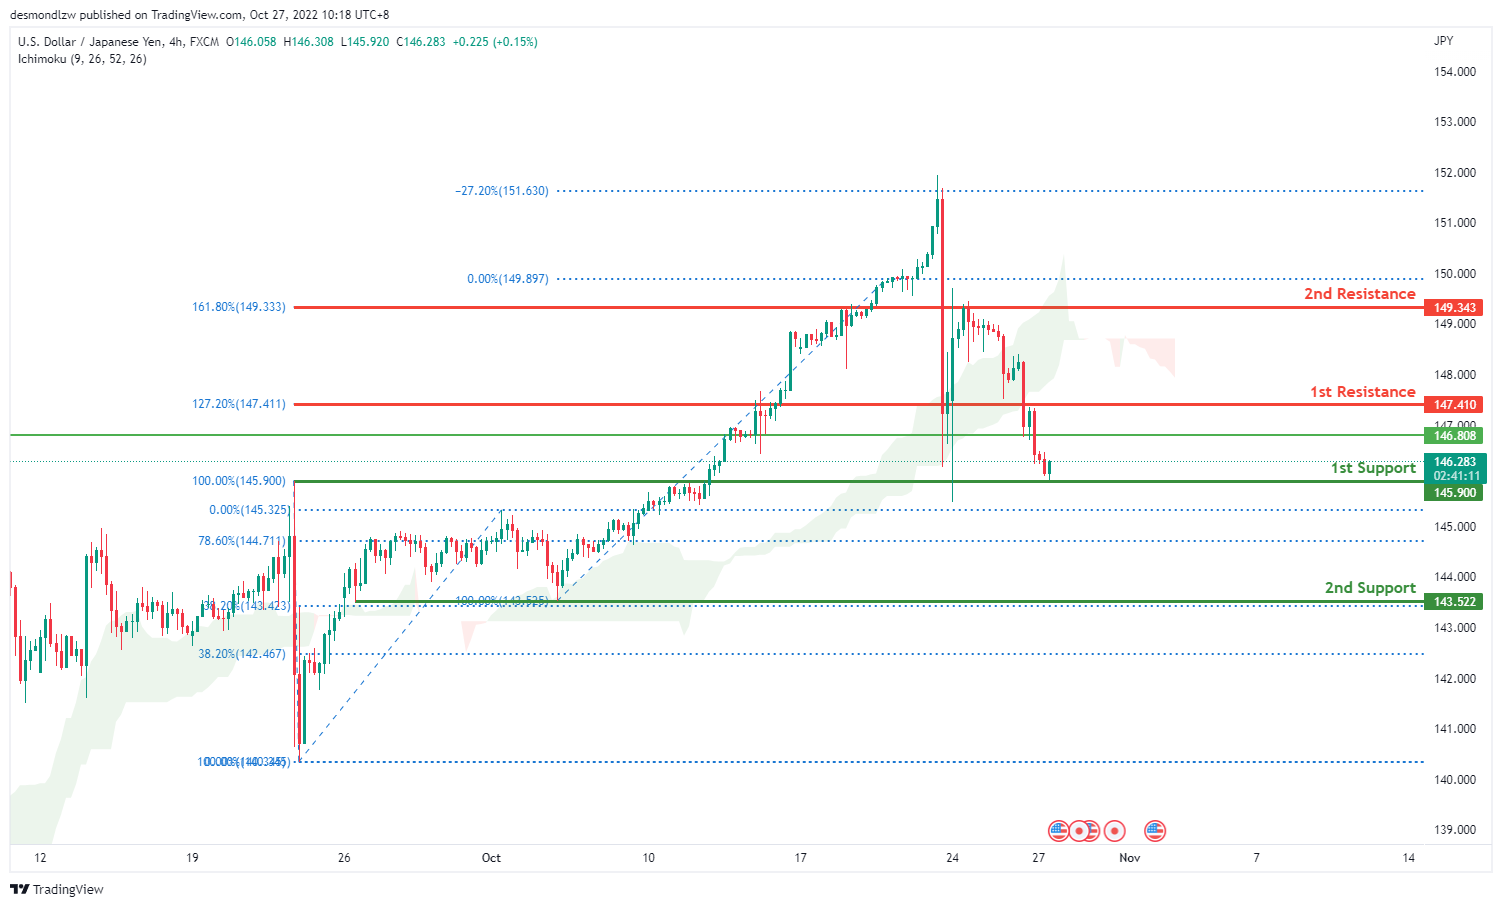
USD/JPY:
The current general bias for USDJPY on the H4 chart is bearish. To add confluence to this, the price is below the Ichimoku cloud which indicates a bearish market. Overnight, price had bearish momentum and closed under the 1st resistance at 149.343 where the 161.8% Fibonacci line is located. Price is currently resting on the 1st support at 145.900 where the 100% Fibonacci line is located. If this bearish retracement continues, expect price to head towards the 2nd support at 143.522 where the 100% and 38.2% Fibonacci lines are located.
Areas of consideration:
- H4 time frame, 1st resistance at 147.410
- H4 time frame, 1st support at 145.90
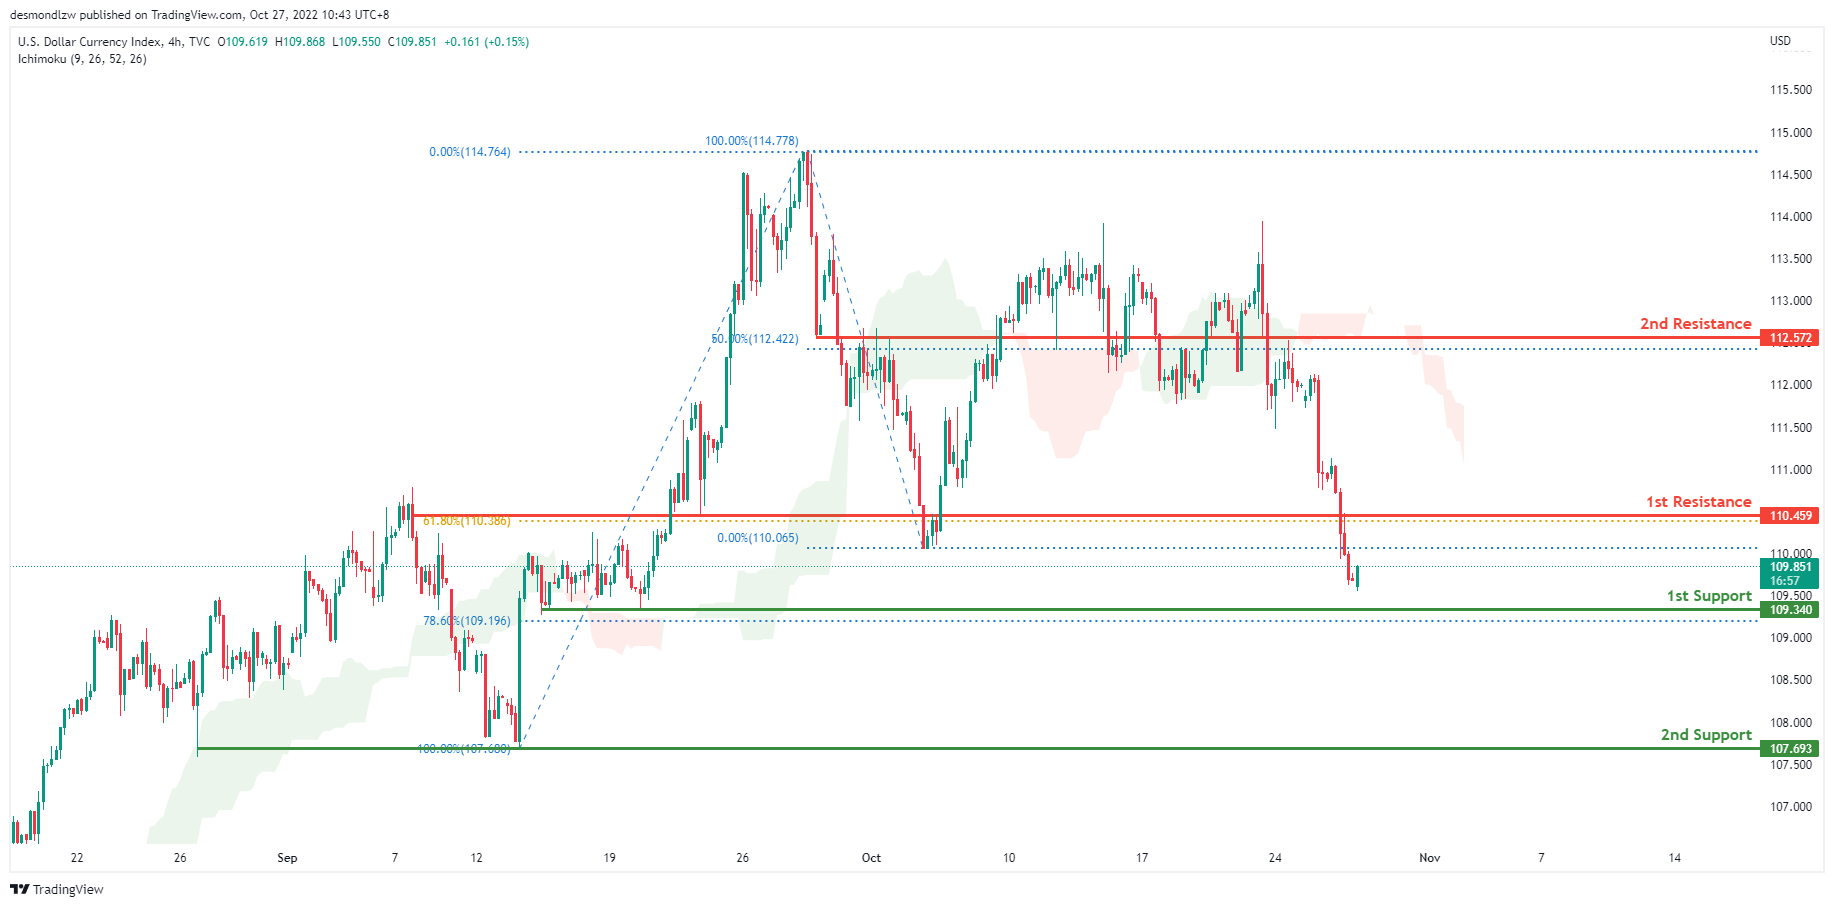
DXY:
On the H4 chart, the overall bias for DXY is bearish. To add confluence to this, the price is below the Ichimoku cloud which indicates a bearish market. Overnight, DXY had massive bearish momentum downwards and broke below the 1st resistance at 110.459 where the 61.8% Fibonacci line is located. If this bearish momentum continues, expect price to possibly head towards the 1st support at 109.340, where the 78.6% Fibonacci line is located.
Areas of consideration:
- H4 time frame, 1st resistance at 110.459
- H4 time frame, 1st support at 109.340
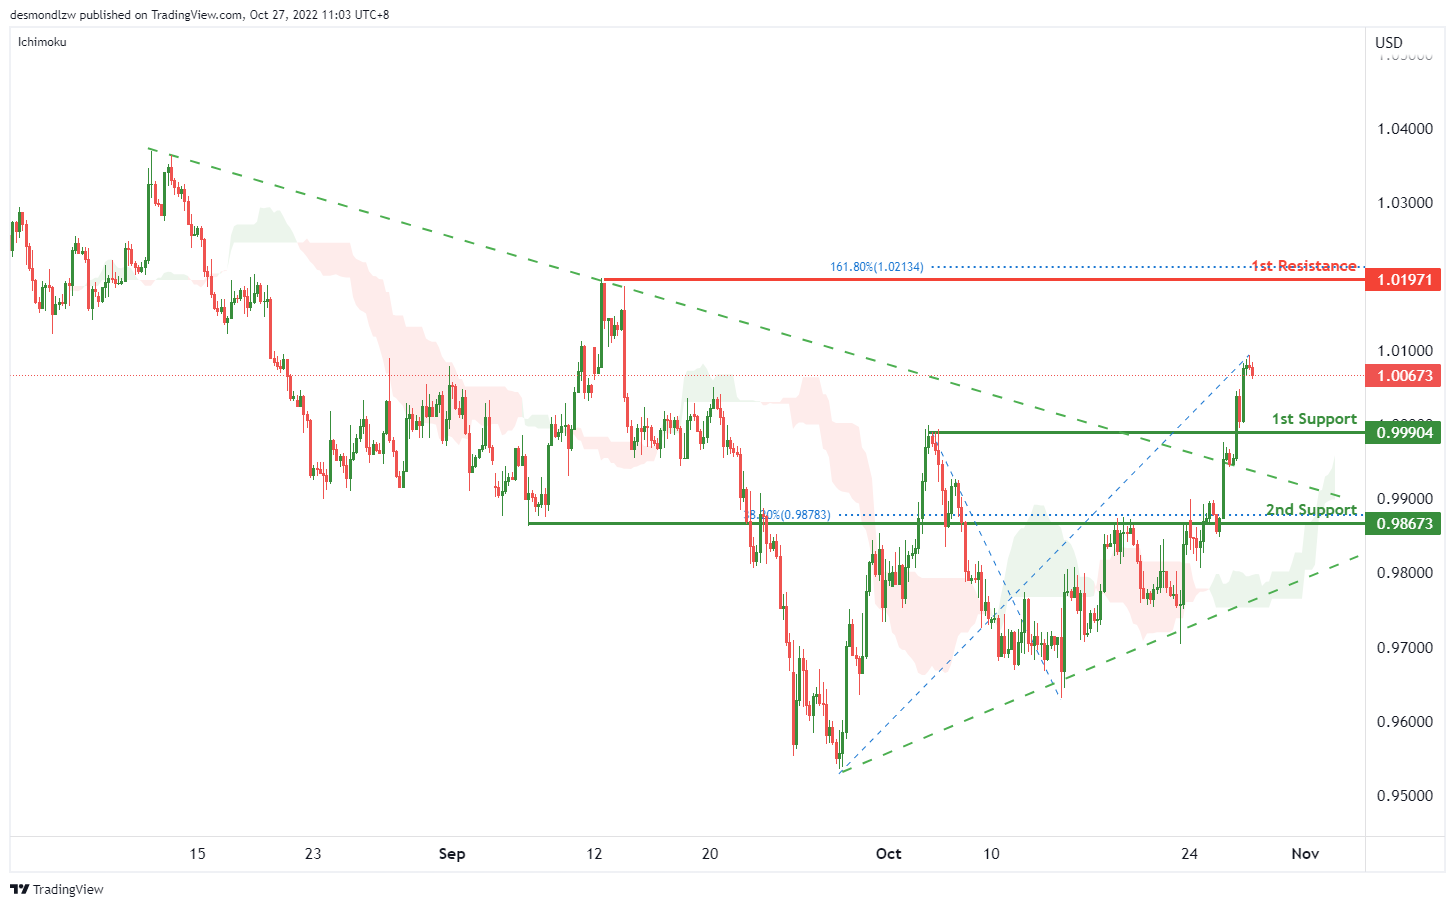
EUR/USD:
On the H4, price is moving within the short term ascending trendline and breaking the long term descending trendline, we have a bullish bias that the price may rise to the 1st resistance at 1.01971, where the previous swing high and 161.8% fibonacci extension are. Alternatively, the price may drop to the 1st support at 0.99904, which is in line with the previous swing high. If the 1st support is broken, the 2nd support is at 0.98673, where the 38.2% fibonacci retracement and overlap support sits.
Areas of consideration :
- H4 1st support at 0.99904
- H4 1st resistance at 1.01971
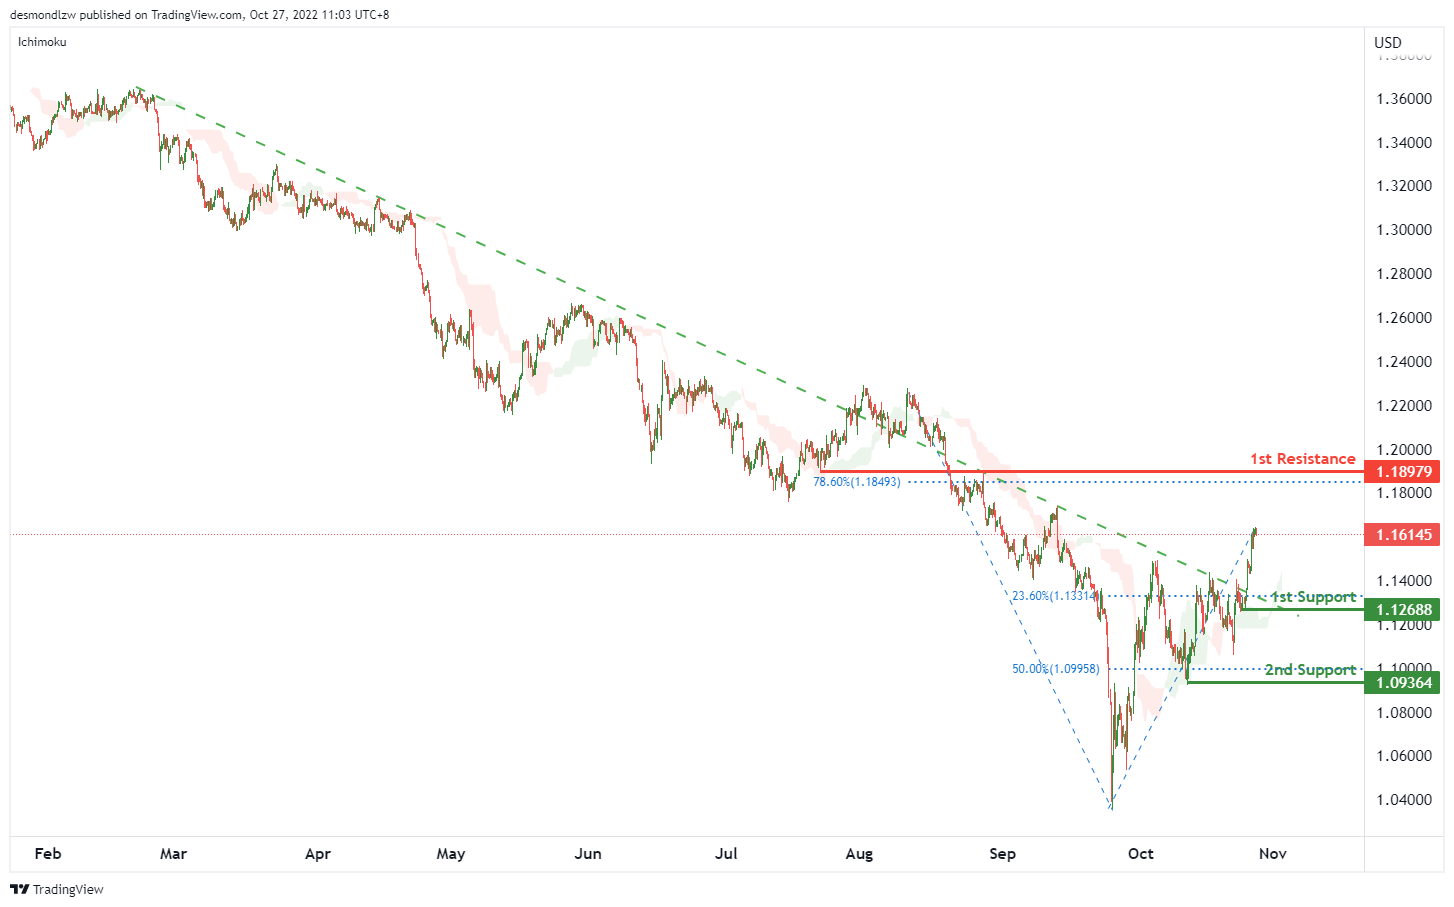
GBP/USD:
On the H4, price is crossing ichimoku cloud and breaking the descending trendline, we have a bullish bias that the price may test the 1st resistance at 1.18979, which is in line with the overlap resistance and 78.6% fibonacci retracement. Alternatively, the price may drop to the 1st support at 1.12688, where the swing low support and 23.6% fibonacci retracement are. If the 1st support is broken, the 2nd support is at 1.09364, which is in line with the 50% fibonacci retracement.
Areas of consideration:
- H4 1st resistance at 1.18979
- H4 1st support at 1.12688
USD/CHF:
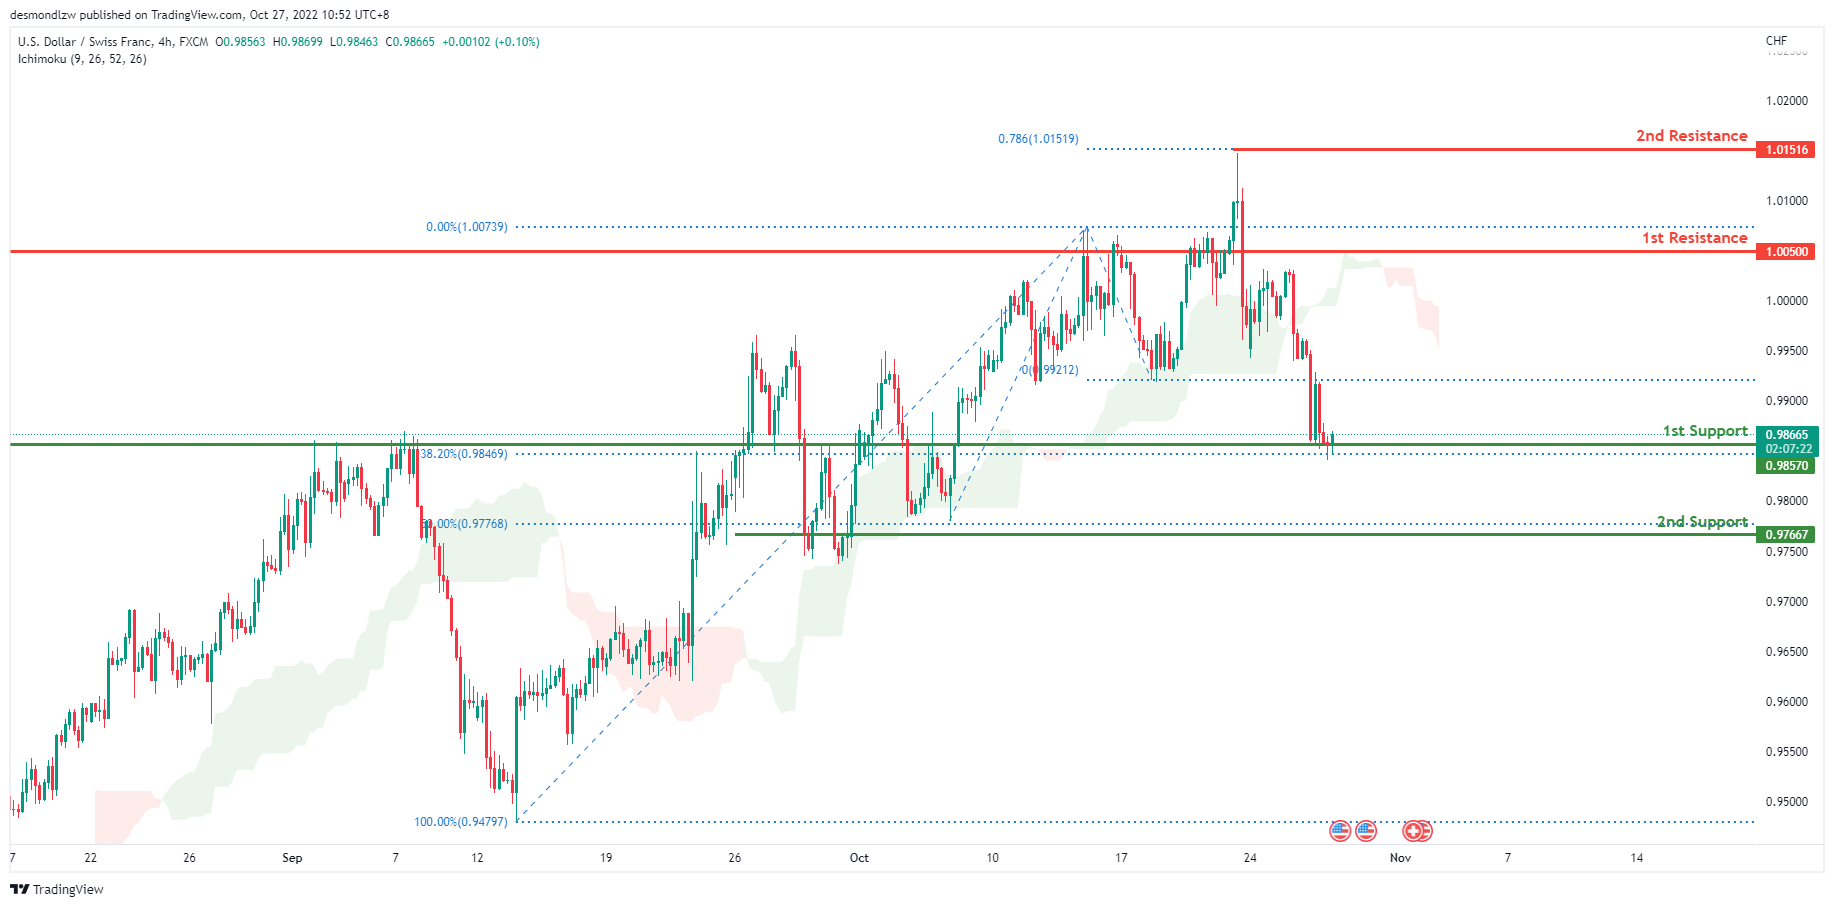
On the H4 chart, the overall bias for USDCHF is bearish. To add confluence to this, the price is below the Ichimoku cloud which indicates a bearish market. Overnight, price continued its bearish momentum downwards with price currently resting on the 1st support at 0.98570 where the 38.2% Fibonacci line is located. Expecting price to possibly continue bearish and head towards the 2nd support at 0.97667, where the 50% Fibonacci line is located.
Areas of consideration
- H4 1st support at 0.9857
- H4 2nd support at 0.97667
- H4 1st resistance at 1.0050
XAU/USD (GOLD):
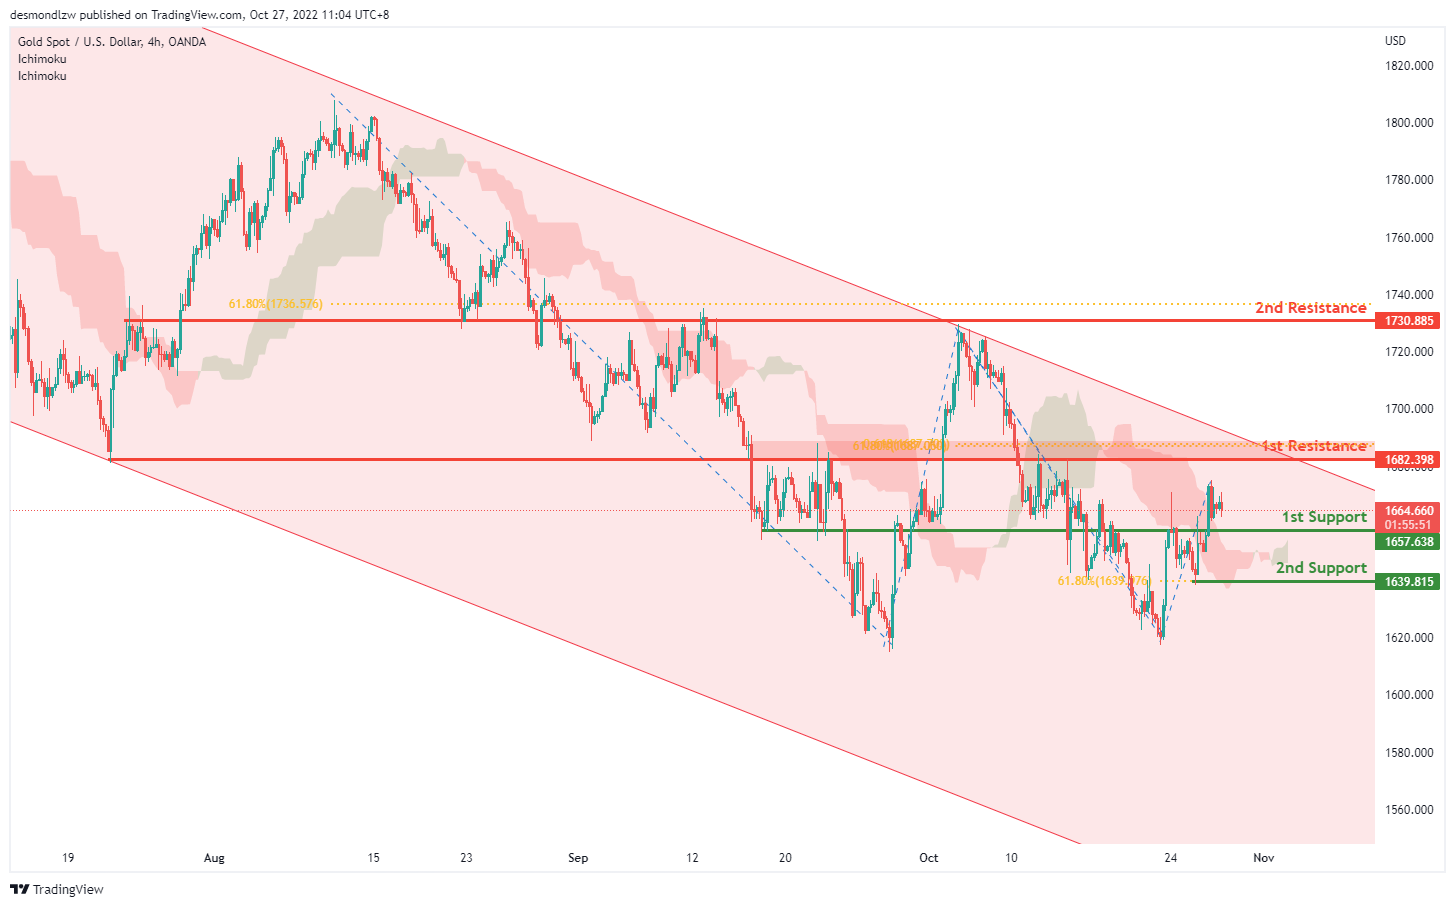
On H4, with the price is within descending channel, we have a bearish bias that the price may drop to the 1st support at 1657.638, which is in line with the overlap support, if the 1st support is broken, the 2nd support is at 1639.815, where the previous swing low and 61.8% fibonacci retracement are. Alternatively, as the price is above ichimoku cloud, the price may test the 1st resistance at 1682.398, where the 61.8% fibonacci projection and retracement are. If the 1st resistance is broken, the 2nd resistance is at 1730.885, which is in line with the 61.8% fibonacci retracement.
Areas of consideration:
- H4 time frame, 1st support at 1657.638
- H4 time frame, 2nd support is at 1639.815
AUD/USD:
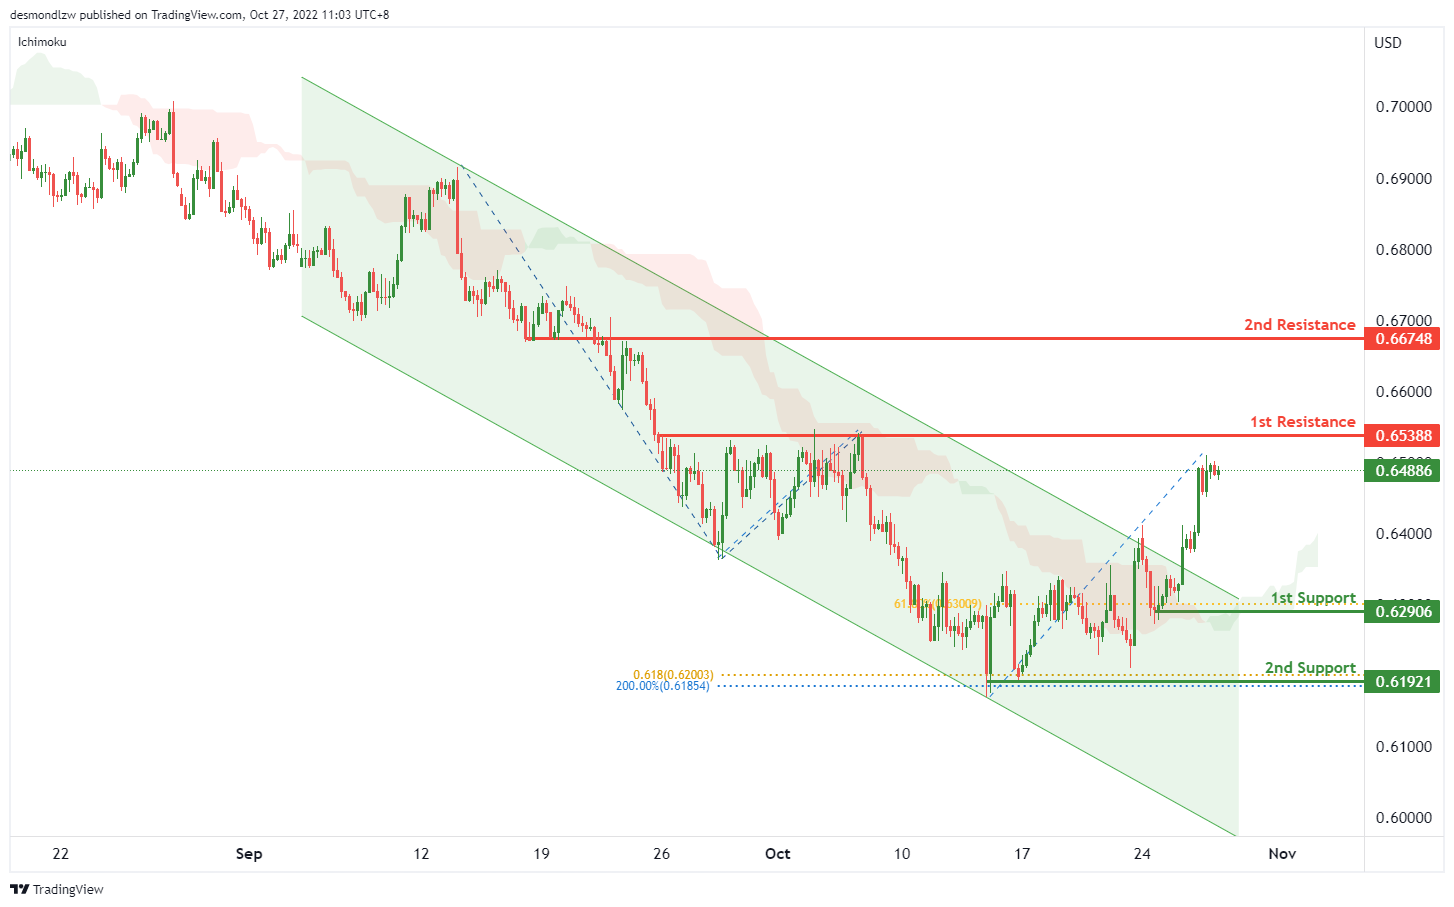
On the H4, with the price breaking the descending channel and ichimoku cloud, we have a bullish bias that the price may retest the 1st resistance at 0.65388, which is in line with the overlap resistance, if the 1st resistance is broken, the 2nd resistance is at 0.66748, where the overlap resistance is. Alternatively, the price may drop to the 1st support at 0.62906, which is in line with the 50% fibonacci retracement. If the 1st support is broken, the price may drop to the 2nd support at 0.61921, where the previous swing low, 61.8% fibonacci projection and 200% fibonacci extension are.
Areas of consideration
- H4, 1st resistance at 0.65388
- H4, 1st support at 0.62906
NZD/USD:
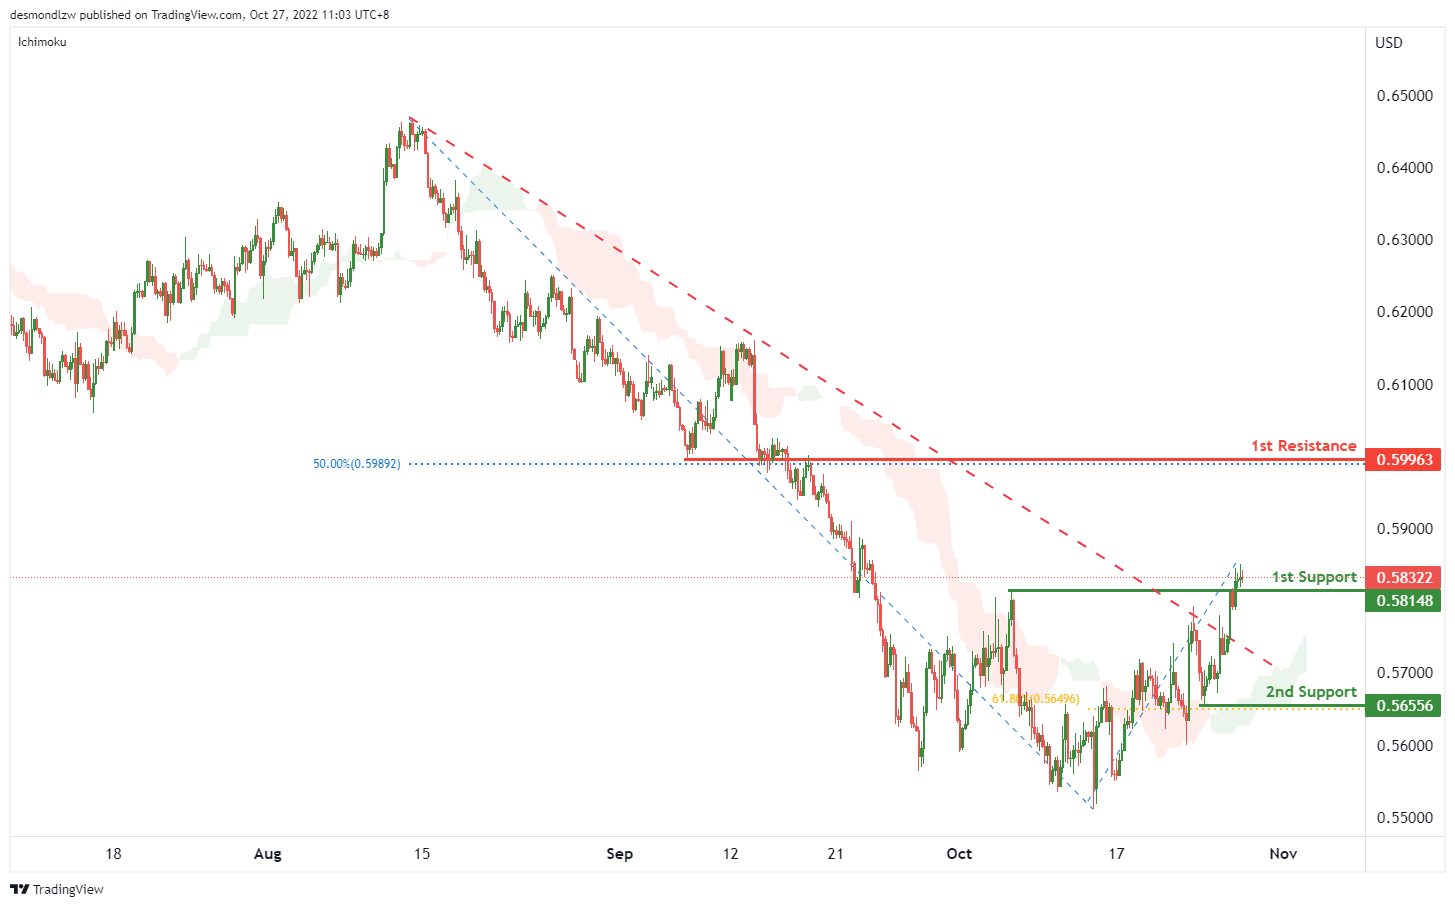
On the H4 chart, as the price is testing the descending trendline and the price is above ichimoku cloud , we have a bullish bias that the price may rise from the 1st support at 0.58148, which is in line with the previous swing high to the 1st resistance at 0.59963, where the overlap resistance and 50% fibonacci retracement are. Alternatively, the price may drop to the 2nd support at 0.56556, where the previous swing low and 61.8% fibonacci retracement are.
Areas of consideration:
- H4 time frame, 1st support at 0.58148
- H4 time frame, 1st resistance at 0.59963
USD/CAD:
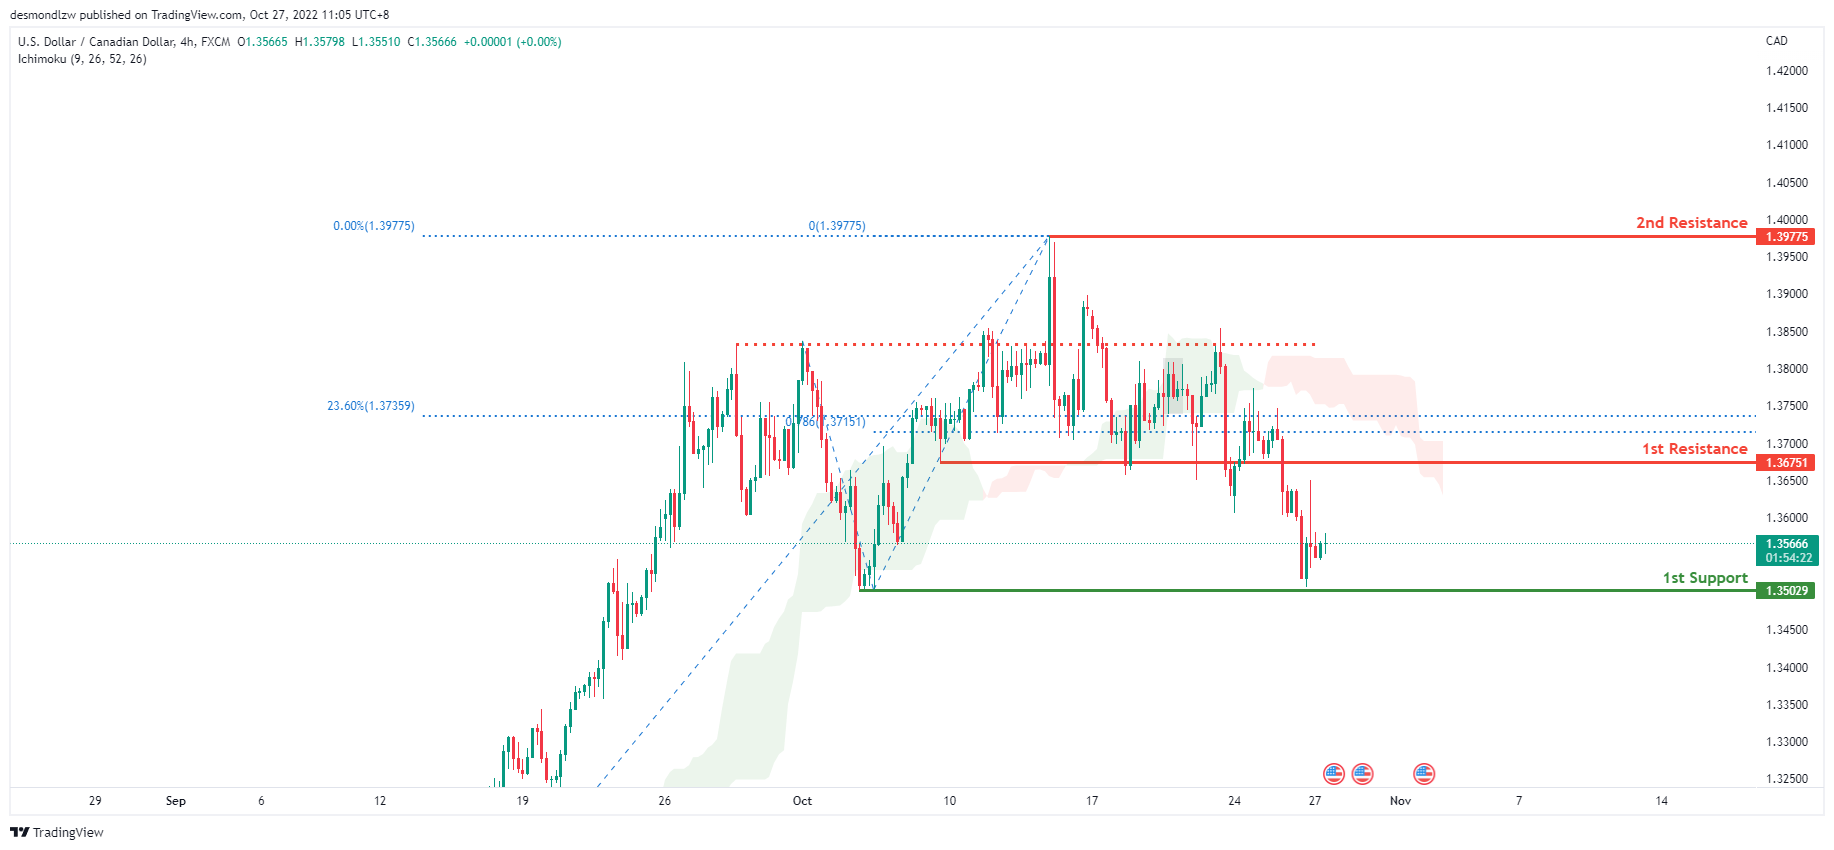
On the H4 chart, the overall bias for USDCAD is bearish. To add confluence to this, the price is below the Ichimoku cloud which indicates a bearish market. Overnight, price has continued its bearish momentum and is currently resting at the 1st support at 1.35029 where the previous low is. Expecting price to possibly rebound back up to retest the 1st resistance at 1.36751 where the 78.6% Fibonacci projection line and 23.6% Fibonacci line is located.
Areas of consideration:
- H4 time frame, 1st resistance at 1.36751
- H4 time frame, 1st support at 1.35029
OIL:
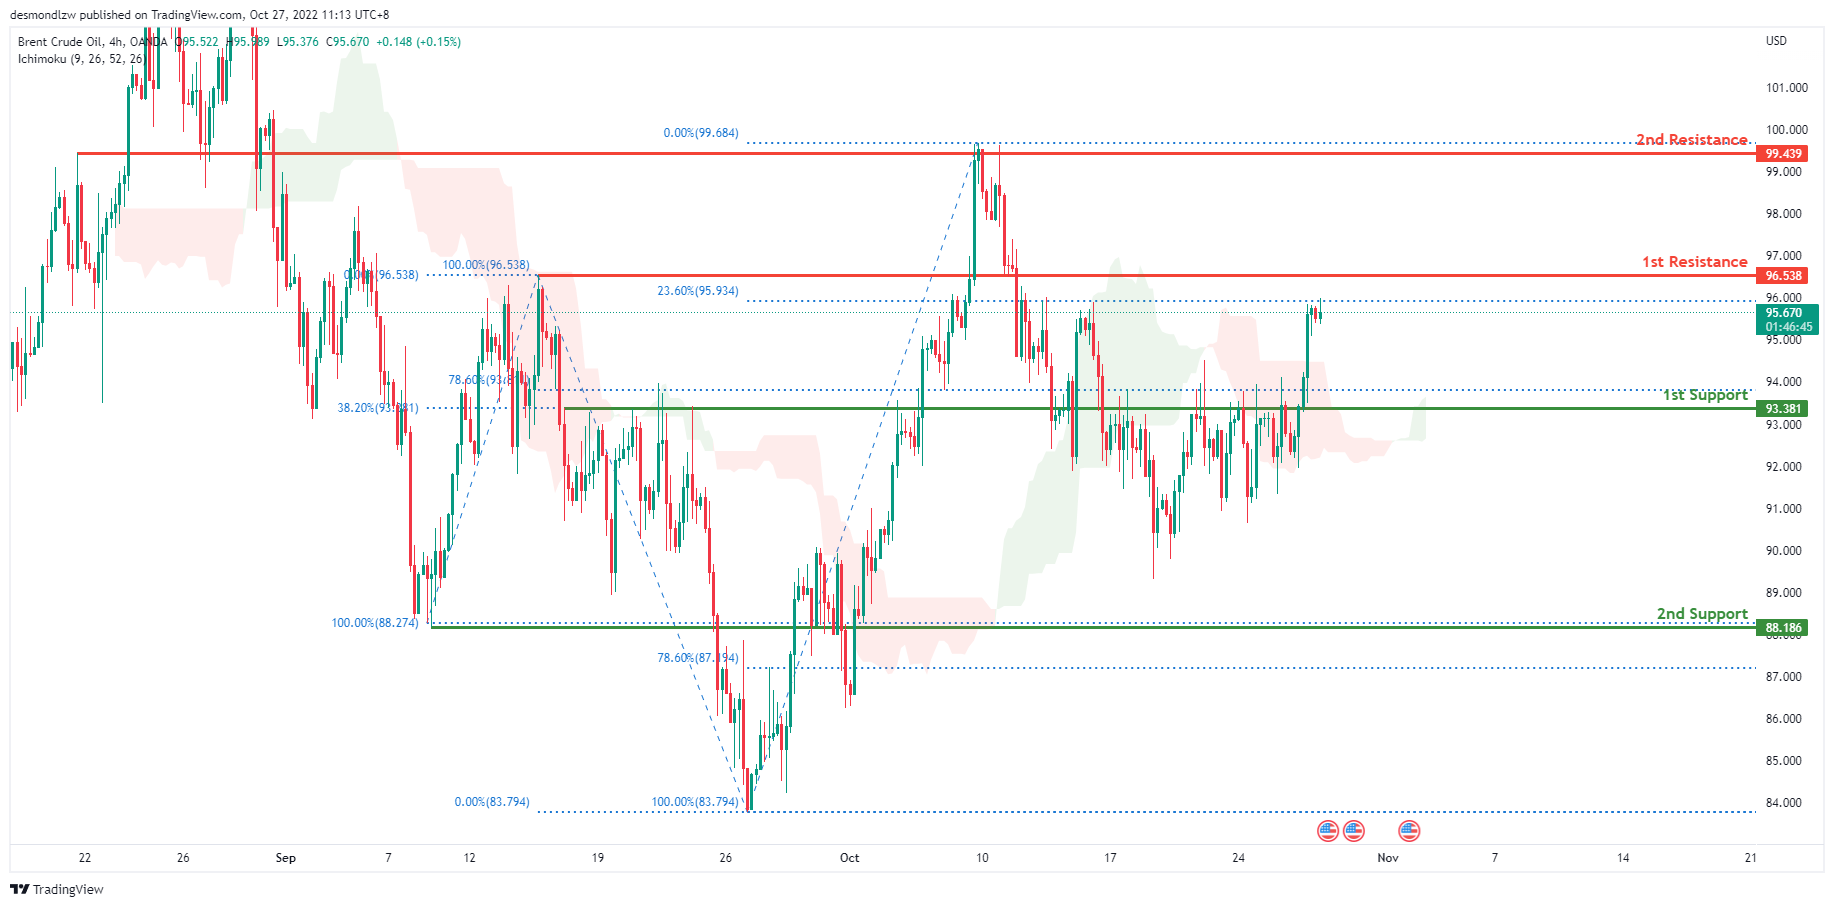
Looking at the H4 chart, the current overall bias for Oil is bullish. To add confluence to this, price is above the Ichimoku cloud which indicates a bullish market. Overnight the price went above the 1st support line at 93.381 where the 38.2% and 78.6% Fibonacci lines are located. Expecting the price to head towards the 1st resistance line at 96.538 where the 100% and 23.6% Fibonacci lines are located if this bullish momentum continues.
Areas of consideration:
- H4 time frame, 1st resistance at 93.381
- H4 time frame, 1st support at 93.381
Dow Jones Industrial Average:
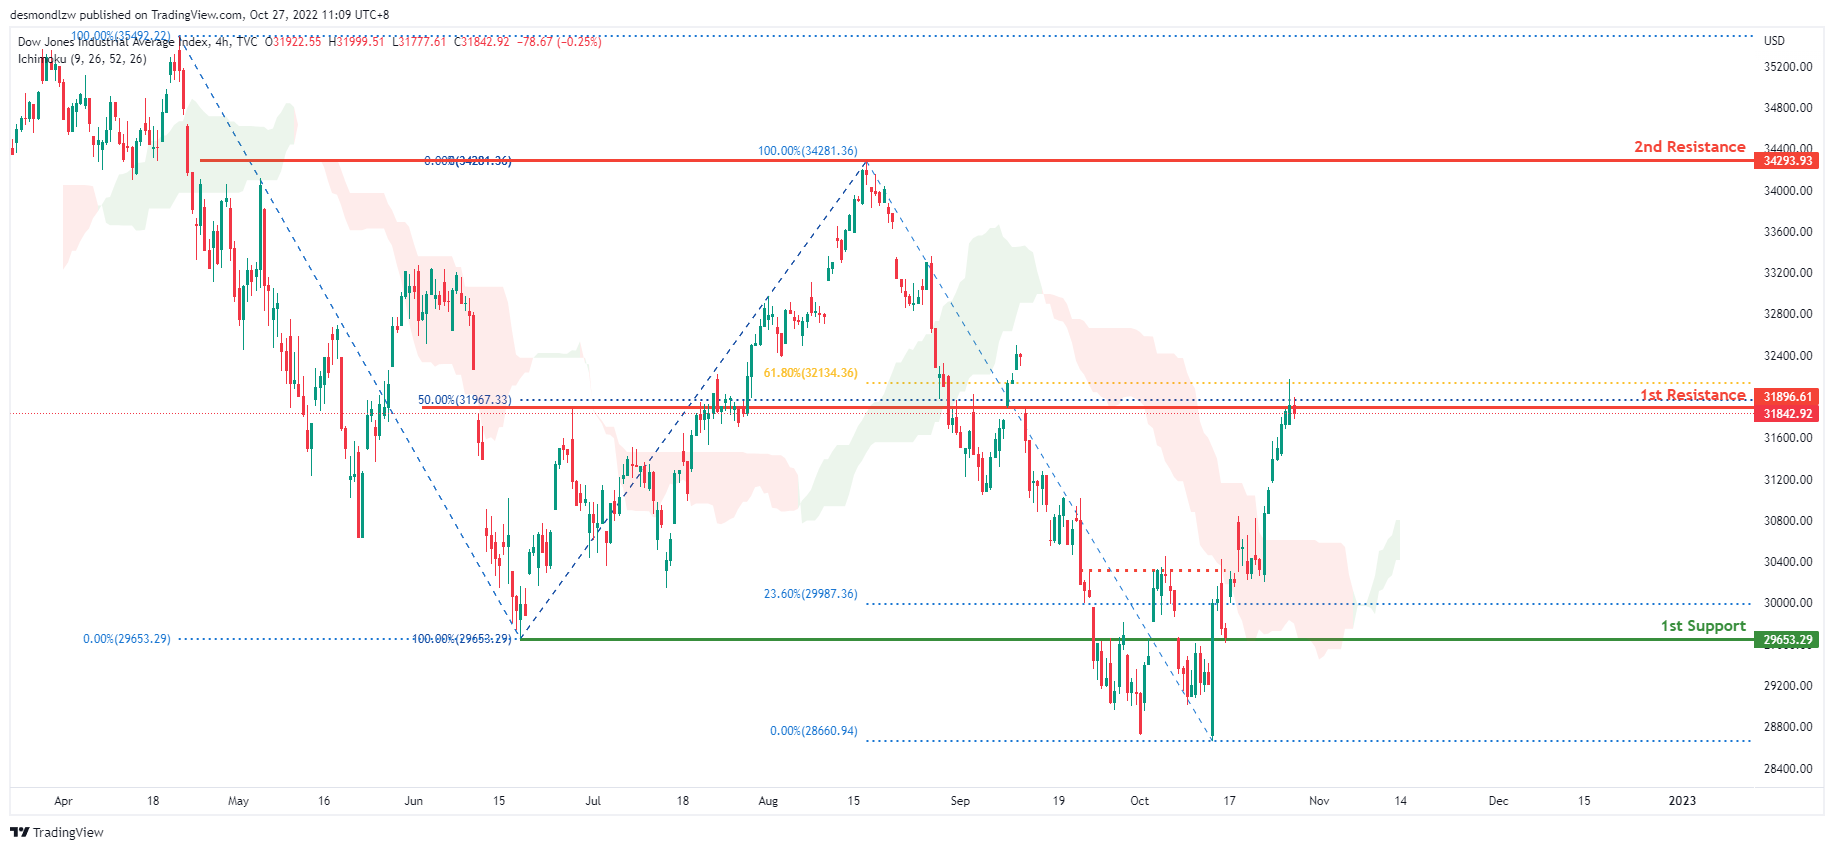
On the H4 chart, the overall bias for DJI is bullish. To add confluence to this, the price is above the Ichimoku cloud which indicates a bullish market. Overnight, price had massive bullish momentum upwards due to the weakening of the DXY. Price has tapped into the 1st resistance at 31896.61, where the 61.8% and 50% Fibonacci lines are and is currently resting under it. If this bullish momentum continues, expect price to possibly break above the 1st resistance at 31896.61 and head towards the 2nd resistance at 34293.93 where the previous swing high and 100% Fibonacci line is located.
Areas of consideration:
- H4 time frame, 1st support at 29653.29
- H4 time frame, 1st Resistance at 31896.61
- H4 time frame, 2nd Resistance at 34293.93
DAX:
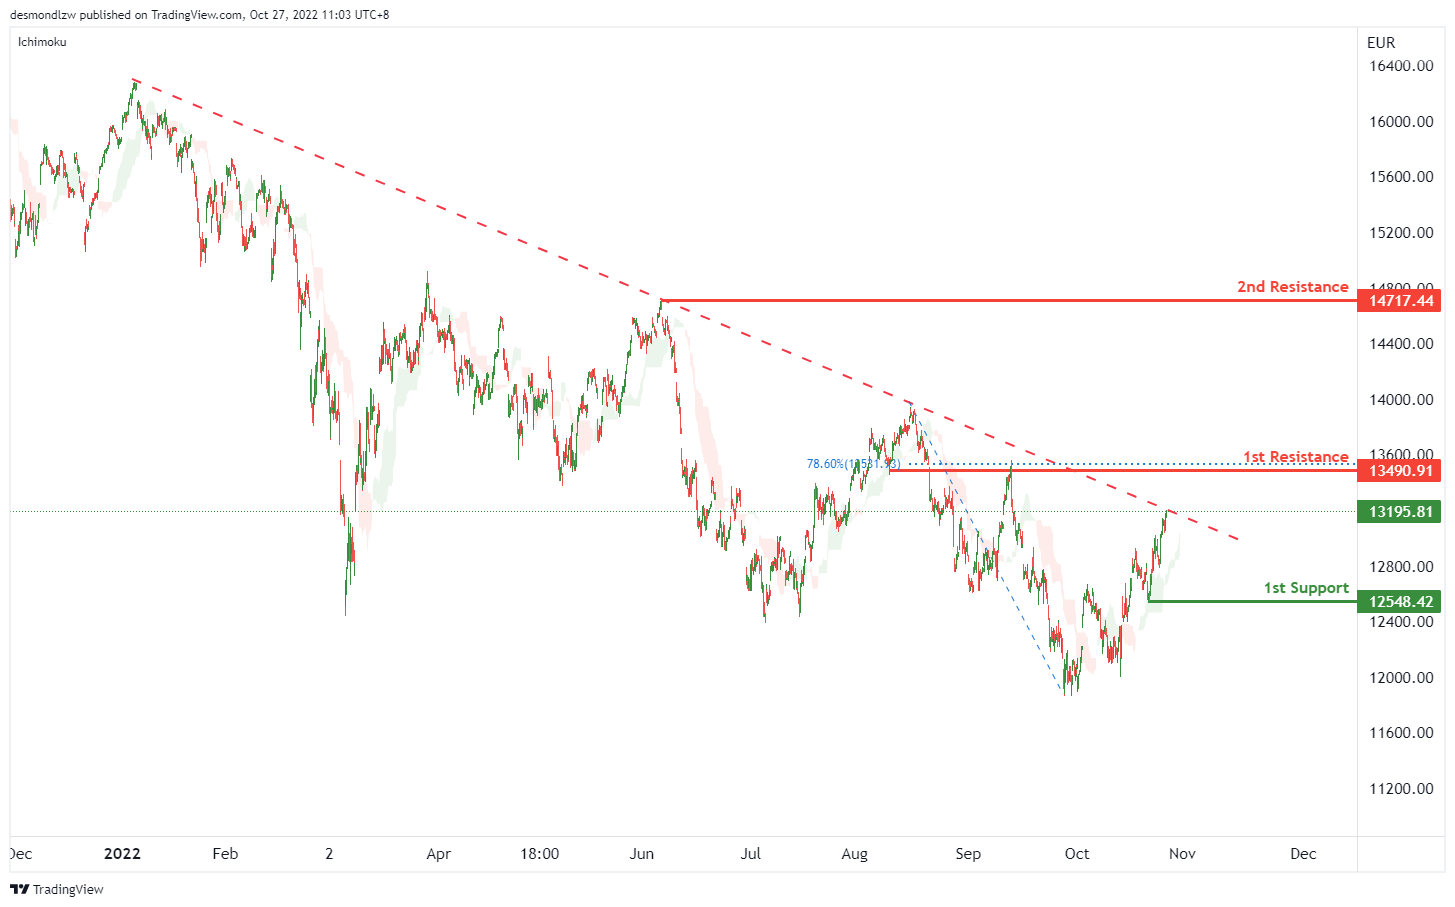
On the H4 chart, the overall bias for DAX is bearish. However, price has now closed above the Ichimoku cloud which indicates a change to bullish market momentum. Expecting price to possibly continue this bullish momentum and head towards the 1st resistance at 13490.91, where the 78.6% Fibonacci line is located. If the 1st resistance is broken, the 2nd resistance could be at 14717.44, which is in line with the previous swing high. Alternatively, the price may drop to the 1st support at 12548.42, which is in line with the swing low.
Areas of consideration:
- H4 time frame, current price
- H4 time frame, 1st resistance at 13490.91
ETHUSD:
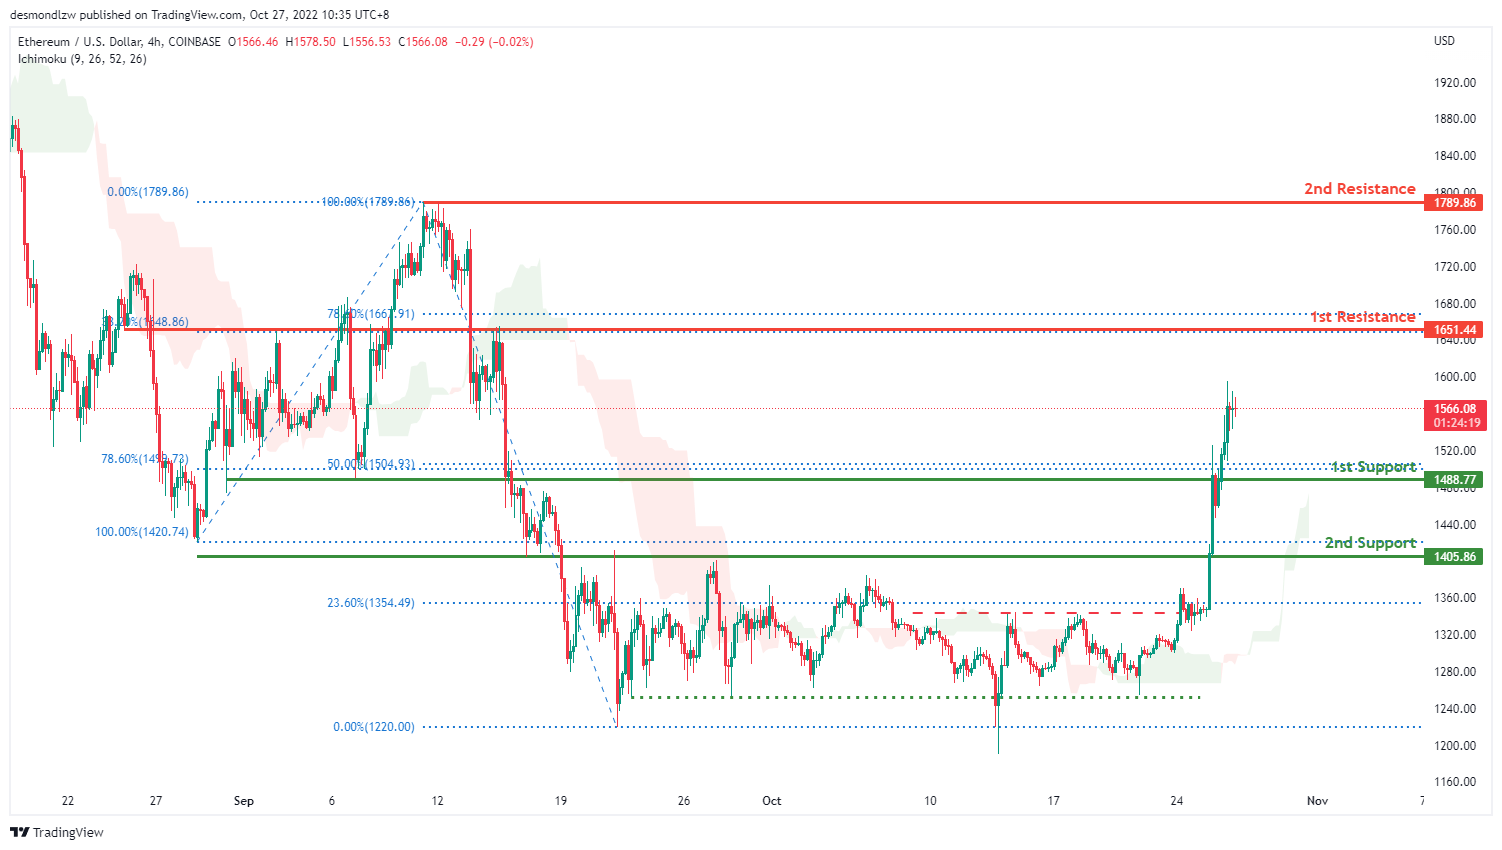
Looking at the H4 chart, the current overall bias for ETHUSD is bullish. Overnight, the price went above the 1st support at 1488.77 where the 78.5% and 50% Fibonacci lines are located. If this bullish momentum continues, expect the price to continue heading towards the 1st resistance at 1651.44 where the 78.6% and 38.2% Fibonacci lines are located.
Areas of consideration:
- H4 time frame, 1st resistance of 1651.44
- H4 time frame, 1st support at 1488.77
BTCUSD:
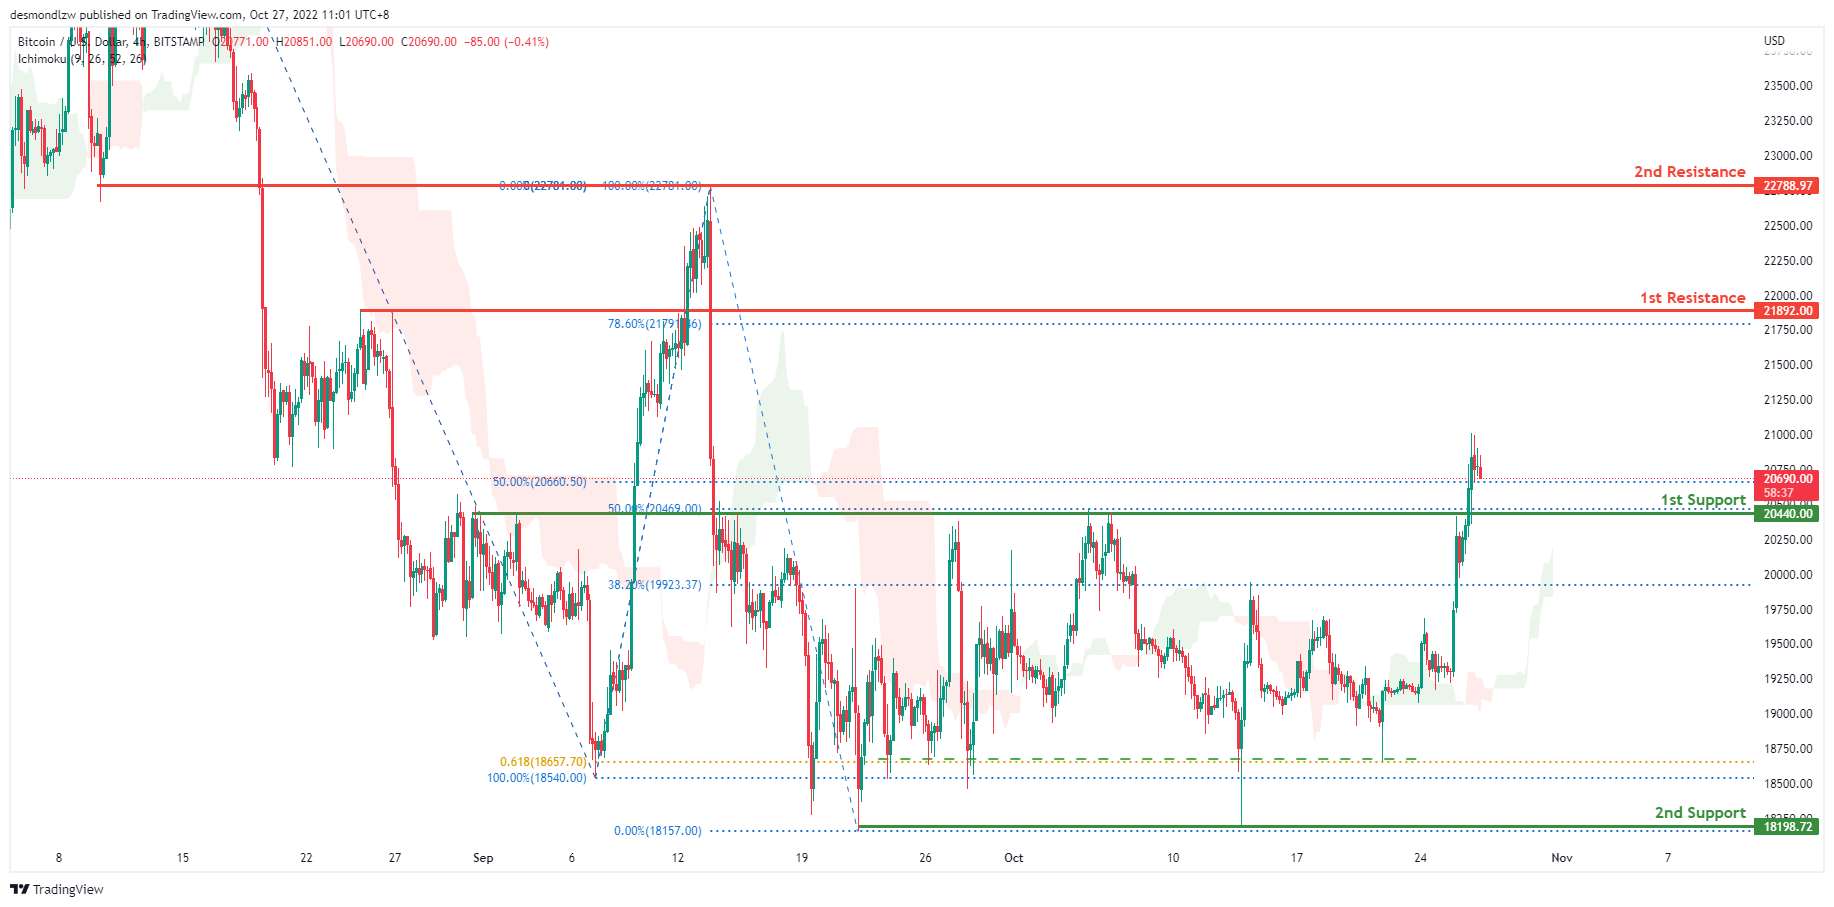
On the H4 chart, the overall bias for BTCUSD is bullish. To add confluence to this, the price is above the Ichimoku cloud which indicates a bullish market. Overnight, price has closed above the 1st support at 20440.00 where the 2 of the 50% Fibonacci lines are located. If this bullish momentum continues, expect price to head towards the 1st resistance at 21892.00, where the 78.6% Fibonacci line is located.
Areas of consideration:
- H4 time frame, 1st resistance 21892.00
- H4 time frame, 1st support at 20440.00
S&P 500:
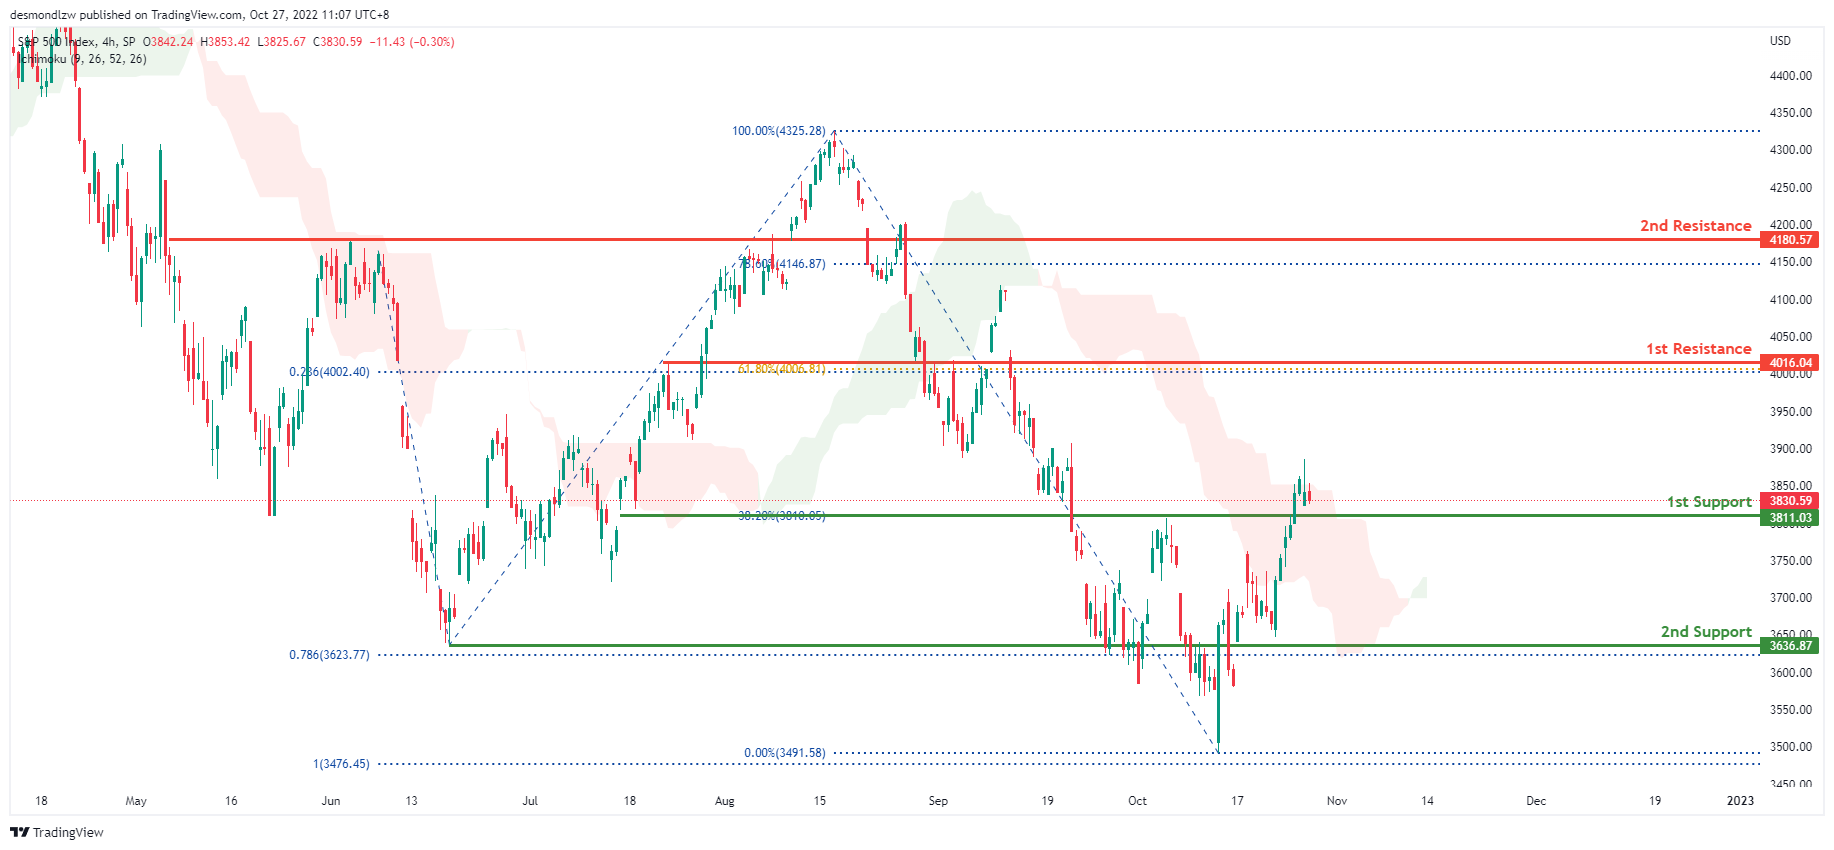
On the H4 chart, the overall bias for S&P500 is bearish. However due to the weakening of the DXY, S&P500 had bullish momentum during the course of this week. Overnight, price has consolidated above the 1st support at 3811.03 where the 38.2% Fibonacci line is located. If this bullish momentum continues, expect price to possibly head towards the 1st resistance at 4016.04 where the 61.8% Fibonacci line and 23.6% Fibonacci projection line is located.
Areas of consideration:
- H4 time frame, 1st support at 3811.03
- H4 time frame, 1st resistance at 4016.04
ECB to hike 75bps, EUR/CHF eyes parity
ECB is widely expected to raise interest rates by 75bps today. After that, the main refinancing rate will be at 2.00%, and the once negative deposit rate will be at 1.50%. President Christine Lagarde would signal that more tightening lies ahead, but the decision will stick to a meeting-by-meeting approach, and be data dependent.
There might be discussions on quantitative tightening, but it's still too soon to make a decision. The markets are expecting that concrete steps on shrinking the balance will only happen early next year.
Here are some previews on ECB:
- ECB Policy Meeting: Is More than a Rate Hike on the Table?
- ECB Preview: Everything You Need to Know
- What Can the ECB Do Now?
- ECB Preview – Focus on the Technicalities
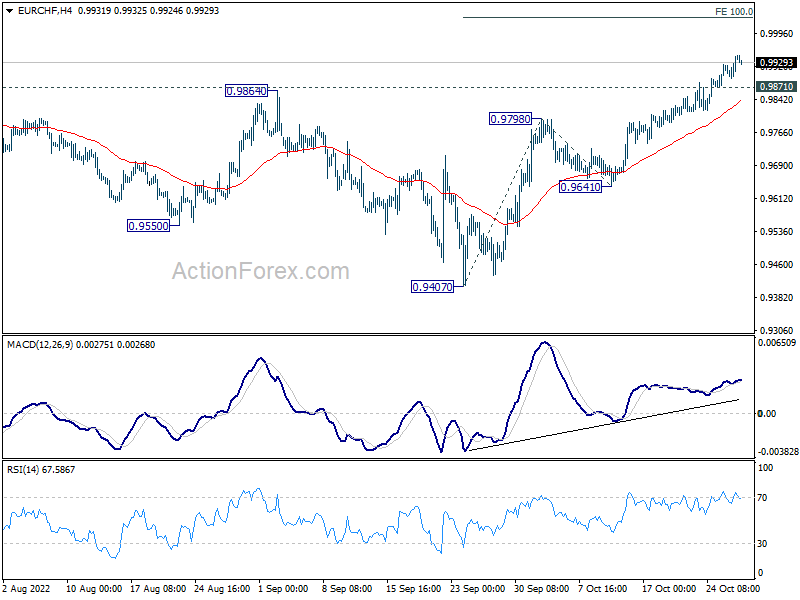
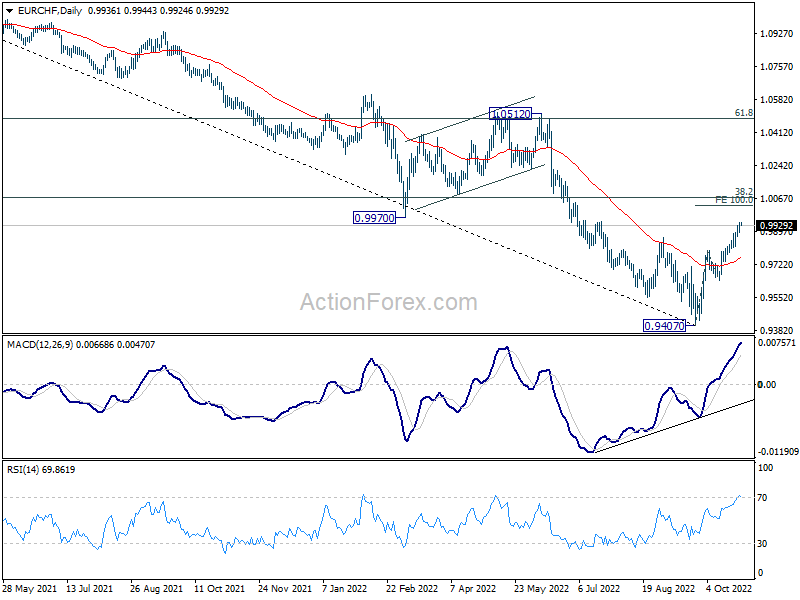
Regarding reaction to ECB decision, EUR/CHF is an interesting one to watch, as it's now eyeing parity. The cross was in persistent decline from June to September, after SNB surprisingly acted on interest rate earlier than ECB. Back then, ECB was still adjusting their forward guidance that rate hike would come weeks after stopping asset purchases. Now that ECB is catching up with global tightening pace, there is more upside prospect in the crosses.
While upside momentum in EUR/CHF is not too convincing for the moment, further rise is expected as long as 0.9871 minor support holds. Next target is 100% projection of 0.9407 to 0.9798 from 0.9641 at 1.0032. It's still too soon to judge whether rise from 0.9407 is a corrective bounce, or the start of an up trend. But in either case, stronger rally would be seen to 38.2% retracement of 1.1149 to 0.9407 at 1.0072. Reaction from there, as well as 55 week EMA (now at 1.0120) will reveal whether the trend is reversing.
RBNZ Orr: Employment prospects will be increasingly compromised by monetary tightening
RBNZ Governor Adrian Orr said in a speech that New Zealand's financial systems remains "well placed to support the economy", but there will be "stresses in business and amongst households as interest rates and asset prices adjust".
Regarding monetary policy objective, he emphasized, "we have our eyes firmly focused on meeting our inflation target". He also mentioned that inflation is still too high in an absolute sense."
"Central banks globally -- the Reserve Bank of New Zealand included -- are working to actively slow domestic spending by raising interest rates so as to constrain inflation," said Orr. "This means employment prospects will be increasingly compromised."
USD/CHF At Risk of More Losses, Oil Price Rises
Key Highlights
- USD/CHF started a fresh decline below the 1.0000 support.
- It traded below a major bullish trend line with support at 0.9980 on the 4-hours chart.
- Crude oil price climbed higher above the $88 resistance zone.
- The US Gross Domestic Product could grow 2.4% in Q3 2022 (Preliminary), up from -0.6%.
USD/CHF Technical Analysis
The US Dollar started a major decline after it failed to stay above the 1.0120 resistance against the Swiss France. USD/CHF traded below 1.0000 to move into a bearish zone.
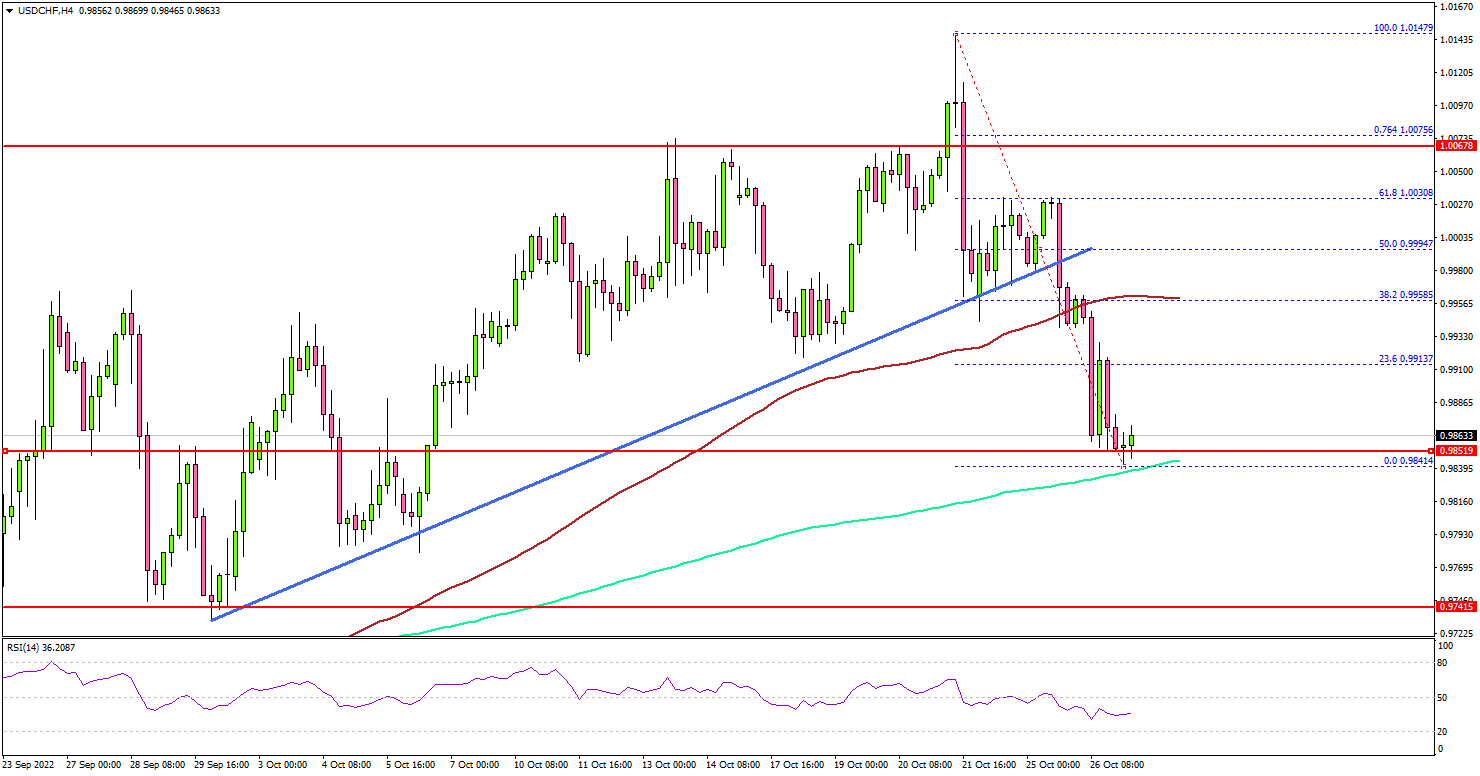
Looking at the 4-hours chart, the pair declined below the 0.9950 support zone and the 100 simple moving average (red, 4-hours). Moreover, there was a break below a major bullish trend line with support at 0.9980 on the same chart.
The pair even broke the 0.9920 support and traded as low as 0.9841. It is now consolidating losses above the 200 simple moving average (green, 4-hours).
An initial support is near the 0.9850 level and the 200 simple moving average (green, 4-hours). The next major support is near the 0.9800 zone. A downside break below the 0.9800 zone could push the pair further into a bearish zone.
On the upside, an immediate resistance is near the 0.9900 zone. The next major resistance may perhaps be near 0.9950 or the 100 simple moving average (red, 4-hours). Any more gains could set the pace for a move towards the 1.0000 level.
Looking at crude oil price, there was a steady increase above the $88 resistance and seems like there are chances of more upsides.
Economic Releases
- US Initial Jobless Claims - Forecast 220K, versus 214K previous.
- US Gross Domestic Product Q3 2022 (Preliminary) – Forecast 2.4% versus previous -0.6%.
- ECB Interest Rate Decision - Forecast 2.00%, versus 1.25% previous.
RBA Board to Raise the Cash Rate by 50bps on November 1
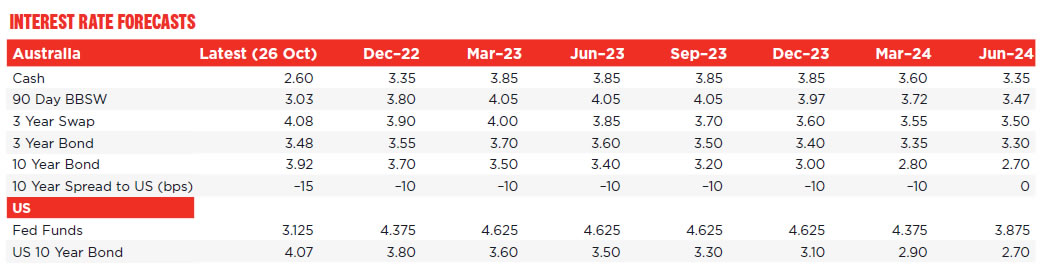
The September quarter inflation report has come as such a major surprise that we think the Reserve Bank Board will decide to raise the cash rate by 50bps at the next Board meeting on November 1.
The quarterly CPI print was an increase of 1.8% for the trimmed mean (the accepted measure for underlying inflation) well above market expectations of 1.5%. Annual trimmed mean inflation lifted to 6.1%yr. This is the highest quarterly and annual increase in underlying inflation since the ABS began producing estimates in 2002. Historical estimates compiled by the RBA show the quarterly rise is the biggest since 1988.
Of particular concern is the widening distribution of gains across Index components. We find that 90% of expenditure items have increased by 2.5% or more in the quarter. That compares with only 63% at the height of the mining boom.
During this period of rising inflation we have been most concerned about a strong inflationary psychology becoming entrenched in the Australian psyche. As this develops, businesses become more confident that they can raise their prices; consumers become more accepting of such action and see significant wage increases, in the context of tight labour markets, as necessary to compensate, sustaining the whole inflation process.
Evidence from the survey that pricing power is becoming widespread across expenditure items should be of considerable concern to an inflation-targeting central bank.
The Budget papers have raised the prospect of a 50%+ increase in electricity prices in 2023. This means inflation overall will remain more elevated and poses further pressures on inflation psychology.
The best way for the central bank to break this nexus is to adopt strong rhetoric and strong action.
The Board should also be concerned about the unusual nature of this cycle as the economy emerges from the pandemic. Labour markets are uncharacteristically tight while the household sector has accumulated significant savings which can buffer higher rates. Evidence from business surveys that business conditions and capacity utilisation are remarkably strong also point to unusual resilience.
We do not believe that the Board has backed itself into a corner with its surprise, lower than expected 25bp increase at the October meeting. Note the final paragraph in the October Board Minutes: "The size and timing of future interest rate increases will continue to be determined by the incoming data and the Board's assessment of the outlook for inflation and the labour market."
That provides ample justification for speeding up the pace of increases again in response to a significant upside shock to the inflation outlook.
It seems very likely that the RBA staff, which is providing a full update to forecasts for the November meeting, will be meaningfully lifting its inflation outlook.
We would also expect some stronger guidance from the RBA Governor's decision statement around the outlook. More emphasis on its clear determination to return inflation to the target is likely rather than the current message of a balancing act between achieving the target and keeping the economy 'on an even keel'. Perhaps the line "Members saw this path to achieving this balance as a narrow one clouded in uncertainty" may not figure in the narrative going forward.
The discussion on policy deliberations in the October Minutes pointed to a close-run decision between the 25bp path and continuing with another 50bp move with "finely balanced arguments."
In discussing the case for a 50bp move, the Board noted that: "Inflation was high, broadly based and expected to increase further" and that "If the Board were to reduce the size of the rate increase …. [T]his might in turn prompt an unhelpful reaction in inflation expectations".
The Governor clearly recognises the risks of embedding an inflationary psychology into the system.
We pointed out in a note "Unintended Consequences" (October 14) that there had been a significant lift in Consumer Sentiment and House Price Expectations following the decision to pivot to a 25bp move.
With markets and the media, to date, not embracing the prospect of a 50bp move in November there can be expected to be an appropriately adverse impact on Confidence to a decision to go by 50bps.
If the inflation report had been in line with expectations, then continuing the sequence of 25bp moves would have been appropriate. But not responding firmly to this genuine shock would risk the impression of a central bank that is less than fully committed to the inflation task.
This would risk further embedding a high inflation psychology into the Australian economy.
The level of interest rates does not appear to be a major issue for the Board.
When considering the October decision the Board described the cash rate, which at the time was 2.35%, as "not at an especially high level." With the rate now at 2.6% there is still genuine uncertainty as to whether the Board views that level as above 'neutral'.
The Governor has referred to 'neutral' as a positive real cash rate with the nominal component being assessed as 2.5% – a nominal cash rate above 2.5%.
A recent speech by Assistant Governor Ellis set out the RBA's estimates of neutral in more detail – the conclusion from nine separate models used to generate estimates is that the average neutral rate appeared to be around 1% real or 3.5% nominal. But the Assistant Governor did emphasise that the neutral concept was most useful as a long-term guide and was not applied mechanistically to policy, along the lines of the 'short term' and 'long term' real concept deployed at one point by the Federal Reserve.
A decision to push the cash rate to 3.1% would certainly, in our view, put policy firmly in contractionary territory but the academic discussion is not definitive.
The Board decision to only raise rates by 25bp in October was also partly to assess the effect of the significant cumulative increase to date. Without the inflation shock that was a defensible position but given the risks to inflation psychology we have set out above, that strategy seems to be no longer appropriate.
Looking forward, after the 50bp move in November we expect a further 25bp move in December but with no meeting scheduled for January there will be a two month break to provide some time to assess the cumulative impact of rapid rate increases.
By the time of the February meeting, the Board will have raised the cash rate by only 25bps over the previous three months since the November move – an adequate and appropriate break.
We were impressed with the argument in the October Minutes that: "Dragging out policy adjustments would also help to keep public attention focussed for a longer period on the Bank's resolve to meet the inflation target." That is a reasonable view in a context where inflation is gradually easing while remaining above the target but not when inflation, as we saw in the latest report, is surging.
The wording in the Minutes gave more prominence to the global economy than we had seen in the past. The concluding paragraph noted that: "The Board will continue to monitor the global economy, household spending, and wage and price setting behaviour."
Recall that the meeting was held at a time of the huge volatility in financial markets associated with reactions to the UK minibudget. Those concerns have largely settled down. Recent GDP data out of China has also exceeded market expectations. While there will no doubt continue to be justifiable global concerns, the immediate issues that were likely to have framed the Board in October have eased.
We obviously have considerable concerns about the eventual impact of these policies on Australians. Without doubt the Reserve Bank shares those views.
But globally, central banks have correctly signalled the overwhelming need to rein in inflation pressures – a delay in achieving that objective will only lead to unnecessary additional pain further down the road – as Australia experienced during the deep recession of the early 1990s following its failure to address the inflation issue during the 1980s.
The inflation report has clearly highlighted that Australia is not different to other countries. Inflation in Australia looks set to exceed US inflation by the end of the year.
The RBA faces the same inflation challenges as other central banks.
A decision to speed up the rate hike cycle in November is the appropriate action.
EURUSD Wave Analysis
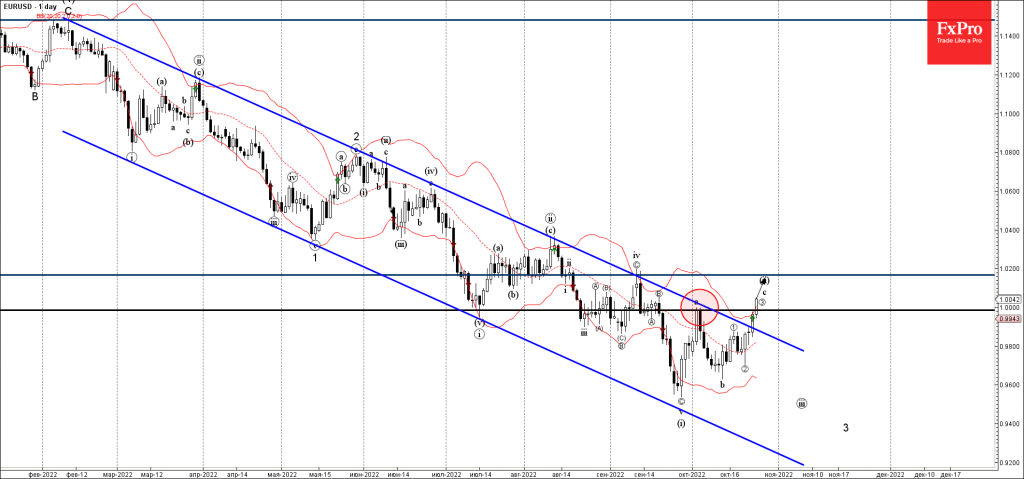
- EURUSD broke key resistance level 0.9985
- Likely to rise to resistance level 1.0165
EURUSD recently broke the key resistance level 0.9985 (top of the previous short-term wave (a) from the start of October).
The breakout of the resistance level 0.9985 was preceded by the breakout of the extended down channel from February – which accelerated the active short-term impulse wave (c).
EURUSD can be expected to rise further toward the next resistance level 1.0165 (monthly high from September and the target for the completion of the active wave (c)).
EUR/USD Punches above Parity, ECB Next
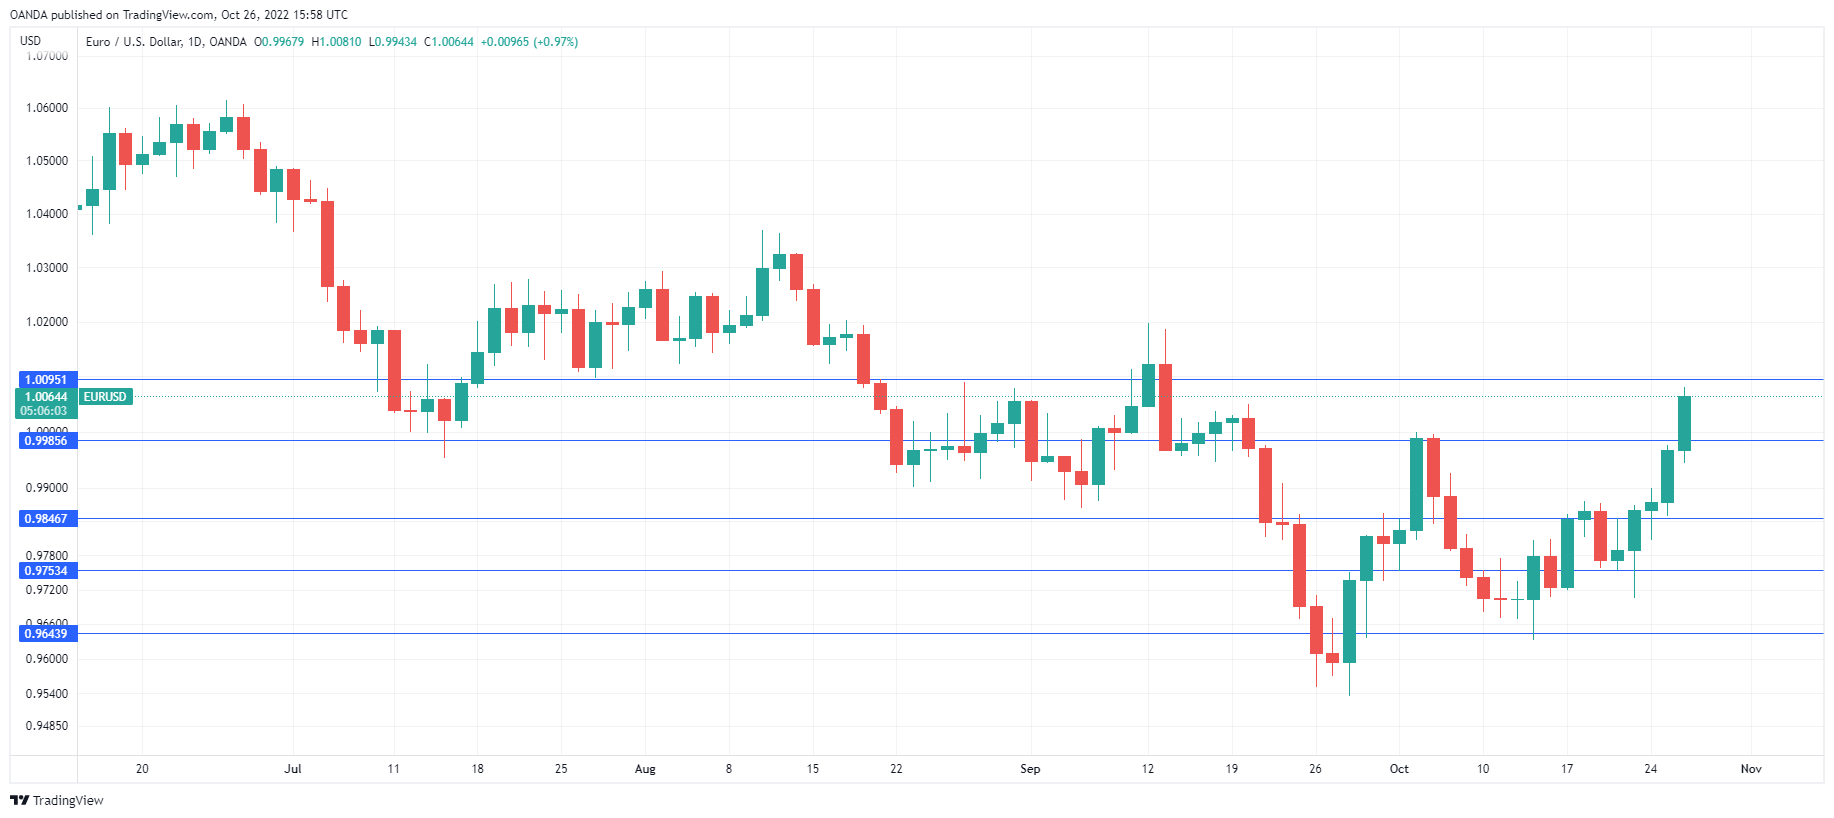
EUR/USD continues to power forward and has breached the parity line for the first time since September 20th. The euro is red hot, having gained 2.1% this week, as the US dollar has hit a bump in the road and is lower against all the major currencies. In the North American session, EUR/USD is trading at 1.0069, up 1.02%.
The German economy, the largest in the eurozone, continues to show signs of weakness. September PMIs pointed to contraction in manufacturing and business activity, and these are unlikely to rebound as the Ukraine war continues and an energy crisis looms, with winter close by. The Ifo Business Confidence index fell for a fourth straight month in October and GfK Consumer Sentiment, which will be released tomorrow, is expected to remain deep in negative territory.
ECB expected to hike by 0.75%
The ECB meets on Thursday, with policy makers having to contend not only with a gloomy economic outlook in the eurozone, but also with spiralling inflation, with no sign of a peak. Eurozone CPI jumped to 9.9% in September, up sharply from the 9.1% rise in August. The markets have priced in a supersize 0.75% hike, which would bring the cash rate to 2.0% and investors will be looking for the Bank to declare its commitment to bring inflation back to the 2% target.
A jumbo full-point increase remains a slight possibility, given that inflation is close to double-digits. Investors will be monitoring the follow-up press conference, and the euro’s direction tomorrow could depend on ECB President Lagarde’s message to the markets. If Lagarde signals that further rate hikes are coming, the euro will likely gain ground. Conversely, a dovish stance from Lagarde could cut short the euro’s rally.
EUR/USD Technical
- EUR/USD has broken above 0.9846 and is testing resistance at 0.9985. The next resistance line is 1.0095
- There is support at 0.9753 and 0.9643
BoC’s Smaller-than-Expected Rate Hike Not Crushing CAD
There was an important signal today that monetary authorities in North America are ready to ease the pace of policy tightening faster than the market expects.
The Bank of Canada raised the rate by 50 points to 3.75%, although analysts, on average, predicted a repeat of September’s move with a 75-point hike. While the Bank of Canada’s commentary on the decision pointed to the need for further rate hikes, there is no getting around the fact that the central bank is now more concerned with fine-tuning its policy rather than chasing fleeing prices.
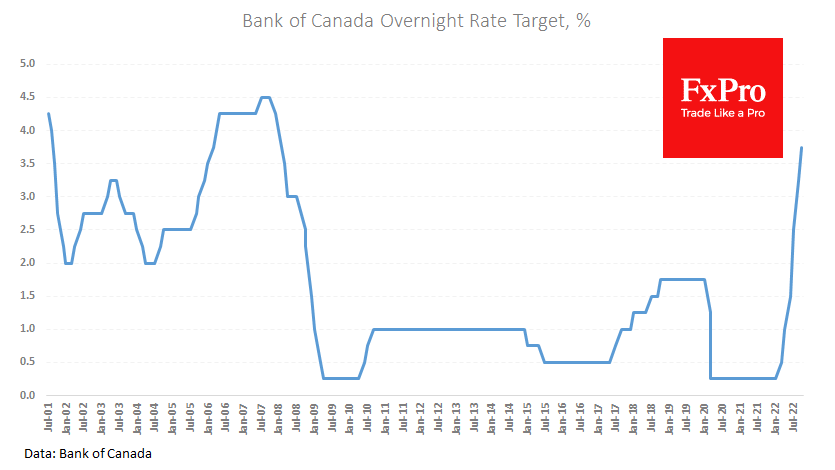
The Bank has noted a slowdown in consumer price growth from 8.1% to 6.9% over the last three months. The situation in the USA is not much different, with inflationary pressures also declining. However, the fundamental difference is that the expensive dollar raises inflation elsewhere and reduces it in the USA. Hence, a more fine-tuning phase becomes more relevant for the Fed, too.
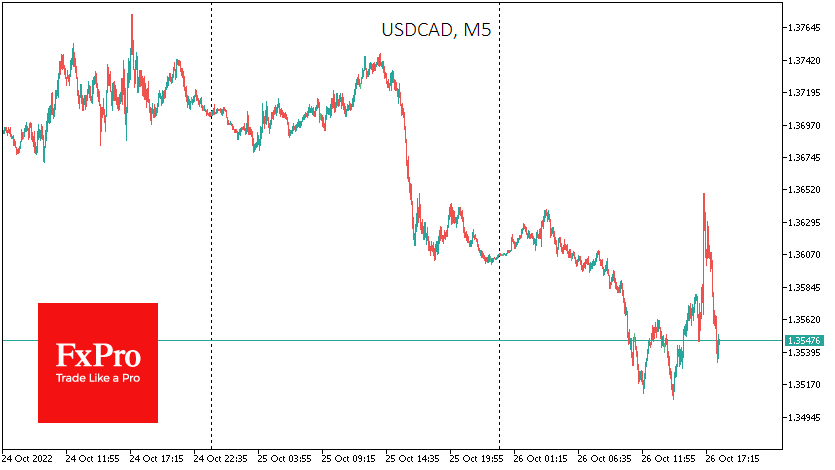
The USDCAD reaction is also very indicative. From the highs near 1.3650, where the robots pushed the pair in the first moments after the release, it has rolled back 0.8% to 1.3540 in just over an hour. As a reminder, just three months ago, raising the rate less than the Fed was practically dooming the currency to fall. However, today the USDCAD is retesting October lows.
BoC’s Half Point Hike Suggests Peak is Near
- BoC dials back tightening pace with below-consensus 50 bp hike to 3.75%
- Statements says rates expected to rise further but getting closer to end of tightening phase
- BoC sees economy stalling in coming quarters
The BoC dialed back the pace of its tightening cycle today with a 50 bp increase that fell short of market expectations and consensus for another 75 bp hike. We were in the minority anticipating a half point increase, with a deteriorating global backdrop, slowing domestic growth, early signs of a softening labour market, and faster-than-expected decline in headline inflation all supporting a slower pace of rate hikes. These factors apparently outweighed concerns about a weakening Canadian dollar (ahead of a likely 75 bp hike by the Fed next week), sticky core inflation and only modest improvement in inflation expectations. For all the concerns about the currency, this morning’s dovish surprise hasn’t had a sustained impact on the Canadian dollar, though government bond yields are down sharply.
With today’s smaller-than-expected rate increase, the BoC has entered the late stages of what has been a historically rapid tightening cycle. While we are “not there yet,” Governor Macklem made clear that we are getting closer to the end of the BoC’s tightening phase. He also said the BoC is “trying to balance the risks of under- and over-tightening,” suggesting a more even-handed approach than in recent months. Today’s dovish pivot supports our view that the BoC will continue to taper its tightening cycle into year end with a 25 bp increase in December leaving the terminal rate at 4%. Risks around that forecast are still skewed to the upside—indeed, Macklem seemed to frame next meeting’s debate as 25 vs. 50 bps—and we think the BoC will want to see further easing in monthly core inflation measures and inflation expectations to pause at 4%.
Justifying what is still an outsized rate increase, the BoC continued to emphasize high and broadly-based inflation and domestic price pressures stemming from excess demand and tight labour market conditions. But at the same time (and consistent with our assessment above) the policy statement noted a challenging global growth backdrop and evidence that policy tightening is slowing domestic activity beyond its early impact on housing. GDP growth is now projected to “essentially stall” in the coming quarters. While the BoC isn’t using the r-word, it acknowledged “a couple of quarters with growth slightly below zero is just as likely as a couple of quarters with small positive growth.” That might be as close as the central bank will come to calling a recession until we’re actually in one. While the BoC cut its 2023 growth forecast in half to 0.9%, that’s still well above our 0.2% projection.