Sample Category Title
NZDUSD Eyes a Bullish Break; Caution Required
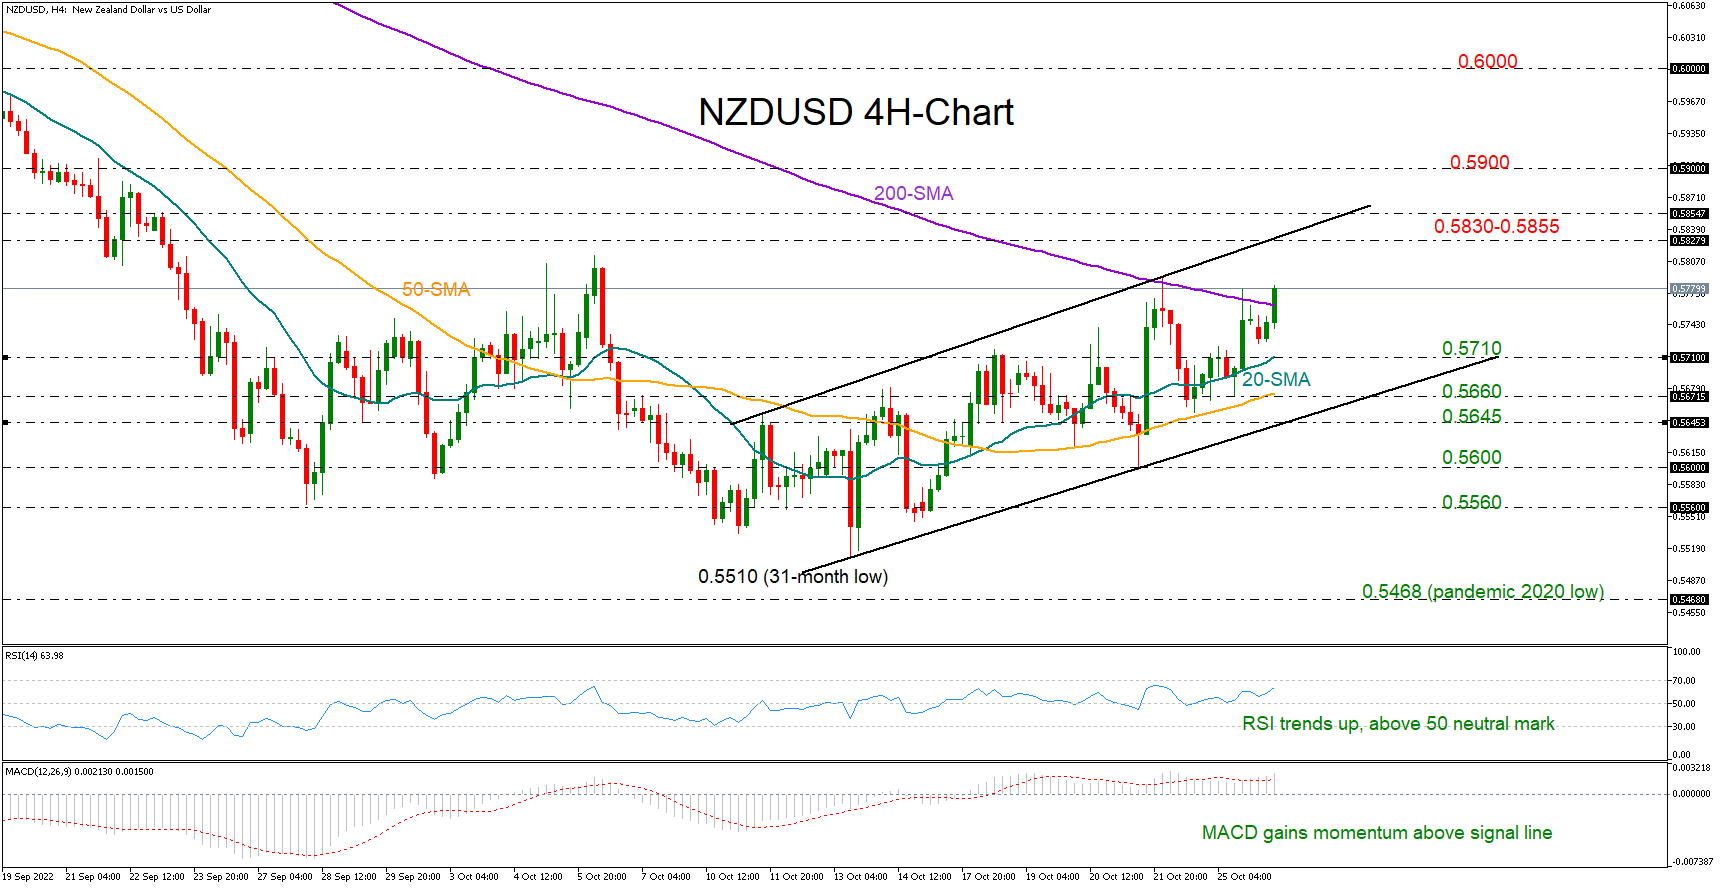
NZDUSD is testing the 200-period simple moving average (SMA) in the four-hour chart for the first time since August at 0.5764.
The pair has been gently trending up following the drop to 0.5510, the lowest since March 2020. From a technical perspective, the positive trajectory in the RSI and the MACD is signaling additional gains ahead, though any advances could prove limited if the channel’s upper boundary halts the recovery within the 0.5830-0.5860 region. The 0.5900 psychological mark might be another hurdle, preventing a sharp rally to 0.6000.
Should selling pressures resurface, pushing the price below the 200-period SMA, the 20-period SMA could immediately come to the rescue at 0.5710. Slightly lower, the pair may retest the 50-period SMA around 0.5660 before meeting the channel’s lower band near 0.5645. If the latter gives way, the decline could pick up steam towards the 0.5600-0.5560 restrictive area.
In brief, NZDUSD has the potential for more upside in the coming sessions, with traders awaiting a clear close above the 200-period SMA to raise their buying orders. Yet, whether any advance will be sustainable remains to be seen.
USDJPY Fails to Improve Bullish Outlook But Still Above 20-day SMA
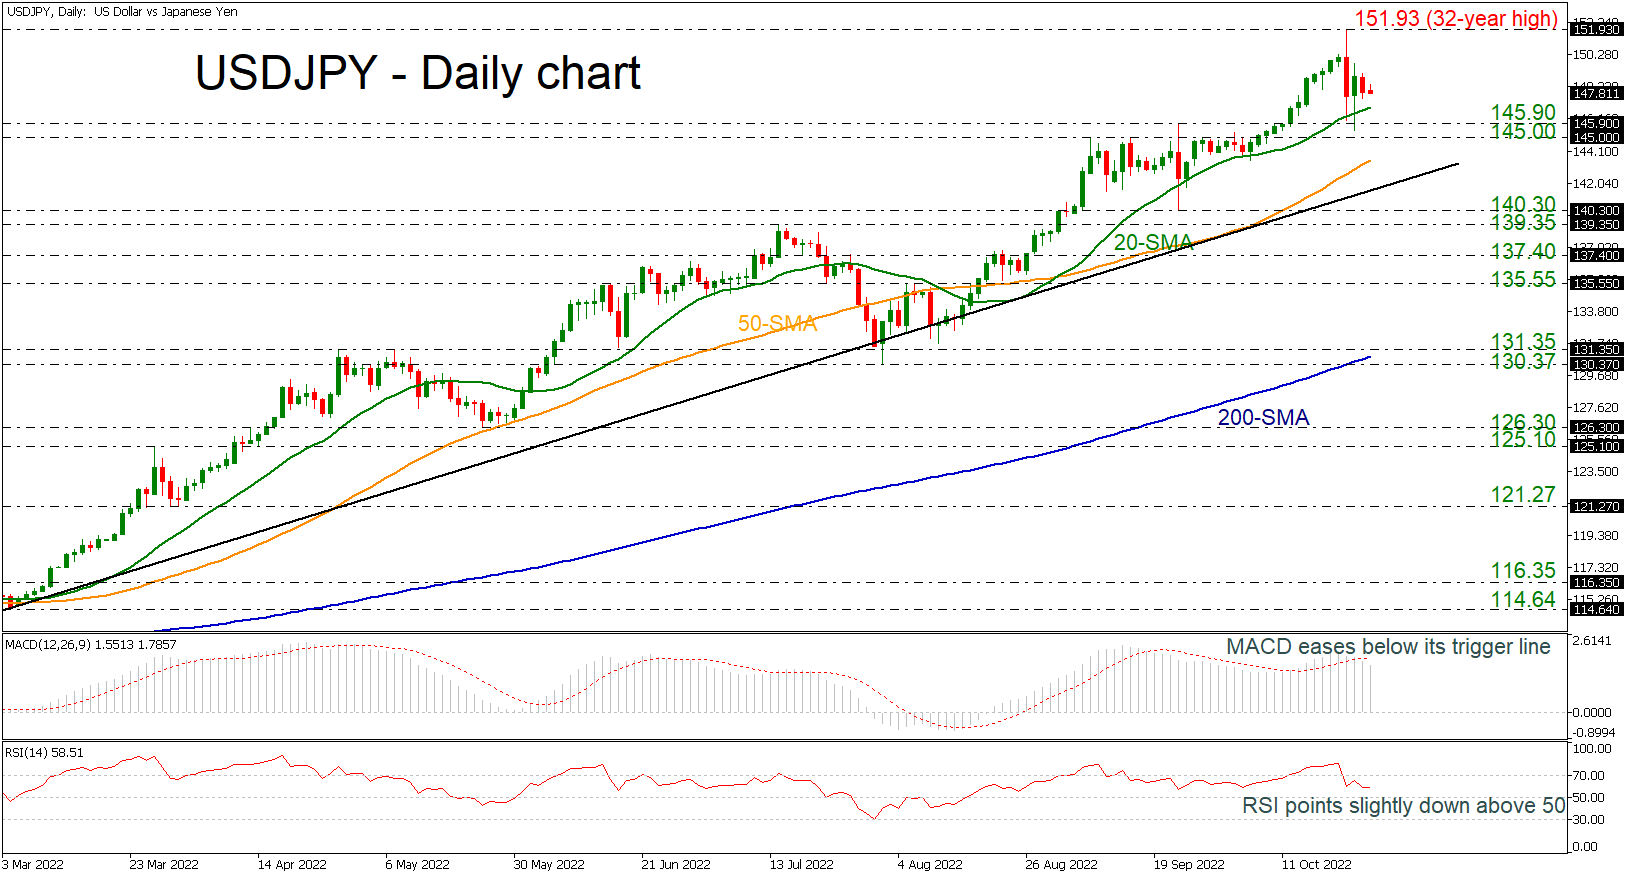
USDJPY is losing some momentum after the rally towards the fresh 32-year high of 151.93 in the very near-term. However, the market is still rebounding on the 20-day simple moving average (SMA), confirming the long-term bullish outlook.
According to the technical indicators, the MACD is heading south below its trigger line in the positive region, while the RSI is pointing downwards after the sharp advance towards the overbought area. In trend indicators, the 20- and 50-day simple moving averages (SMAs) are following the current market action.
The 151.93 resistance could be a trigger point for steeper bullish action if the pair manages to break the line. This is also slightly below the next psychological mark of 152.00 and hence should attract some attention. Higher, resistance could run towards the next round numbers such as 153.00 and 154.00.
However, if the pair reverses to the downside and dive beneath the 20-day SMA, investors could put a stop first at the 145.90 support and then at 145.00. If the price continues to drop, support could next come somewhere near the 50-day SMA, which overlaps with the 143.45 barrier before the focus shifts to the long-term ascending trend line around the 142.00 barrier.
In the short-term picture, the fall from the multi-year high is shifting the bias to neutral. Chances for another bullish move are still rising in the medium- and long-term timeframes as the 200-day SMA keeps rising and the pair holds well above it.
What Can the ECB Do Now?
Tomorrow the ECB meets for its latest policy assessment. The consensus among economists is that there will be a hike of 75bps, and the market appears to be pricing it in. Therefore, the reaction in the currency pairs might be minimal, since over two-thirds of the surveyed economists agreed. Those who didn't were split between 50bps and 100bps, with the midpoint at 75.
That means markets are likely to be looking beyond the current meeting, with expectations around what happens in December likely the key to how the pairs perform. The Euro has fallen respect to the dollar for two major reasons: The ECB has been much slower to raise rates, and inflation has gone higher in the shared economy. That means the real interest rate spread has continued to grow. With the Fed expected to raise rates another 75bps as well, the ECB has to keep pace in order to keep the Euro from falling. It would have to do something more than that to lift the shared currency.
What can make a stronger euro?
The thing is, a stronger Euro would help the ECB reach its targets in the current circumstances. Almost half of the inflation experienced in Europe is because of the high price of fuel - which is priced in dollars. A stronger Euro would help reduce the impact of inflation from that source. It would also help reduce the cost of other imports. Of course, on the other hand, it would make exports more difficult, but the Euro is near lows it hasn't seen for more than a couple of decades.
However, that's unlikely to be a consideration for policy; merely a potential beneficial side effect. The ECB is dealing with another problem, and that is so called "excess liquidity". Investors have been staying on the sidelines given the uncertainty in Europe. And considering how little bonds pay, they aren't rushing to buy up debt. With inflation expected to remain high for an extended period of time, but interest rates not forecast to rise to compensate, it's just not a sound investment to buy Eurobonds (compared to other currencies).
What to look out for
The ECB is expected to address this issue during the meeting, and look for another mechanism to mop up this "extra cash" that's contributing to higher inflation. One of them is quantitative tightening, which is to sell bonds that the ECB has bought up. This would be expected to force up market interest rates, and encourage investors to take on more debt.
However, Lagarde has insisted this won't happen until the ECB has reached its neutral rate, meaning it's unlikely to be implemented just yet. However, a change in rhetoric around the possibility of QT - for example, that it's not necessary to reach the neutral rate - might change the calculus of the market. It's not likely to be enough to push the Euro substantially higher, but it could set the groundwork for that to happen later in the year.
The other option is to take a more definitive stance on what's called the "terminal rate" or the rate at which the ECB will taper off hikes. So far, officials have talked about reaching 2.0% by the end of the year. With 75bps expected tomorrow, that means just 50bps in December. But if members were to talk about a higher terminal rate, it could get bond yields to rise as well. But, again, that would be more setting the groundwork for future actions, in a very uncertain environment.
USD/CHF: The Final Leg of the Ending Diagonal is Under Development
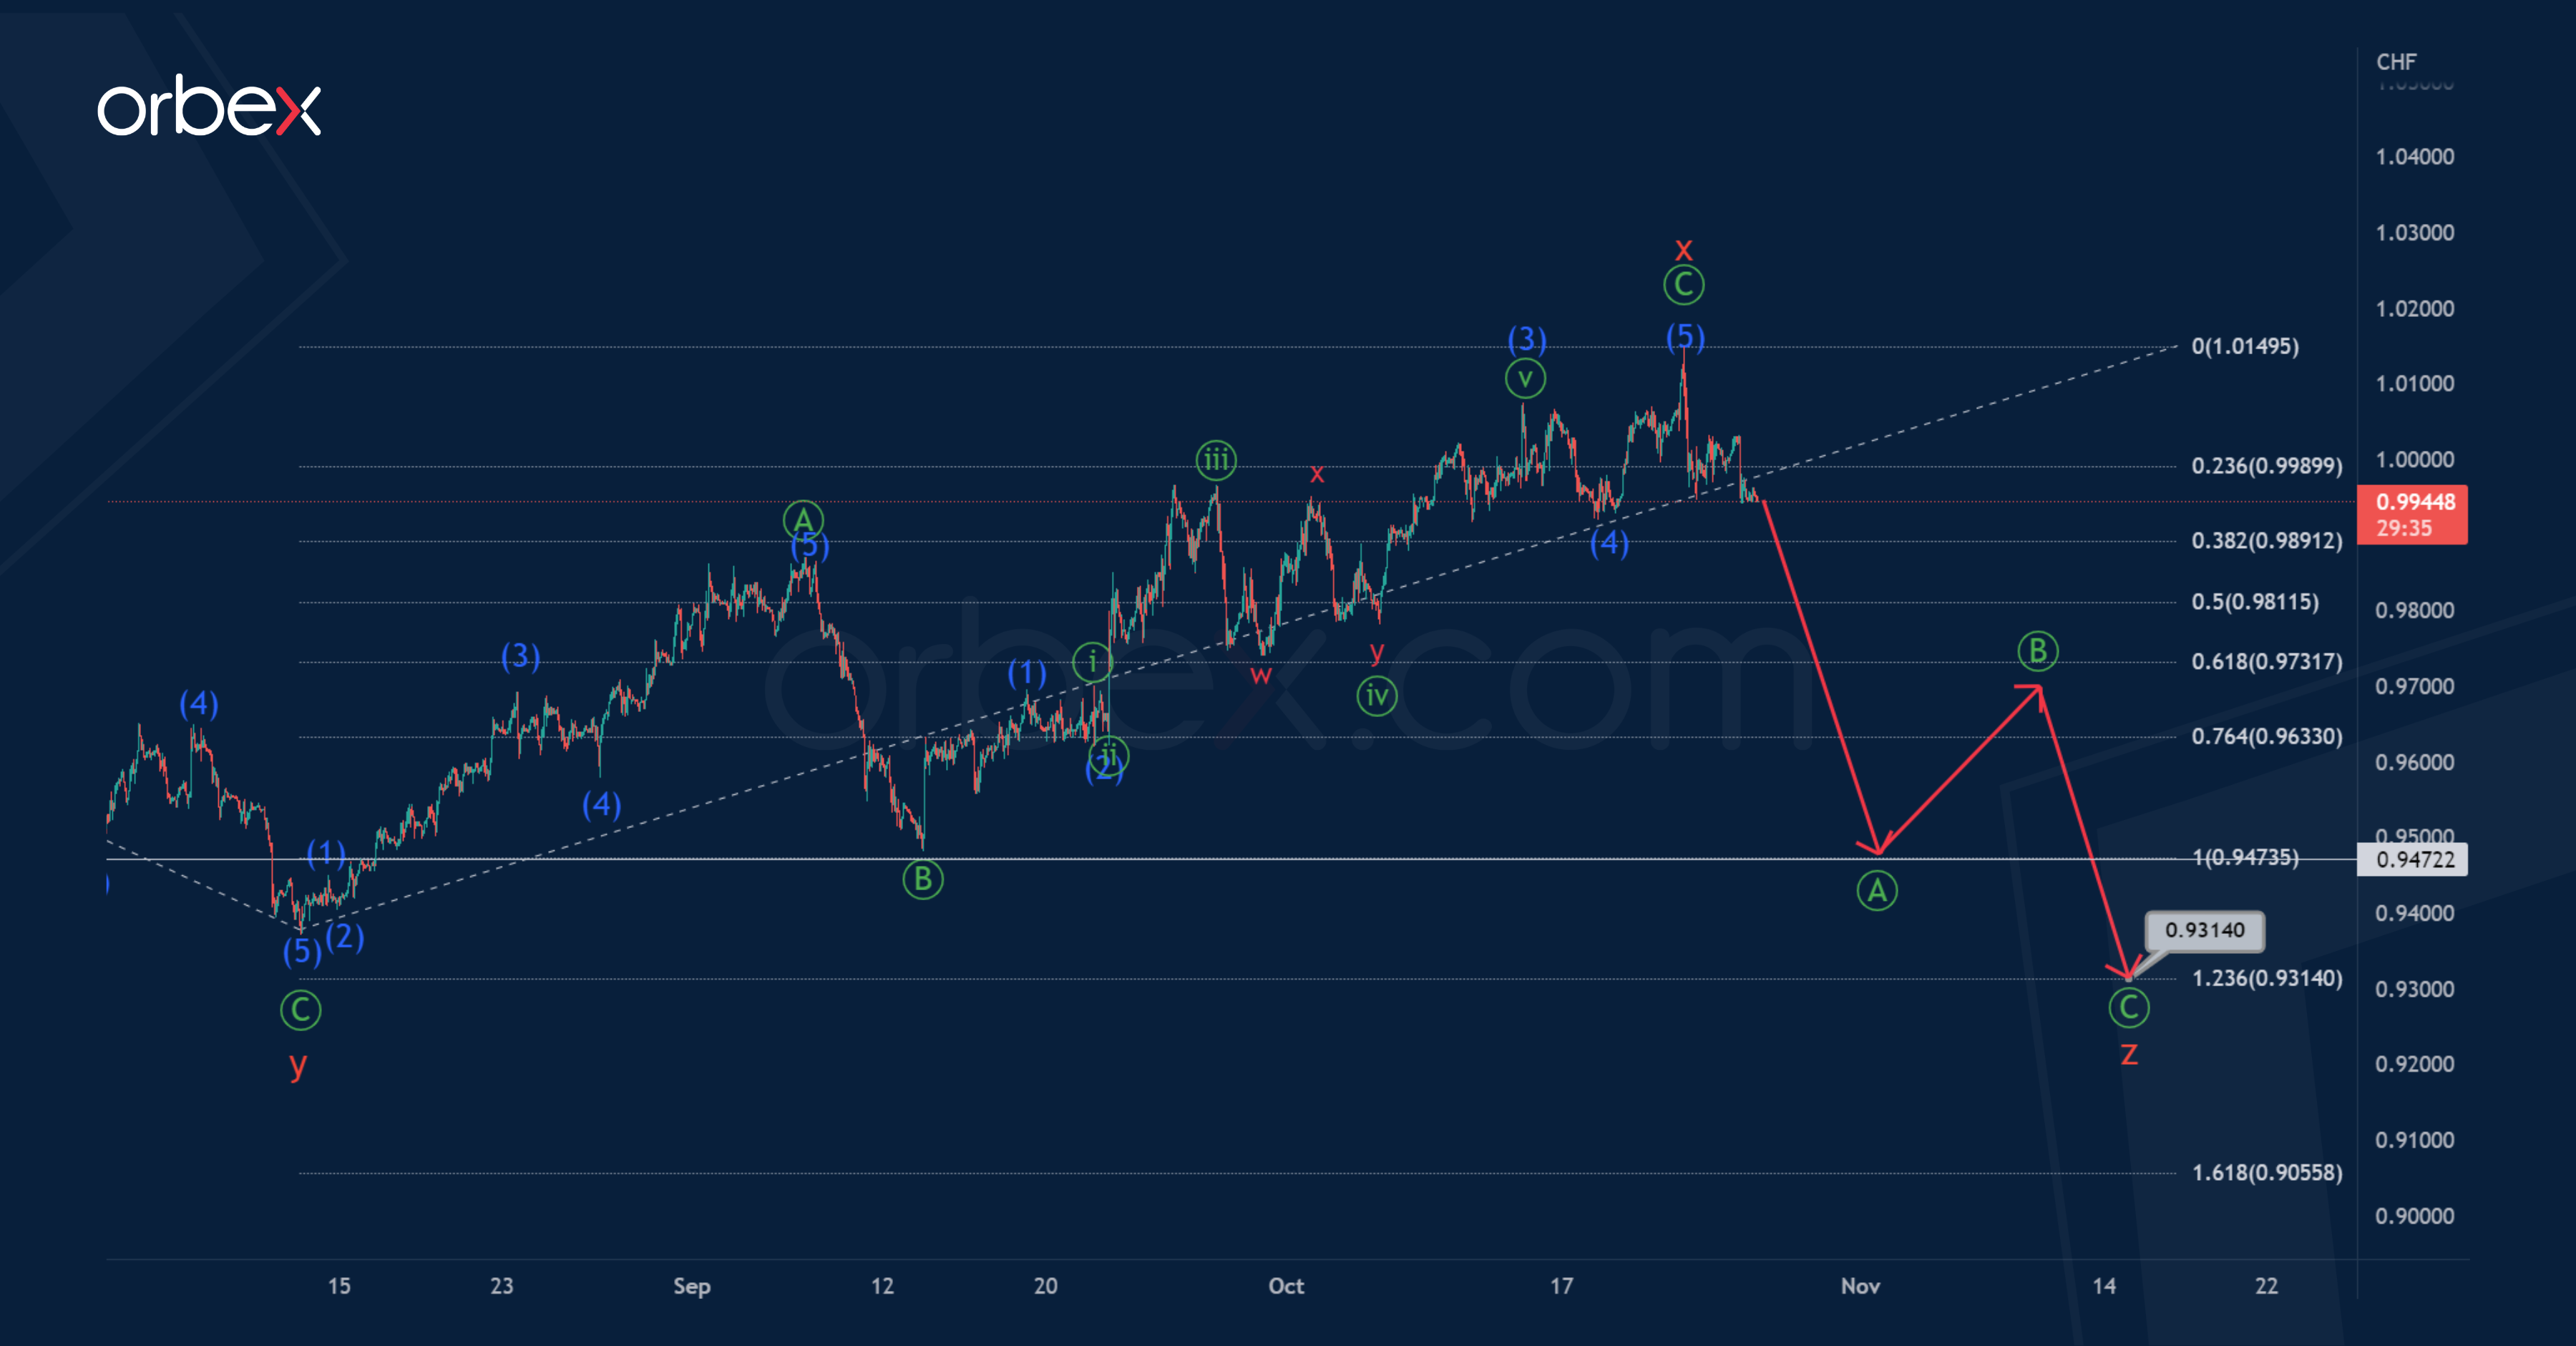
On the 1H timeframe for the USDCHF pair, we see the final part of the proposed large double zigzag consisting of cycle sub-waves w-x-y. This pattern looks fully completed, that is, the price decline in the cycle wave y, which is the primary standard zigzag, has come to an end.
Currently, there is a development of the initial part of a new corrective trend.
It is assumed that a standard 3-wave zigzag of the primary degree Ⓐ-Ⓑ-Ⓒ is being constructed.
Perhaps the first two sub-waves Ⓐ-Ⓑ are fully completed, so growth is expected in the direction of the 1.0096 level, in the impulse Ⓒ, the last leg of which takes the form of an ending diagonal 1-2-3-4-5, as shown in the chart.
At that level, wave Ⓒ will be at 123.6% of first impulse Ⓐ.
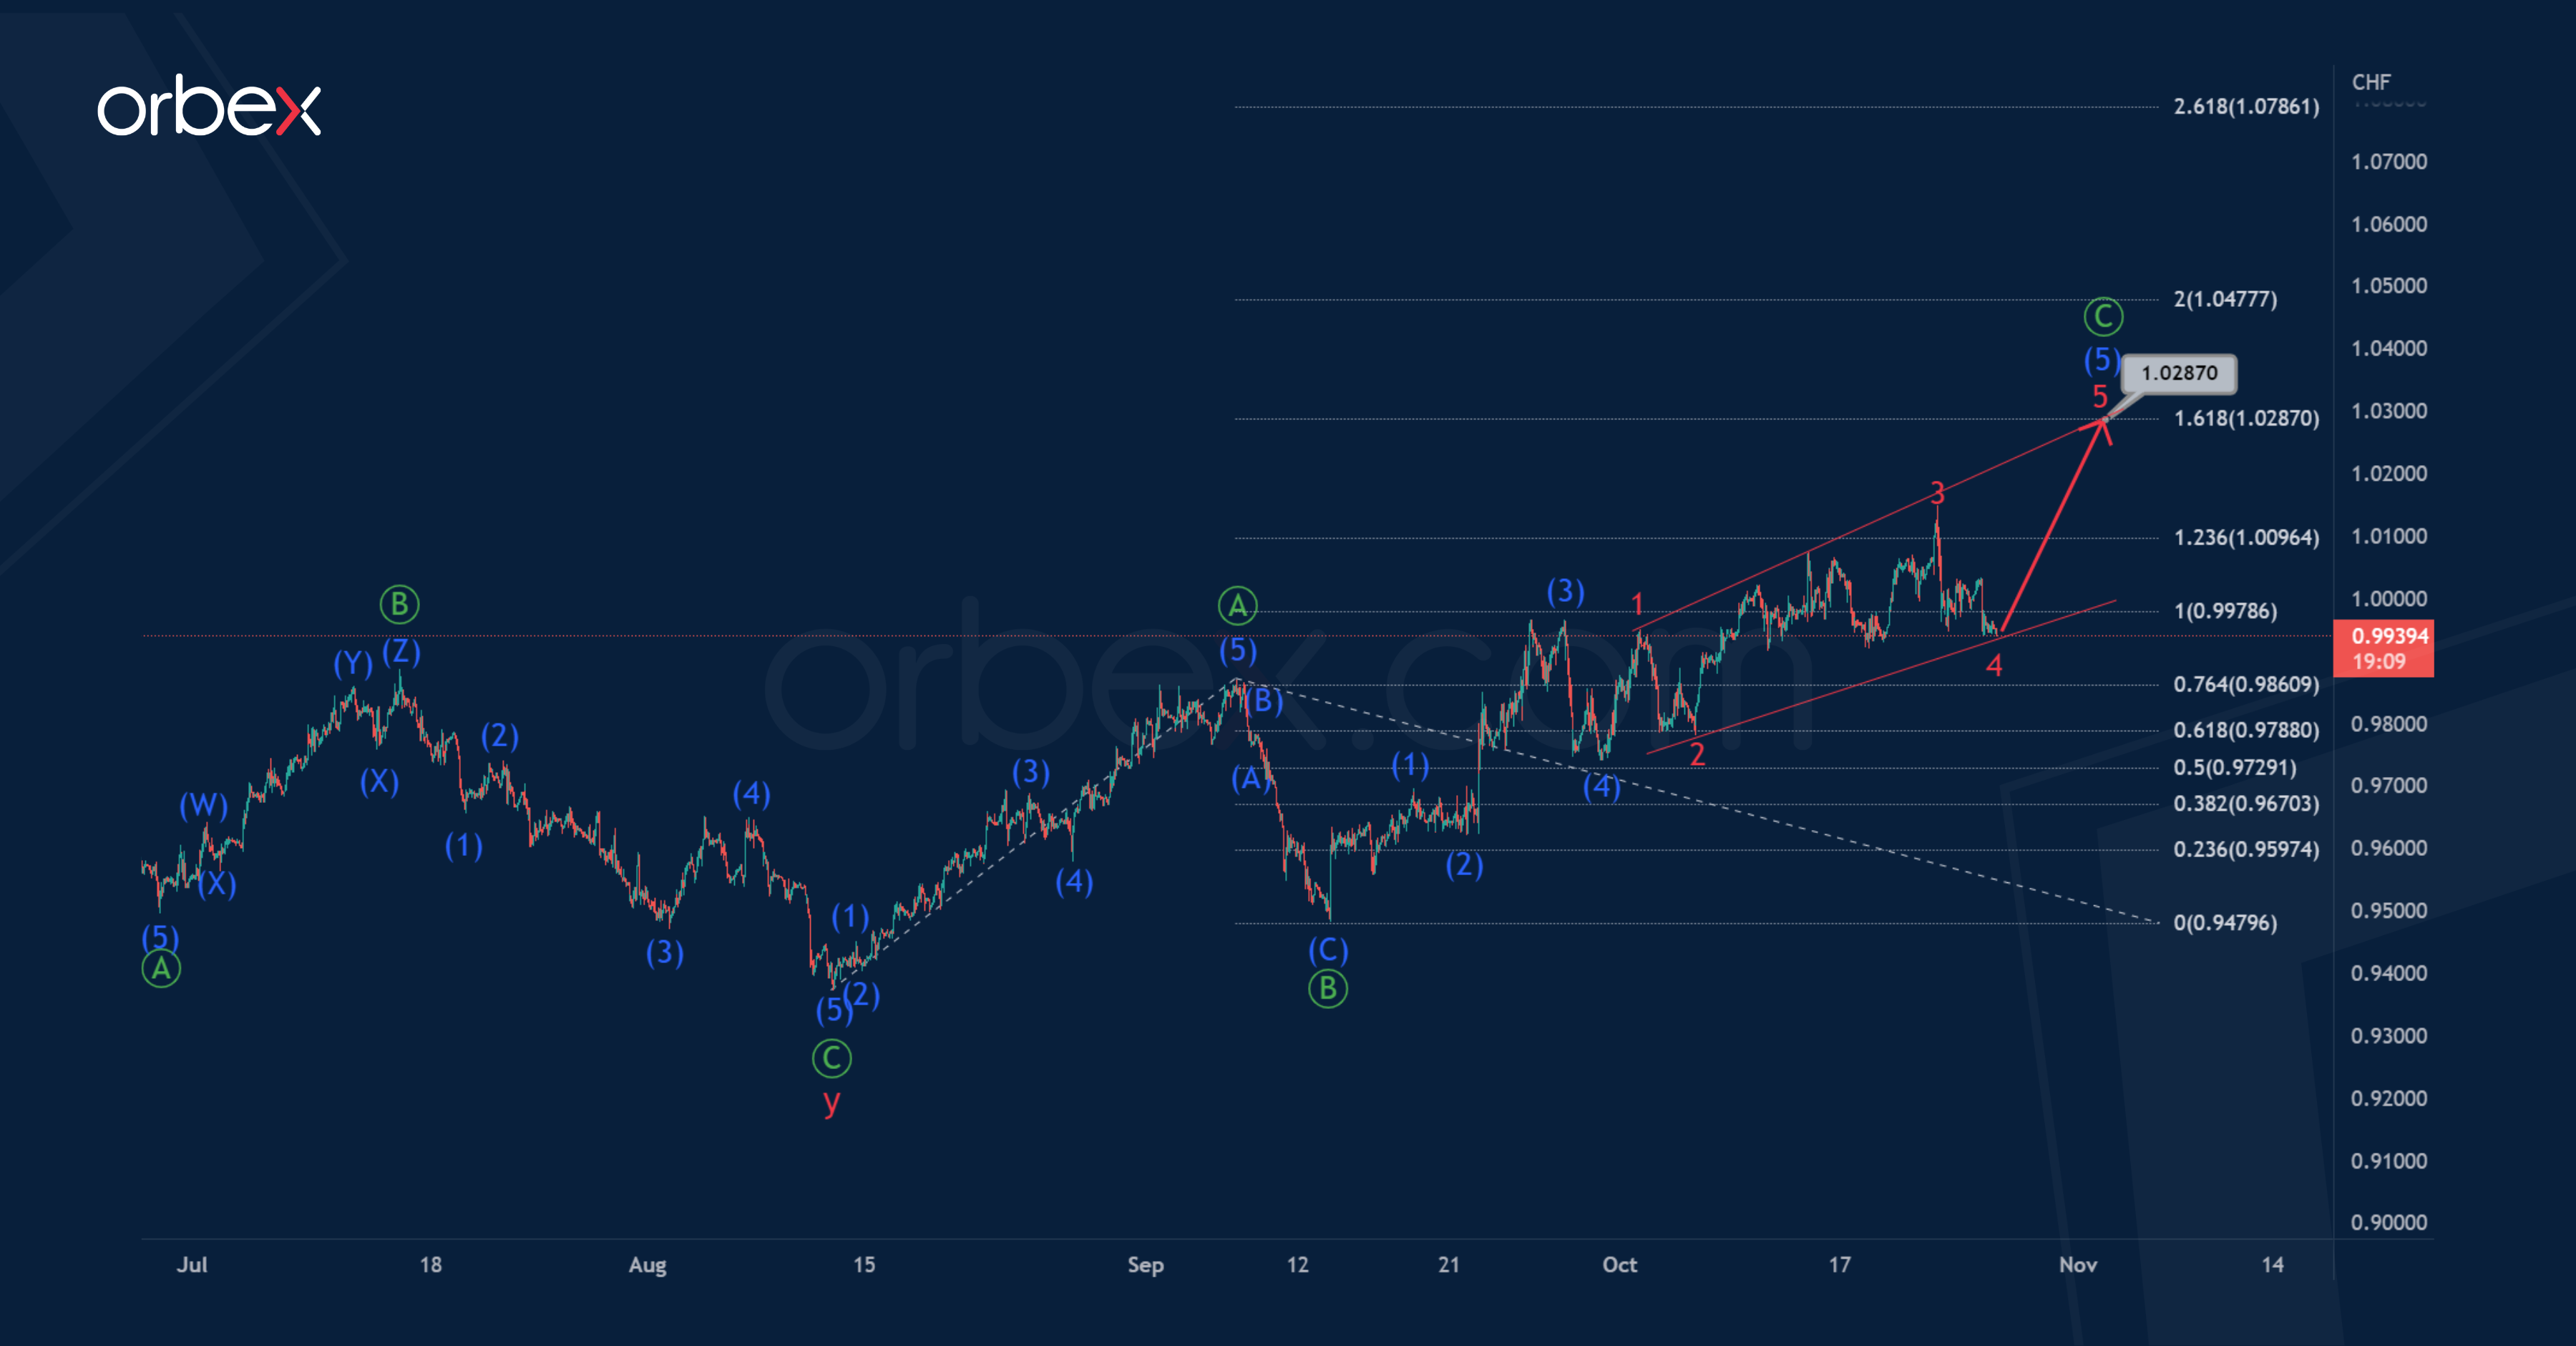
Alternatively, the cycle pattern may take a more complex form, that is, a triple zigzag w-x-y-x-z.
Thus, if this option is confirmed, we will see a decrease in the price and the construction of the final sub-wave z.
It is possible that the wave z will be at 123.6% of wave y and will complete its pattern near 0.931. And its first part, the primary sub-wave Ⓐ, may end at a minimum of 0.947.
An approximate scheme of possible future movement is shown on the chart.
FTSE 100 Tests Resistance
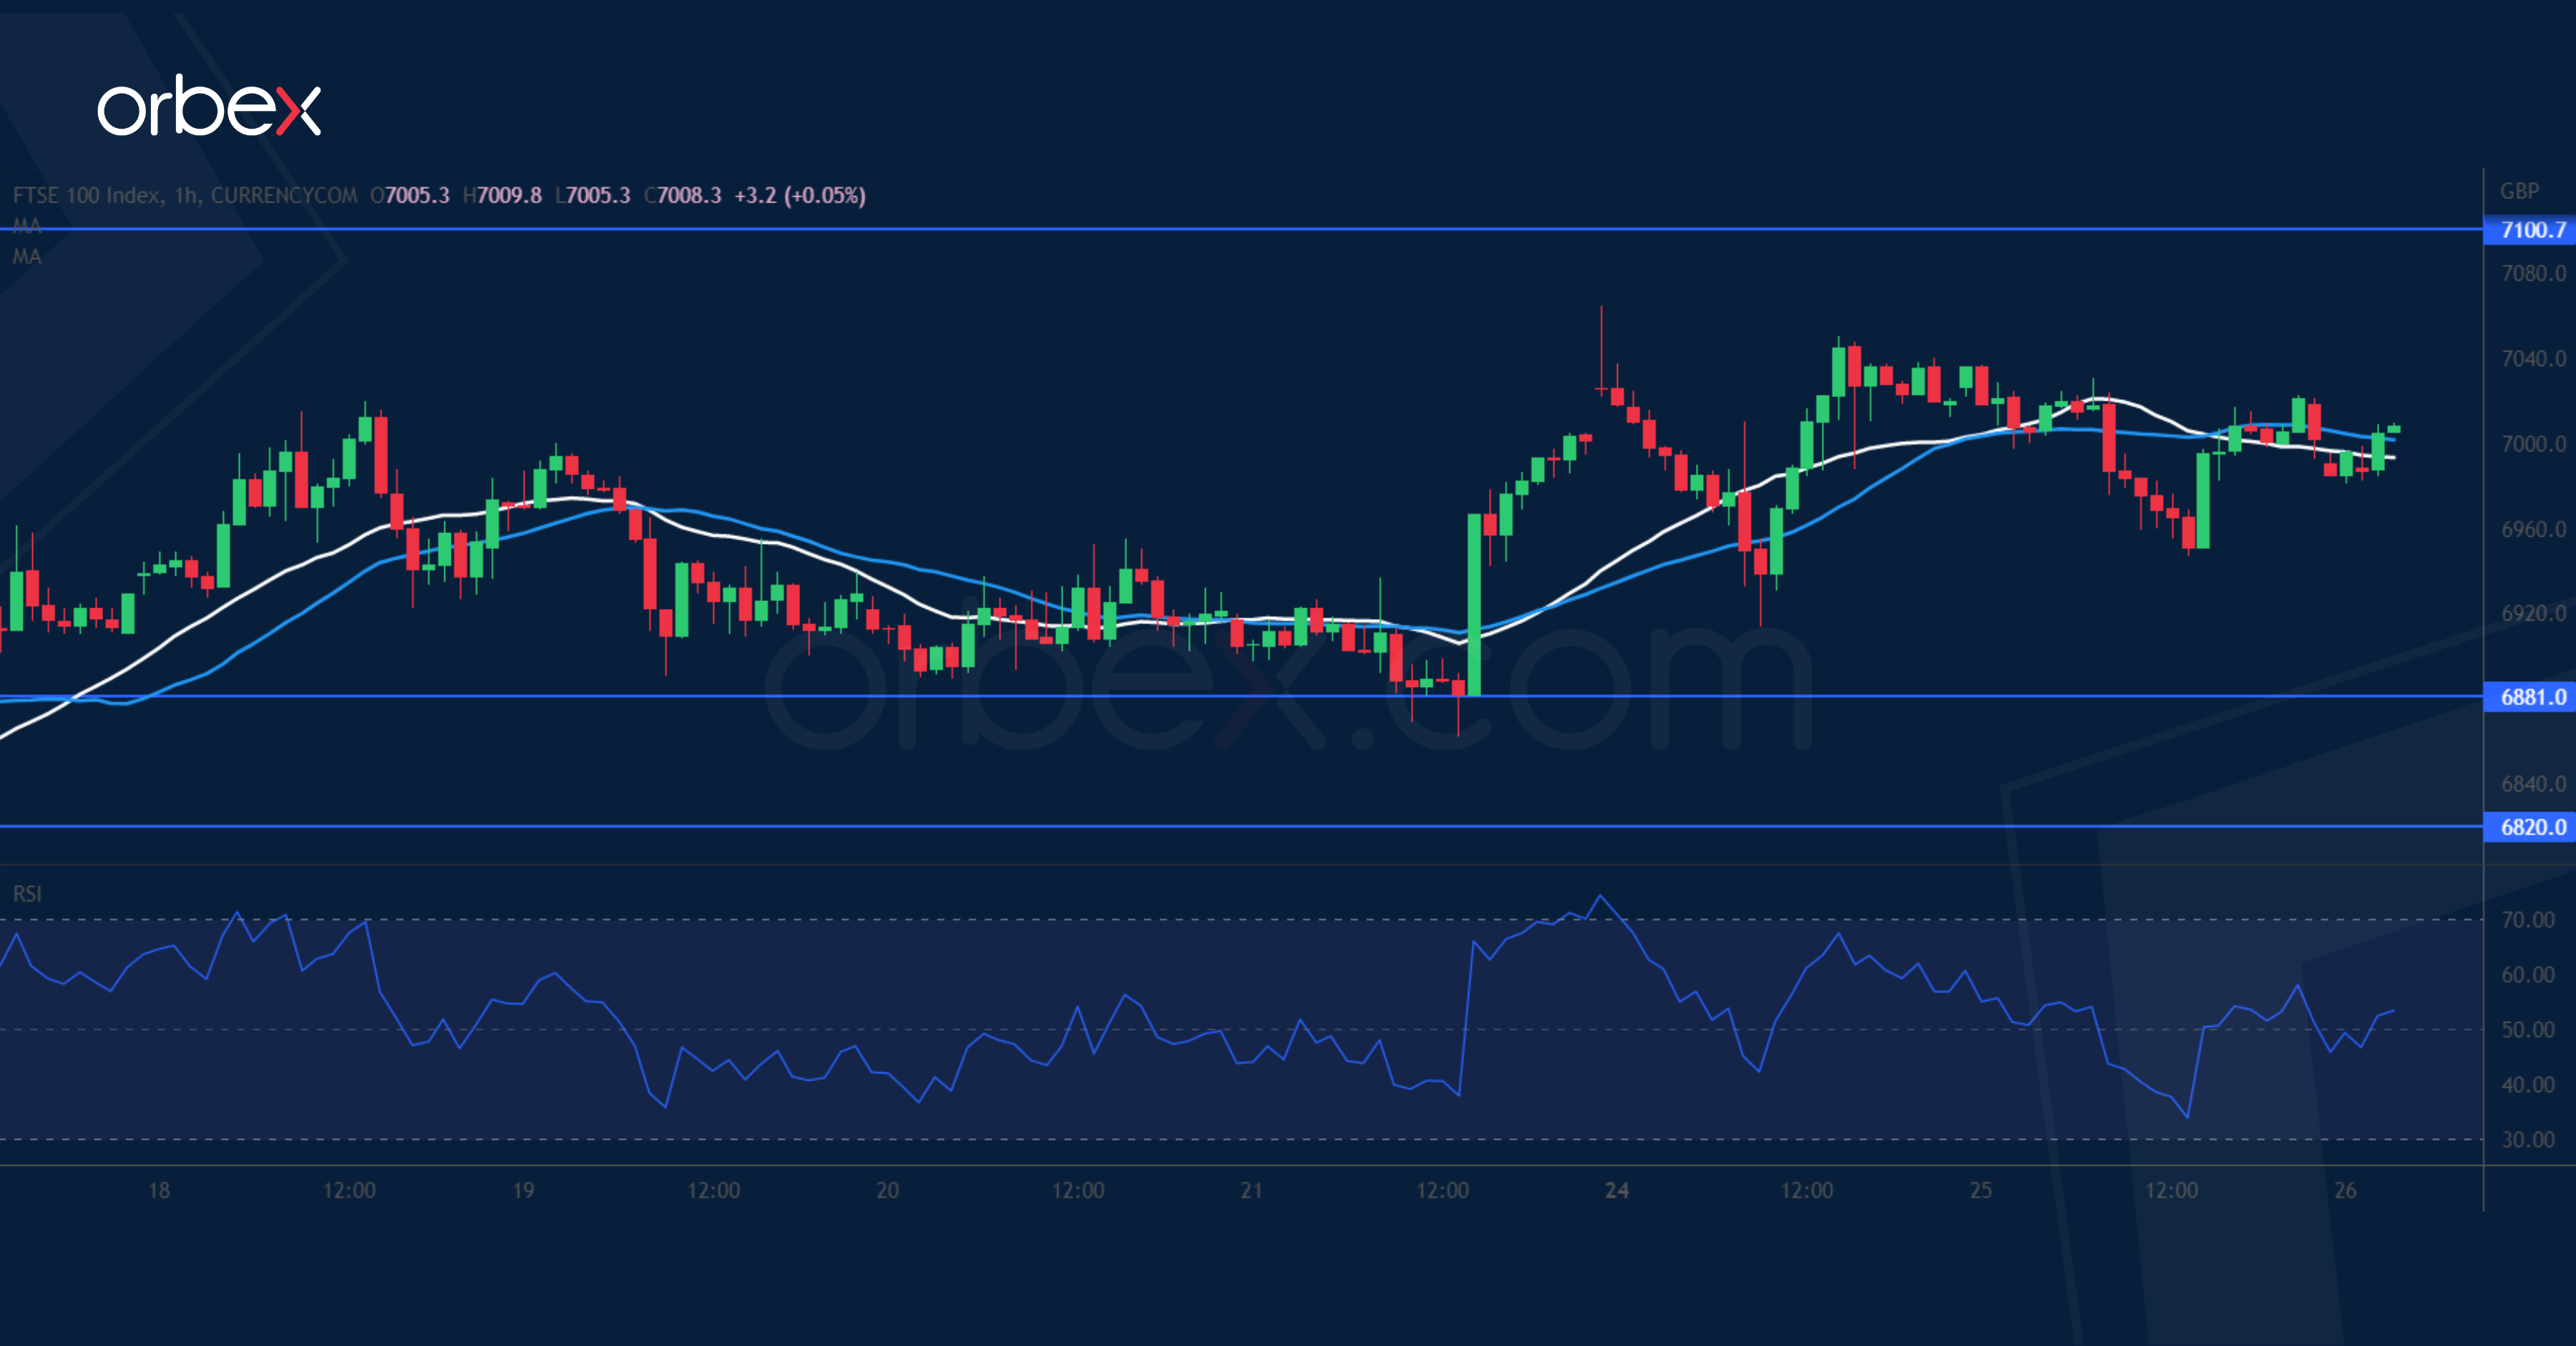
The FTSE 100 bounces as traders bet on a slowdown in the hiking cycle. The index has clawed back losses from previous sessions but the bias remains down. The price action is testing the supply zone between the 30-day moving average and the daily resistance at 7100 where strong pressure could be expected after the market edged into bearish territory. 6880 is a fresh support and 6820 the short-term bulls’ second line of defence. Their breach would invalidate the latest rebound and send the index below 6700.
XAU/USD Attempts to Bounce
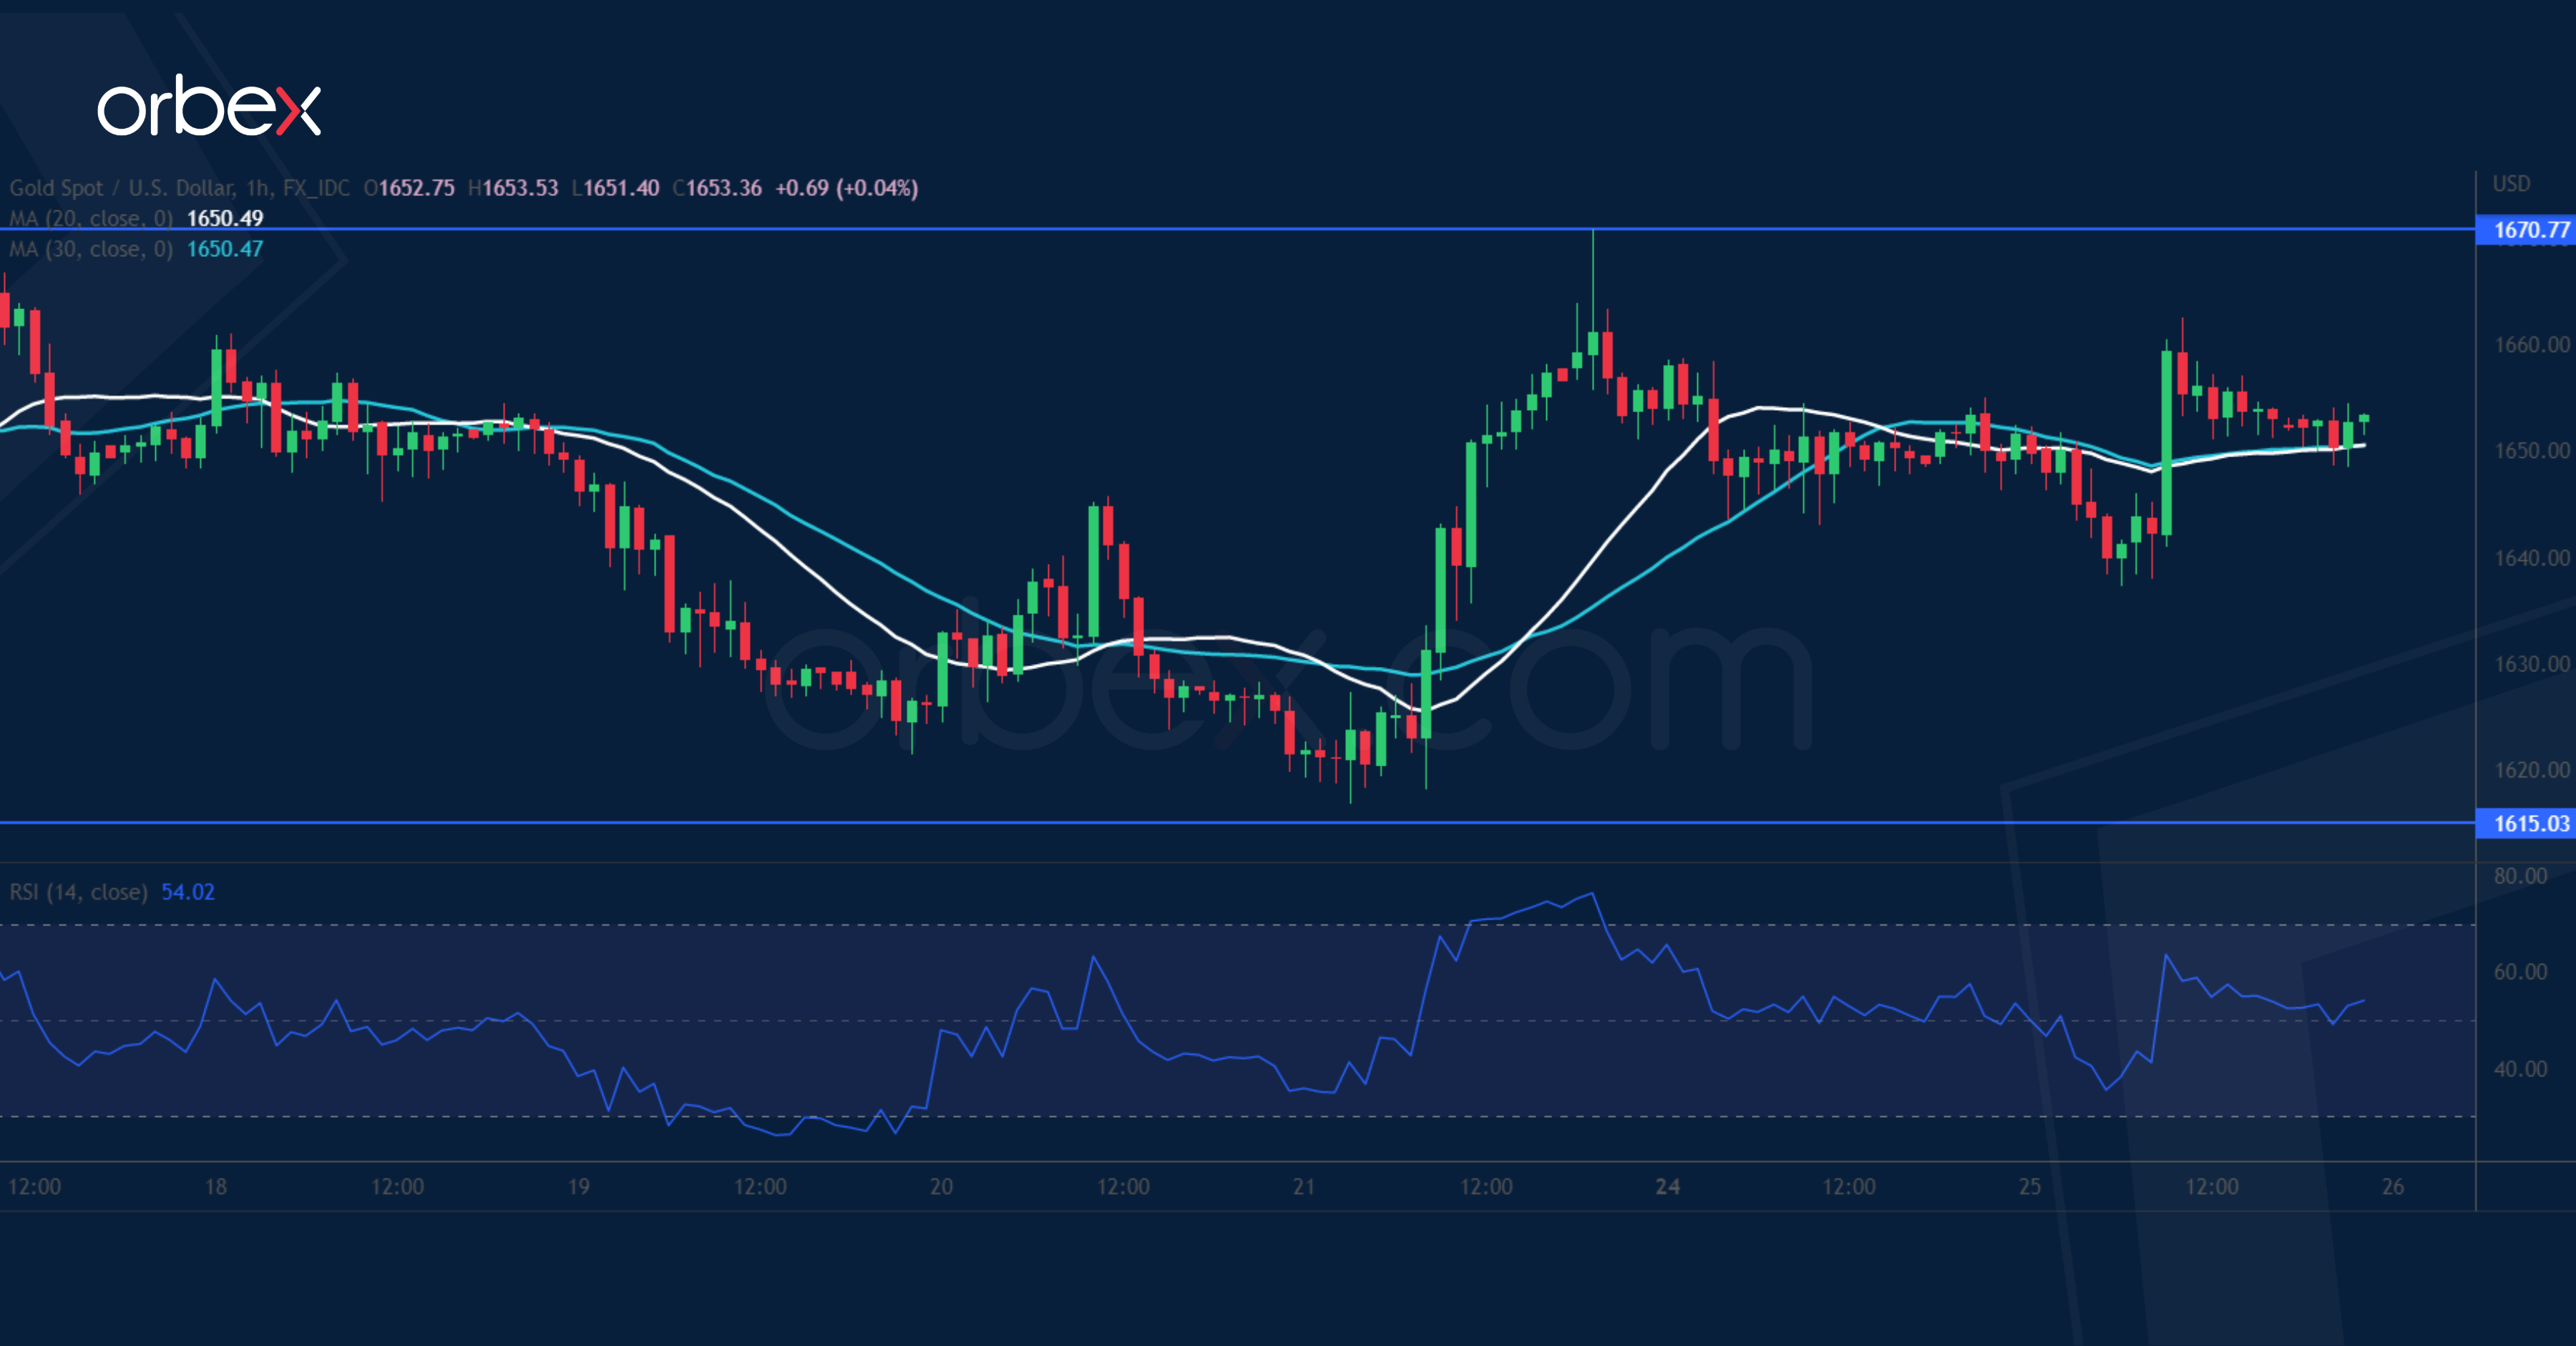
Bullion strengthens as a decline in US home prices weighs on Treasury yields. Gold saw bids at the previous low (1615) and a surge above 1660 may have prompted some short interests to cover. A rally fueled by profit-taking will not be enough to reverse the price action unless the precious metal secures follow-up buying. 1670 used to be a demand zone from a rally earlier this month and has become a key resistance. Its breach would carry the price to the previous high at 1730. A break below 1615 would push gold to 1570.
AUD/USD Grinds Higher
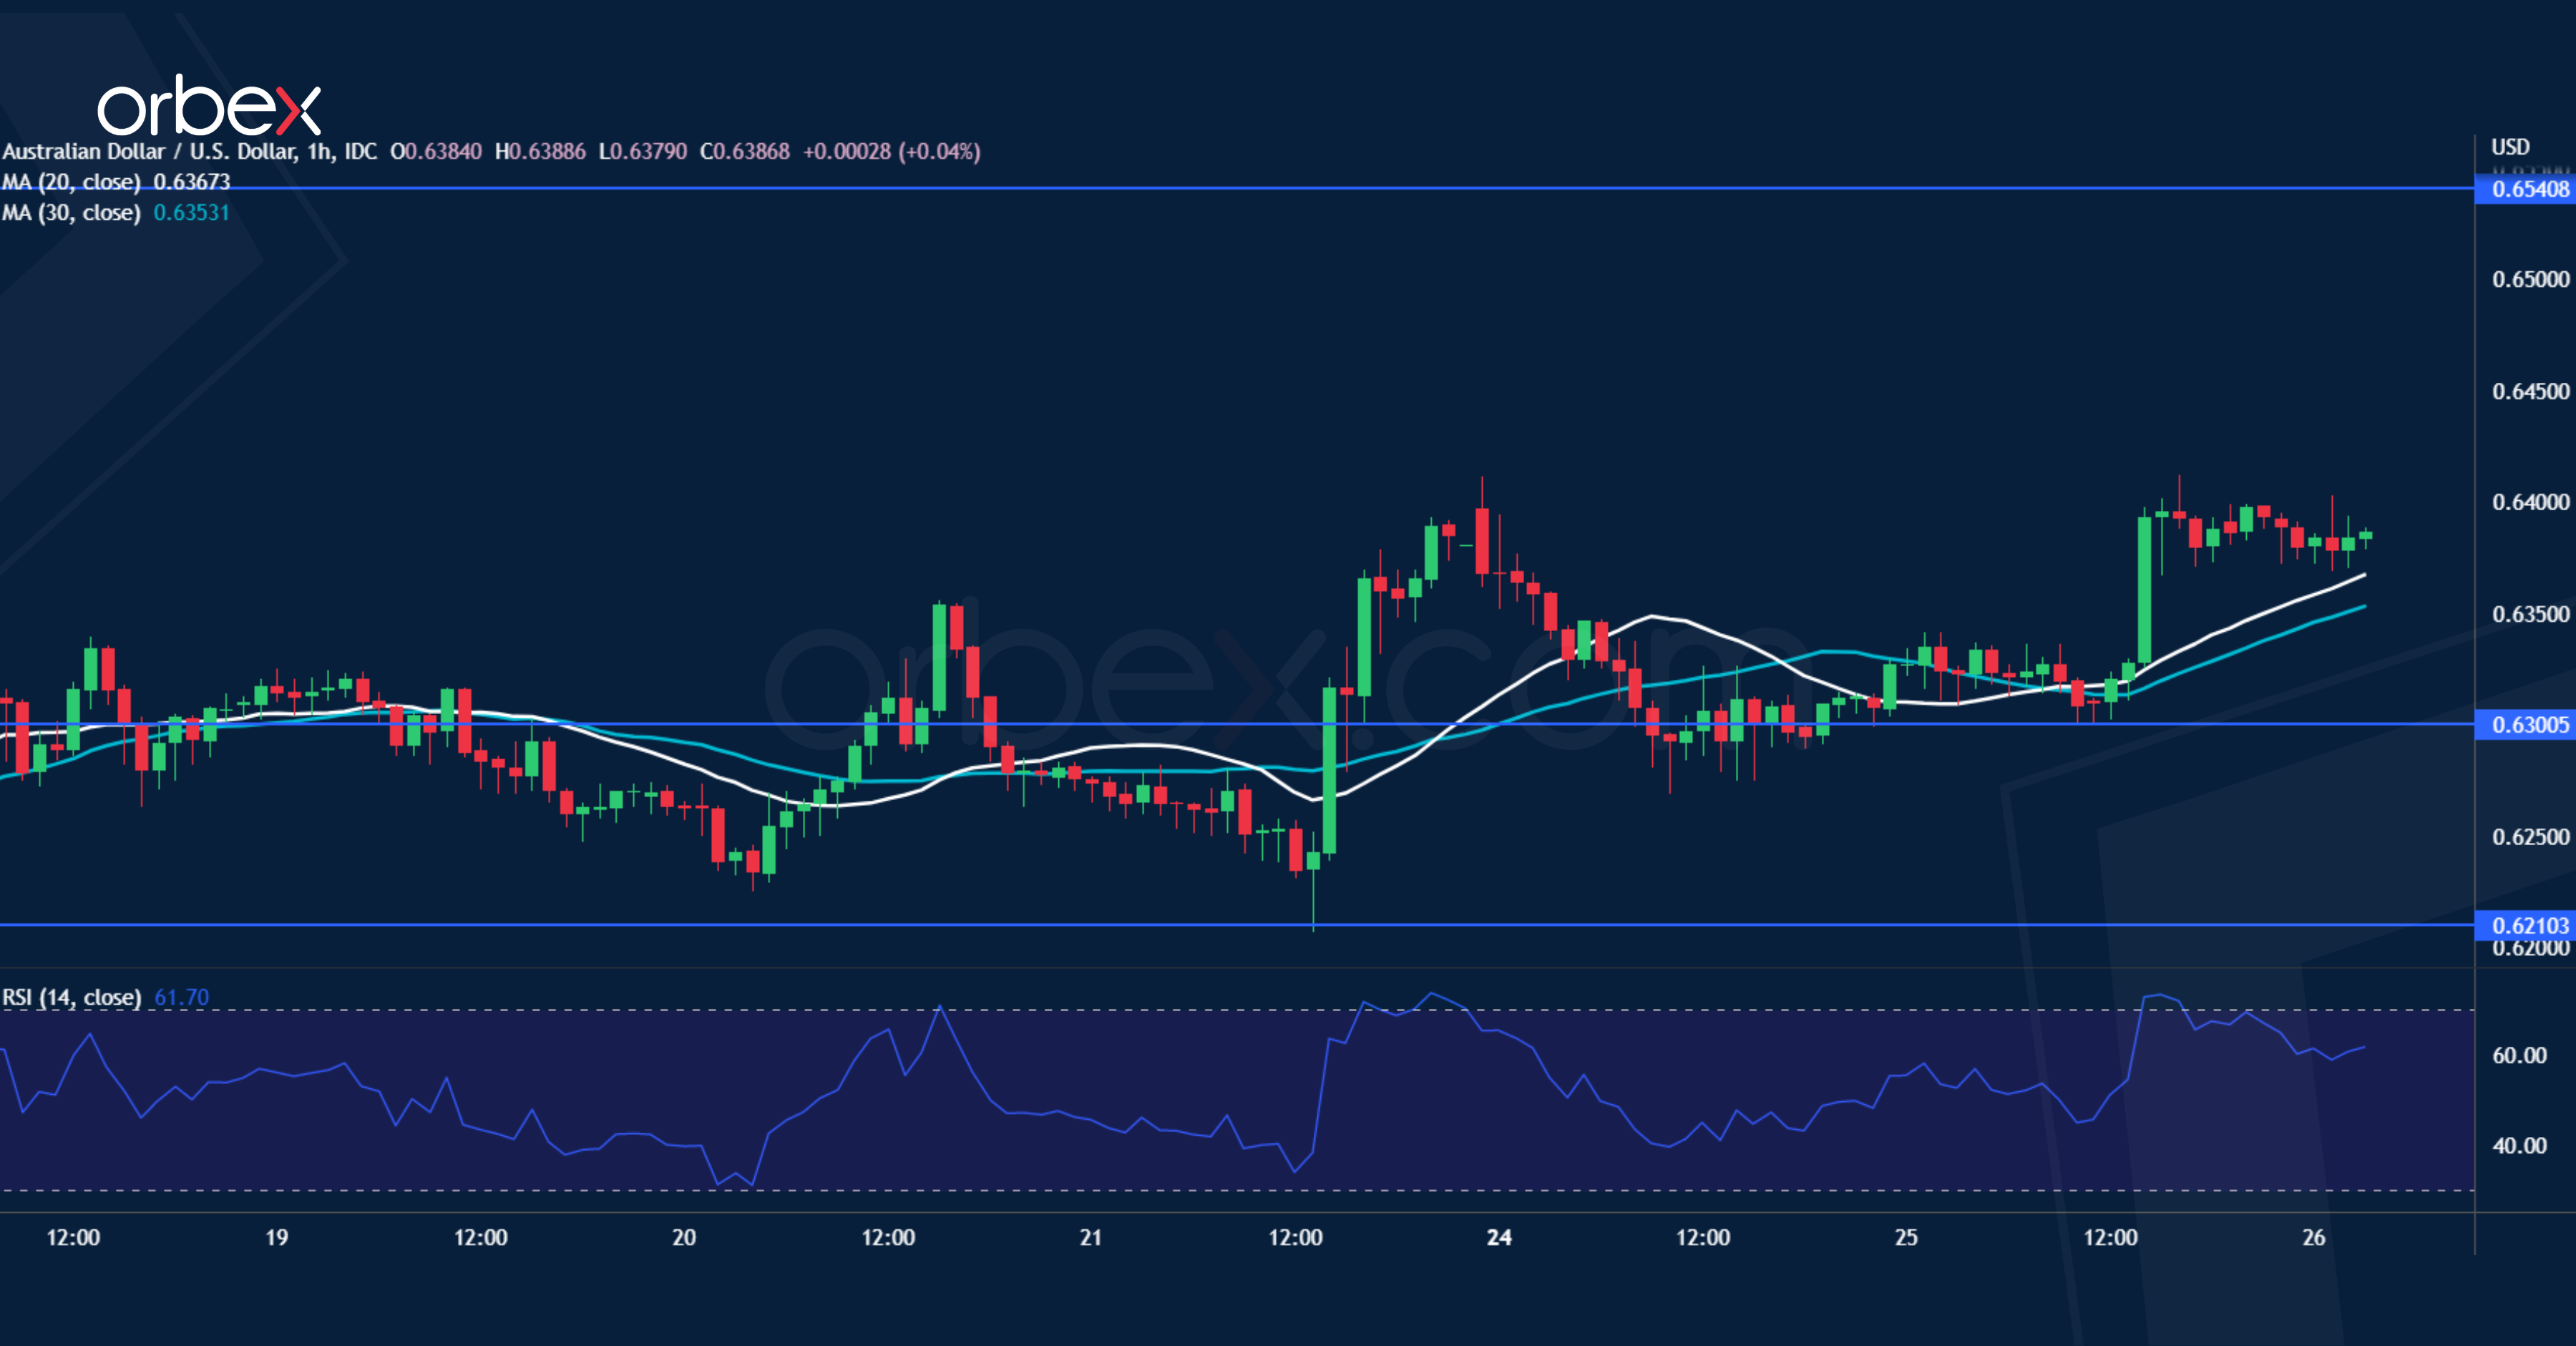
The Australian dollar finds support from strong CPI in Q3. From the daily chart’s perspective, sentiment remains extremely bearish and the latest rebound could be a mere flag-shaped consolidation near moving averages. The pair has met stiff selling pressure at the support-turned-resistance (0.6400). Its breach on a second attempt means that the bulls will be challenging 0.6540 before they could turn the mood around. Or a dip below 0.6300 could trigger a new round of sell-off below the critical floor at 0.6210.
Soft US Data Tempers Fed Hawks, But Big Tech Earnings Fall Short
Google and Microsoft reversed the joyful Tuesday sentiment. The US dollar and the US yields fall on soft economic data – that tempered the hawkish Federal Reserve (Fed) expectations.
The Bank of Canada (BoC) is about to deliver another jumbo rate hike, while Meta will be the next Big Tech to report earnings today.
Happy, but not for long
Most US indices rallied yesterday on the back of soft economic data from the US, but the sentiment reversed after the Q3 results from Google and Microsoft failed to please.
The data release yesterday in the US showed that the US consumer confidence and the Richmond manufacturing index fell significantly more than expected, while the US home prices fell for the second time in a row in August.
The latest data was good for inflation expectations, and good for recession fears, which both temper the Fed hawks a week before the Fed is preparing to announce another 75 bp hike in its rates.
The US 2-year yield has been easing after hitting a fresh 15-year high last week, as the US 10-year yield fell to 4.05%. The dollar index tanked around 1%, both the EURUSD and Cable advanced past their 50-DMA, which were acting as strong resistance since the start of the year, especially since the start of the war in Ukraine.
The USDCAD fell to a 3-week low, as the Bank of Canada (BoC) prepares to deliver another jumbo rate hike today. The BoC could deliver a 75bp hike, which would further fuel the odds of recession in Canada by next year.
Now, it’s important to note that the common denominator of the latest FX moves is the softer US dollar. And the downside moves in dollar and the US yields depend on Fed expectations – whatever the other central banks do seem accessory to the main dollar story.
Therefore, it’s worth noting that the Fed expectations have been shaped by softish data, and some softish comments from the Fed officials recently. But there is nothing official pointing at a potential softening tone from the Fed just yet. Hence, the recent fall in the US dollar, and rebound in equities may not last. Gains remain vulnerable. And very much so, as the latest results from the US tech giants failed to make the investors smile yesterday.
Earnings
Google’s cloud segment grew by an impressive 38% in Q3, but the core ad business made only 3%. So Alphabet ended up disappointing on both revenue and profit expectations. The stock price dived 6.50% in afterhours trading.
Microsoft managed to beat revenue and profit expectations slightly, thanks to a better-than-expected performance on PC and its productivity segment, which include products like Office and LinkedIn. The cloud revenue grew 20%. But that 20% was clearly not enough to bring investors on board. Microsoft stock fell around 6.5% after bell, as well.
Elsewhere, results were mixed after posting better-than-expected Q3 profit, and giving a surprisingly upbeat outlook. When you think that FedEx has fallen off a cliff after doing the exact opposite in September, you understand how important picking the right stock will be in the next market recovery, whenever it comes.
No fireworks expected from Meta
It’s sure that if the other tech giants saw their ad revenues slow, Facebook will hardly do better
The EPS is expected to drop from $2.46 to around $1.90. The challenging advertisement business, the strong US dollar and the rising competition from TikTok may have further weighed on Meta’s results, while there is little chance that the metaverse segment delivers anything enough promising to reverse the fortunes.
Mark Zuckerberg hopes that Meta’s Horizon Worlds would amass 1 billon users, but he will have to wait a while. For now, there are no more than around 200’000 people on Horizons World, down from around 300’000 in February.
Yield Curves Flatten on US House Prices
Market movers today
In a fairly thin data calendar today, the big event of the day is the Bank of Canada monetary policy announcement this afternoon. Markets and analysts are roughly evenly split between a 75bp and a 50bp hike. As our base case we pencil in a 50bp hike alongside a final 25bp hike in December.
In the US we get new home sales which should get some attention as historically it has tended to co-vary with unemployment rates.
The 60 second overview
Markets: sentiment remains fragile and nervous as evident from the daily volatility and considerable market moves across asset classes. Yesterday's session was dominated by a fall in US rates following worse-than-expected consumer confidence data and not least US house prices. The housing markets is increasingly getting attention as the surge in mortgage rates seems likely to drag the housing market lower and at some point contribute to higher unemployment rates. More air in the labour market seems like a necessary condition for Fed to slow its tightening pace and markets put a higher probability of an earlier pivot following yesterday's releases.
The move lower in yields was most pronounced in longer-dated yields driving a flattening and further inversion of most parts of the USD-curve. The USD exchange rate weakened, real rates moved lower and equities paradoxically implicitly rallied on the weaker bunch of data. This morning most Asian equity indices are trading in green while US equity futures are solidly in red following a few prominent disappointing earnings reports out post yesterday's stock market close.
UK Politics: The new PM Rishi Sunak yesterday announced his cabinet which marked a comeback to several former ministers. While markets had already reacted positively to news that Sunak would keep Jeremy Hunt as his Chancellor of the Exchequer it was a slightly negative surprise that Sunak could not confirm that a fiscal strategy will still be presented on 31 October. Fiscal clarity is crucial ahead of the 3 November Bank of England meeting. Over the last month the outlook for more fiscal prudence in the UK has driven a repricing of the short-end with the peak in policy rate pricing having gone from 6.25% to 4.95% by next summer.
Danmarks Nationalbank: We think it is a 70/30 call if tomorrow Danmarks Nationalbank (DN) will decide to hike policy rates by 10bp less than the ECB as a response to recent DKK strength and FX intervention selling. Markets seem 50/50 evenly split. Either way, we look for a small reaction in EUR/DKK. If we are right, we expect a rise to at most a level of around 7.4420-30. If we are wrong, and DN follows ECB 1:1, we look for the cross to drop back to the 7.4363 floor which would likely maintain market speculations of a smaller Danish rate hike compared to the ECB in December.
Equities: Equities were higher yesterday although macro data were weak and hence the tendency that "bad data is good data" continues as long as yields are dropping. Most sectors lifted with energy left behind. Advances were driven by cyclicals, growth and small caps with VIX dropping 1.5 points to just north of 28. Weak earnings results coming in mostly after the bell in US and hence more reflected in the futures today and not the cash performance yesterday. In US yesterday, Dow +1.1%, S&P 500 +1.6%, Nasdaq +2.3% and Russell 2000 +2.7%. Asian markets are higher this morning while US futures, especially tech are lower this morning.
FI: It was another day with big moves in the global bond markets as the bond market rallied massively from the long end of the curve. 10Y US Treasury yields declined by 16bp yesterday and the 2Y-10Y curve flattened by 14bp as house prices declined. The German 10Y yield fell by 16bp and curve flattened as well ahead of the ECB meeting on Thursday.
FX: USD traded poorly yesterday vs G10. EUR/USD made a sharp move higher, breached 0.99 and challenged parity before dropping back toward the mid-0.99s. Triggers were seen in US data that pulled rates lower under bull-flattening and bolstered equities and thus overall risk sentiment. Cable gained and is back above 1.14 after the appointment of Rishi Sunak. Scandies were also among the winners with both EUR/NOK and EUR/SEK on the defensive, the latter dropped close to 10 figures.
Credit: Credit markets continued in a good mood on Tuesday as the relief rally in risky assets continued. Itrax main tightened 5.1bp to close at 116.5bp while Itrax Xover tightened 17.7bp to close at 567.7bp. Tuesday also saw decent primary activity, with both financials and corporates testing the waters.
EUR/USD Daily Outlook
Daily Pivots: (S1) 0.9886; (P) 0.9932; (R1) 1.0013; More...
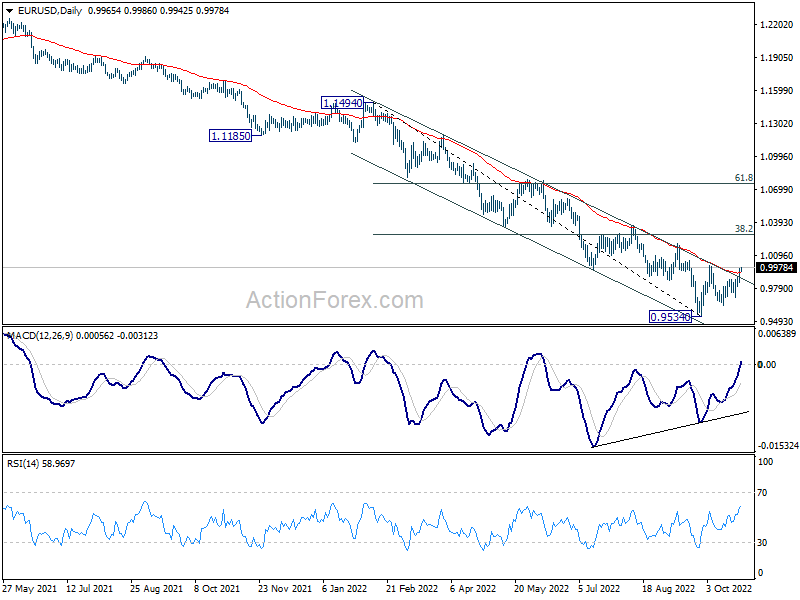
Immediate focus is now on 0.9998 resistance in EUR/USD. Decisive break there will confirm resumption of rebound from 0.9534. More importantly, that should also indicate medium term bottoming at 0.9534, on bullish convergence condition in daily MACD. Stronger rise should then be seen to 38.2% retracement of 1.1494 to 0.9534 at 1.0283. On the downside, break of 0.9630 will resume larger down trend through 0.9534 instead.
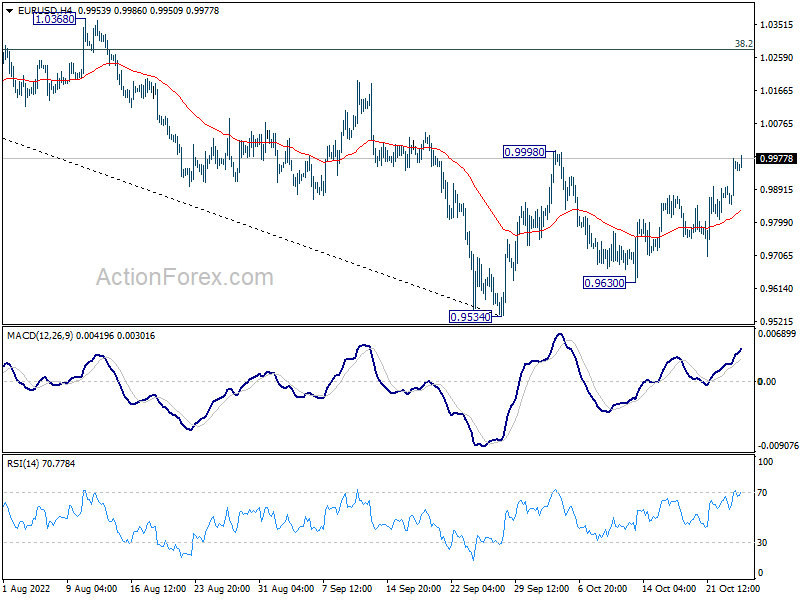
In the bigger picture, the case of medium term bottoming at 0.9534 building up. While it is too early to call for trend reversal, firm break of 0.9998 will open up stronger rebound back to 55 week EMA (now at 1.0630) even as a corrective rise. Meanwhile, firm break of 0.9534 will resume larger down trend to 100% projection of 1.3993 to 1.0339 from 1.2348 at 0.8694.