Sample Category Title
GBP/JPY Daily Outlook
Daily Pivots: (S1) 168.43; (P) 169.19; (R1) 170.53; More...
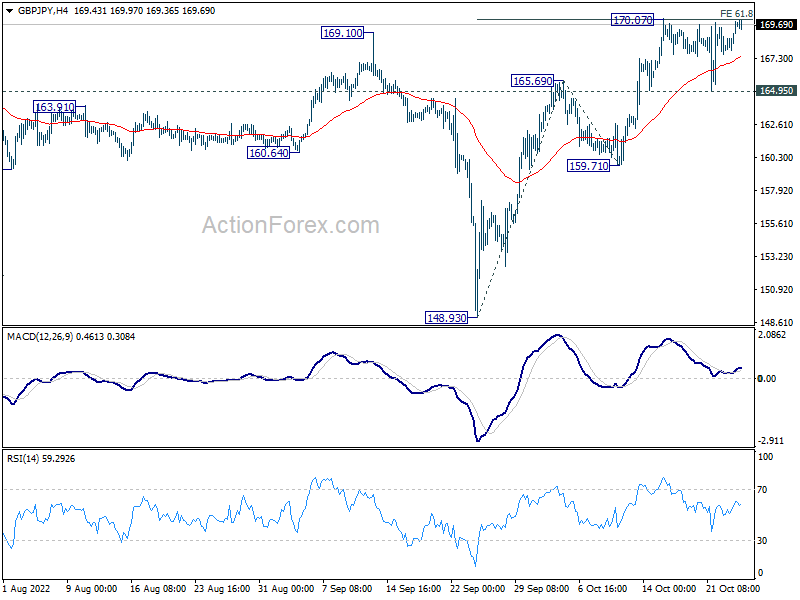
GBP/JPY is staying below 170.07 and intraday bias remains neutral. But further rally is still in favor. Firm break of 170.07 will confirm up trend resumption. Next target is 100% projection of 148.93 to 165.69 from 159.71 at 176.47. Nevertheless, break of 164.95 minor support will turn bias back to the downside for 159.71 support instead.
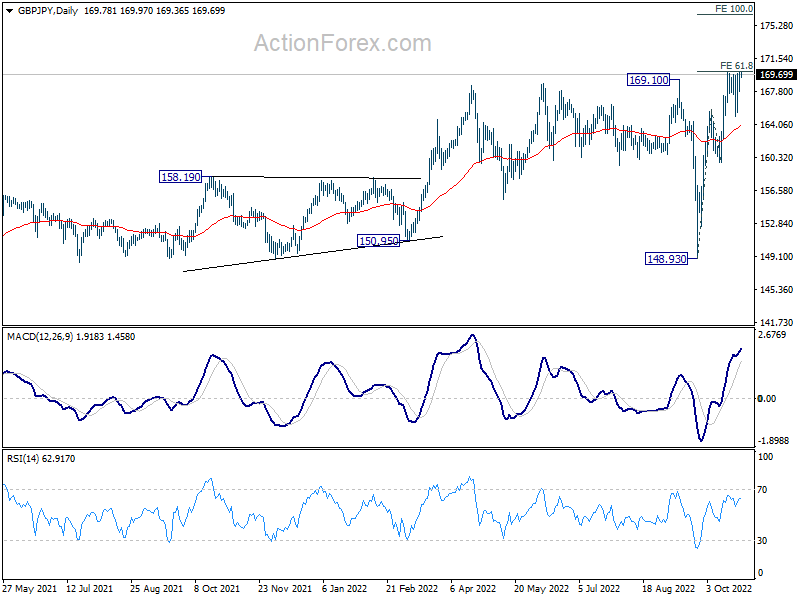
In the bigger picture, current development suggests that up trend from 123.94 (2020 low) is still in progress. Sustained break of 61.8% retracement of 195.86 (2015 high) to 122.75 (2016 low) at 167.93 will pave the way to retest 195.86 high. This will now remain the favored case as long as 148.93 support holds.
GBP Firm, USD Down, CAD Mixed ahead of BoC
Dollar was sold off overnight as stock markets extended rebound. But there is no clear downside breakout in the greenback yet. For now, Sterling is the strongest one for the week as political situation in the UK appears to have stabilized. Euro is the second best as helped by rally against Swiss Franc. Dollar is just the third weakest, following Yen and Kiwi. Canadian Dollar is mixed and will look forward to today's BoC rate decision for guidance.
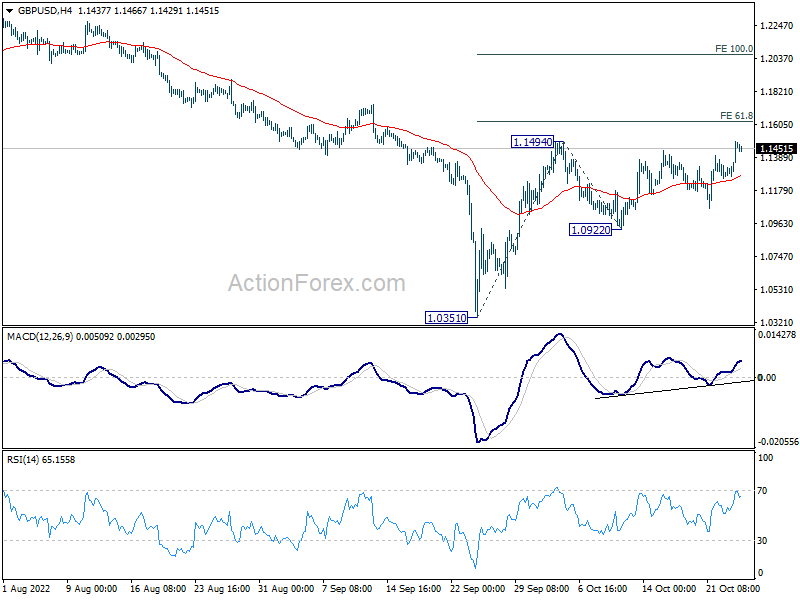
Technically, focus is back to 0.9998 resistance in EUR/USD and 1.1494 resistance in GBP/USD. Firm break of these levels will confirm resumption of rebound from 0.9534 and 1.0351 respectively. If happen this could be a signal of more Dollar weakness elsewhere. In particular, USD/CAD could then be dragged through 1.3501 support. But then, another scenario would be upside break out in EUR/JPY and GBP/JPY through 148.38 and 170.07. Let's see.
In Asia, at the time of writing, Nikkei is up 1.06%. Hong Kong HSI is up 2.17%. China Shanghai SSE is up 1.42%. Singapore Strait Times is up 0.99%. Japan 10-year JGB yield is down -0.0046 at 0.252. Overnight, DOW rose 1.07%. S&P 500 rose 1.63%. NASDAQ rose 2.25%. 10-year yield dropped -0.126 to 4.108.
Australia CPI jumped to 7.3% yoy in Q3, highest since 1990
Australia CPI rose 1.8% qoq in Q3, above expectation of 1.5% qoq. Annual rate accelerated from 6.1% yoy to 7.3% yoy, above expectation of 6.9% yoy. That's the highest annual rise since 1990. Trimmed mean CPI, which excludes large price rises and falls, accelerated from 4.9% yoy to 6.1% yoy, highest since the data first published in 2003.
For the quarter, the most significant contributors to the rise were new dwellings (+3.7%), gas (+10.9%) and furniture (+6.6%). Annually, new dwellings (+20.7%) and automotive fuel (+18.0%) were the most significant contributors.
NZ ANZ business confidence fell to -42.7, murky outlook but resilient
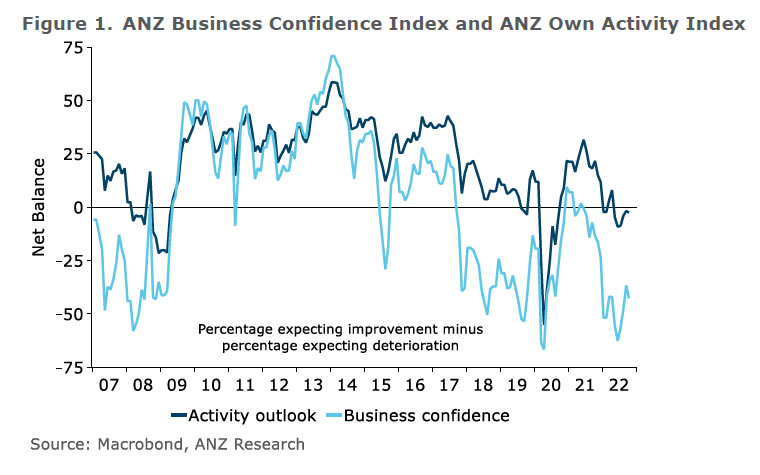
New Zealand ANZ Business Confidence fell from -36.7 to -42.7 in October. Looking at some details, Own Activity Outlook dropped from -1.8 to -2.5. Cost expectations dropped from 89.8 to 88.6. Employment intentions dropped from 5.9 to 5.0. Price intentions dropped from 68.0 to 64.5. Inflation expectations rebounded from 5.98 to 6.13.
ANZ said: "The economic outlook is certainly murky, but the New Zealand economy has a lot going for it. Debt is higher, but nowhere near the worrying levels other economies are struggling under. We're relatively insulated from the energy cost implications of Russia's invasion of Ukraine. Our primary export base is food, and when it comes down to it, people gotta eat. Housing affordability has improved in a meaningful but so far remarkably painless fashion. Indeed, overall the economy is still surprising economists with its resilience. It's a rougher path ahead, but the country is still moving forward."
BoC to hike 75bps, may signal slower tightening ahead
BoC is widely expected to deliver another rate hike today. The markets seem to have now reached a consensus expectation of a 75bps increase in overnight rate to 4.00%. That would be the highest level since 2008. The tightening cycle shouldn't stop there, but BoC may indicate that the pace would slow ahead. Some analysts are expecting another 50bps hike in December, followed by a 25bps hike early next year. But the decisions beyond together will very depend on upcoming economic data.
Here are some previews on BoC:
- BOC, BOJ Rate Decisions This Week
- Bank of Canada Preview: Will the BOC Hike Rates by 75bps?
- Bank of Canada to Hike Rates Again Amid Inflation Fight
- Will the BoC Satisfy Expectations of Another Triple Hike?
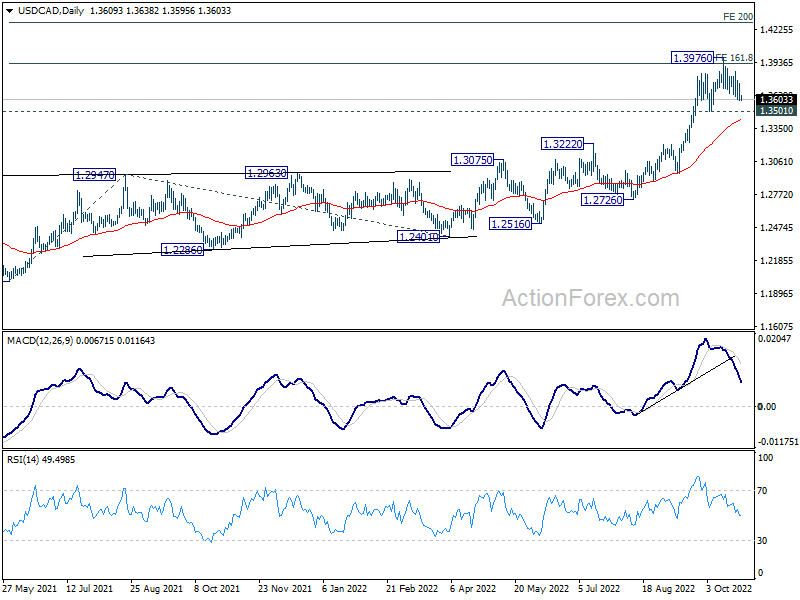
USD/CAD's up trend was capped at 1.3976 earlier this month, on overbought condition. For now, further rise is expected as long as 1.3501 support holds. Up trend from 1.2005 would target 200% projection of 1.2005 to 1.2947 from 1.2401 at 1.4285 on break of 1.3976. Nevertheless, break of 1.3501 support will bring deeper fall to 55 day EMA (now at 1.3430) and below.
Elsewhere
Eurozone M3 money supply and Swiss Credit Suisse economic expectations are the only feature in European session. US will release goods trade balance, whole sales inventories and new home sales.
GBP/JPY Daily Outlook
Daily Pivots: (S1) 168.43; (P) 169.19; (R1) 170.53; More...
GBP/JPY is staying below 170.07 and intraday bias remains neutral. But further rally is still in favor. Firm break of 170.07 will confirm up trend resumption. Next target is 100% projection of 148.93 to 165.69 from 159.71 at 176.47. Nevertheless, break of 164.95 minor support will turn bias back to the downside for 159.71 support instead.
In the bigger picture, current development suggests that up trend from 123.94 (2020 low) is still in progress. Sustained break of 61.8% retracement of 195.86 (2015 high) to 122.75 (2016 low) at 167.93 will pave the way to retest 195.86 high. This will now remain the favored case as long as 148.93 support holds.
Economic Indicators Update
| GMT | Ccy | Events | Actual | Forecast | Previous | Revised |
|---|---|---|---|---|---|---|
| 23:50 | JPY | Corporate Service Price Index Y/Y Sep | 2.10% | 1.80% | 1.90% | 2.00% |
| 00:00 | NZD | ANZ Business Confidence Oct | -42.7 | -36.7 | ||
| 00:30 | AUD | CPI Q/Q Q3 | 1.80% | 1.50% | 1.80% | |
| 00:30 | AUD | CPI Y/Y Q3 | 7.30% | 6.90% | 6.10% | |
| 00:30 | AUD | RBA Trimmed Mean CPI Q/Q Q3 | 1.80% | 1.50% | 1.50% | 1.60% |
| 00:30 | AUD | RBA Trimmed Mean CPI Y/Y Q3 | 6.10% | 5.60% | 4.90% | |
| 08:00 | CHF | Credit Suisse Economic Expectations Oct | -69.2 | |||
| 08:00 | EUR | Eurozone M3 Money Supply Y/Y Sep | 6.10% | 6.10% | ||
| 12:30 | USD | Goods Trade Balance (USD) Sep P | -87.8B | -87.3B | ||
| 12:30 | USD | Wholesale Inventories Sep P | 1.30% | 1.30% | ||
| 14:00 | USD | New Home Sales Sep | 590K | 685K | ||
| 14:00 | CAD | BoC Interest Rate Decision | 4.00% | 3.25% | ||
| 14:30 | USD | Crude Oil Inventories | -0.3M | -1.7M | ||
| 15:00 | CAD | BoC Press Conference |
Technical Outlook and Review
USD/JPY:
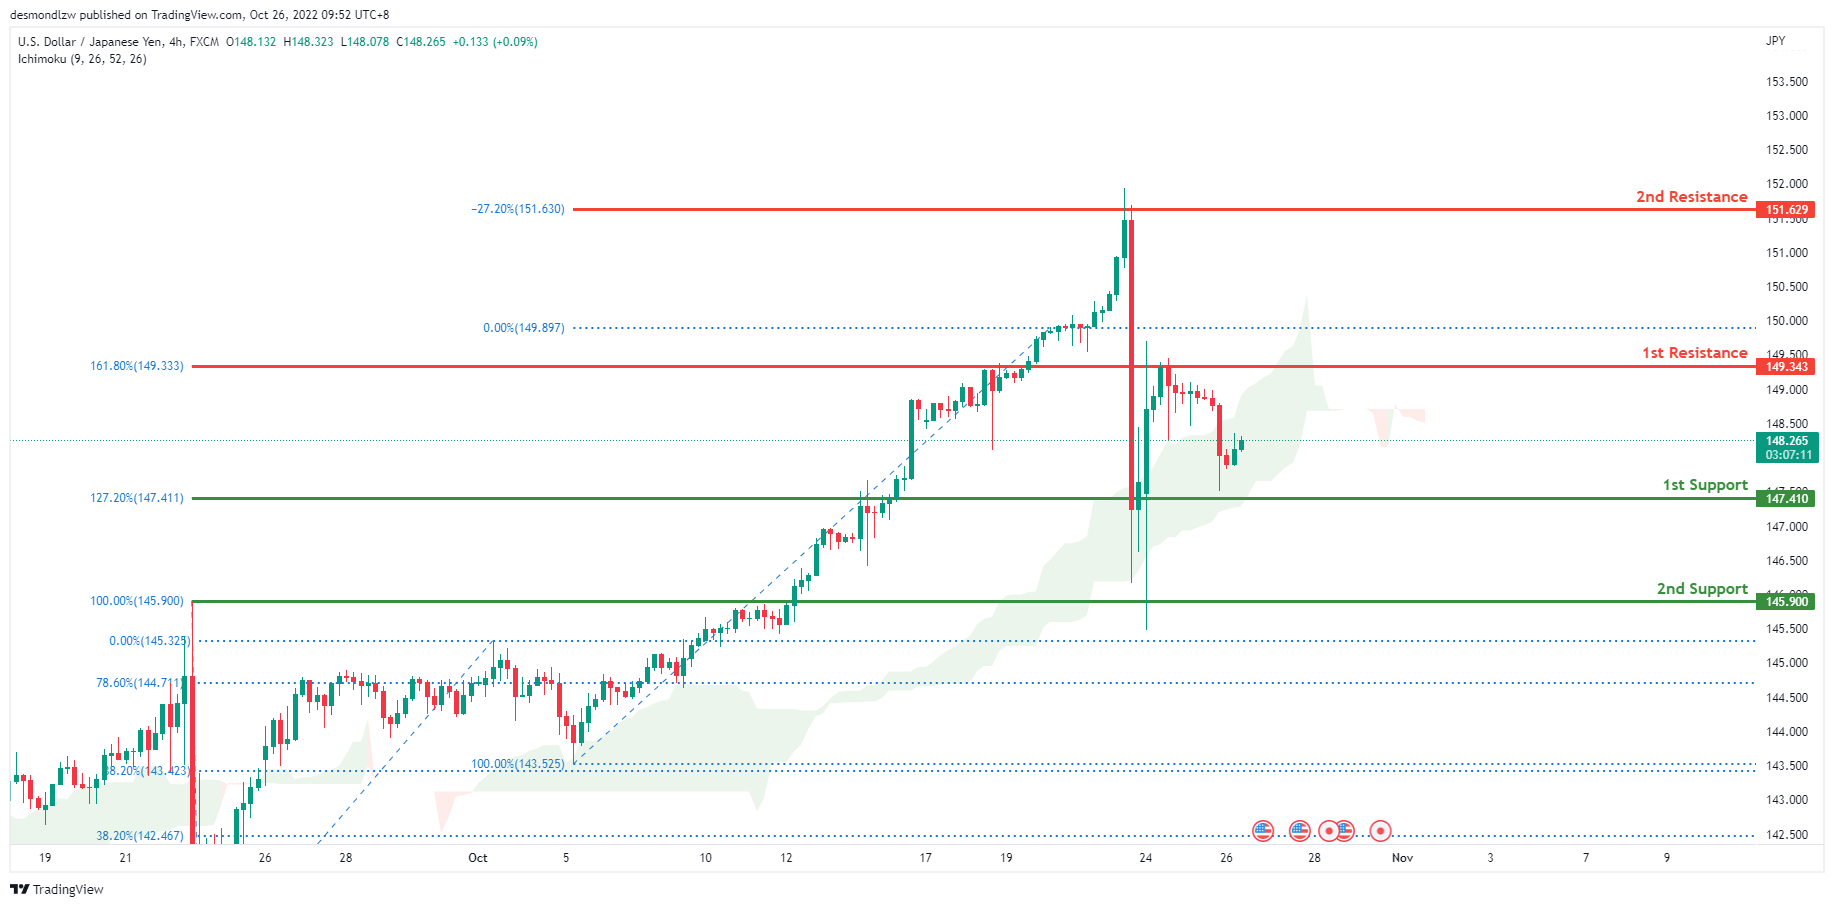
The current general bias for USDJPY on the H4 chart is bullish. Overnight, price retraced downwards from the 1st resistance at 149.343 where the 161.8% Fibonacci line is located. If this bearish retracement continues, expect price to head towards the 1st support at 147.410 where the 127.2% Fibonacci line is located.
Areas of consideration:
- H4 time frame, 1st resistance at 151.629
- H4 time frame, 1st support at 149.313
DXY:
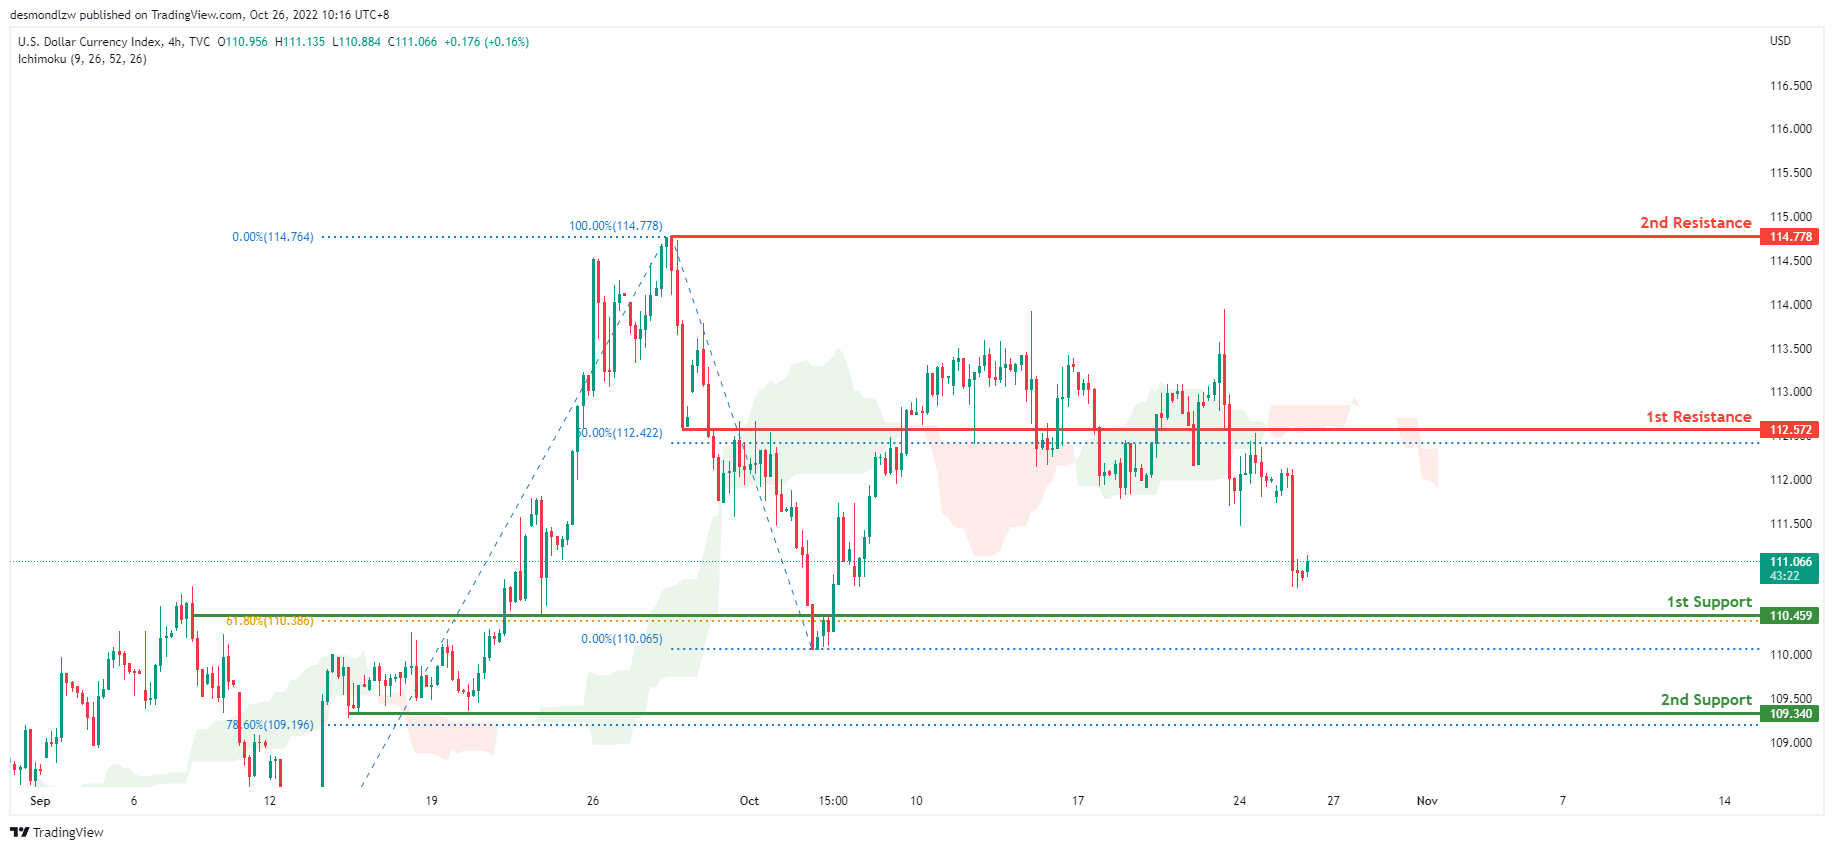
On the H4 chart, the overall bias for DXY is bearish. To add confluence to this, the price is below the Ichimoku cloud which indicates a bearish market. Overnight, DXY had massive bearish momentum downwards. If this bearish momentum continues, expect price to possibly head towards the 1st support at 110.459 where the 61.8% Fibonacci line is located.
Areas of consideration:
- H4 time frame, 1st resistance at 114.759
- H4 time frame, 1st support at 110.084
EUR/USD:
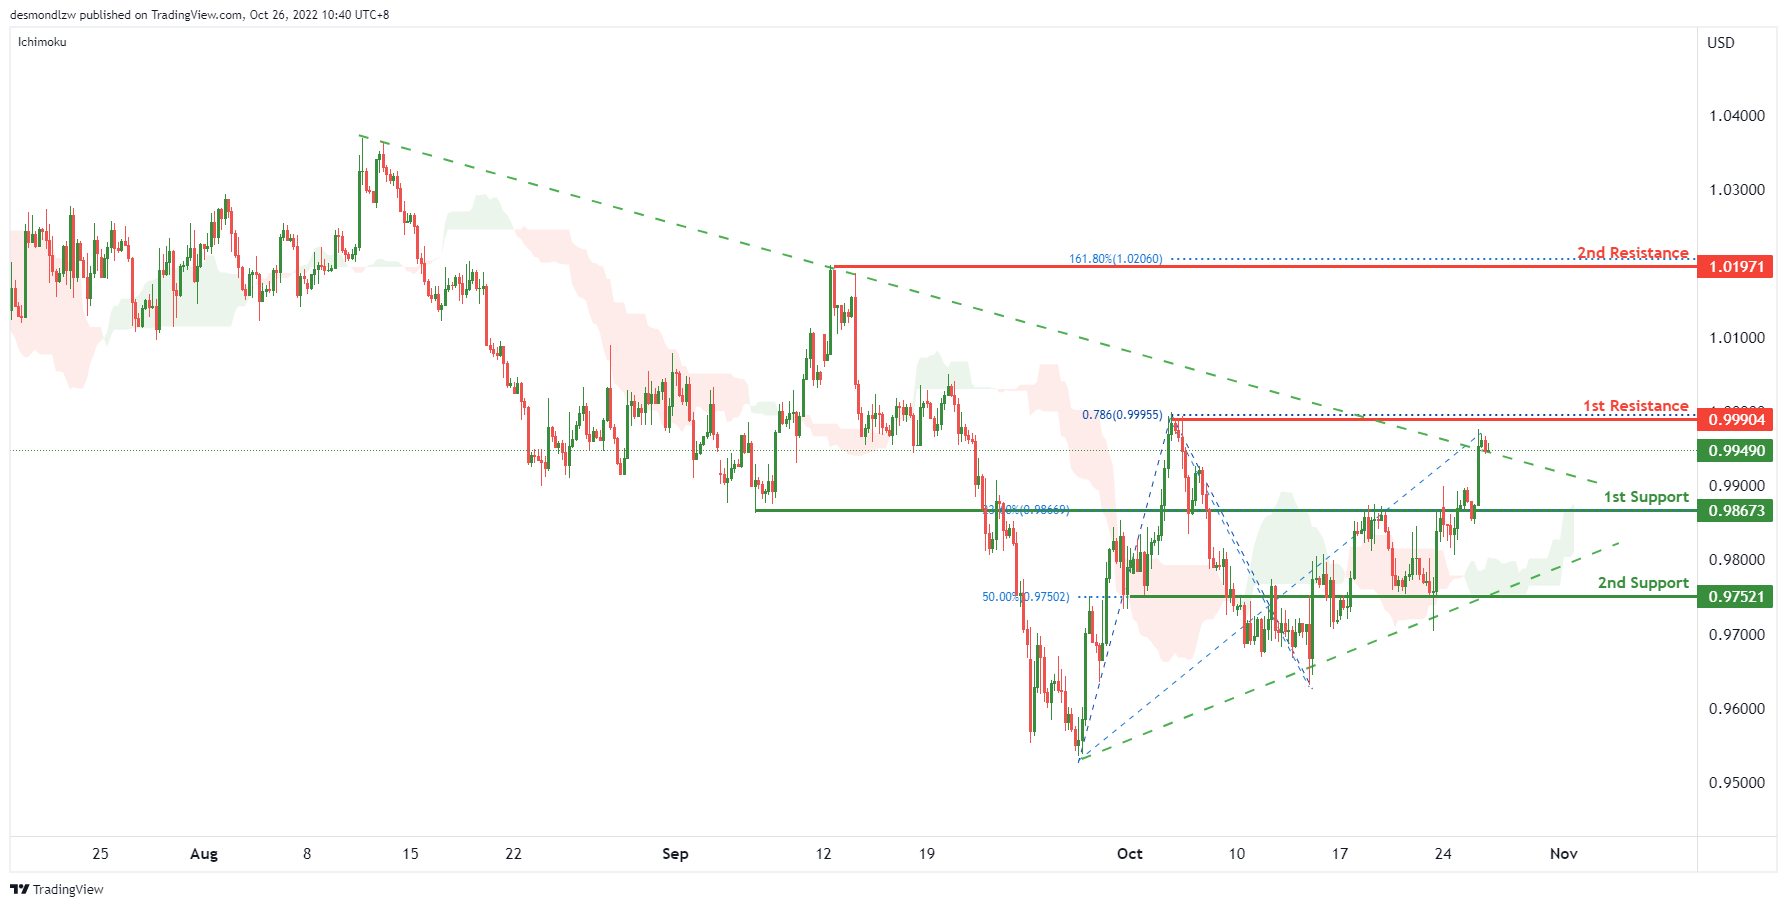
On the H4, price is moving within the short term ascending trendline and breaking the long term ascending trendline, we have a bullish bias that the price may rise to the 1st resistance at 0.99904, which is in line with the previous swing high and 78.6% fibonacci projection. If the 1st resistance is broken, the 2nd resistance is at 1.01971, where the previous swing high and 161.8% fibonacci extension are. Alternatively, the price may drop to the 1st support at 0.98673, which is in line with the 23.6% fibonacci retracement and previous swing low. If the 1st support is broken, the 2nd support is at 0.97521, where the 50% fibonacci retracement sits.
Areas of consideration :
- H4 1st resistance at 0.99904
- H4 1st support at 0.98673
GBP/USD:
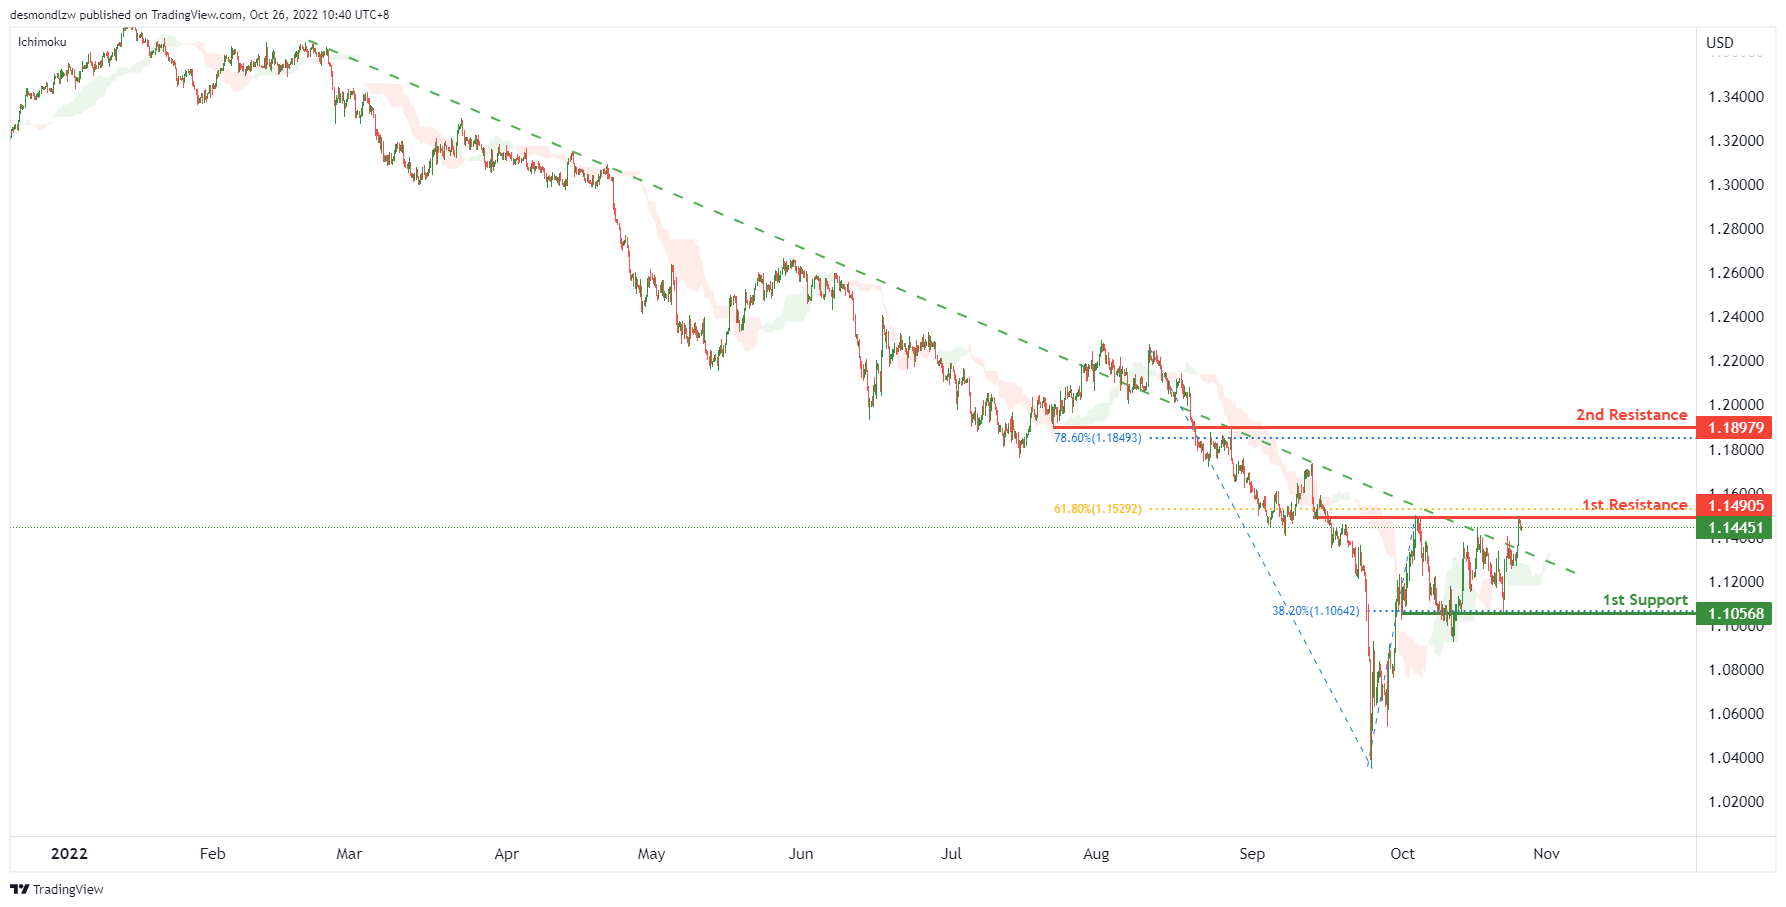
On the H4, price is crossing ichimoku cloud and breaking the descending trendline, we have a bullish bias that the price may test the 1st resistance at 1.14905, which is in line with the overlap resistance and 61.8% fibonacci retracement. If the 1st resistance is broken, the 2nd resistance is at 1.18979, where the overlap resistance and 78.6% fibonacci retracement are. Alternatively, the price may drop to the 1st support at 1.10568, where the swing low support and 38.2% fibonacci retracement are.
Areas of consideration:
- H4 1st resistance at 1.14905
- H4 2nd resistance at 1.18979
USD/CHF:
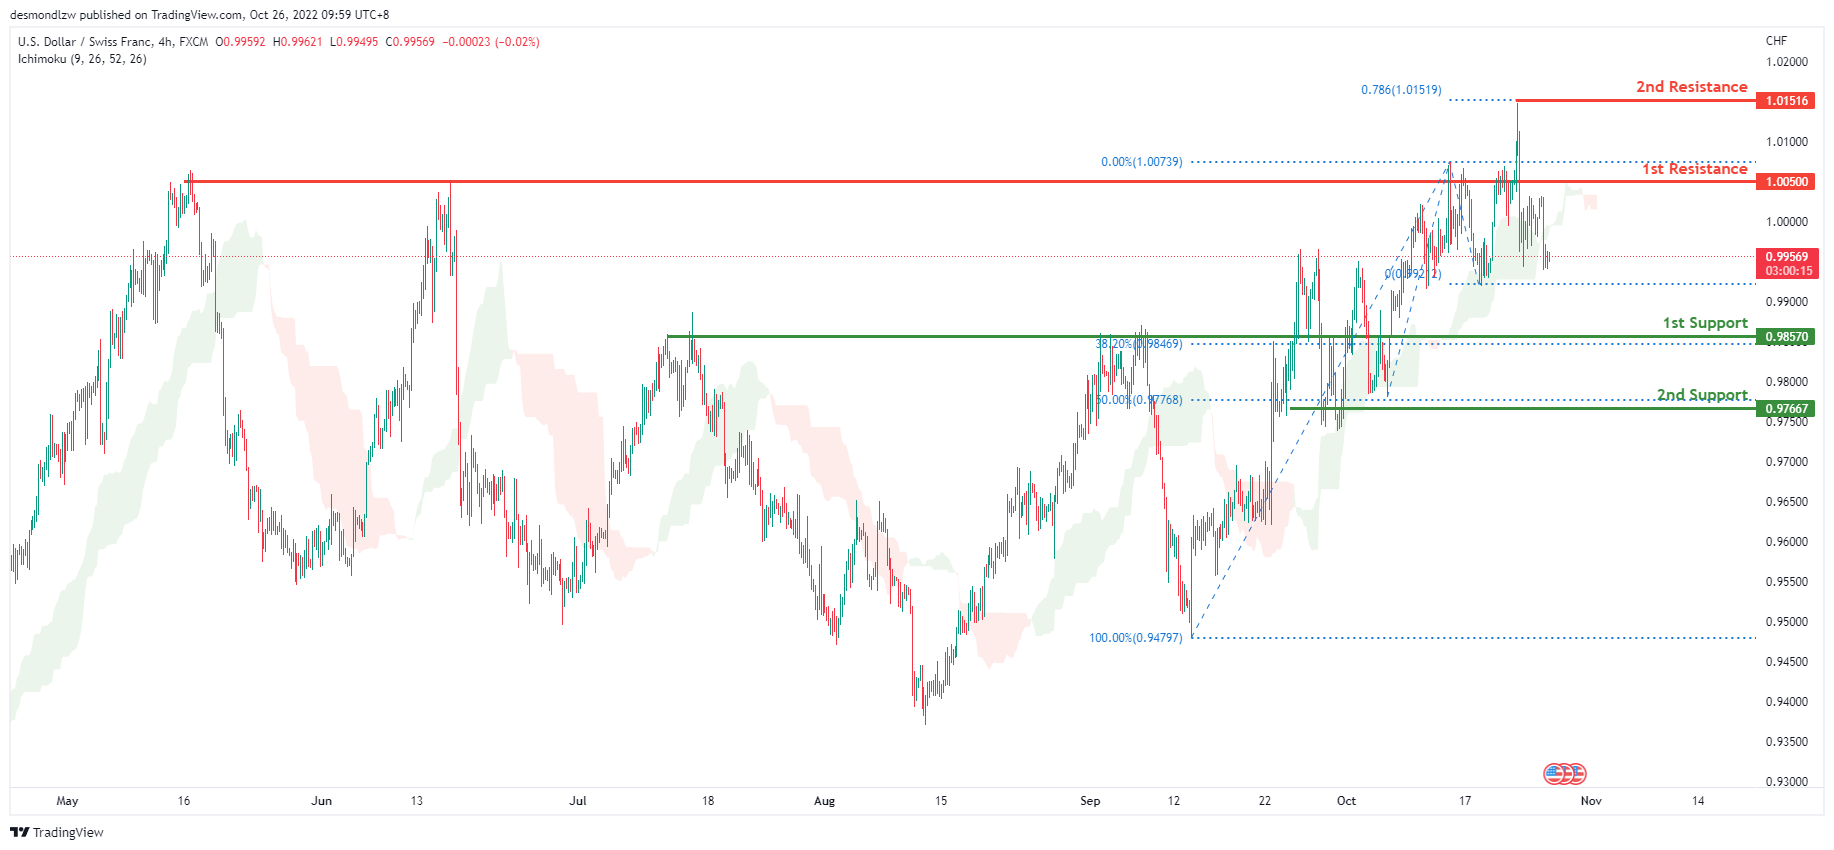
On the H4 chart, the overall bias for USDCHF is bullish. However overnight, price continued its bearish retracement downwards and closed below the Ichimoku cloud which might indicate a change to bearish momentum. If this bearish momentum continues, expecting price to head towards the 1st support at 0.98570 where the 38.2% Fibonacci line is located.
Areas of consideration
- H4 1st support at 0.9857
- H4 1st resistance at 1.0050
XAU/USD (GOLD):
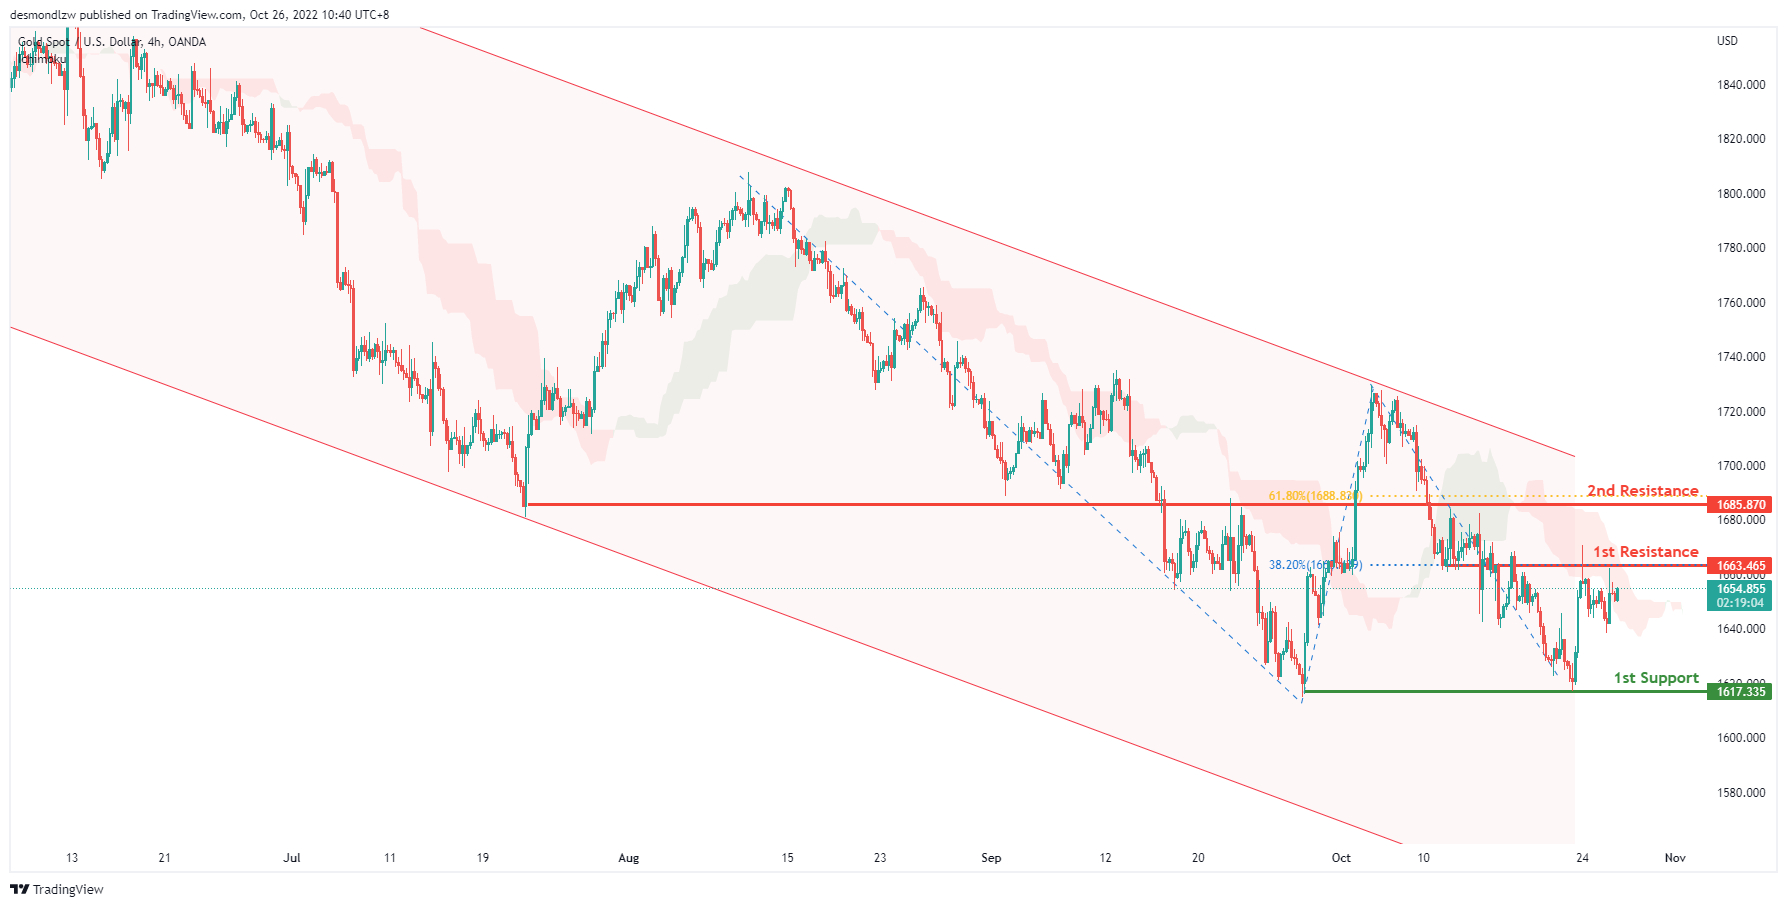
On the H4 chart, the overall bias for XAUUSDis bearish. To add confluence to this, the price is below the Ichimoku cloud which indicates a bearish market. Price has tapped onto the 1st resistance at 1663.465, where the 38.2% Fibonacci line is located before reflecting back down. Expecting price to possibly head back up to retest the 1st resistance and then drop to the 1st support at 1617.335.
Areas of consideration:
- H4 time frame, 1st support at 1617.335
- H4 time frame, 1st resistance at 1663.465
AUD/USD:
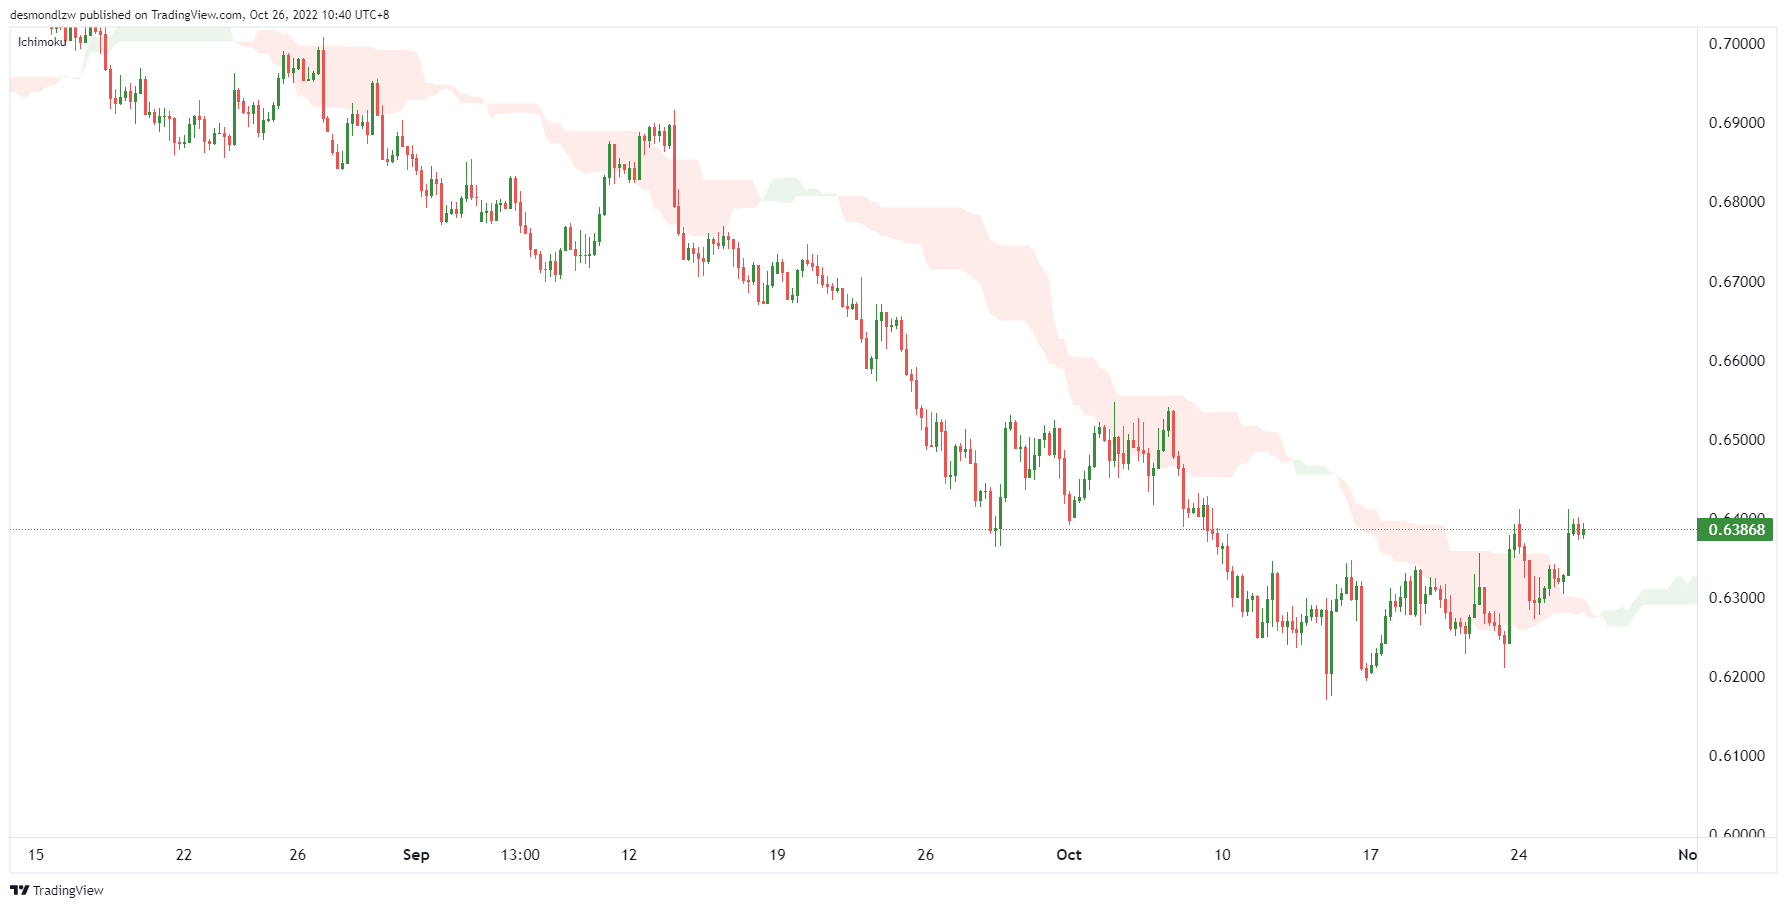
On the H4, with the price breaking the descending channel and ichimoku cloud, we have a bullish bias that the price may retest the 1st resistance at 0.64185, which is in line with the overlap resistance, if the 1st resistance is broken, the 2nd resistance is at 0.65388, where the previous swing high is. Alternatively, the price may drop to the 1st support at 0.62906, which is in line with the 50% fibonacci retracement. If the 1st support is broken, the price may drop to the 2nd support at 0.61921, where the previous swing low, 61.8% fibonacci projection and 200% fibonacci extension are.
Areas of consideration
- H4, 1st resistance at 0.64185
- H4, 2nd resistance at 0.65388
NZD/USD:
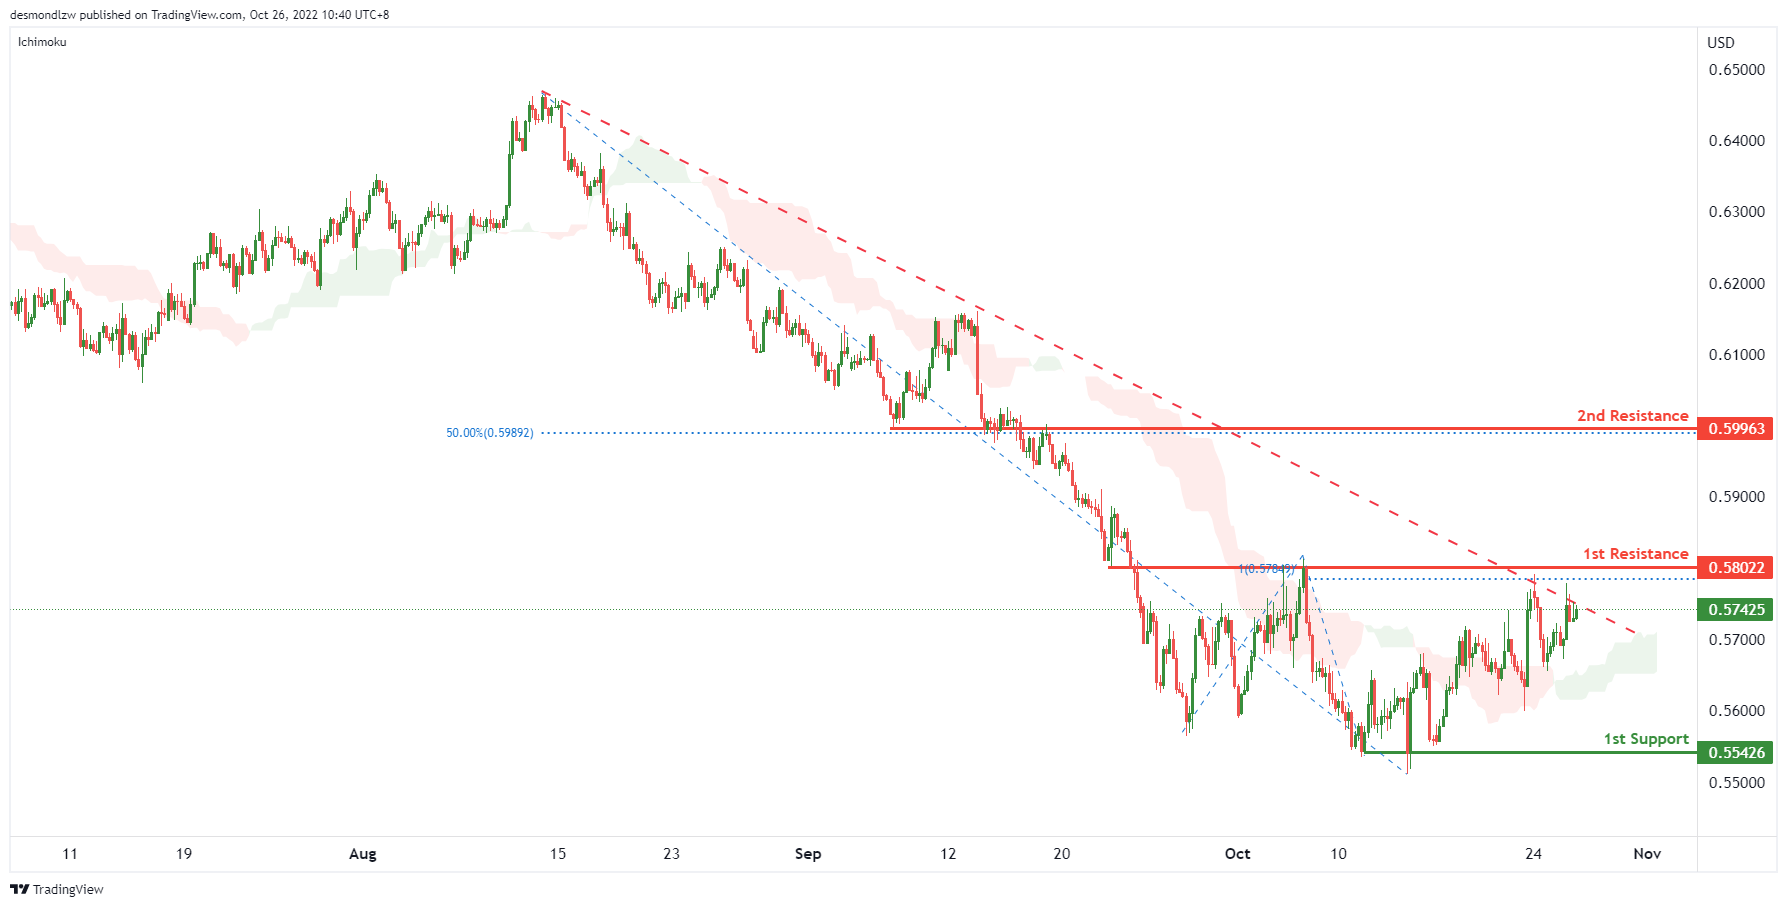
On the H4 chart, as the price is testing the descending trendline and the price is above ichimoku cloud, we have a bullish bias that the price may rise to the 1st resistance at 0.58022, which is in line with the 100% fibonacci projection and previous swing high. If the 1st resistance is broken, the 2nd resistance is at 0.59963, where the overlap resistance and 50% fibonacci retracement are. Alternatively, the price may drop to the 1st support at 0.55426, where the previous swing low is.
Areas of consideration:
- H4 time frame, 1st resistance at 0.58022
- H4 time frame, 2nd resistance at 0.59963
USD/CAD:
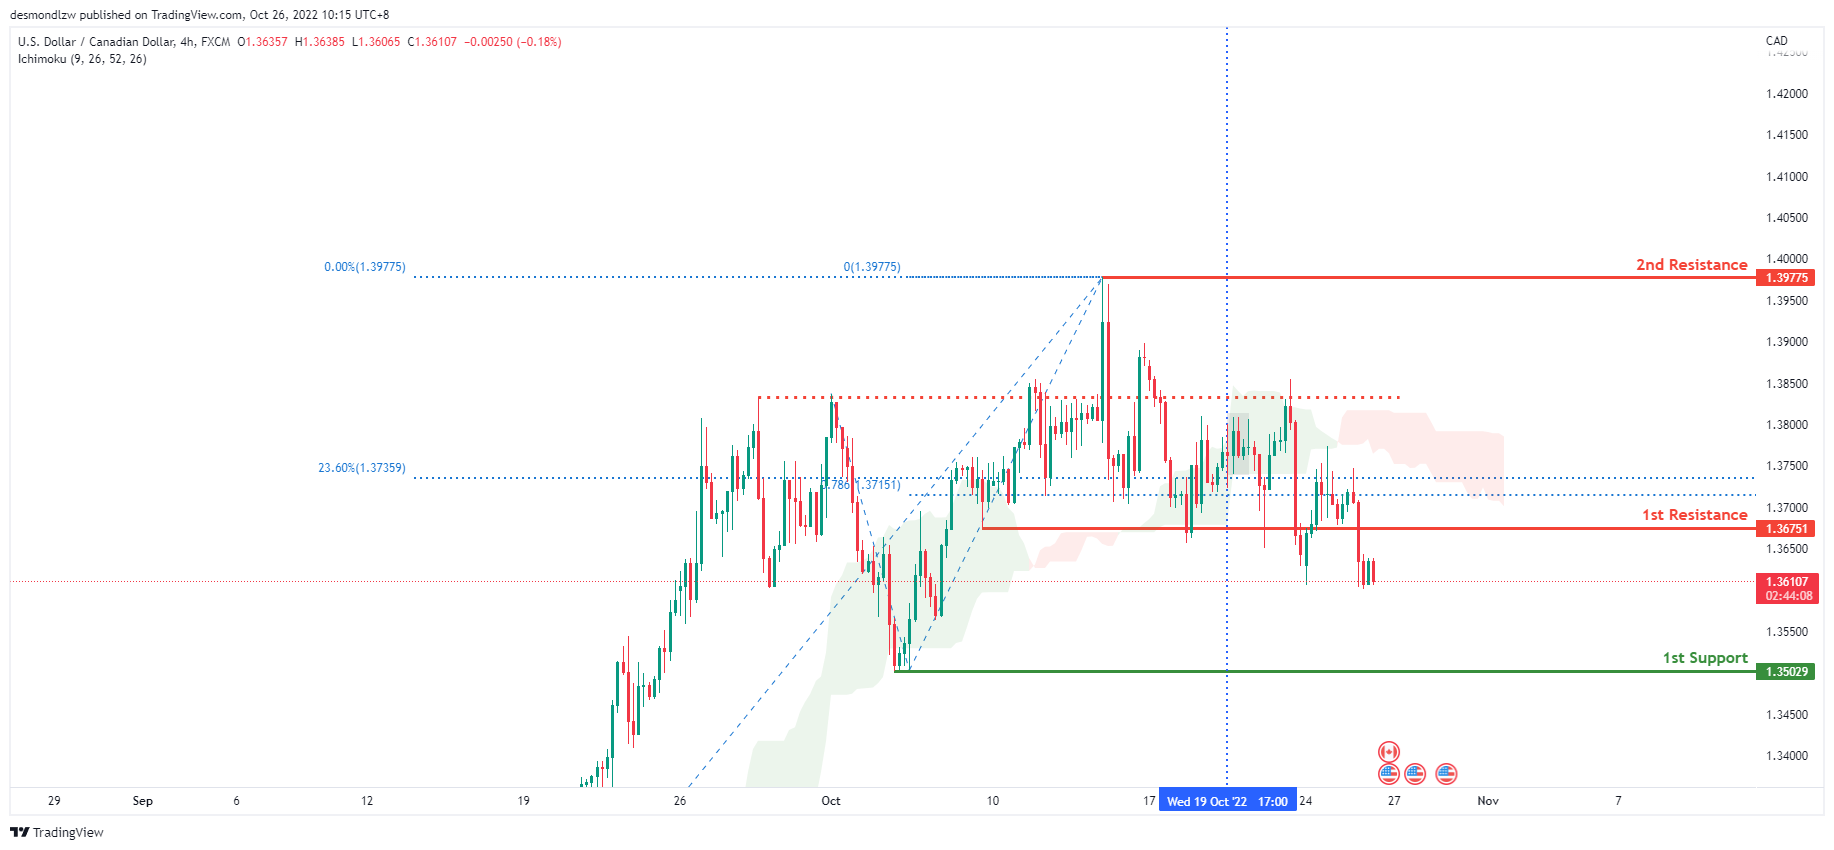
On the H4 chart, the overall bias for USDCAD is bearish. To add confluence to this, the price is below the Ichimoku cloud which indicates a bearish market. Overnight, price has continued its bearish momentum and closed under the 1st resistance at 1.36751 where the 23.6% Fibonacci line and 78.6% Fibonacci projection line is located. If this bearish momentum continues, expect the price to possibly head down towards the 1st support at 1.35029 where the previous low is.
Areas of consideration:
- H4 time frame, 1st resistance at 1.36751
- H4 time frame, 1st support at 1.35029
OIL:
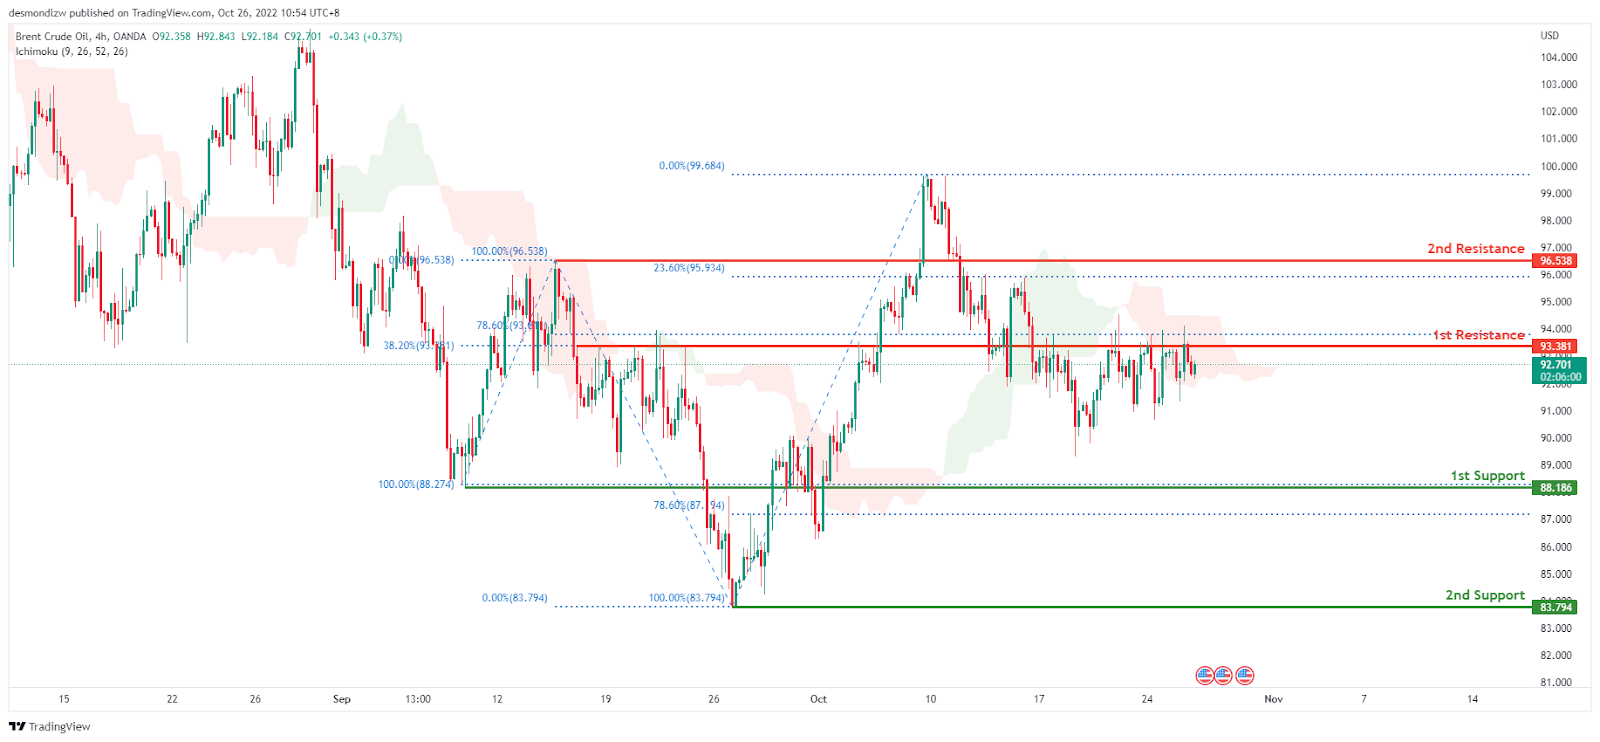
Looking at the H4 chart, the current overall bias for Oil is bearish. The price continued consolidating underneath the 1st resistance line at 93.381 where the 38.2% and 78.6% Fibonacci lines are located. Expecting the price to head towards the 1st support at 88.186 where the 100% and 78.6% Fibonacci lines are located if this bearish momentum continues.
Areas of consideration:
- H4 time frame, 1st resistance at 93.381
- H4 time frame, 1st support at 88.1
Dow Jones Industrial Average:
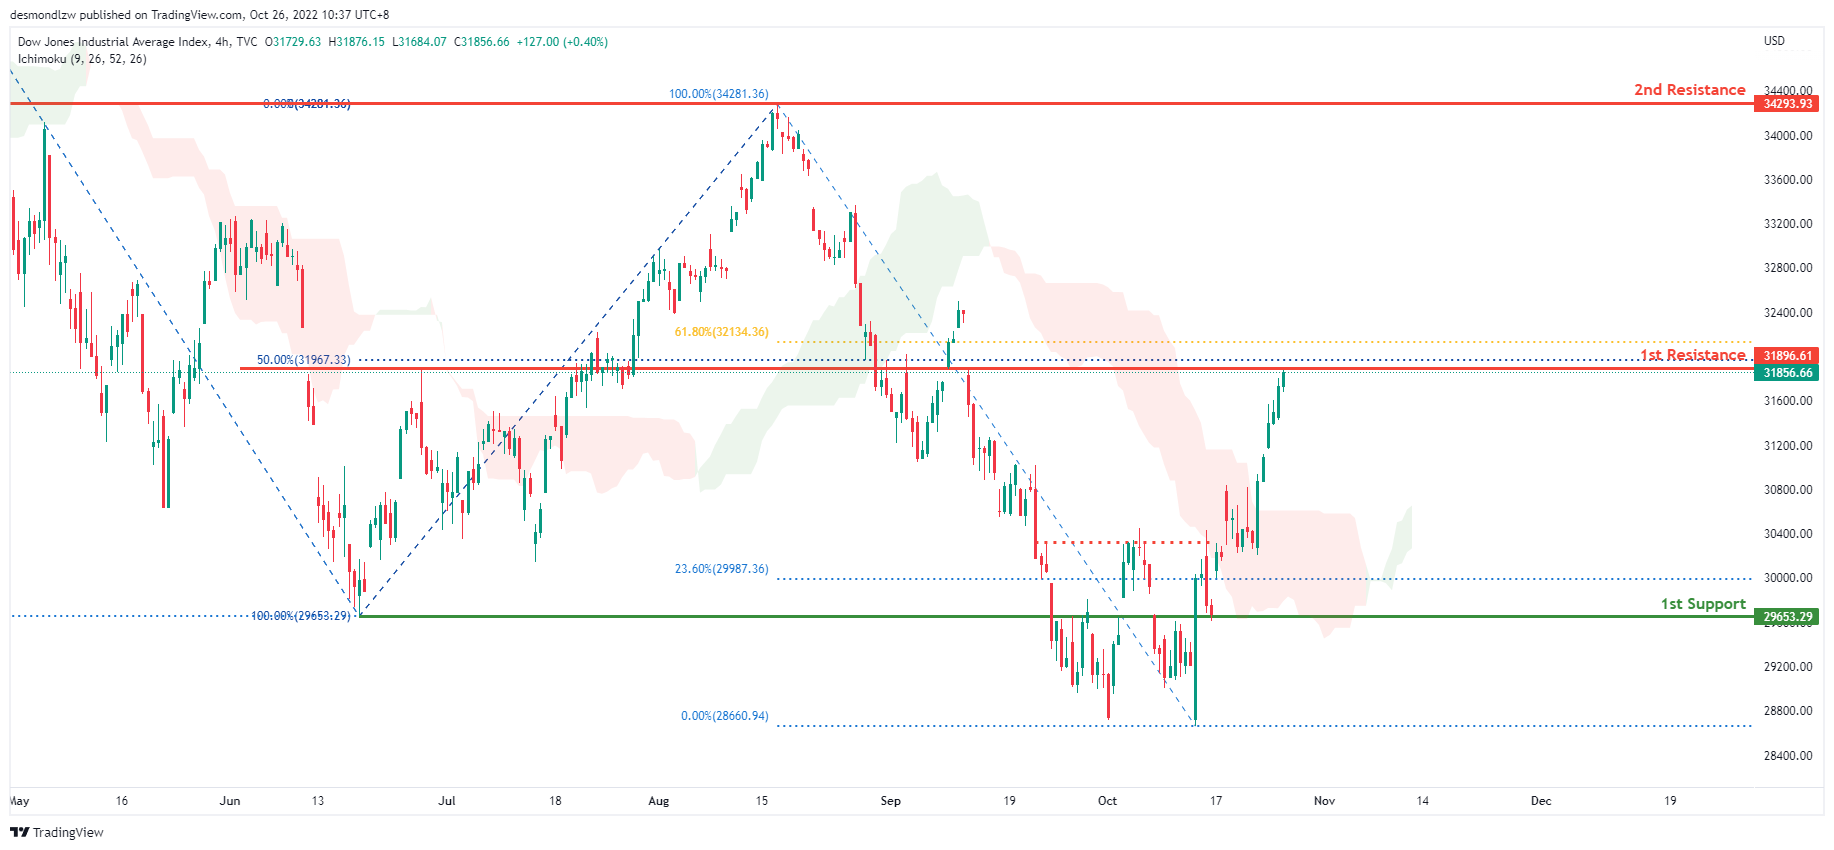
On the H4 chart, the overall bias for DJI is bullish. To add confluence to this, the price is above the Ichimoku cloud which indicates a bullish market. Overnight, price had massive bullish momentum upwards due to the weakening of the DXY. Price has tapped into the 1st resistance at 31896.61, where the 61.8% and 50% Fibonacci lines are and is currently resting there. If this bullish momentum continues, expect price to possibly break above the 1st resistance at 31896.61 and head towards the 2nd resistance at 34293.93 where the previous swing high and 100% Fibonacci line is located.
Areas of consideration:
- H4 time frame, 1st support at 29653.29
- H4 time frame, 1st Resistance at 31896.61
- H4 time frame, 2nd Resistance at 34293.93
DAX:
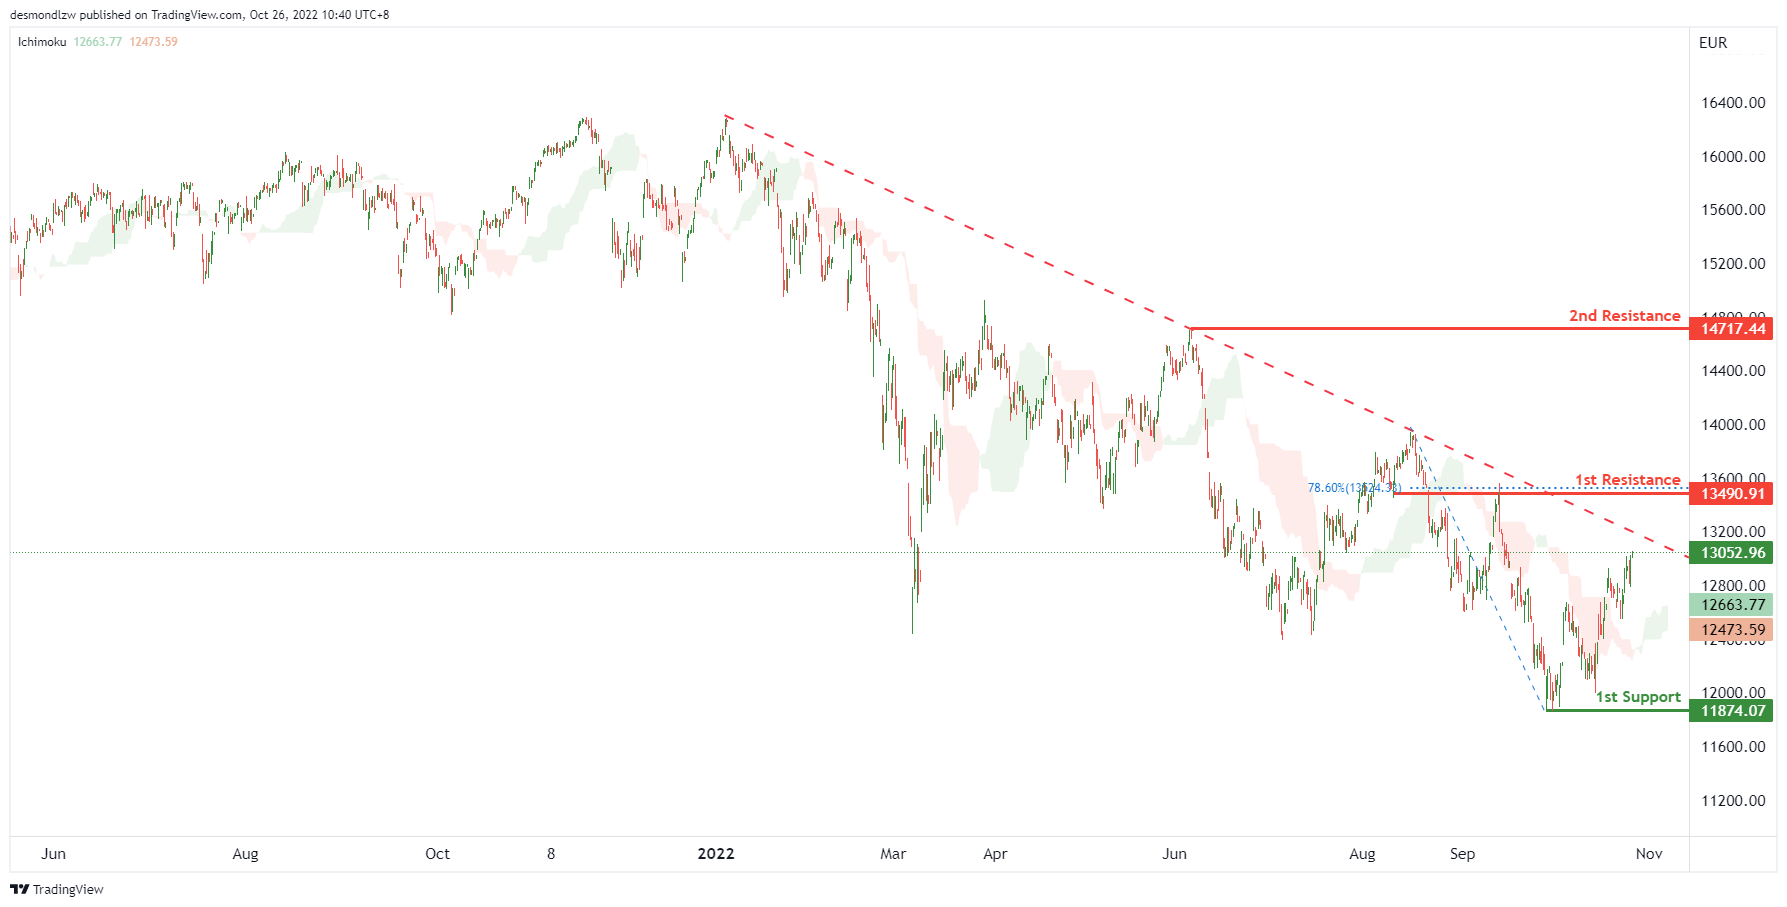
On the H4 chart, the overall bias for DAX is bearish. However, price has now closed above the Ichimoku cloud which indicates a change to bullish market momentum. Expecting price to possibly continue this bullish momentum and head towards the 1st resistance at 13490.91, where the 78.6% Fibonacci line is located. If the 1st resistance is broken, the 2nd resistance could be at 14717.44, which is in line with the previous swing high. Alternatively, the price may drop to the 1st support at 11874.07, which is in line with the swing low.
Areas of consideration:
- H4 time frame, current price
- H4 time frame, 1st resistance at 13490.91
ETHUSD:
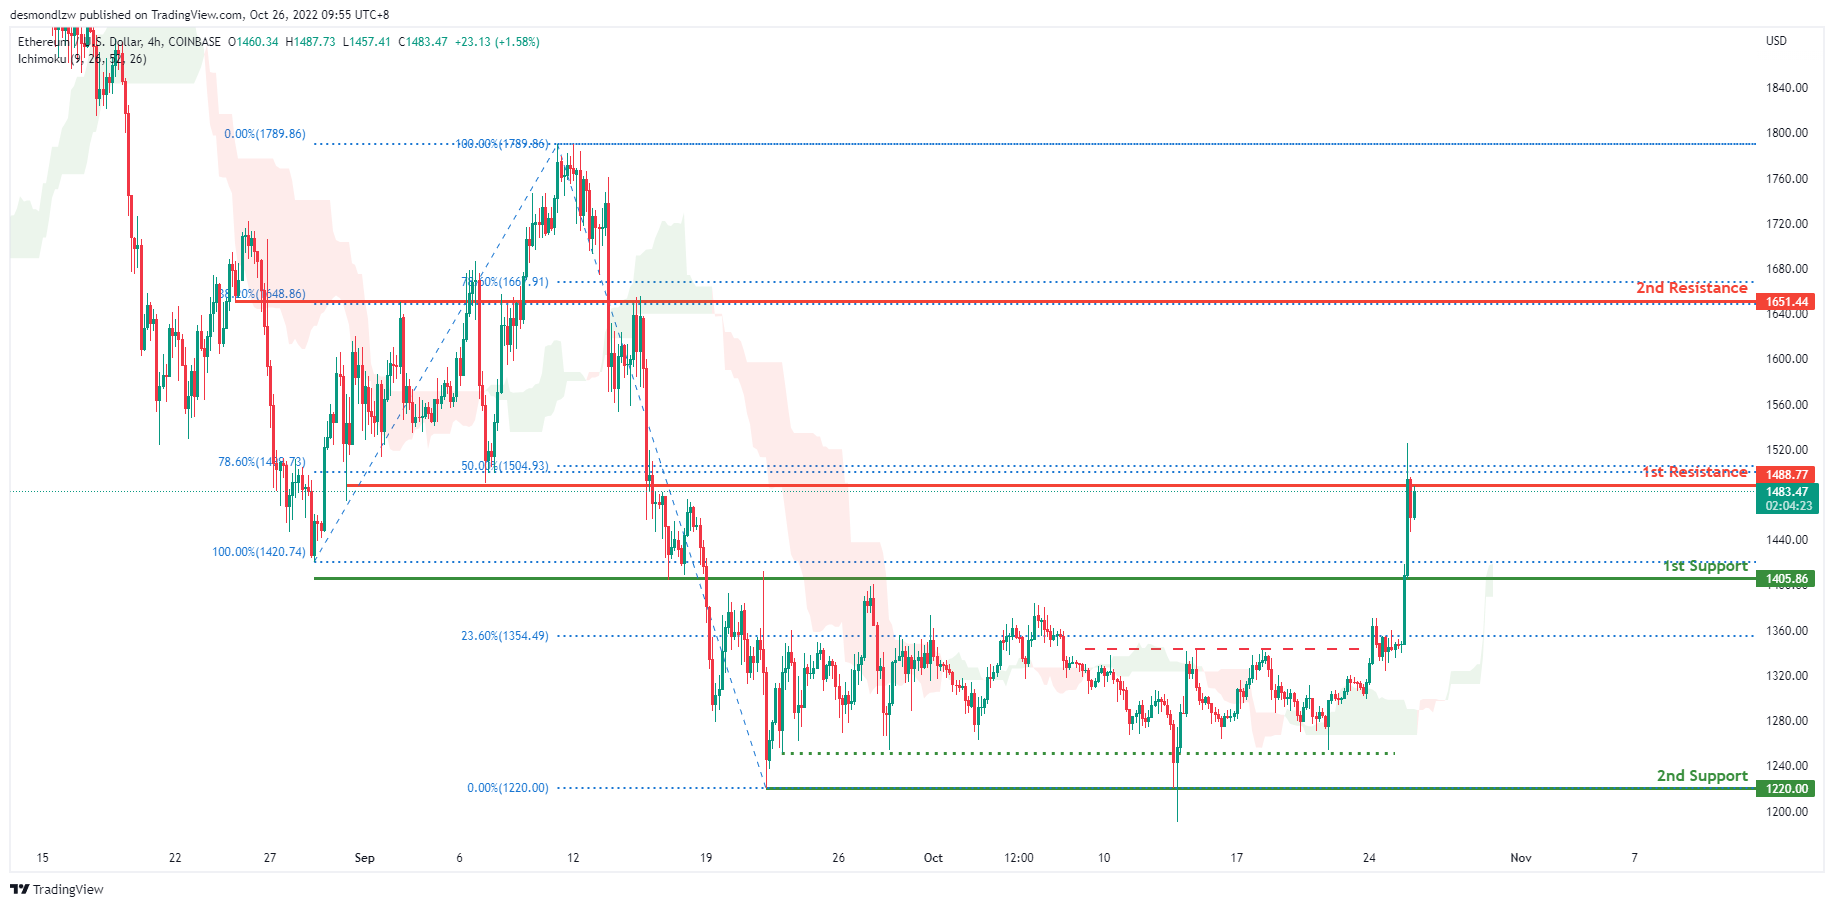
Looking at the H4 chart, the current overall bias for ETHUSD is bearish. However overnight, the price broke out of the consolidation between the 1st resistance at 1405.86 and 1st support at 1405.86. Price has then tapped onto the 1st resistance at 1488.77 where the 78.5% and 50% Fibonacci lines are located. Expecting price to possibly come back down to test the 1st support at 1405.86 where the 100% Fibonacci line and previous swing low is.
Areas of consideration:
- H4 time frame, 1st resistance of 1488.77
- H4 time frame, 1st support at 1405.86
BTCUSD:
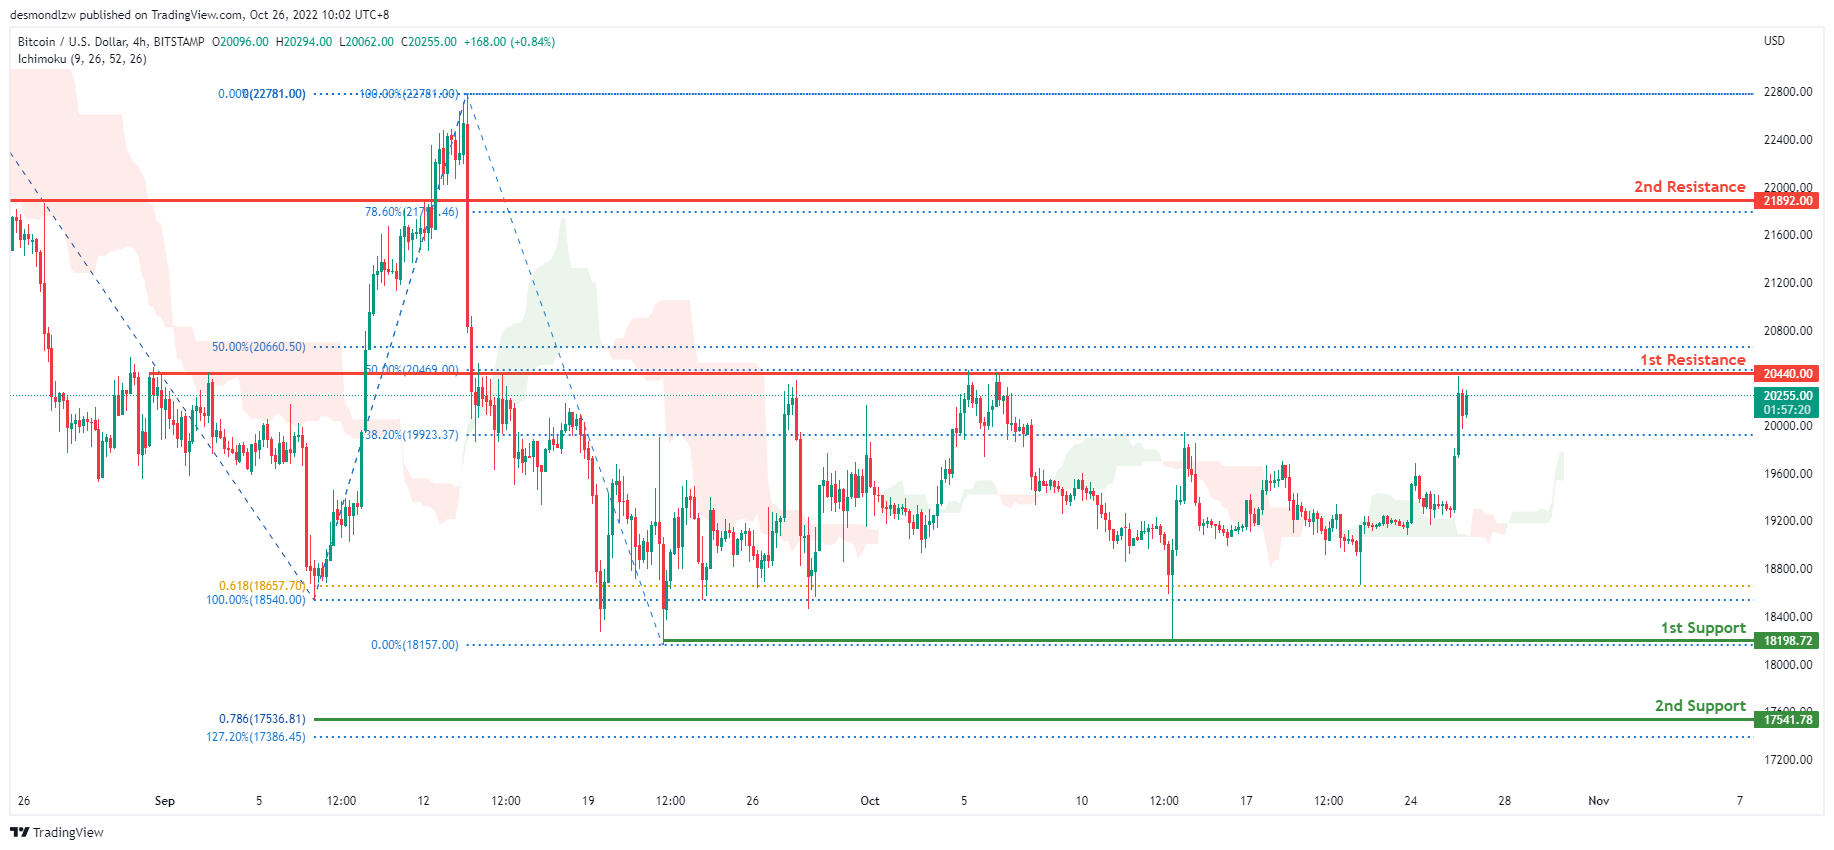
On the H4 chart, price has been consolidating between the 1st resistance at 20440.00 and the 1st support at 18198.72. Overnight, price headed and tapped onto the 1st resistance at 20440.00 where the 50% Fibonacci line is located. Price is also above the Ichimoku cloud which might indicate a change to bullish momentum. If this bullish momentum continues, expect price to possibly close above the 1st resistance and head towards the 2nd resistance at 21892.00 where the 78.6% Fibonacci line is located.
Areas of consideration:
- H4 time frame, 1st resistance 20440.00
- H4 time frame, 2nd resistance 21892.00
- H4 time frame, 1st support at 18220.96
S&P 500:
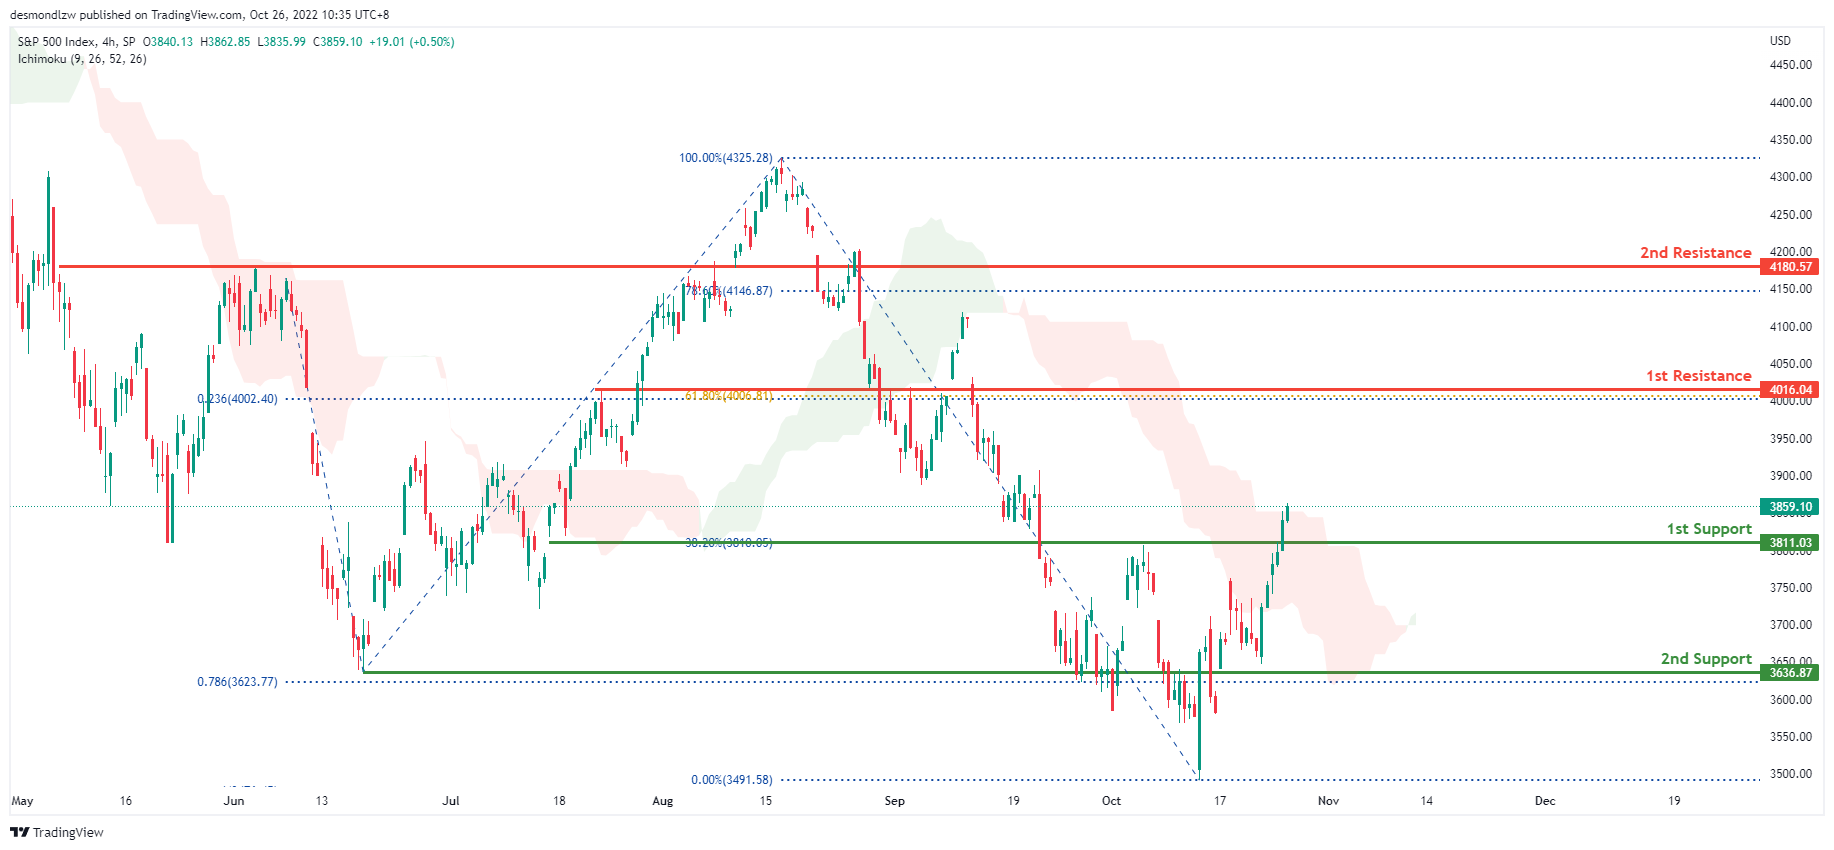
On the H4 chart, the overall bias for S&P500 is bearish. However overnight, price had a massive bullish momentum upwards due to the weakening of the DXY, with price closing above the Ichimoku cloud which might indicate a change to bullish momentum. Price is currently above the 1st support at 3811.03 where the 38.2% Fibonacci line is located. If this bullish momentum continues, expect price to possibly head towards the 1st resistance at 4016.04 where the 61.8% Fibonacci line and 23.6% Fibonacci projection line is located.
Areas of consideration:
- H4 time frame, 1st support at 3811.03
- H4 time frame, 1st resistance at 4016.04
AUD/USD Eyes Fresh Increase, Dollar Dips Further
Key Highlights
- AUD/USD is recovering losses and trading above 0.6350.
- It broke a key bearish trend line with resistance near 0.6380 on the 4-hours chart.
- EUR/USD is attempting a clear move above the 1.0000 resistance.
- GBP/USD gained pace after it broke the 1.1400 resistance zone.
AUD/USD Technical Analysis
The Aussie dollar formed a base above the 0.6200 zone against the US Dollar. AUD/USD started a fresh increase and was able to clear the 0.6320 resistance zone.
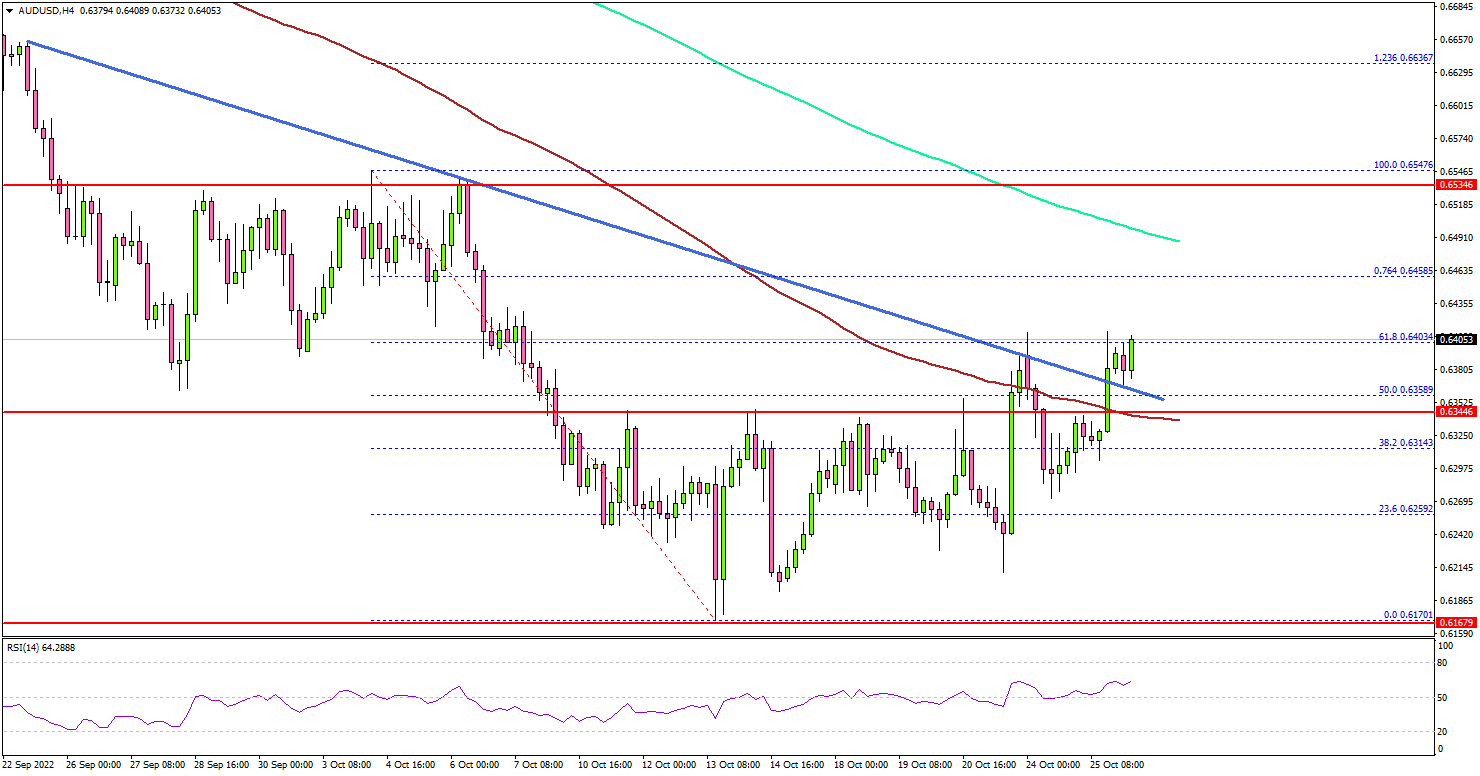
Looking at the 4-hours chart, the pair settled above the 0.6350 level and the 100 simple moving average (red, 4-hours). Besides, there was a break above a key bearish trend line with resistance near 0.6380 on the same chart.
The pair is now trading above the 50% Fib retracement level of the downward move from the 0.6547 swing high to 0.6170 low.
On the upside, an immediate resistance is near the 0.6450 zone. It is near the 76.4% Fib retracement level of the downward move from the 0.6547 swing high to 0.6170 low.
The next major resistance on the upside may perhaps be near 0.6500 or the 200 simple moving average (green, 4-hours). Any more gains could set the pace for a move towards the 0.6550 level. If there is a downside correction, the pair might test the 0.6350 support.
The next major support is near the 0.6250 level. A downside break below the 0.6250 support could send the pair towards the 0.6200 zone. Any more losses could lead the pair towards 0.6120.
Looking at GBP/USD, the pair was able to settle above the 1.1400 resistance zone and might even clear the 1.1500 barrier in the near term.
Economic Releases
- US New Home Sales for Sep 2022 (MoM) – Forecast -13.9% versus 28.8% previous.
- BoC Interest Rate Decision – Forecast 4%, versus 3.25% previous.
BoC to hike 75bps, may signal slower tightening ahead
BoC is widely expected to deliver another rate hike today. The markets seem to have now reached a consensus expectation of a 75bps increase in overnight rate to 4.00%. That would be the highest level since 2008. The tightening cycle shouldn't stop there, but BoC may indicate that the pace would slow ahead. Some analysts are expecting another 50bps hike in December, followed by a 25bps hike early next year. But the decisions beyond together will very depend on upcoming economic data.
Here are some previews on BoC:
- BOC, BOJ Rate Decisions This Week
- Bank of Canada Preview: Will the BOC Hike Rates by 75bps?
- Bank of Canada to Hike Rates Again Amid Inflation Fight
- Will the BoC Satisfy Expectations of Another Triple Hike?
USD/CAD's up trend was capped at 1.3976 earlier this month, on overbought condition. For now, further rise is expected as long as 1.3501 support holds. Up trend from 1.2005 would target 200% projection of 1.2005 to 1.2947 from 1.2401 at 1.4285 on break of 1.3976. Nevertheless, break of 1.3501 support will bring deeper fall to 55 day EMA (now at 1.3430) and below.
NZ ANZ business confidence fell to -42.7, murky outlook but resilient
New Zealand ANZ Business Confidence fell from -36.7 to -42.7 in October. Looking at some details, Own Activity Outlook dropped from -1.8 to -2.5. Cost expectations dropped from 89.8 to 88.6. Employment intentions dropped from 5.9 to 5.0. Price intentions dropped from 68.0 to 64.5. Inflation expectations rebounded from 5.98 to 6.13.
ANZ said: "The economic outlook is certainly murky, but the New Zealand economy has a lot going for it. Debt is higher, but nowhere near the worrying levels other economies are struggling under. We're relatively insulated from the energy cost implications of Russia's invasion of Ukraine. Our primary export base is food, and when it comes down to it, people gotta eat. Housing affordability has improved in a meaningful but so far remarkably painless fashion. Indeed, overall the economy is still surprising economists with its resilience. It's a rougher path ahead, but the country is still moving forward."
Australia CPI jumped to 7.3% yoy in Q3, highest since 1990
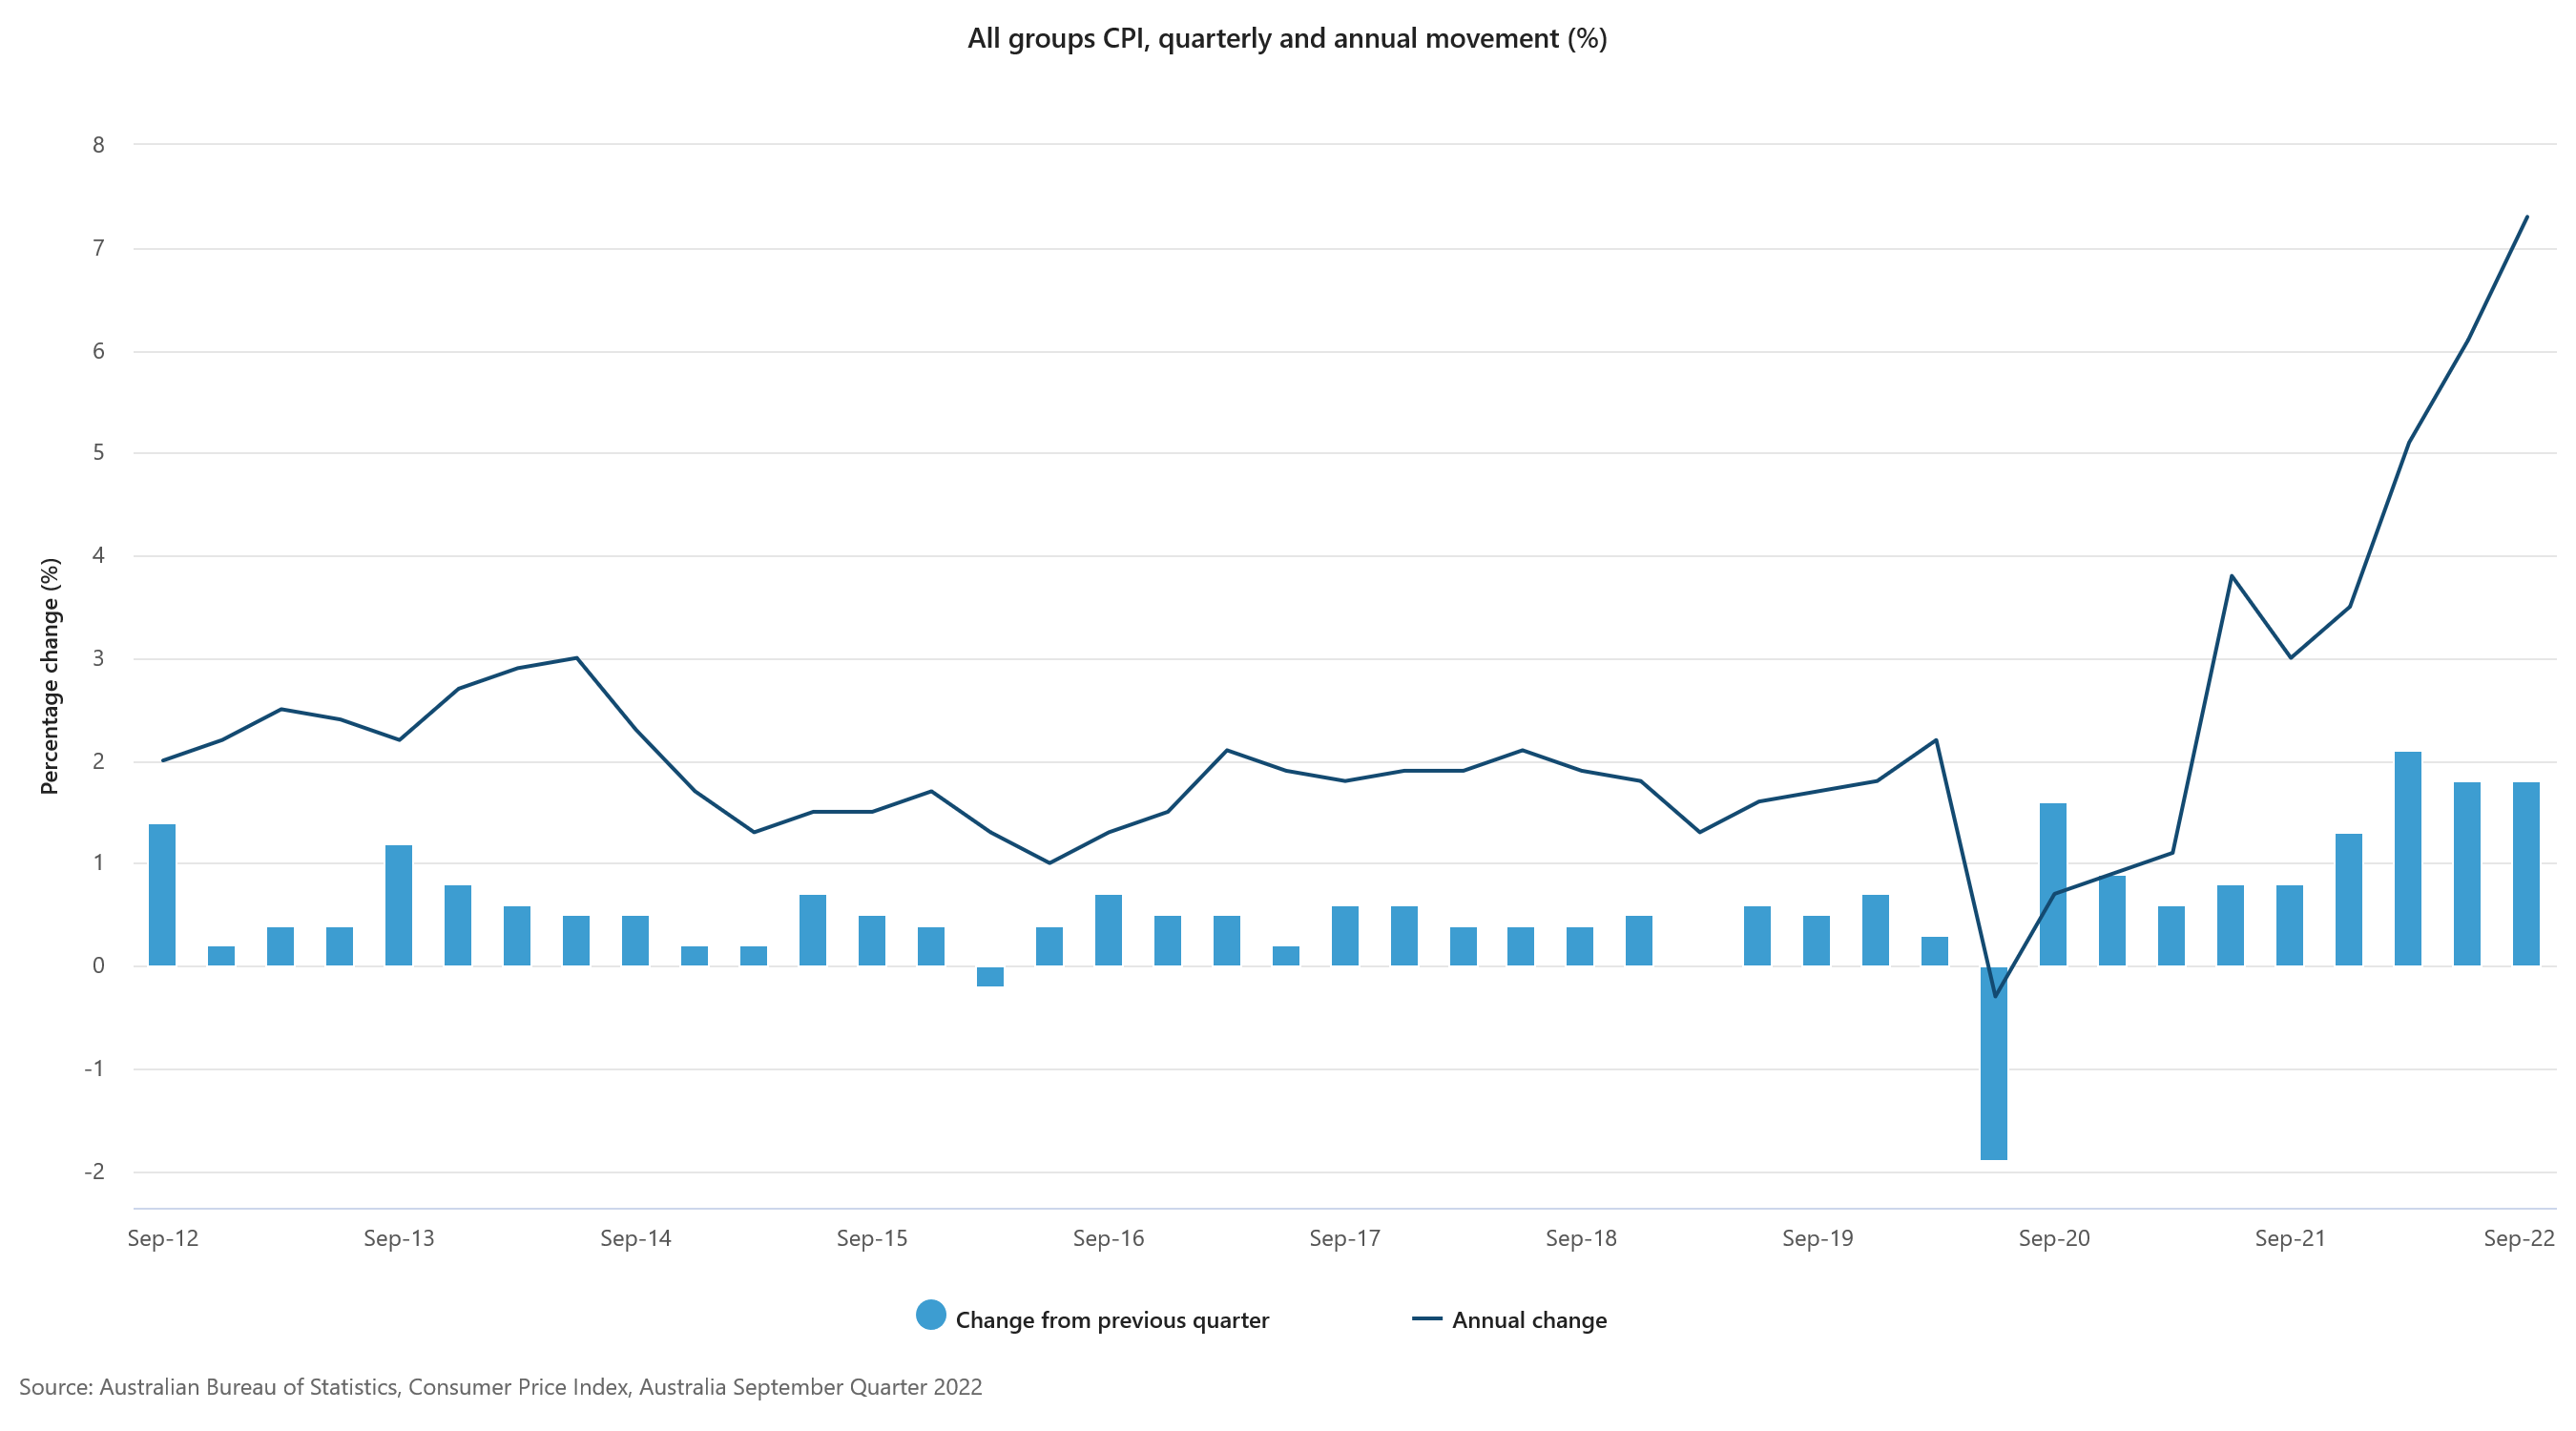
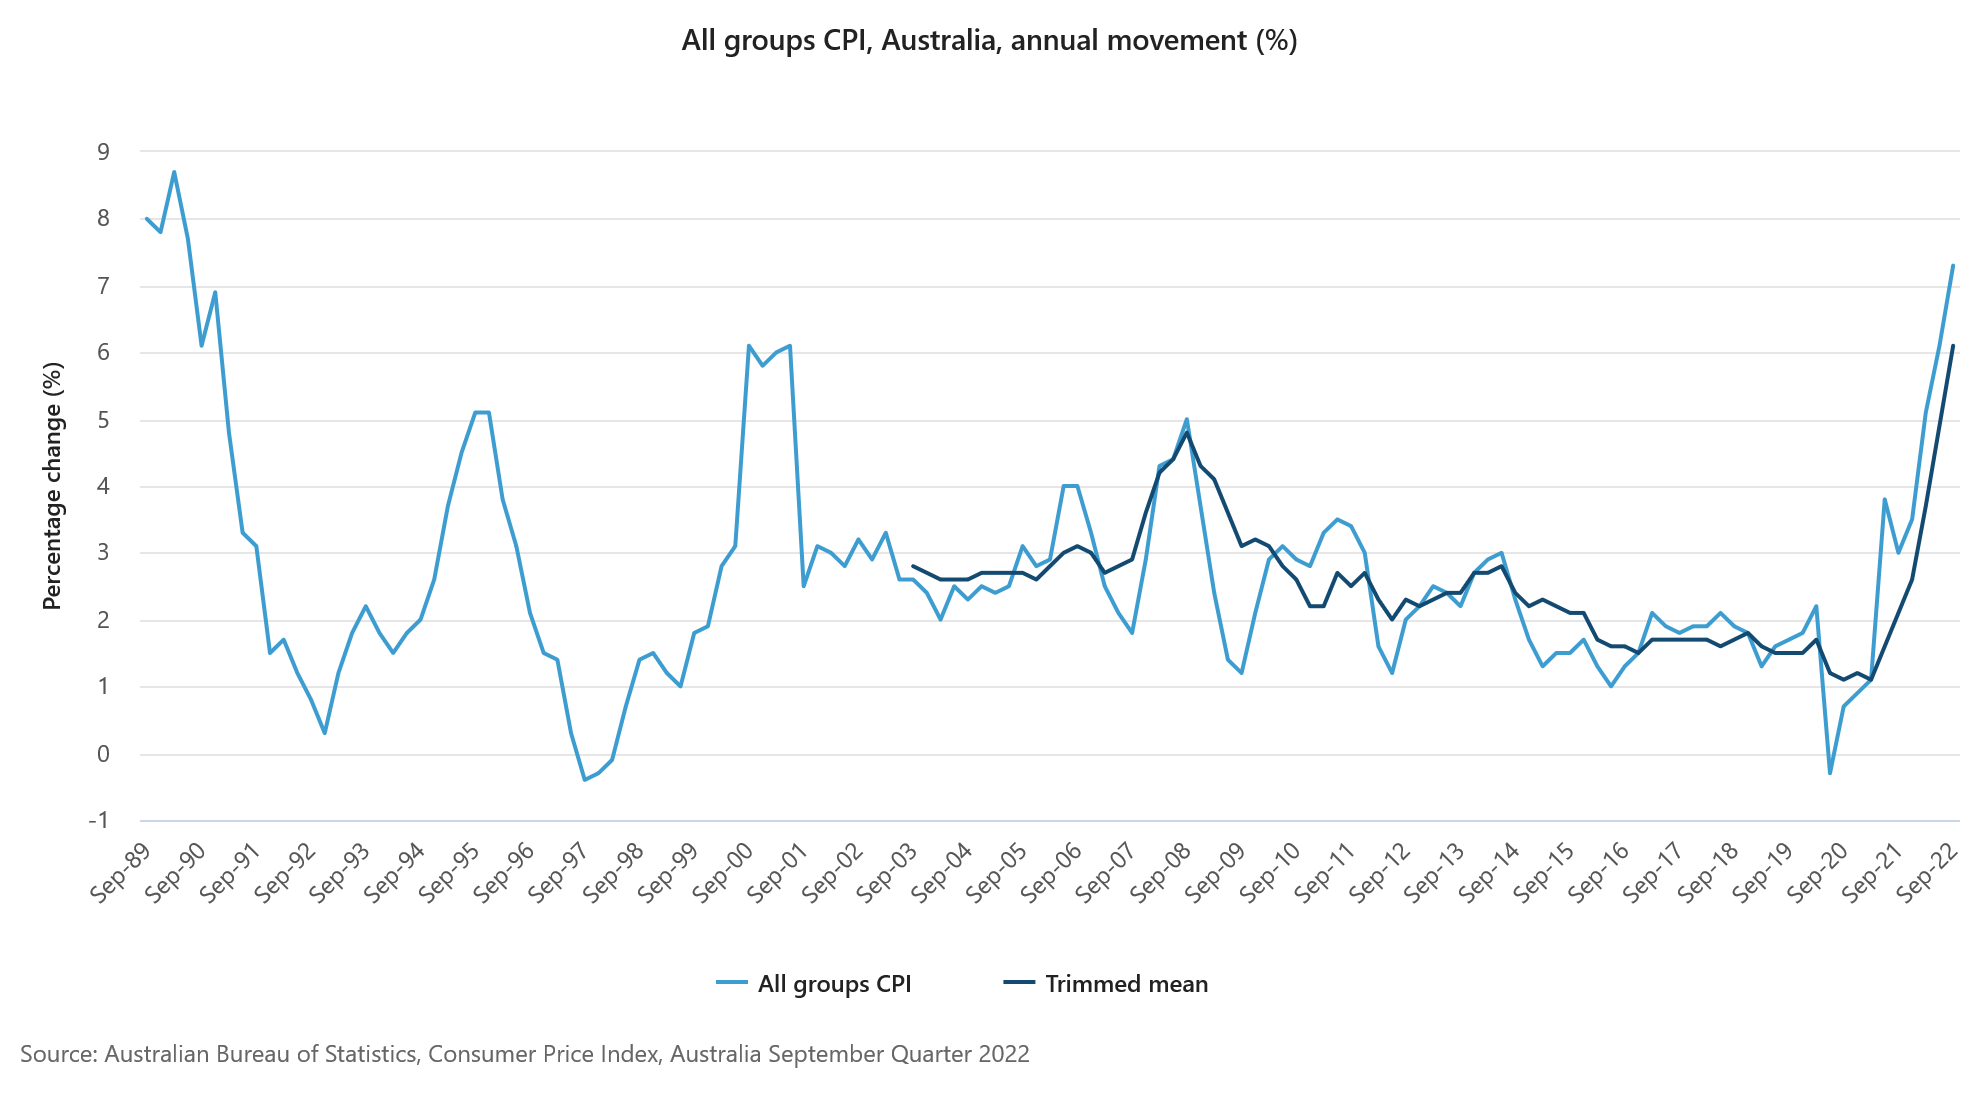
Australia CPI rose 1.8% qoq in Q3, above expectation of 1.5% qoq. Annual rate accelerated from 6.1% yoy to 7.3% yoy, above expectation of 6.9% yoy. That's the highest annual rise since 1990. Trimmed mean CPI, which excludes large price rises and falls, accelerated from 4.9% yoy to 6.1% yoy, highest since the data first published in 2003.
For the quarter, the most significant contributors to the rise were new dwellings (+3.7%), gas (+10.9%) and furniture (+6.6%). Annually, new dwellings (+20.7%) and automotive fuel (+18.0%) were the most significant contributors.
Australia September CPI – Inflation Picks Up The Pace
Headline CPI 1.8%qtr/7.3%yr; Trimmed Mean 1.8%qtr/6.1%yr; Weighted Median 1.4%qtr/5%yr.
It was a broad based upside surprise in the core measures highlighting accelerating inflationary pressures.
The CPI lifted 1.8% in the September quarter with the most significant contributions coming from new dwellings (+3.7%, 0.31ppt), gas (+10.9%; 0.10ppt) and furniture (+6.6 %, 0.09ppt).
Gas and furniture were upside surprises to us but the main difference between our 1.1% forecast and the 1.8% print was the +3.6% in electricity prices vs our forecast for -17% fall due to the state government rebates. Not only did we overestimate the impact of the rebates in Melbourne and Brisbane but we underestimate the 25% increase in Sydney power bills. The ABS estimates that excluding the effect of these schemes in WA, Queensland and ACT, electricity prices would have risen 15.6% in the quarter.
This 16.6% increase in electricity bill will have to appear in December quarter, and possibly into early 2023, as the use of these rebates fade. And this is before any further increase in power bills are applied.
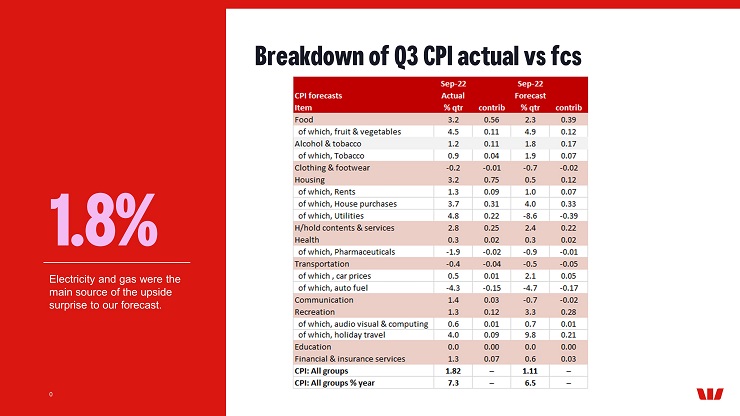
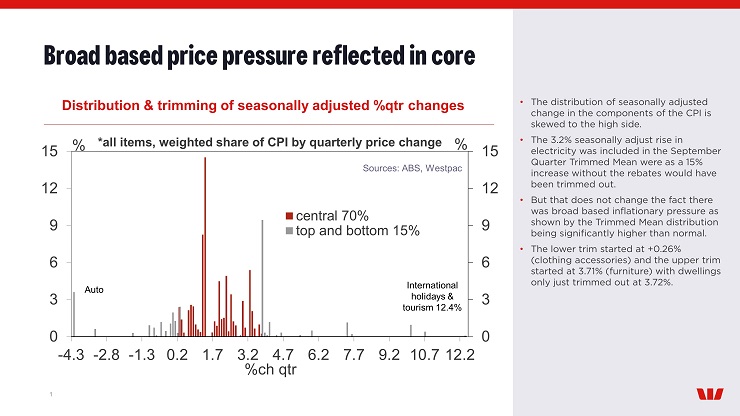
But the real surprise was the 1.8% increase in core inflation. You can argue that the rebates would have had a perverse effect in boosting the Trimmed Mean as the 3.2% seasonally adjust rise in electricity was included in the September Quarter Trimmed Mean were as a 15% increase without the rebates would have been trimmed out.
However, this would not be a valid assumption as it was the broad based nature of the inflationary pressure as shown by the Trimmed Mean distribution being significantly higher than normal. The lower trim started at +0.26% (clothing accessories) and the upper trim started at 3.71% (furniture) with dwellings only just trimmed out at 3.72%.
House price were a touch softer than we expected with the ABS reporting that rising labour costs along with continuation of material shortages added further price pressure. But the rate of growth has moderated reflecting a softening in new demand and some easing in supply constraints and this should continued as we head into 2023.
Food was close to our expectations (+3.2%) however fresh fruit & vegetables where not far off our forecast and the main surprise was the strong rise in meals out & takeaway foods (+2.9%) due to higher ingredient, wage and transportation costs.
Partially offsetting the September quarter rise was the expected fall in automotive fuel (-4.3% per cent), which fell in all three months of the quarter, reflecting falling crude oil prices. But we also note that car prices rose just 0.1%, softer than our expected 2.1% rise.
We are processing the numbers and working through how they will impact on our current inflation forecasts.
USDCHF Wave Analysis
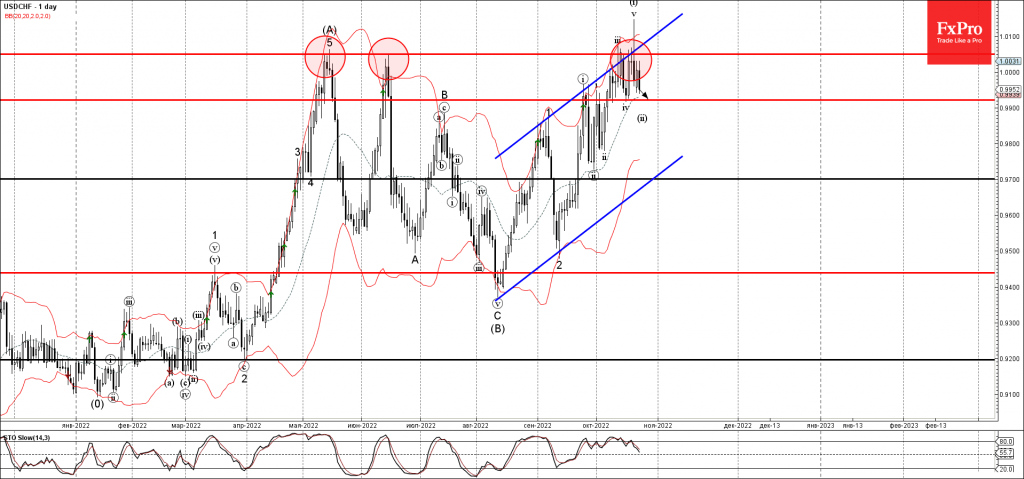
- USDCHF reversed from resistance level 1.0050
- Likely to fall to support level 0.992
USDCHF recently reversed down from the key multi-month resistance level 1.0050 (which has been reversing the price from May), intersecting with the upper daily Bollinger Band and the resistance trendline of the daily up channel from August.
The downward reversal from the resistance level 1.0050 started the active short-term corrective wave (ii).
USDCHF can be expected to fall further toward the next support level 0.992 (low of the previous minor correction (iv))).
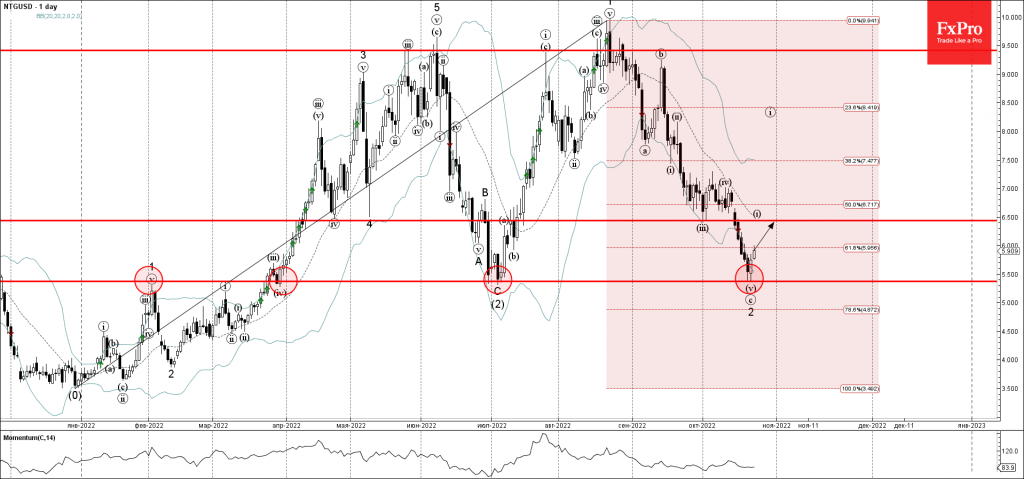
Natural Gas Wave Analysis
- Natural gas reversed from support level 5.370
- Likely to rise to resistance level 6.500
Natural gas recently reversed up from the support level 5.370 (previous multi-month low from July), standing near the lower daily Bollinger Band.
The upward reversal from the support level 5.370 created the daily candlesticks pattern Piercing Line, which started the active impulse wave 3.
Natural gas can be expected to rise further toward the next resistance level 6.5000 (former support from the start of October).