
Sample Category Title
EUR/AUD Daily Outlook
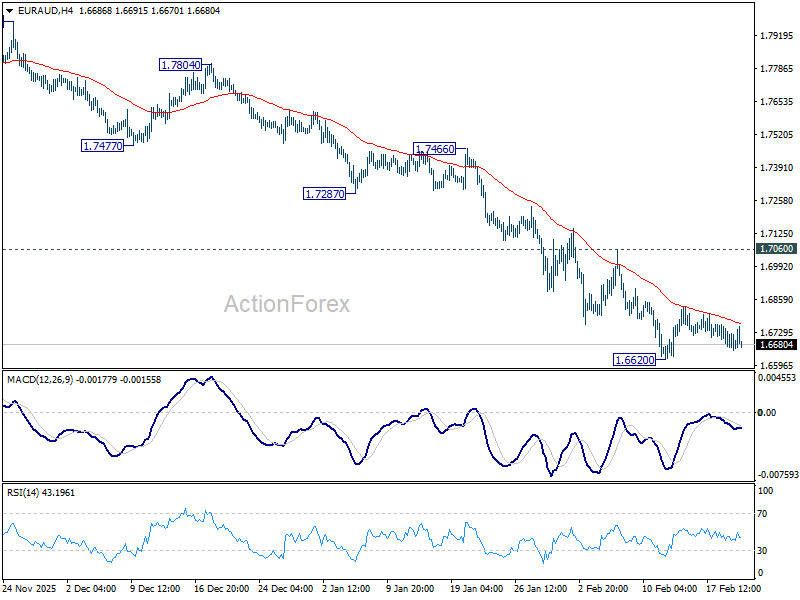
Daily Pivots: (S1) 1.6634; (P) 1.6704; (R1) 1.6749; More...
EUR/AUD is staying in consolidations above 1.6620 and intraday bias remains neutral at this point. With 1.7060 resistance intact, outlook stays bearish and further decline is expected. On the downside, break of 1.6620 will resume larger down trend from 1.8554 to 138.2% projection of 1.8554 to 1.7245 from 1.8160 at 1.6351 next. However, firm break of 1.7060 will indicate short term bottoming, and bring stronger rebound.
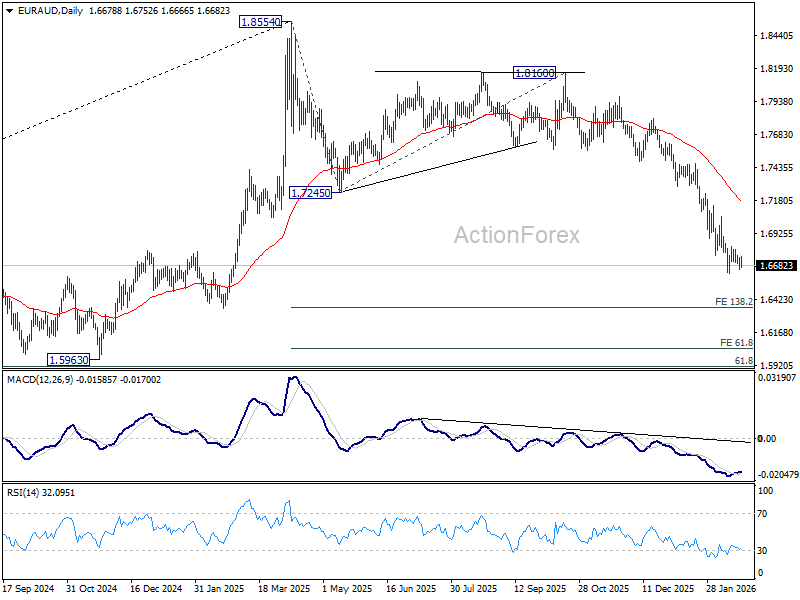
In the bigger picture, fall from 1.8554 medium term top is seen as reversing the whole up trend from 1.4281 (2022 low). Deeper decline should be seen to 61.8% retracement of 1.4281 to 1.8554 at 1.5913, which is slightly below 1.5963 structural support. For now, risk will stay on the downside as long as 1.7245 support turned resistance holds, even in case of strong rebound.
EUR/CHF Daily Outlook
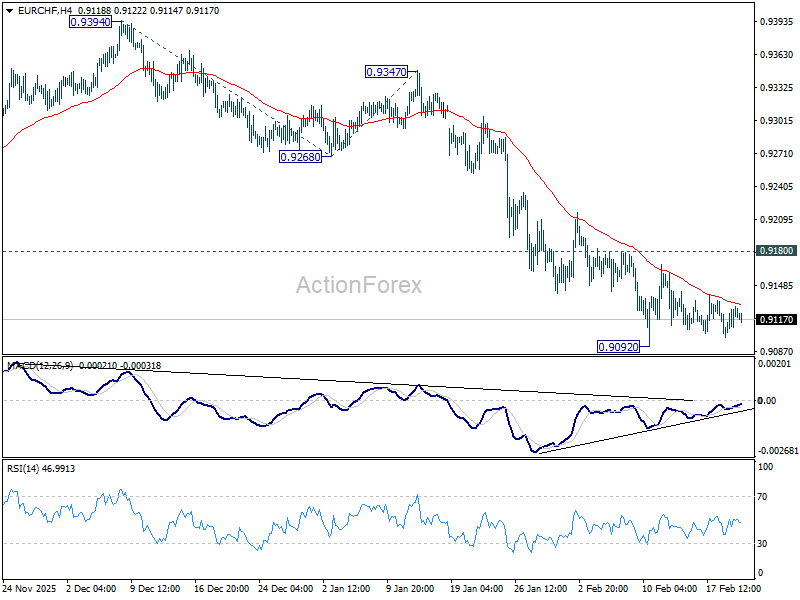
Daily Pivots: (S1) 0.9097; (P) 0.9114; (R1) 0.9140; More....
EUR/CHF is still bounded in consolidations from 0.9092 and intraday bias stays neutral. Further decline is expected with 0.9180 resistance intact. On the downside, firm break of 0.9092 will resume larger down trend and target 261.8% projection of 0.9394 to 0.9268 from 0.9347 at 0.9143. However, considering bullish convergence condition in 4H MACD, decisive break of 0.9180 will indicate short term bottoming, and bring stronger rebound towards 55 D EMA (now at 0.9224).
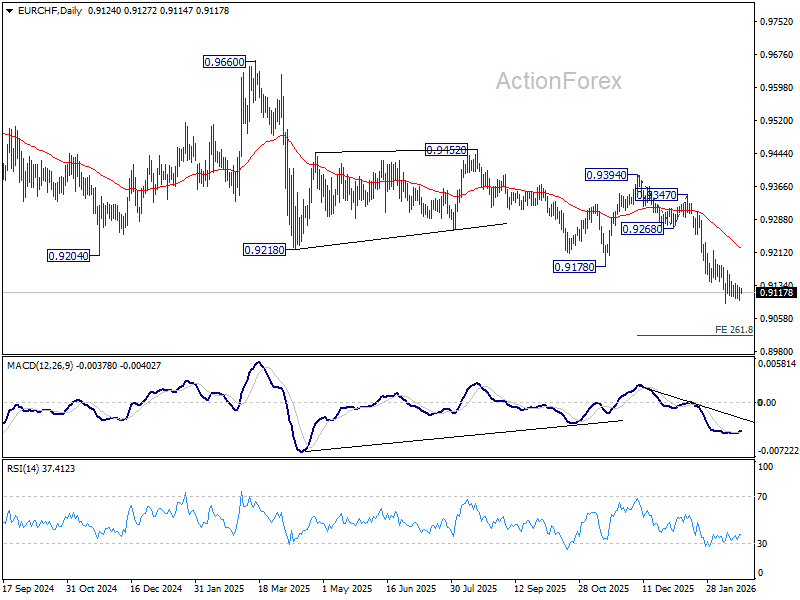
In the bigger picture, down trend from 0.9928 (2024 high) is still in progress with falling 55 W EMA (now at 0.9258) intact. Next target is 61.8% projection of 1.1149 to 0.9407 from 0.9928 at 0.8851. Outlook will stay bearish as long as 0.9394 resistance holds, in case of recovery.
EUR/USD Daily Outlook
Daily Pivots: (S1) 1.1743; (P) 1.1775; (R1) 1.1809; More….
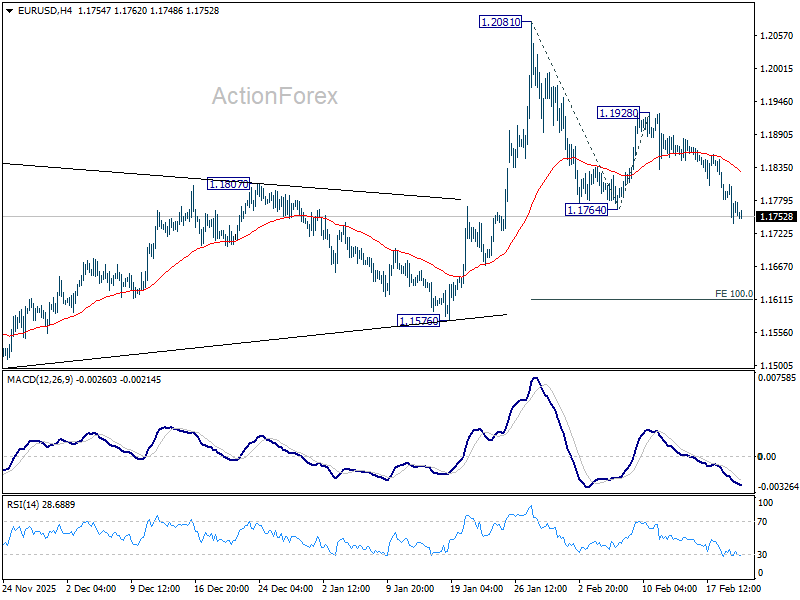
Intraday bias in EUR/USD remains on the downside as fall from 1.2081 continues today. Sustained trading below 55 D EMA (now at 1.1763) will raise the chance of reversal on rejection by 1.2, and target 1.1576 support for confirmation. For now, risk will stay mildly on the downside as long as 1.1928 resistance holds, in case of recovery.
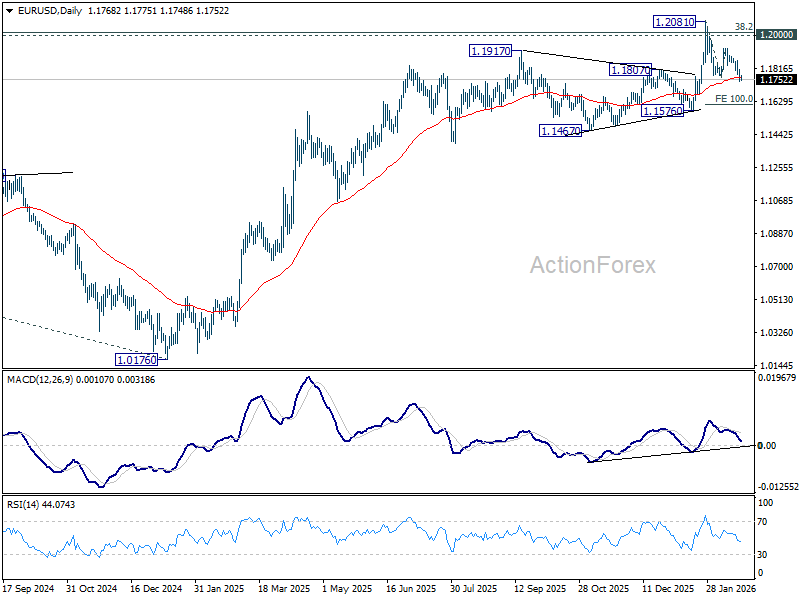
In the bigger picture, as long as 55 W EMA (now at 1.1485) holds, up trend from 0.9534 (2022 low) is still in favor to continue. Decisive break of 1.2 key psychological level will add to the case of long term bullish trend reversal. Next medium term target will be 138.2% projection of 0.9534 to 1.1274 from 1.0176 at 1.2581. However, sustained trading below 55 W EMA will argue that rise from 0.9534 has completed as a three wave corrective bounce, and keep long term outlook bearish.
USD/JPY Daily Outlook
Daily Pivots: (S1) 154.58; (P) 154.96; (R1) 155.38; More...
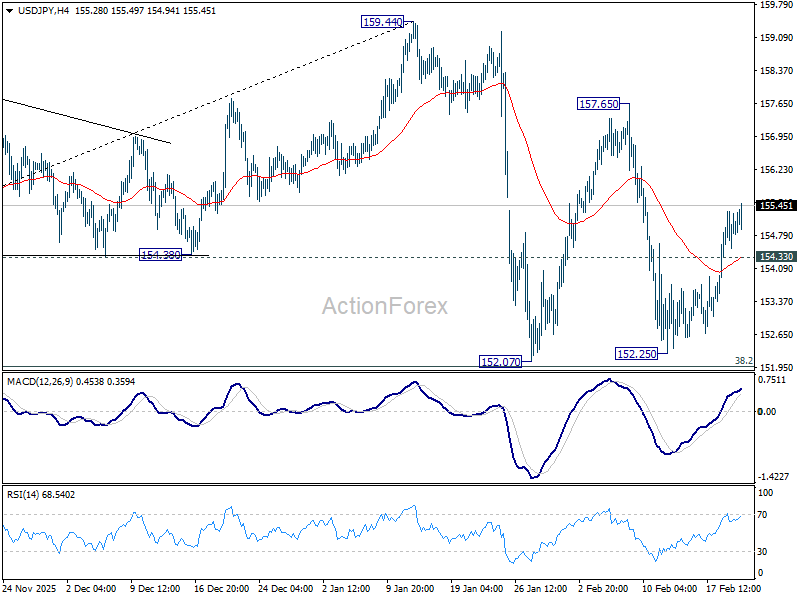
USD/JPY's rally from 152.25 continues today and intraday bias stays on the upside for 157.65 resistance first. Break there will target a retest on 159.44 high. On the downside, below 154.33 minor support will turn intraday bias neutral and bring consolidations. Overall, with 38.2% retracement of 139.87 to 159.44 at 151.96 intact rise from 139.87 is expected to resume through 159.44 at a later stage.
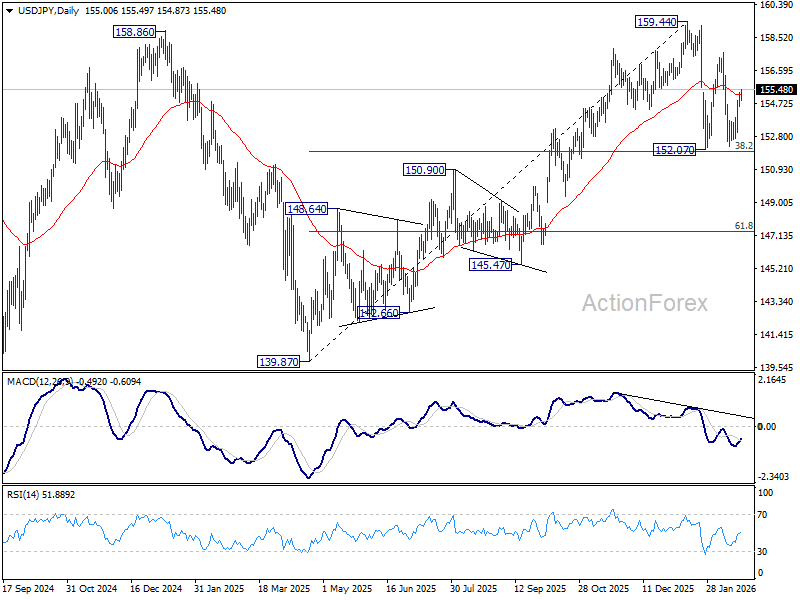
In the bigger picture, outlook is unchanged that corrective pattern from 161.94 (2024 high) should have completed with three waves at 139.87. Larger up trend from 102.58 (2021 low) could be ready to resume through 161.94. This will remain the favored case as long as 55 W EMA (now at 151.77) holds. However, sustained break of 55 W EMA will argue that the pattern from 161.94 is extending with another falling leg.
GBP/USD Daily Outlook
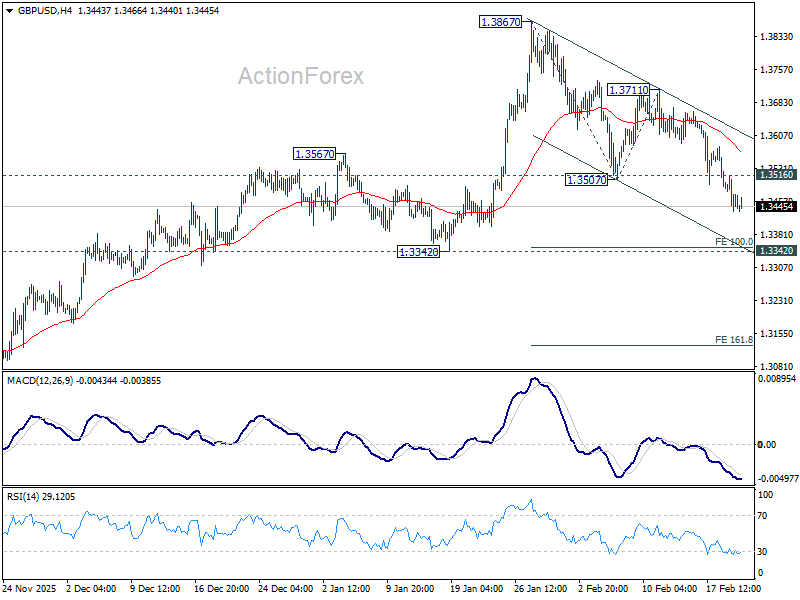
Daily Pivots: (S1) 1.3428; (P) 1.3473; (R1) 1.3511; More...
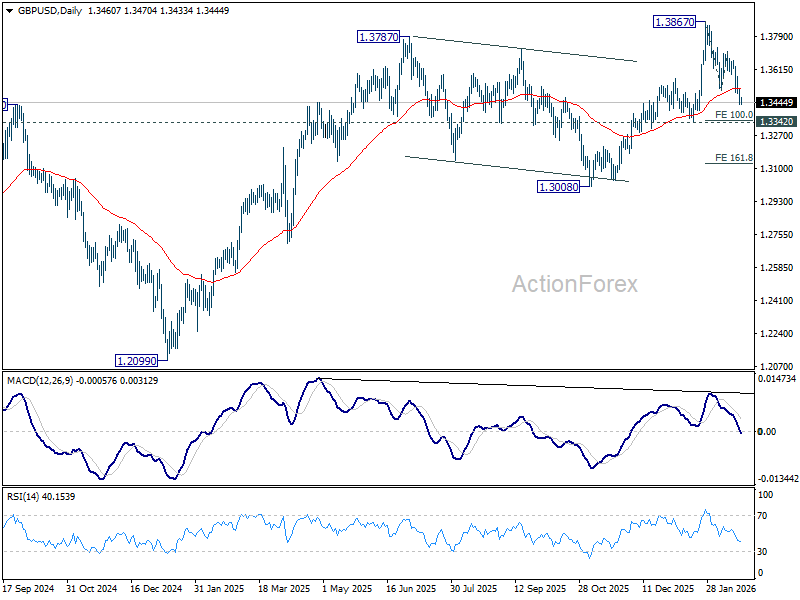
Intraday bias in GBP/USD remains on the downside as fall from 1.3867 is in progress. Current development suggests that the decline is at least correcting the uptrend from 1.2099. Break of 1.3342 support will solidify this case, and target 161.8% projection of 1.3867 to 1.3507 from 1.3711 at 1.3129. On the upside, above 1.3516 minor resistance will turn intraday bias neutral again first. But risk will stay on the downside as long as 1.3711 resistance holds, in case of recovery.
In the bigger picture, rise from 1.0351 (2022 low) still in progress and should target 1.4284 key resistance (2021 high). Decisive break there will add to the case of long term bullish trend reversal. For now, outlook will stay bullish as long as 1.3008 support holds, even in case of deep pullback.
USD/CHF Daily Outlook
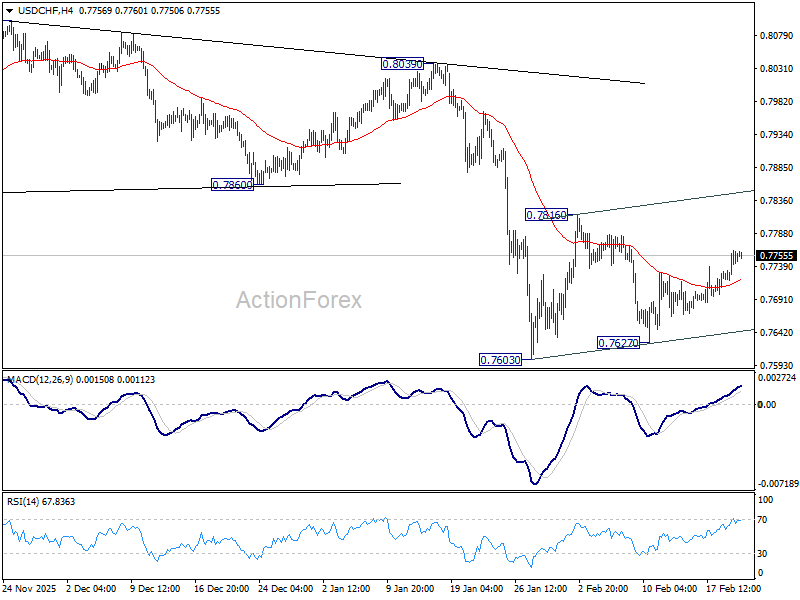
Daily Pivots: (S1) 0.7726; (P) 0.7745; (R1) 0.7768; More….
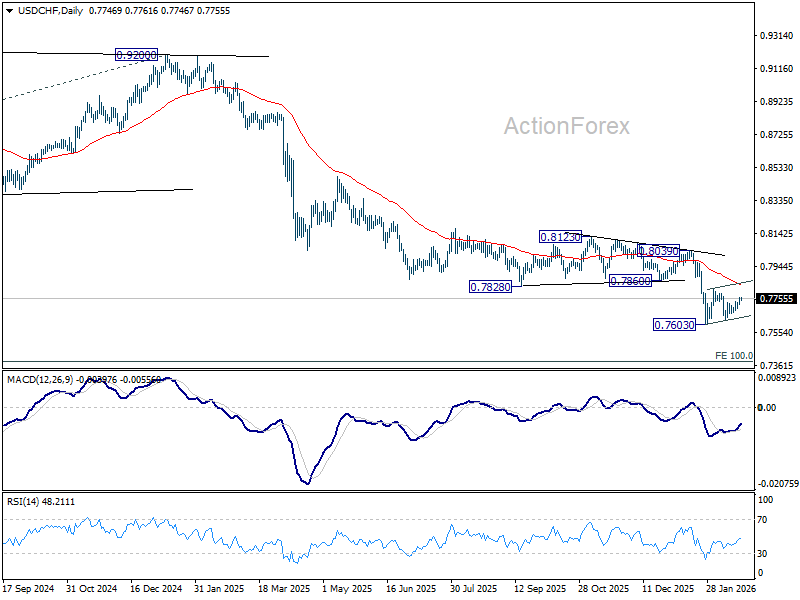
No change in USD/CHF's outlook as price actions from 0.7603 are seen as a consolidation pattern in the larger down trend. Intraday bias remains neutral. While stronger rebound cannot be ruled out, upside should be limited by 55 D EMA (now at 0.7838) to complete the pattern. On the downside, break of 0.7603 will resume larger down trend, and target 0.7382 projection level next. However, sustained break of 55 D EMA will indicate that a larger scale corrective bounce in underway and target 0.8039 resistance next.
In the bigger picture, down trend from 1.0342 (2017 high) is still in progress. Next target is 100% projection of 1.0146 (2022 high) to 0.8332 from 0.9200 at 0.7382. In any case, outlook will stay bearish as long as 0.8123 resistance holds.
USD/CAD Daily Outlook
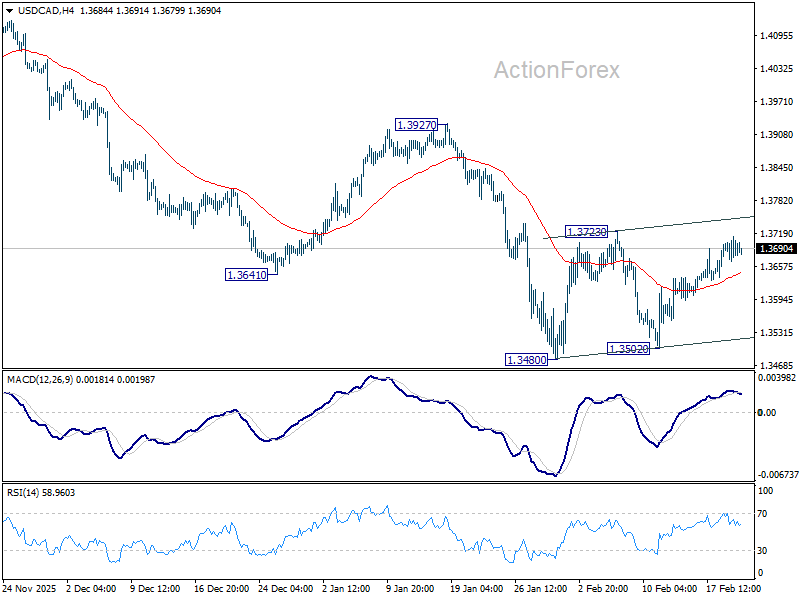
Daily Pivots: (S1) 1.3662; (P) 1.3689; (R1) 1.3708; More...
No change in USD/CAD's outlook and price actions from 1.3480 are seen as a consolidation pattern in the larger decline. Intraday bias stays neutral at this point. While stronger rebound cannot be ruled out, upside should be limited by 55 D EMA (now at 1.3742) to complete the pattern. On the downside, firm break of 1.3480 will resume larger down trend from 1.4791 to 61.8% projection of 1.4791 to 1.3538 from 1.4139 at 1.3365.
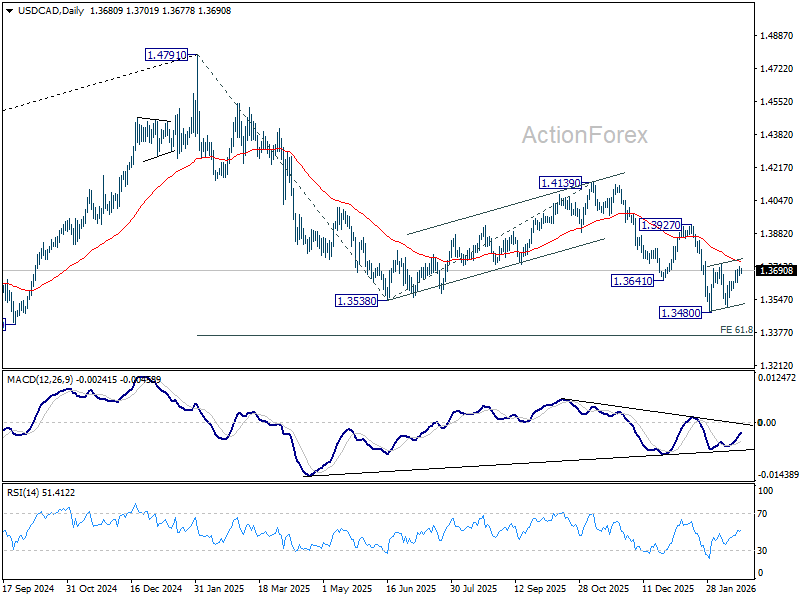
In the bigger picture, price actions from 1.4791 are seen as a corrective pattern to the whole up trend from 1.2005 (2021 low). Deeper fall could be seen as the pattern extends, to 61.8% retracement of 1.2005 to 1.4791 at 1.3069. For now, medium term outlook will be neutral at best, until there are signs that the correction has completed, or that a bearish trend reversal is confirmed.
Geopolitics Remain the Dominant Trading Theme
Markets
Geopolitics remain the dominant trading theme as US President Trump weighs his options in the Middle East. After amassing the largest amount of US troops in the region since the 2003 Iraq invasion, he might effectively deploy them in order to get a nuclear deal with Iran. He has given a 10-day ultimatum to Tehran or “really bad things” will happen. Last year, Trump launched an attack against three Iranian facilities three days after a similar deadline. Operation Midnight Hammer happened on a Sunday… The WSJ yesterday reported on a “limited-strike option” as a reprimand for Iran’s failure to make a deal, but also pave the way for a US-friendly accord. People close to the matter suggest that Trump could ratchet up his attacks, starting small before ordering larger strikes until the Iranian regime either dismantles its nuclear work or falls. Brent crude prices work they way through $72/b this morning, the highest level since last summer and to be compared with $67.75/b closing price at the end of last week. Middle East stress translated in a risk-off setting yesterday with European and US stock markets respectively losing around 1% and 0.5%. The US dollar took up his safe haven role with the trade-weighted greenback (DXY) testing first resistance at 97.99. The attempt is ongoing this morning. EUR/USD is in the same vein losing first support at 1.1766 with GBP/USD already well below 1.3509. Strong January UK retail sales (+1.8% M/M & +4.5% Y/Y) this morning offer some relief for GBP. The dollar is able to play this role after throwing off the shackles of a possible March Fed rate cut. Last week’s payrolls and CPI report dismissed the case with this week’s Fed comments and FOMC Minutes also favouring a longer “hold”. Even Fed governor Miran – temporarily appointed by President Trump end last year and echoing the administration’s dovish views – said in an interview with The Peg yesterday that he’s going to undo what he did his December projections. In the quarterly dot plot, he had the policy rate falling to 2%-2.25% by the end of the year. Latest labor market data came in a little bit better than he expected while he also saw some signs of even more firming in goods inflation. Therefore, he’s inclined to go back to his September projection (2.5%-2.75%) which would still only put him on par with the second most dovish voice inside the FOMC. Today’s eco calendar contains global PMI and US Q1 GDP. Our KBC nowcast now predicts 2.74% Q/Qa growth for Q4 (vs +3% consensus); however, if we filter out the gold effects, only 1.6% Q/Qa would remain. We don’t think the numbers will be able to offset caution going into the weekend with US action against Iran looming.
News & Views
Belgium’s Court of Audit has serious doubts whether the federal budget will comply with the EU’s expenditure growth cap. The government led by PM De Wever aims to do so through 2029 and end last year agreed on some €8bn in additional efforts to remain on track. The Court of Audit is skeptical on the €1.9bn in savings that the government is counting on through activating people that have been out of a job due to long-term sickness. Anti-fraud measures are expected to yield €1.2bn but the Court noted that there’s still no plan in place. It also raised questions on the hundreds of millions that VAT changes would deliver for the 2026 budget, because some measures need a complete overhaul (eg. takeaway) while others (most) are only introduced no sooner than Q2 or later still. The Court of Audit is similarly less optimistic than the government on the revenues coming from, amongst others, changes to wage indexation, the increased reduced withholding tax and the capital gains tax. The news from the Court of Audit comes after the jab from the Federal Planning Bureau last week. The FPB in updated forecasts assumes the deficit to be €3bn larger in 2029 compared to government estimates due to changes in personal income taxes. In GDP terms, the deficit would rise from 4.9% this year to 5.7% in 2029 (vs 5.3% in government forecasts). Deficits would continue to rise in the years thereafter, with a 6.3% shortage in 2031. Government debt would spiral from 109.4% this year to 116.6% in 2029 and 122.2% in 2031.
Japanese inflation came in slightly below expectations in January. Headline CPI eased from 2.1% to 1.5% while core inflation (ex. fresh food and energy) decelerated from 2.9% to 2.6%. The Bank of Japan’s preferred inflation gauge (ex. fresh food) matched the 2% bar (from 2.4% in December). Government measures to reduce cost of living are paying off, including in reduced fuel costs through tax measures that pushed overall energy prices down 5.2% y/y. Fresh food (-6.9%) weighed on prices as well with the annual reading correcting from last year’s (p)rice surge. It is expected that inflation would drop below 2% in core gauges in coming months as government utility measures kick in. The Bank of Japan had been expecting the slowing price growth and stressed they remain focused on the underlying trend. As such, the outcome today shouldn’t bring the BoJ off-track with rate hikes still due in coming months. USD/JPY rises slightly to north of 155. Front-end Japanese yields trade little changed.
AUD/USD Daily Report
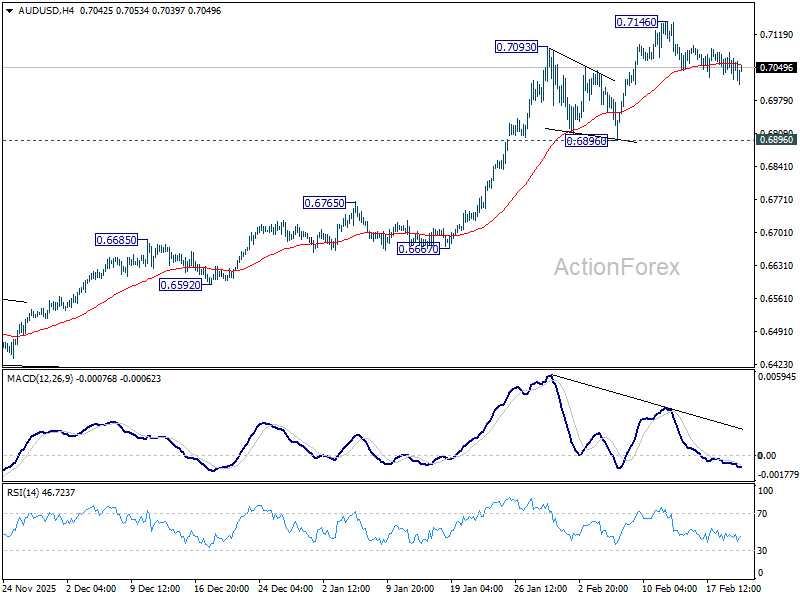
Daily Pivots: (S1) 0.7029; (P) 0.7054; (R1) 0.7085; More...
AUD/USD edges lower today as correction from 0.7146 extends, and intraday bias remains neutral. Deeper retreat might be seen, but downside should be contained above 0.6896 support to bring another rally. On the upside, above 0.7146 will resume larger up trend to 100% projection of 0.5913 to 0.6706 from 0.6420 at 0.7213.
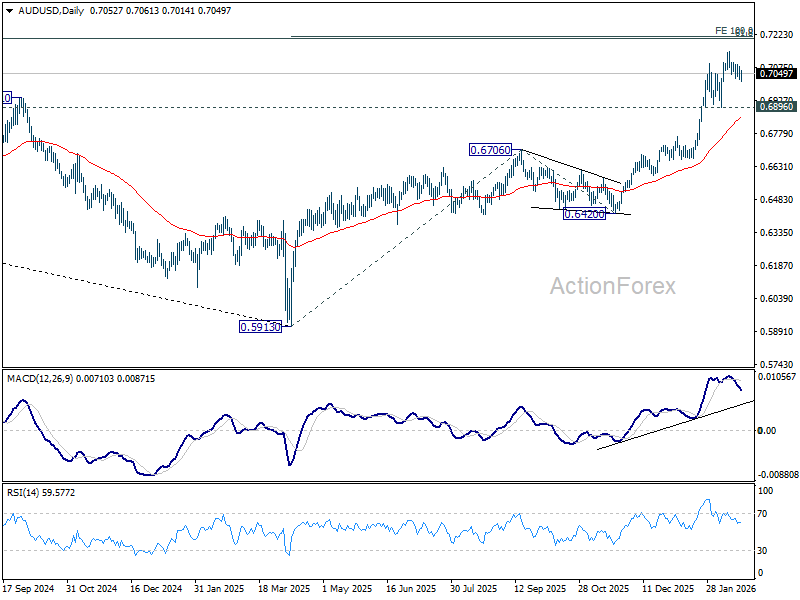
In the bigger picture, current development argues that rise from 0.5913 (2024 low) is reversing whole down trend from 0.8006 (2021 high). Further rally should be seen to 61.8% retracement of 0.8006 to 0.5913 at 0.7206. This will remain the favored case as long as 0.6706 resistance turned support holds, even in case of deep pullback.
Dollar Firm as Iran Tensions Lift Oil, Markets Turn Cautious
Dollar remained generally firm in otherwise quiet Asian trading, with broader FX flows subdued but sentiment increasingly cautious. There is a noticeable sense of nervousness across markets as geopolitical risks intensify. Precious metals edged higher, with Gold and Silver ticking up modestly. However, there is no clear follow-through buying. The lack of sustained momentum suggests traders are hedging selectively rather than positioning aggressively for full-scale escalation.
The central question is whether the US will move forward with a military strike against Iran or whether diplomatic efforts will cool the situation. Markets appear to be in wait-and-see mode. Oil, by contrast, is reacting more decisively. WTI surged above 67 and reached its highest level since last August.
US President Donald Trump overnight said he would decide “over the next probably 10 days” whether to strike Iran, adding that failure to reach a meaningful deal could lead to “bad things.” The timeline has effectively placed a geopolitical clock on markets. While Iranian and US negotiators reportedly agreed on “guiding principles,” White House officials indicated that significant differences remain. That gap is keeping energy markets on edge.
Oil traders are particularly concerned about the Strait of Hormuz, a critical chokepoint for global crude flows. Any disruption there could have outsized impact on energy prices and inflation expectations. For now, the reaction is concentrated in energy markets rather than broad risk-off flows. Equities are holding up, and haven demand in metals remains tentative.
On the weekly scoreboard, Dollar remains the strongest performer, followed by Aussie and Loonie, the latter supported by higher oil. Yen is weakest despite rising geopolitical tension, trailed by Sterling and Swiss Franc. Euro and Kiwi sit mid-pack as markets brace for the next development.
In Asia, Nikkei fell -1.12%. Hong Kong HSI is down -0.81%. China is still on holiday. Singapore Strait Times is up 0.19%. Japan 10-year JGB yield fell -0.003 to 2.112. Overnight, DOW fell -0.54%. S&P 500 fell -0.28%. NADAQ fell -031%. 10-year yield fell -0.004 to 4.075.
UK retail sales surge 1.8% in January, strongest since May 2024
UK retail sales volumes jumped 1.8% mom in January, far exceeding expectations of 0.2% and marking the largest monthly increase since May 2024. The rebound suggests consumers began the year on firmer footing despite broader concerns over slowing growth.
On an annual basis, sales volumes rose 4.5% yoy, pointing to solid underlying demand. Over the three months to January, volumes edged up 0.1% compared with the prior three-month period and were 2.6% higher than a year earlier, indicating steady momentum rather than a one-off spike.
The data offer a counterbalance to recent signs of labor market softening and cooling inflation. While markets continue to price a March rate cut from BoE, resilient consumer spending may temper expectations for an aggressive easing cycle, particularly if inflation remains sticky in services.
Japan's CPI slows to 1.5% in January, core measures ease further
Japan’s headline CPI slowed to 1.5% yoy in January from 2.1%, falling below the BoJ’s 2% target for the first time in 45 months. Core CPI (excluding fresh food) declined to 2.0% from 2.4%, while core-core inflation eased to 2.6% from 2.9%, signaling broader moderation in underlying price pressures.
The slowdown was largely driven by energy, where costs dropped -5.2% yoy after a -3.1% fall in December. Goods inflation cooled sharply from 2.7% to 1.6%. In contrast, services inflation remained steady at 1.4%, suggesting domestic wage-driven price gains have yet to accelerate meaningfully.
Food inflation remains elevated but is gradually cooling. Prices excluding fresh items rose 6.2% yoy, down from 6.7%. Rice inflation slowed for an eighth consecutive month to 27.9%.
Japan PMI composite jumps to 53.8, export demand surges
Japan’s private sector gathered further momentum in February, with PMI Manufacturing rising from 51.5 to 52.8 and PMI Services edging up to 53.8. PMI Composite climbed from 53.1 to 53.8, marking the strongest expansion since May 2023 and signaling a more broad-based recovery.
According to S&P Global’s Annabel Fiddes, the upturn was supported by firmer demand both domestically and overseas. Total new orders expanded at the quickest pace since May 2023, while manufacturers recorded the strongest increase in export work in eight years.
Stronger sales pushed capacity utilization higher, with backlogs rising at a record pace. Firms responded by increasing hiring, while improved demand allowed businesses to regain some pricing power despite persistent cost pressures. Business confidence also strengthened, supported by new product launches, technology demand and optimism following Prime Minister Sanae Takaichi’s landslide election victory.
Australia PMI composite dives to 52.0 in February, cost pressures reaccelerate
Australia’s February flash PMIs signaled a slowdown in private sector momentum. PMI Manufacturing slipped from 52.3 to 51.5, while PMI Services dropped sharply from 56.3 to 52.2. As a result, PMI Composite fell from 55.7 to 52.0, indicating growth continued but at a much more modest pace.
According to S&P Global’s Eleanor Dennison, the private sector was unable to sustain the strong start to the year. Both manufacturing and services recorded softer expansions in output and new orders, with the services sector experiencing the more pronounced pullback.
However, inflationary pressures remain evident. Firms reported elevated wage burdens and higher supplier costs, pushing both input and output price inflation to five-month highs. Despite softer new business growth, job creation accelerated to an 11-month high, underscoring labor market tightness.
RBNZ’s Breman confident inflation will return to target, policy not on preset path
RBNZ Governor Anna Breman said in speech that the central bank remains confident inflation will return to target despite its current 3.1% reading. She expects inflation to move back inside the 1–3% band in the first quarter and ease toward the 2% midpoint over the 12 months. That formed a key basis for the decision to keep the OCR unchanged at 2.25% this week.
Breman stressed that policymakers needed to determine whether the recent uptick in inflation signaled broader price pressures or merely a "temporary bump". She pointed to global factors lifting tradables prices, while non-tradables inflation continues to decline, albeit slowly.
The economy expanded in the September quarter and indicators suggest recovery is continuing into early 2026. With unemployment still elevated and wage growth subdued, the RBNZ sees room for recovery without reigniting inflation.
At the same time, she reiterated that monetary policy is "not on a preset course".
NZ trade deficit at NZD -519m as China flows diverge
New Zealand’s goods exports rose 2.6% yoy in January to NZD 6.2B, up NZD 157m from a year earlier. Goods imports increased 1.9% yoy to NZD 6.7B, up NZD 126m. The result was a monthly trade deficit of NZD -519m.
By destination, export performance was mixed. Shipments to China, New Zealand’s largest trading partner, fell NZD -118m (-7.0%) yoy. In contrast, exports to Australia jumped NZD 134M (+20%), while flows to the EU (+16%) and Japan (+11%) also posted solid gains. Exports to the US were broadly flat.
On the import side, China led the increase, with imports surging NZD 346m (+24%) yoy. South Korea also recorded a strong rise (+36%), while imports from the EU edged higher. Meanwhile, purchases from the US (-17%) and Australia (-8.1%) declined.
The data suggest stable overall trade volumes but highlight shifting bilateral flows, particularly with China, which may have implications for growth in coming months.
AUD/USD Daily Report
Daily Pivots: (S1) 0.7029; (P) 0.7054; (R1) 0.7085; More...
AUD/USD edges lower today as correction from 0.7146 extends, and intraday bias remains neutral. Deeper retreat might be seen, but downside should be contained above 0.6896 support to bring another rally. On the upside, above 0.7146 will resume larger up trend to 100% projection of 0.5913 to 0.6706 from 0.6420 at 0.7213.
In the bigger picture, current development argues that rise from 0.5913 (2024 low) is reversing whole down trend from 0.8006 (2021 high). Further rally should be seen to 61.8% retracement of 0.8006 to 0.5913 at 0.7206. This will remain the favored case as long as 0.6706 resistance turned support holds, even in case of deep pullback.