Sample Category Title
NAIRU: Dead, Undead or Just Resting?
Full employment objectives for central banks are common and long-standing. They are harder to assess than inflation objectives, and evolve as our understanding of the economy improves.
- Full employment objectives for central banks are common and long-standing. The RBA has been mandated to pursue both price stability and full employment since its founding as a separate institution. Even a central bank with an inflation-only mandate would need to care about labour market developments, because these provide information about future inflation.
- It is harder to know whether the economy is at full employment than whether inflation is at target. Gaps from full employment are inferred from price and wage outcomes. The exact mapping from those outcomes to a judgement about tightness of the labour market depends in part on how you think the ‘unemployment gap’ or ‘output gap’ affects prices and wages, and how you think inflation expectations are formed.
- The RBA has in recent times instituted a dashboard or checklist approach to assessing where the labour market is relative to full employment. This approach has limitations but is being progressively evolved. It also still focuses on a subset of approaches to analysing the labour market. The so-called ‘NAIRU’ and the gap-oriented approach to assessing full employment is far from dead to central banks.
Many central banks, including the RBA, have ‘full employment’ as part of their mandate, in addition to inflation control. In most cases, again including Australia, this has been true for decades. Indeed, it is well understood that even a central bank with an inflation-only mandate would still want to have a view on full employment, because a labour market being away from that point will influence inflation in future, potentially pushing it away from target. This was the point Mervyn King made back in 1997, that even an ‘inflation nutter’ central bank would still care about employment and unemployment.
But how do central banks know if they have achieved a full employment goal? An inflation target can be specified as a desired rate or range of rates for inflation, and perhaps a horizon over which to achieve it. ‘Full employment’ has, however, always been a bit more nebulous. Typically, policymakers and academic economists alike have framed ‘full employment’ as being the lowest rate of unemployment that is still consistent with inflation remaining at its target. That way, the two mandates are defined not to conflict. ‘Full’ does not mean ‘everybody who wants one has a job’, and it is not necessarily as low a rate of unemployment as other parts of society might prefer.
The evolution of economic understanding of the relationship between inflation and unemployment began in the middle of the previous century, when A W Phillips noted an inverse relationship between growth in money wages and the unemployment rate in the UK. In other words, an unemployment rate below its ‘natural rate’ – an ‘unemployment gap’ – was associated with faster wages growth. The ‘Phillips curve’ concept later expanded to be between price inflation and unemployment rather than money wages growth and unemployment. More recently, the RBA has also related these ‘gaps’ to growth in unit labour costs (which includes all employee compensation, not just wages, expressed relative to output produced) rather than wages or prices directly. This approach stems from the ‘markup model’ framework where marginal costs and labour market slack are related, rather than prices and slack. As we have previously noted, other central banks do not put anywhere near the emphasis on this model that the RBA does.
Later work focused on the role of expected inflation, holding that unemployment would only decline below its ‘natural rate’ if people were ‘surprised’ by inflation. If unemployment was below the ‘Non-Accelerating Inflation Rate of Unemployment’ (now you know why economists call it the NAIRU), inflation (or wages growth) would not just be higher, but would be ever-increasing, because people would come to expect the current rate of inflation to continue, and then you needed to surprise them some more. So if inflation or wages growth was increasing, that was taken as evidence that the unemployment rate was below the NAIRU and the labour market was tighter than ‘full employment’. A steady rate of unemployment or wages growth was seen as a signal that the labour market was roughly in balance.
The RBA’s recent work on establishing where full employment might be has instead taken the view that inflation expectations in Australia are reasonably anchored. So instead of looking for increasing inflation or wages growth as a sign that the labour market is tighter than full employment, any deviation of inflation from target, or wages growth from what the central bank judges to be consistent with inflation remaining at target, is seen as a sign that the labour market is away from full employment. The NAIRU isn’t really dead in the RBA’s framework: they just dropped the “A”.
Observant readers will note that the judgement about whether wages growth is consistent with inflation at target requires a judgement about the mapping from wages growth to labour costs to inflation target. This involves a judgement about trends in productivity growth that is subject to both debate and data revisions.
The RBA has also fleshed their assessment process out with a ‘checklist’ or ‘dashboard’ of indicators of full employment and a separate one for the output gap. This has not been without criticism from labour market experts, though to be fair the dashboards have been improved over time and are now less sensitive to historical averages. It has also integrated at least some of the insights from labour economics that frame the labour market as an exercise in matching workers and jobs, with all the frictions that might arise from that. Still, the exercise has a little of the flavour of the RBA’s use of ‘checklists’ in the early 1980s, before the inflation targeting era. That experiment did not end well.
In the end, though, the RBA’s framework is all about taking signal from inflation and wages data and reading back to the labour market. Consider two possible views of economic trends. One is that trend growth in capacity – that is, potential output – is just above 2%, and the sustainable rate of unemployment is around 4.6%, the RBA’s latest estimate. Another, closer to our own view, would be that potential output growth is more likely to be in the 2¼–2½% range and the sustainable unemployment rate is more like 4¼%. The labour market data on its own will not help you distinguish between these two sets of assumptions. The signal from inflation and wages growth will be the deciders.
The upshot is that the RBA has put a lot of effort into measuring where full employment is. Neither it, nor the profession more broadly, have done as much on building theory about why it is where it is, or where it might go from here, including whether it could be deliberately moved to make even lower unemployment feasible. And despite the dropping of the “A”, the intellectual framework has not evolved much over the past decade. It is still all about inferring gaps from Kalman filtering the relationship between output, labour market data and price and wage outcomes.
There are alternatives, which both policymakers and the research community would be familiar with but have generally not pursued, sticking instead to the ‘gap-oriented’ approach to assessing the balance between demand and supply. One alternative – though by no means the only one – was even expounded in a Bank of England publication more than a decade ago (full disclosure: the author, Professor Roger Farmer, was one of my PhD thesis examiners). There is also more to be gleaned from search-oriented analysis of the labour market.
The analysis of where full employment is therefore far from settled. Further changes in central bank frameworks can be expected as more research is done. Hopefully this future research avoids incrementalism and considers the implications of how labour markets actually work in the 21st century. Meanwhile, the NAIRU might have changed form, and dropped a letter here or there, but it is not dead to central banks.
USD/CHF Carves a Bottom after Reaching 14-Year Lows
2025 was the year of the Swiss Franc, and there were quite a few reasons.
De-dollarization, flows moving towards Europe, the Yen losing some of its Safe-Haven characteristics amid fiscal trouble in Japan, and general diversification towards quality as the World faces troubled times ahead.
Reaching 14-year lows less than a month ago, USD/CHF had become a bear dream for those who thrive on Dollar outflows. 2025 began with a 17% decline in the Major pair and was at the center of the essential themes driving FX flows.
But as Dollar bearish positioning also reaches decade lows, some questions regarding the extended moves are arising.
If the US Dollar finds reasons to catch a serious bid, troubled times could be coming ahead for heavy Greenback-Short sellers. A question evoked in our recent Dollar Index analysis.
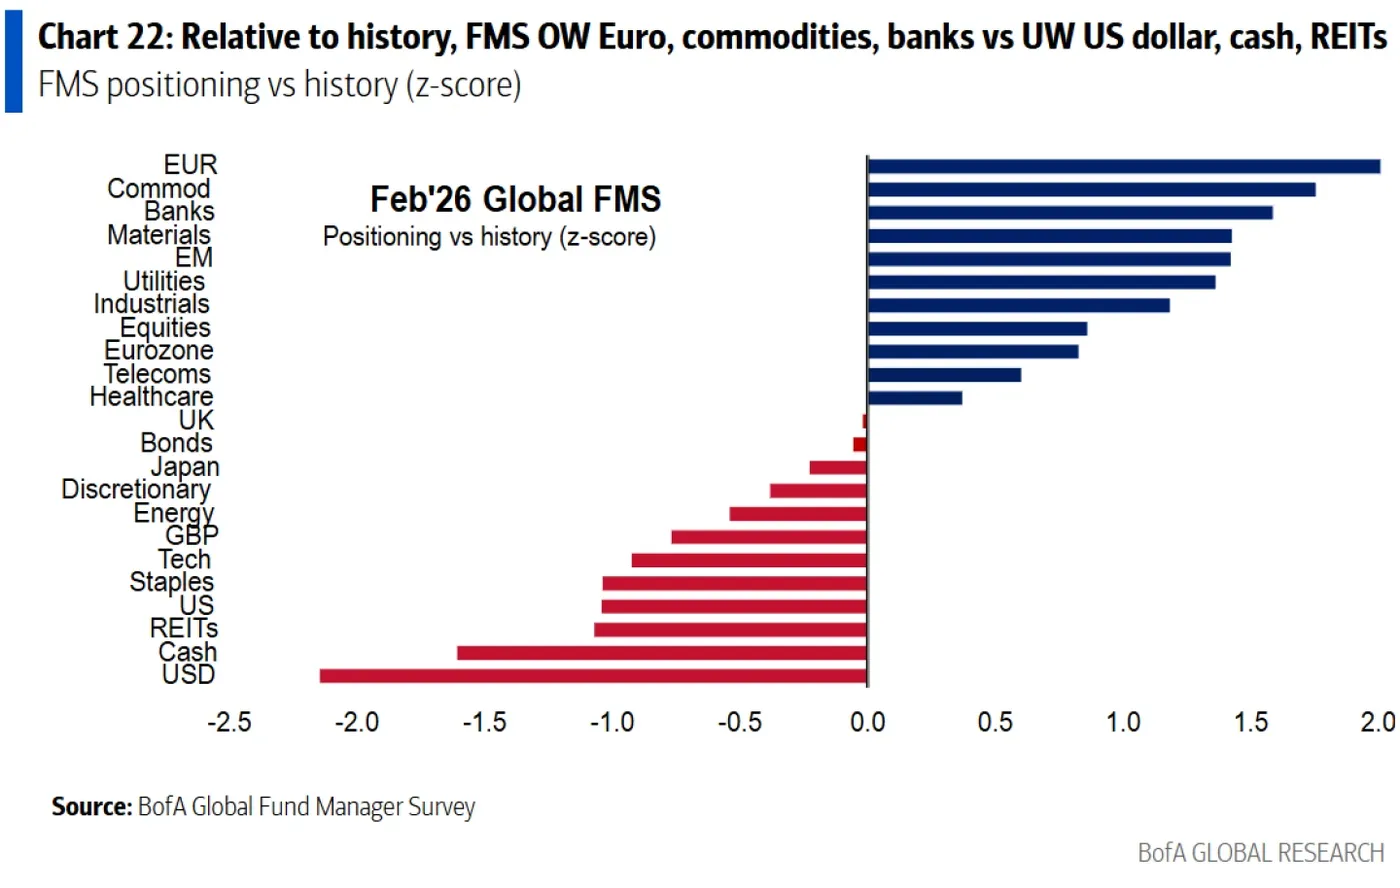
Dollar Bear Positioning is at Extremes – Source: Bank of America Survey
With safe havens like Gold and Silver seeing sudden outflows at the end of last month, coinciding with Kevin Warsh's appointment as head of the Federal Reserve, the appeal of these no and low-yielding assets is being called into question. And the Swiss Franc is no stranger to such.
Switzerland is a victim of quite heavy deflationary pressures, with its currency strengthening (hurting Swiss exports) and the rougher US trade policies, which exacerbate a fundamentally low-inflation regime.
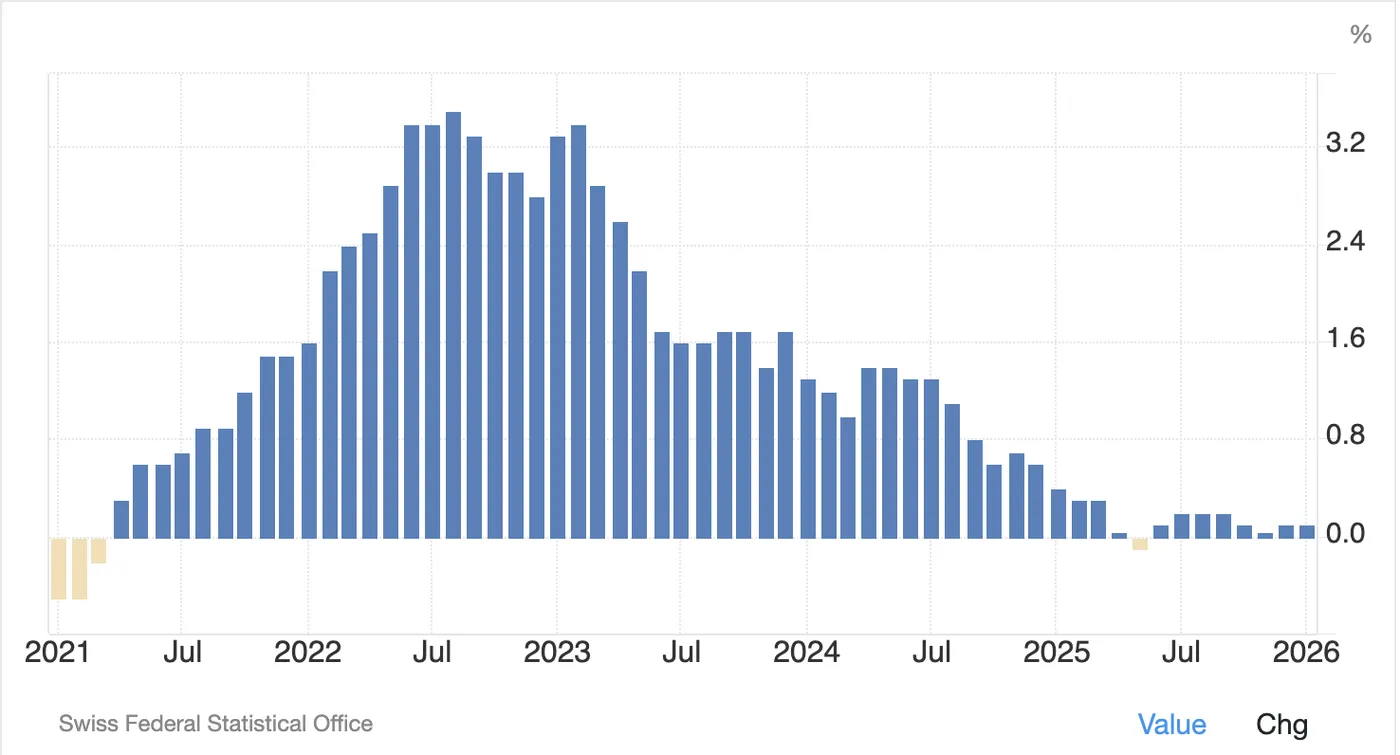
Swiss Inflation – Courtesy of Trading Economics
After reaching a new deal, trade is seemingly bouncing back, but pressure remains on the Swiss National Bank.
The latest inflation report showed a modest 0.1% increase, but if inflation doesn't show a material increase in the coming few reports, the Central Bank might be forced to turn to negative rates. And such come at high costs.
In the meantime, USD/CHF has carved out a pretty strong bottom in recent days and could offer interesting mean-reversion setups for those looking for FX volatility ahead.
Let's dive right into a multi-timeframe analysis of USD/CHF to spot where the action stands and where it could be heading.
USD/CHF Multi-Timeframe Technical Analysis
Daily Chart
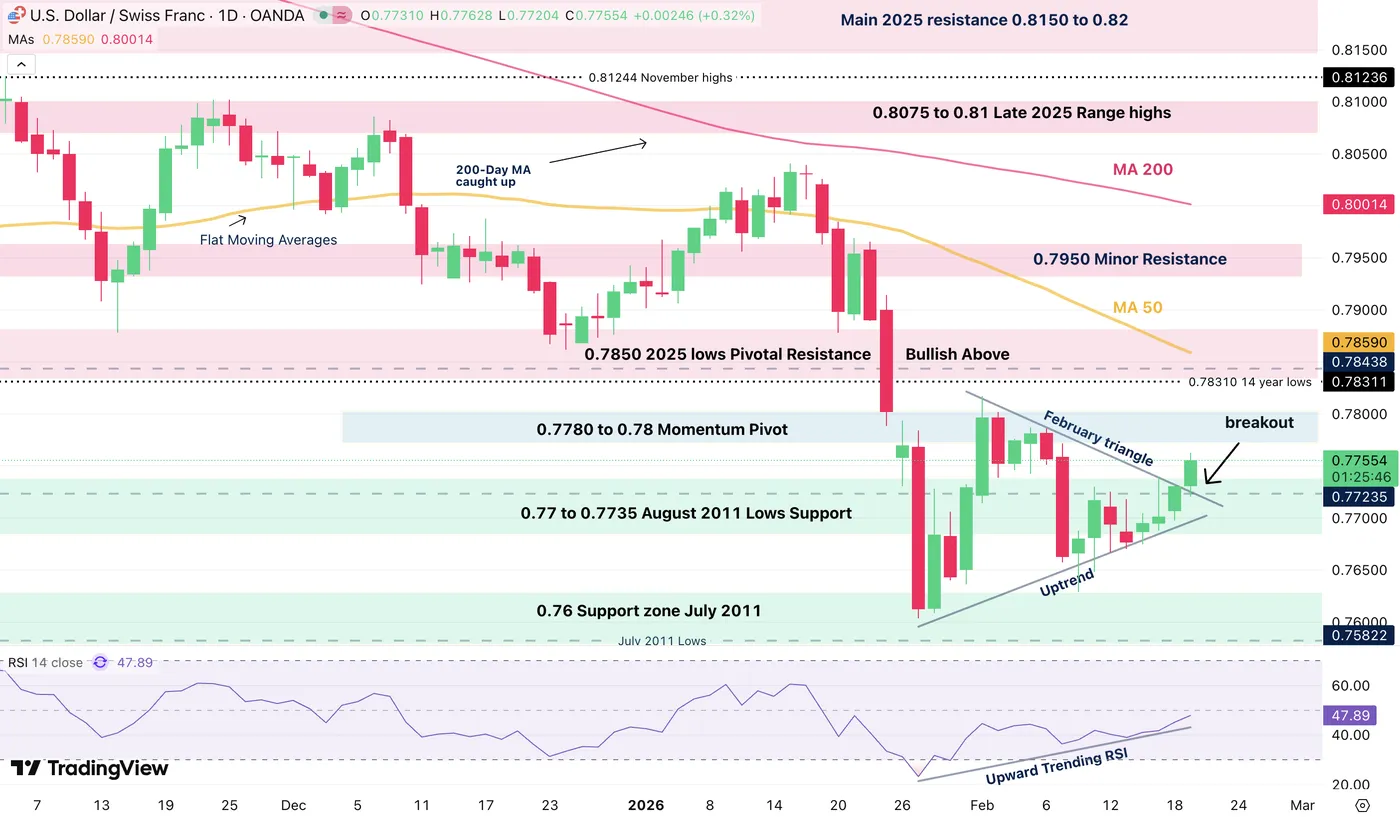
USD/CHF Daily Chart – Source: TradingView. February 19, 2026
USD/CHF is carving out a breakout from its mid-February Triangle consolidation, and will soon face a key test for its buying momentum.
The Daily RSI and Uptrend are working together to provide a fresh push in the pair, with traders leaning on the Monday Lows (0.7675) to drive the action higher.
- If the action falls back below the weekly lows, the breakout will be void but for now it gives high probabilities of holding.
4H Chart and Technical Levels
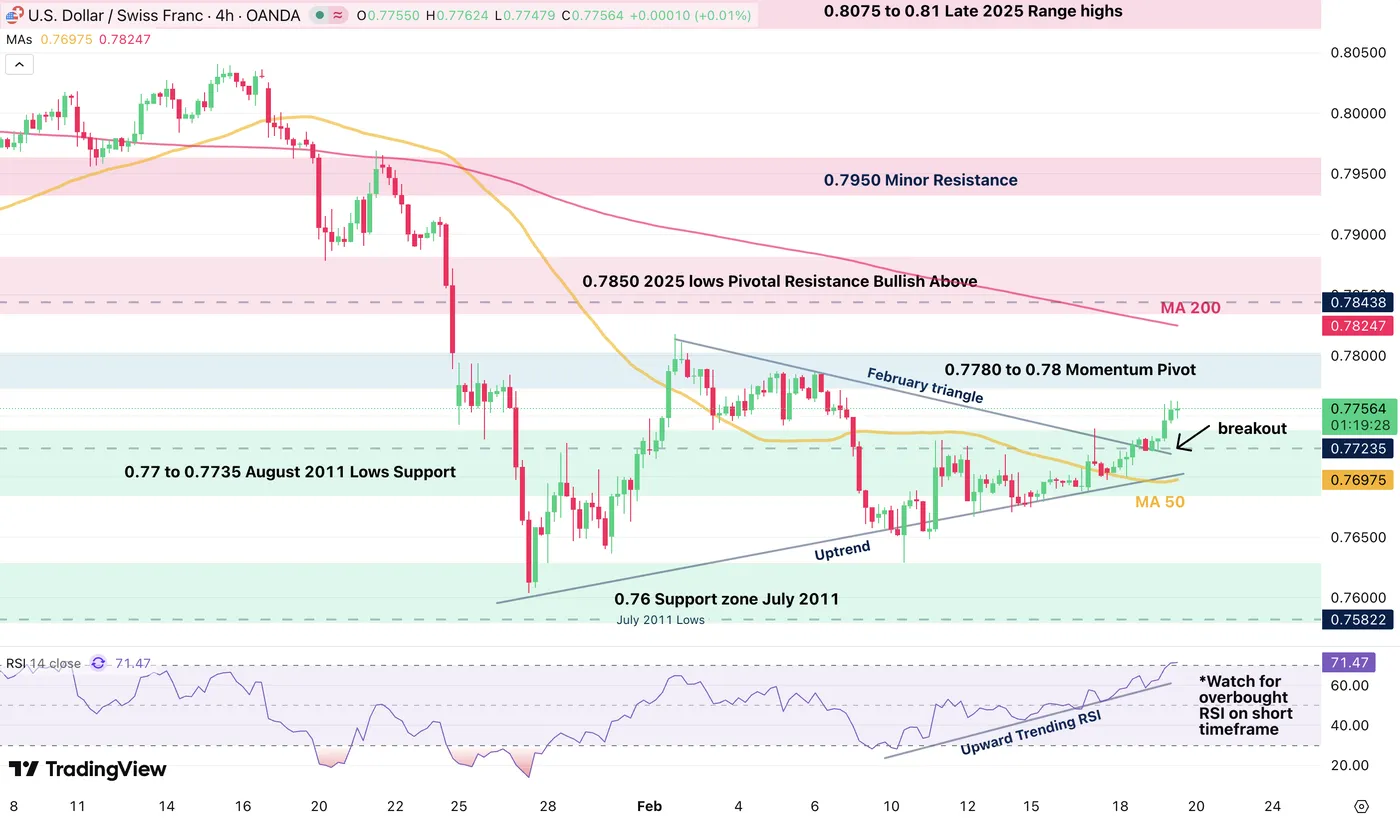
USD/CHF 4H Chart – Source: TradingView. February 19, 2026
USD/CHF is breaking out on quite strong price action, but will face a short-term barrier from overbought conditions. Check trading setups on the 1H timeframe just below.
Trading Levels for USD/CHF
Resistance Levels
- 0.7780 to 0.78 Momentum Pivot
- 0.7850 2025 lows Pivotal Resistance (Bullish Above)
- 0.7950 Minor Resistance
- 0.8075 to 0.81 Late 2025 Range highs
Support Levels
- 0.7725 50H Moving Average
- 0.77 to 0.7725 August 2011 Lows Support
- 0.76292 2026 and 14-year lows
- 0.76 Support zone July 2011
- 0.70696 All-Time lows (August 2011)
1H Chart
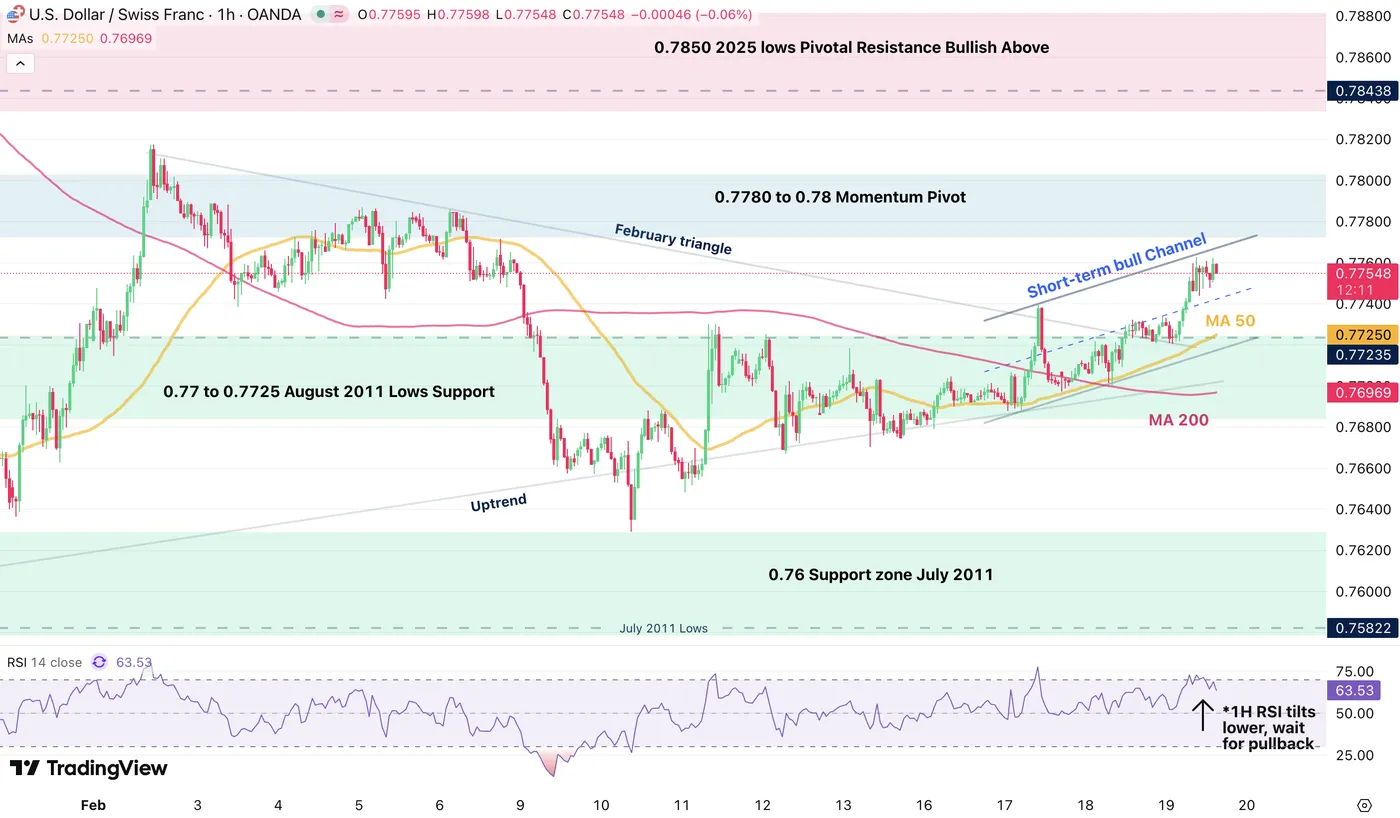
USD/CHF 1H Chart – Source: TradingView. February 19, 2026
The pair now looks slightly overextended on the 1H timeframe, but remains in an upward formation, as seen on the intraday bull channel.
- Traders looking to capture a potential bull move could wait for a retracement to the 50-Hour Moving average at 0.77250.
- If the action doesn't pullback lower, traders can look for breakout setups
- Breaching the February highs 0.78175 would point to a swift test of the Pivotal resistance around 0.7850.
- Any daily close below the 200-Hour MA could prompt a retest of the 2026 low and further bearish action, but technicals aren't pointing to such outcomes for now.
Safe Trades!
Oil Rallies as War Premium Returns: WTI Retests End-January $66 Highs
- Oil breaks higher during overnight trading as pressure mounts ahead of the weekend.
- WTI attempts a retest of its January highs with tensions not easing.
- Exploring an in-depth Technical Analysis of the commodity.
Betting on geopolitical events is an odd task in Markets.
Without discussing the moral aspect (traders have to make money, or at least try to, no matter what), trading live events come with significant potential risk.
Participants build up anxiety, heavy positioning, and costly conviction ahead of uncertain outcomes – this is the War Risk Premium, and it is not a cheap one.
Sometimes it pays, as was observed during last Summer with the 12-Day War, which took WTI to $78.43 highs in a matter of a week.
However, many times, similarly to what happened already on a few occasions in the current rise, Oil may just shoot higher before giving up in exhaustion as nothing official happens.
Will prices tumble again? Who knows.
Tensions really are rising, and the military armada amassed in the Middle East is already higher than the one seen in 2003 before the Iraq War, so there is a basis for fear. The Trump Admin also sounded a bit more aggressive in their speeches yesterday. Let's see how it plays out.
Being positioned is a good way to gain exposure to potential volatility; however, it remains very tricky. A good entry point is essential, and the most important thing is to make sure you respect your rules and risk to trade for longer.
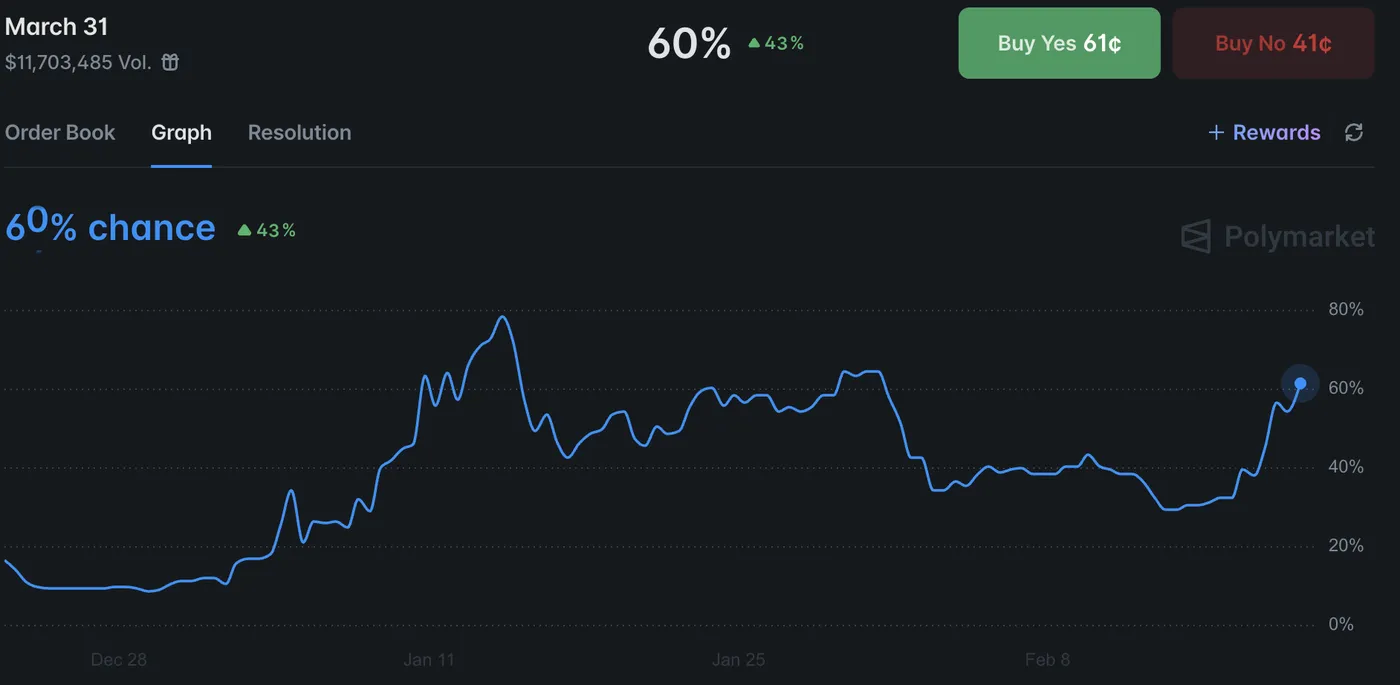
Odds for a US strike in Iran by end March – Source: Polymarket. February 19, 2026
Polymarket-based odds for a strike before February 28 remain below 30%. Given the amount of insider trading on this platform, the attack may still have time before it happens.
Odds for an end-March strike rose accordingly on Tuesday, right after Oil tumbled to $62, and are currently holding around 60%.
WTI is trading as if something were to happen this weekend. So overall, that is a lot of speculation, and the timing is tricky to predict.
In the meantime, let's dive into a multi-timeframe analysis of WTI (US) Oil to determine levels of interest and put the odds in the trader's favor to capitalize on the issue.
US Oil Multi-Timeframe Analysis
WTI Daily Chart
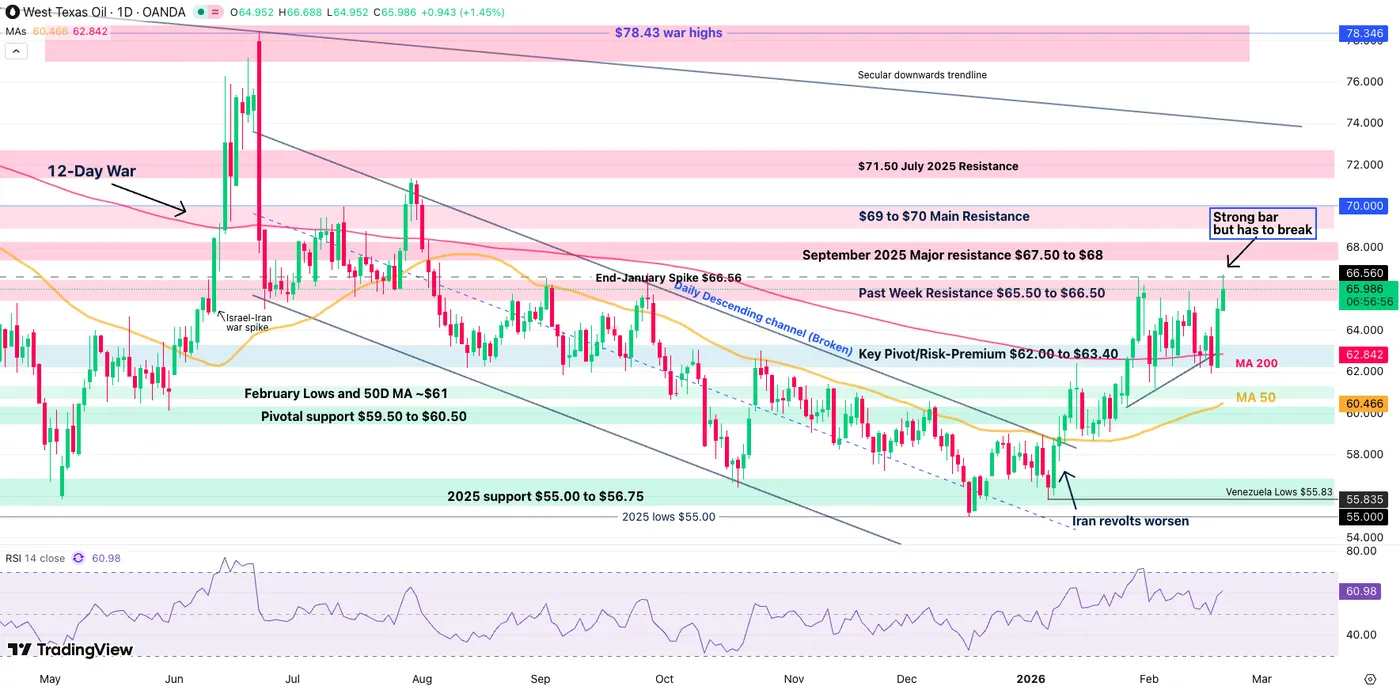
WTI Oil Daily Chart – February 19, 2026. Source: TradingView
WTI just retested its January 29 highs, slightly breaking above, but as long as no candle closes above, at least on the 1H timeframe, it is difficult to assume that a breakout is unrolling.
Overall, the Daily picture helps to assess where the action currently stands.
Oil remains strongly above its 200-Day Moving Average, which acts as key barometer for the risk-premium and should stay above there (+/- $0.50) for the time being.
- A progressive build up could test the $67.50 to $68 resistance, the next main stop but that would happen only if anxiety continues to remain high while nothing happens.
- If an offensive occurs, expect $70 to break swiftly and head between $75 to $80.
- With no news this weekend, the action could easily retest the 200-Day MA ($62.83) which is the most optimal point of entry to capture the risk-premium.
- Any daily close below $61 means that traders are unrolling their positions.
WTI 4H Chart and Technical Levels

WTI Oil 4H Chart – February 19, 2026. Source: TradingView
The immediate action looks very tricky!
RSI is at overbought levels, but the profit-taking which just occurred quickly got faded higher – the 4H Candle is forming a bullish Hammer (closing in 2h). Hence, positioning looks to be amassing once again.
We will see further details on the 1H timeframe but it seems that if nothing happens, a small retracement looks plausible and could offer decent pullback entries.
- The Bullish Channel formation points to $69 in the event of progressive rallies.
WTI Technical Levels
Levels to place on your WTI charts:
Resistance Levels
- $66.67 session Highs
- Past Week Resistance $65.50 to $66.50
- September 2025 Major resistance $67.50 to $68
- Psychological Resistance $70
- $78.43 12-Day War highs
Support Levels
- 1H 50 and 200-Period MA $64.00
- $65 psychological level micro-support
- Range Key Pivot/Support $62.30 to $63.40 (Iran Premium lows and 200-Day MA)
- 4H 200-period MA $61.65
- May Range lows support $59 to $60.5 Major support
- Iran Support area $58.50 to $59
1H Chart

WTI Oil 1H Chart – February 16, 2026. Source: TradingView
Oil is now hanging tight at its end-January Spike levels, but the tricky part is the overbought RSI levels which could easily point to a correction.
Aggressive pullback entries could take place at 2 levels:
- The $65 psychological level would be very aggressive – Bulls are not letting this go and points to higher odds of an immediate intervention (over the weekend)
- $64 is the less-aggressive but still very strong corrective level that would allow the most anxious traders to be part of the action
- If nothing happens, look for a retest of the key pivot zone $62.00 to $63.40
Safe Trades and a successful week!
USDCHF Wave Analysis
USDCHF: ⬆️ Buy
- USDCHF reversed from support area
- Likely to rise to resistance level 0.7800
USDCHF currency pair recently reversed from the support area between the key support level 0.7600 (which stopped earlier impulse wave (1) in December) and the lower daily Bollinger Band.
The upward reversal from this support area started the active short-term corrective wave 2.
USDCHF currency pair can be expected to rise to the next resistance level 0.7800 (former multi-month support from September and the top of the earlier correction (2)).

Brent Crude oil Wave Analysis
Brent Crude oil: ⬆️ Buy
- Brent Crude oil broke the resistance area
- Likely to rise to resistance level 72.75
Brent Crude oil recently broke the resistance area between the round resistance level 70.00 (which has been reversing the price from September) and the 61.8% Fibonacci correction of the downward impulse from June.
The breakout of this resistance area accelerated the active minor impulse wave 3 – which belongs to the intermediate impulse wave (C) from December.
Brent Crude oil can be expected to rise to the next resistance level 72.75 (former monthly high from July).

Eco Data 2/20/26
| GMT | Ccy | Events | Act | Cons | Prev | Rev |
|---|---|---|---|---|---|---|
| 21:45 | NZD | Trade Balance (NZD) Jan | -519M | -745M | 52M | -88M |
| 22:00 | AUD | Manufacturing PMI Feb P | 51.5 | 52.3 | ||
| 22:00 | AUD | Services PMI Feb P | 52.2 | 56.3 | ||
| 23:30 | JPY | National CPI Y/Y Jan | 1.50% | 2.10% | ||
| 23:30 | JPY | National CPI Core Y/Y Jan | 2.00% | 2.00% | 2.40% | |
| 23:30 | JPY | National CPI Core-Core Y/Y Jan | 2.60% | 2.90% | ||
| 00:30 | JPY | Manufacturing PMI Feb P | 52.8 | 51.5 | ||
| 00:30 | JPY | Services PMI Feb P | 53.8 | 53.7 | ||
| 07:00 | EUR | Germany PPI M/M Jan | -0.60% | 0.30% | -0.20% | |
| 07:00 | EUR | Germany PPI Y/Y Jan | -3.00% | -2.10% | -2.50% | |
| 07:00 | GBP | Retail Sales M/M Jan | 1.80% | 0.20% | 0.40% | |
| 07:00 | GBP | Public Sector Net Borrowing (GBP) Jan | -30.4B | -24.0B | 11.6B | |
| 08:15 | EUR | France Manufacturing PMI Feb P | 49.9 | 51.1 | 51.2 | |
| 08:15 | EUR | France Services PMI Feb P | 49.6 | 49.1 | 48.4 | |
| 08:30 | EUR | Germany Manufacturing PMI Feb P | 50.7 | 49.7 | 49.1 | |
| 08:30 | EUR | Germany Services PMI Feb P | 53.4 | 52.6 | 52.4 | |
| 09:00 | EUR | Eurozone Manufacturing PMI Feb P | 50.8 | 50.2 | 49.5 | |
| 09:00 | EUR | Eurozone Services PMI Feb P | 51.8 | 51.8 | 51.6 | |
| 09:30 | GBP | Manufacturing PMI Feb P | 52 | 51.6 | 51.8 | |
| 09:30 | GBP | Services PMI Feb P | 53.9 | 53.8 | 54 | |
| 13:30 | CAD | Retail Sales M/M Dec | -0.40% | -0.50% | 1.30% | 1.20% |
| 13:30 | CAD | Retail Sales ex Autos M/M Dec | 0.10% | 0.20% | 1.70% | 1.60% |
| 13:30 | CAD | Industrial Product Price M/M Jan | 2.70% | 0.20% | -0.60% | -0.90% |
| 13:30 | CAD | Raw Material Price Index Jan | 7.70% | 0.60% | 0.50% | 0.30% |
| 13:30 | USD | GDP Annualized Q4 P | 1.40% | 2.90% | 4.40% | |
| 13:30 | USD | GDP Price Index Q4 P | 3.60% | 2.80% | 3.70% | 3.80% |
| 13:30 | USD | Personal Income M/M Dec | 0.30% | 0.30% | 0.30% | 0.40% |
| 13:30 | USD | Personal Spending Dec | 0.40% | 0.40% | 0.50% | |
| 13:30 | USD | PCE Price Index M/M Dec | 0.40% | 0.40% | 0.20% | |
| 13:30 | USD | PCE Price Index Y/Y Dec | 2.90% | 2.90% | 2.80% | |
| 13:30 | USD | Core PCE Price Index M/M Dec | 0.40% | 0.40% | 0.20% | |
| 13:30 | USD | Core PCE Price Index Y/Y Dec | 3.00% | 3.00% | 2.80% | |
| 14:45 | USD | Manufacturing PMI Feb P | 51.2 | 52.4 | ||
| 14:45 | USD | Services PMI Feb P | 52.3 | 52.7 | ||
| 15:00 | USD | UoM Consumer Sentiment Feb F | 56.6 | 57.3 | 57.3 | |
| 15:00 | USD | UoM 1-Yr Inflation Expectations Feb F | 3.40% | 3.50% | 3.50% |
| 21:45 | NZD |
| Trade Balance (NZD) Jan | |
| Actual | -519M |
| Consensus | -745M |
| Previous | 52M |
| Revised | -88M |
| 22:00 | AUD |
| Manufacturing PMI Feb P | |
| Actual | 51.5 |
| Consensus | |
| Previous | 52.3 |
| 22:00 | AUD |
| Services PMI Feb P | |
| Actual | 52.2 |
| Consensus | |
| Previous | 56.3 |
| 23:30 | JPY |
| National CPI Y/Y Jan | |
| Actual | 1.50% |
| Consensus | |
| Previous | 2.10% |
| 23:30 | JPY |
| National CPI Core Y/Y Jan | |
| Actual | 2.00% |
| Consensus | 2.00% |
| Previous | 2.40% |
| 23:30 | JPY |
| National CPI Core-Core Y/Y Jan | |
| Actual | 2.60% |
| Consensus | |
| Previous | 2.90% |
| 00:30 | JPY |
| Manufacturing PMI Feb P | |
| Actual | 52.8 |
| Consensus | |
| Previous | 51.5 |
| 00:30 | JPY |
| Services PMI Feb P | |
| Actual | 53.8 |
| Consensus | |
| Previous | 53.7 |
| 07:00 | EUR |
| Germany PPI M/M Jan | |
| Actual | -0.60% |
| Consensus | 0.30% |
| Previous | -0.20% |
| 07:00 | EUR |
| Germany PPI Y/Y Jan | |
| Actual | -3.00% |
| Consensus | -2.10% |
| Previous | -2.50% |
| 07:00 | GBP |
| Retail Sales M/M Jan | |
| Actual | 1.80% |
| Consensus | 0.20% |
| Previous | 0.40% |
| 07:00 | GBP |
| Public Sector Net Borrowing (GBP) Jan | |
| Actual | -30.4B |
| Consensus | -24.0B |
| Previous | 11.6B |
| 08:15 | EUR |
| France Manufacturing PMI Feb P | |
| Actual | 49.9 |
| Consensus | 51.1 |
| Previous | 51.2 |
| 08:15 | EUR |
| France Services PMI Feb P | |
| Actual | 49.6 |
| Consensus | 49.1 |
| Previous | 48.4 |
| 08:30 | EUR |
| Germany Manufacturing PMI Feb P | |
| Actual | 50.7 |
| Consensus | 49.7 |
| Previous | 49.1 |
| 08:30 | EUR |
| Germany Services PMI Feb P | |
| Actual | 53.4 |
| Consensus | 52.6 |
| Previous | 52.4 |
| 09:00 | EUR |
| Eurozone Manufacturing PMI Feb P | |
| Actual | 50.8 |
| Consensus | 50.2 |
| Previous | 49.5 |
| 09:00 | EUR |
| Eurozone Services PMI Feb P | |
| Actual | 51.8 |
| Consensus | 51.8 |
| Previous | 51.6 |
| 09:30 | GBP |
| Manufacturing PMI Feb P | |
| Actual | 52 |
| Consensus | 51.6 |
| Previous | 51.8 |
| 09:30 | GBP |
| Services PMI Feb P | |
| Actual | 53.9 |
| Consensus | 53.8 |
| Previous | 54 |
| 13:30 | CAD |
| Retail Sales M/M Dec | |
| Actual | -0.40% |
| Consensus | -0.50% |
| Previous | 1.30% |
| Revised | 1.20% |
| 13:30 | CAD |
| Retail Sales ex Autos M/M Dec | |
| Actual | 0.10% |
| Consensus | 0.20% |
| Previous | 1.70% |
| Revised | 1.60% |
| 13:30 | CAD |
| Industrial Product Price M/M Jan | |
| Actual | 2.70% |
| Consensus | 0.20% |
| Previous | -0.60% |
| Revised | -0.90% |
| 13:30 | CAD |
| Raw Material Price Index Jan | |
| Actual | 7.70% |
| Consensus | 0.60% |
| Previous | 0.50% |
| Revised | 0.30% |
| 13:30 | USD |
| GDP Annualized Q4 P | |
| Actual | 1.40% |
| Consensus | 2.90% |
| Previous | 4.40% |
| 13:30 | USD |
| GDP Price Index Q4 P | |
| Actual | 3.60% |
| Consensus | 2.80% |
| Previous | 3.70% |
| Revised | 3.80% |
| 13:30 | USD |
| Personal Income M/M Dec | |
| Actual | 0.30% |
| Consensus | 0.30% |
| Previous | 0.30% |
| Revised | 0.40% |
| 13:30 | USD |
| Personal Spending Dec | |
| Actual | 0.40% |
| Consensus | 0.40% |
| Previous | 0.50% |
| 13:30 | USD |
| PCE Price Index M/M Dec | |
| Actual | 0.40% |
| Consensus | 0.40% |
| Previous | 0.20% |
| 13:30 | USD |
| PCE Price Index Y/Y Dec | |
| Actual | 2.90% |
| Consensus | 2.90% |
| Previous | 2.80% |
| 13:30 | USD |
| Core PCE Price Index M/M Dec | |
| Actual | 0.40% |
| Consensus | 0.40% |
| Previous | 0.20% |
| 13:30 | USD |
| Core PCE Price Index Y/Y Dec | |
| Actual | 3.00% |
| Consensus | 3.00% |
| Previous | 2.80% |
| 14:45 | USD |
| Manufacturing PMI Feb P | |
| Actual | 51.2 |
| Consensus | |
| Previous | 52.4 |
| 14:45 | USD |
| Services PMI Feb P | |
| Actual | 52.3 |
| Consensus | |
| Previous | 52.7 |
| 15:00 | USD |
| UoM Consumer Sentiment Feb F | |
| Actual | 56.6 |
| Consensus | 57.3 |
| Previous | 57.3 |
| 15:00 | USD |
| UoM 1-Yr Inflation Expectations Feb F | |
| Actual | 3.40% |
| Consensus | 3.50% |
| Previous | 3.50% |
Kashkari: Fed near neutral, dual mandate within reach but not yet met
Minneapolis Fed President Neel Kashkari said today that the Fedis close to achieving its dual mandate of stable prices and full employment, though it has not fully reached either objective. He acknowledged that progress has been made on both inflation and labor market stability, but emphasized that the job is not yet complete.
On monetary policy, Kashkari suggested the current stance is near neutral. “My guess is we’re pretty close to neutral,” he said, indicating that policy may no longer be meaningfully restrictive. That framing reinforces the view that the Fed is entering a more balanced phase, where future moves will depend heavily on incoming data rather than a preset easing path.
Kashkari also expressed skepticism about stablecoins and broader crypto narratives. He criticized what he described as “buzzword salad” often used to promote digital assets, urging observers not to accept vague or unsubstantiated claims about their benefits. His comments underscore ongoing caution within parts of the Fed regarding financial innovation and regulatory oversight.
Sunset Market Commentary
Markets
Brent crude prices extend yesterday’s rally with another $2/b move, this time from $70/b to $72/b and confirming a technical break above the $70/b resistance zone. The oil price trades at its highest level since last summer when they spiked towards $80/b in the wake of Operation Midnight Hammer, the US’s strikes on Iranian nuclear sites. Markets are again on high alert over the Iranian situation. Talks in Geneva earlier this week didn’t really result in hoped-for progress, but a two-week deadline instead. The UN’s nuclear watchdog today warned that the US military build-up in the region means that Iran’s window to reach a diplomatic agreement over its atomic activities is at risk of closing. The US gathered the most air power in the Mideast since the 2003 Iraq invasion, according to flight-tracking data and confirmed by a US official to the WSJ. Markets become more aware of the looming threat. Core bonds fail to really play a safe haven role with higher energy prices interfering. Risk sentiment on stock markets sours with European indices losing around 1%. That’s only one day after the EuroStoxx50 set a new all-time high. US stock markets open 0.25% lower. The greenback shines on FX markets for a second straight session. The US currency plays it safe haven role with near term Fed rate cut bets (March) reduced to nearly 0% following last week’s eco data. The trade-weighted dollar (DXY) tests first resistance at 97.99 (from a start at 97.73). EUR/USD (1.1750) is currently already giving away similar support at 1.1761. The same goes for cable which changes hands at 1.3440, below 1.3509 support. EUR/GBP is about to reach a new YtD top north of 0.8750. Even the Japanese yen fails to keep track with the mighty USD, finding its way north of 155, but remains well below first support at 157.76.
US December trade balance data offered a final piece of tomorrow’s US Q4 GDP puzzle. Exports of goods dropped by more than 3%, but this decline can be explained by non‑monetary gold exports. Imports grew strongly again (+3.6% M/M), this time less influenced by gold trade. Our KBC nowcast now predicts 2.74% Q/Qa growth for Q4 (vs +3% consensus); however, if we filter out the gold effects, only 1.6% Q/Qa would remain. Non‑residential investments remain a strong component of our in-house nowcast on the back of AI‑related investment. Weaker December retail sales pushed personal consumption slightly down, but we still expect annualized Q/Q-growth of 2.82% for this component. A first look at Q1 is weaker, based on the data already available, with growth at 1.55%. However, filtering out the gold effects, we would have 1.89% for Q1.
News & Views
Belgian consumer confidence, after reaching its highest point since 2021 in January, saw a fresh decline in February to 1 from 4, the National Bank of Belgium’s monthly survey showed. The composite indicator remains well above the long-term average though. Concerns about year-ahead unemployment in particular have risen sharply. We should add that this worsening comes after consumers in January were never more optimistic on the labour market than at any other point in time in the series’ 40-year history. Households are also more pessimistic about their capacity to save but simultaneously turned more positive on the general economic situation.
A set of below-consensus Polish January economic data reinforce bets for a rate cut by the central bank (NBP) as soon as March. FRA pricing suggests that after lowering the policy rate to 3.75% next month, more cuts may follow further down the line to perhaps as low as 3.25% (50-50% chance) by 2025H2. The zloty weakens slightly to EUR/PLN 4.22 to nevertheless remain near the strongest levels of the past decade. Gross wages last month tumbled 6.1% m/m to be up the same percentage in a yearly perspective, which was the slowest pace in five years. Employment also unexpectedly dropped 0.2% m/m, extending the trend seen in all of 2025 (barring the one-off 0.1% uptick in November). The amount of people having a job is now 0.8% lower than in January of last year. Industrial sales missed expectations big time, dropping 6% m/m (-3% expected) and -1.5% annually, with unusually cold weather said to have had a serious negative impact. Finally, producer prices slipped a monthly 0.3% and push the yearly print to a one-year low of -2.6%.
USD/JPY Mid-Day Outlook
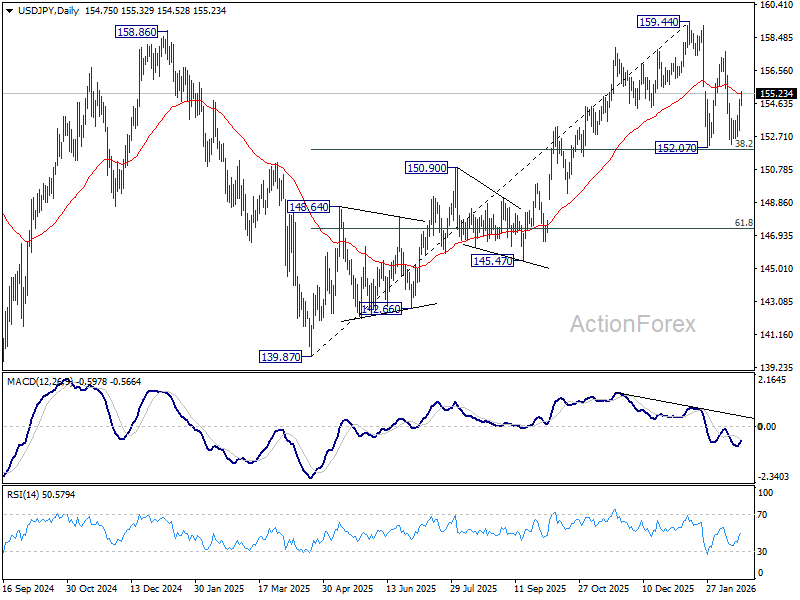
Daily Pivots: (S1) 153.64; (P) 154.25; (R1) 155.44; More...
Intraday bias in USD/JPY remains on the upside at this point. Further rally should be seen to 157.65 resistance first. Break there will target a retest on 159.44 high. On the downside, below 154.33 minor support will turn intraday bias neutral and bring consolidations. Overall, with 38.2% retracement of 139.87 to 159.44 at 151.96 intact rise from 139.87 is expected to resume through 159.44 at a later stage.
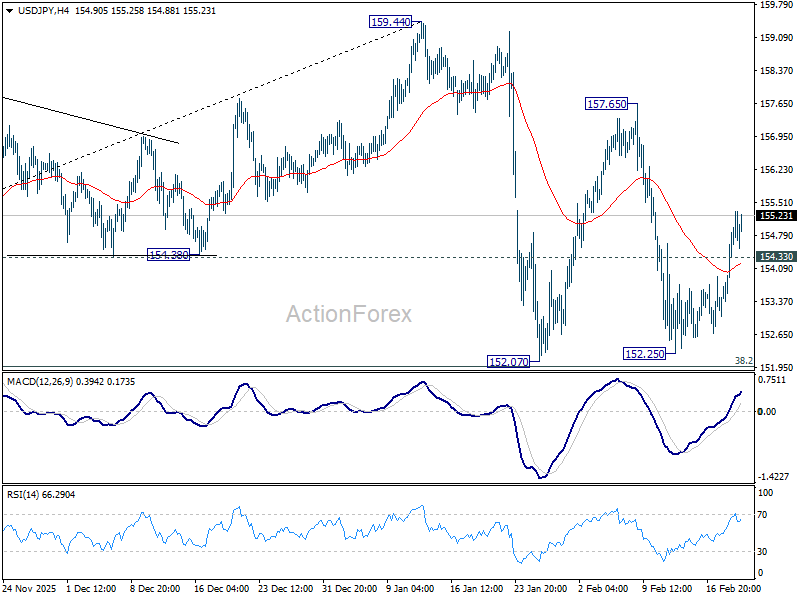
In the bigger picture, outlook is unchanged that corrective pattern from 161.94 (2024 high) should have completed with three waves at 139.87. Larger up trend from 102.58 (2021 low) could be ready to resume through 161.94. This will remain the favored case as long as 55 W EMA (now at 151.77) holds. However, sustained break of 55 W EMA will argue that the pattern from 161.94 is extending with another falling leg.
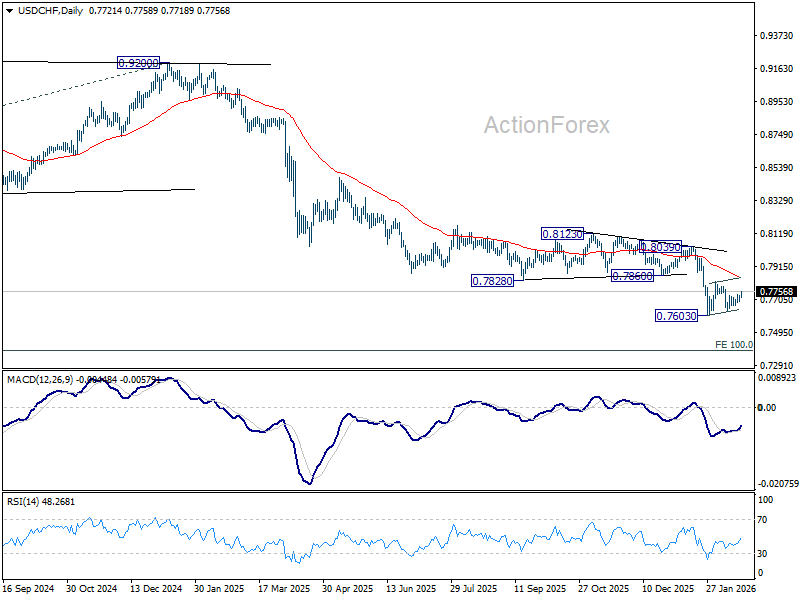
USD/CHF Mid-Day Outlook
Daily Pivots: (S1) 0.7708; (P) 0.7721; (R1) 0.7744; More….
USD/CHF's outlook is unchanged and intraday bias remains neutral. Consolidations from 0.7603 is extending and stronger rebound could be seen. But upside should be limited by 55 D EMA (now at 0.7849) to complete the pattern. On the downside, break of 0.7603 will resume larger down trend, and target 0.7382 projection level next. However, sustained break of 55 D EMA will indicate that a larger scale corrective bounce in underway and target 0.8039 resistance next.
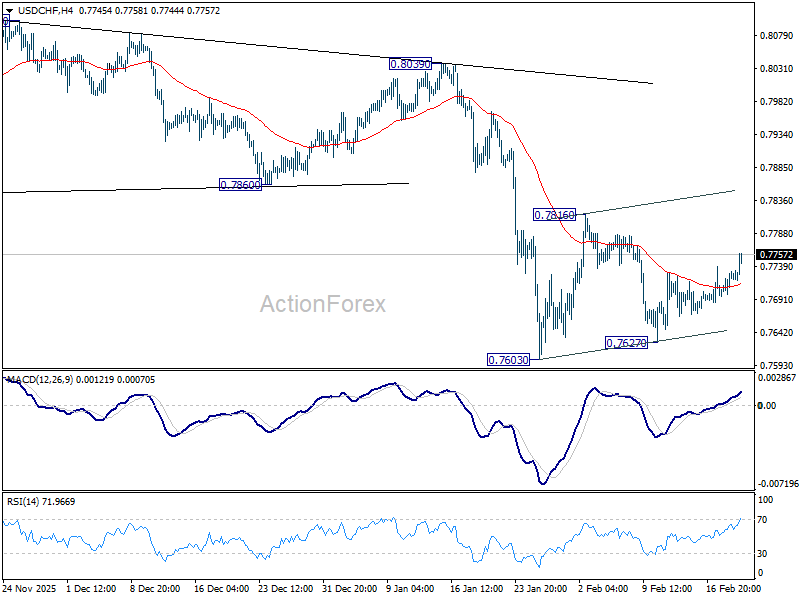
In the bigger picture, down trend from 1.0342 (2017 high) is still in progress. Next target is 100% projection of 1.0146 (2022 high) to 0.8332 from 0.9200 at 0.7382. In any case, outlook will stay bearish as long as 0.8123 resistance holds.