

Sample Category Title
AUD/USD Daily Report
Daily Pivots: (S1) 0.6270; (P) 0.6305; (R1) 0.6344; More...
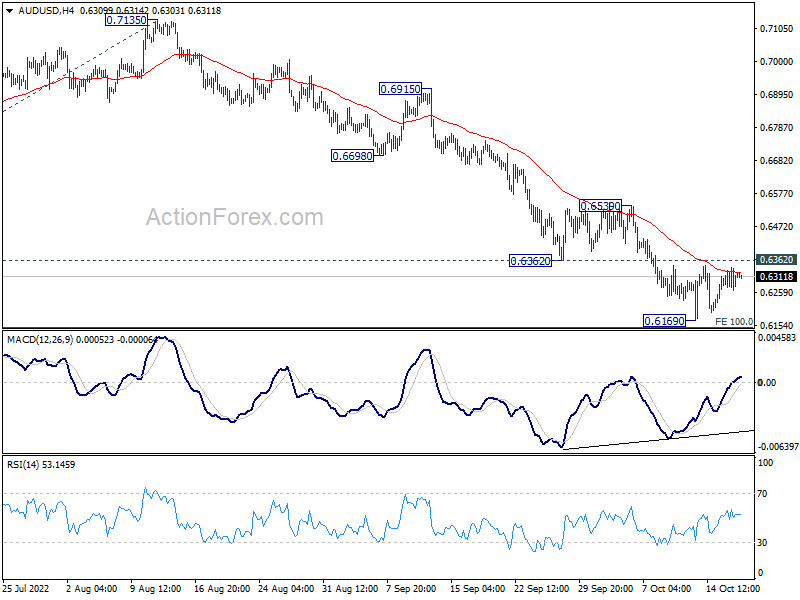
Intraday bias in AUD/USD remains neutral and further decline is expected with 0.6362 support turned resistance intact. Firm break of 100% projection of 0.7660 to 0.6680 from 0.7135 at 0.6155 will target 138.2% projection at 0.5781. Nevertheless, break of 0.6362 will indicate short term bottoming, on bullish convergence condition in 4 hour MACD, and bring stronger rebound back to 0.6539 resistance.
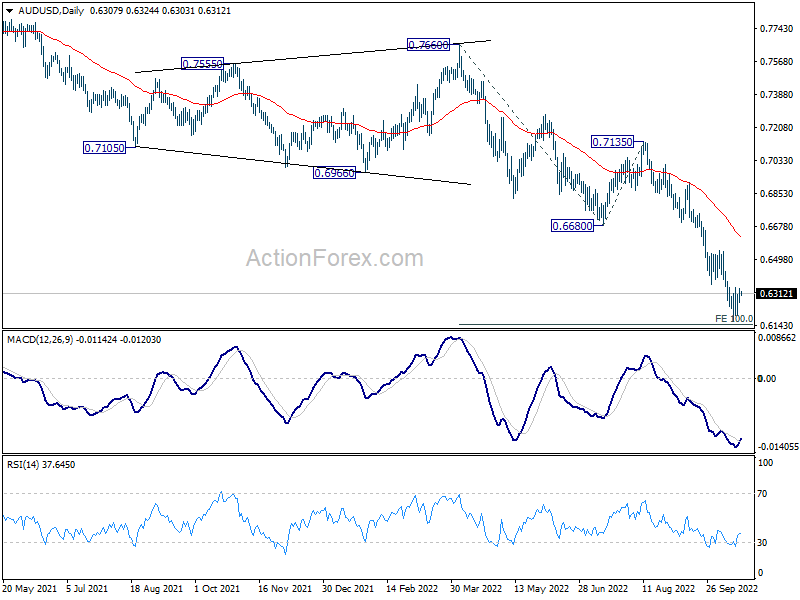
In the bigger picture, down trend form 0.8006 (2021 high) is expected to continue as long as 0.6680 support turned resistance holds. Next target is 0.5506 low. Medium term momentum will now be closely monitored to gauge the chance of break of 0.5506.
EUR/USD Daily Outlook
Daily Pivots: (S1) 0.9759; (P) 0.9805; (R1) 0.9891; More...
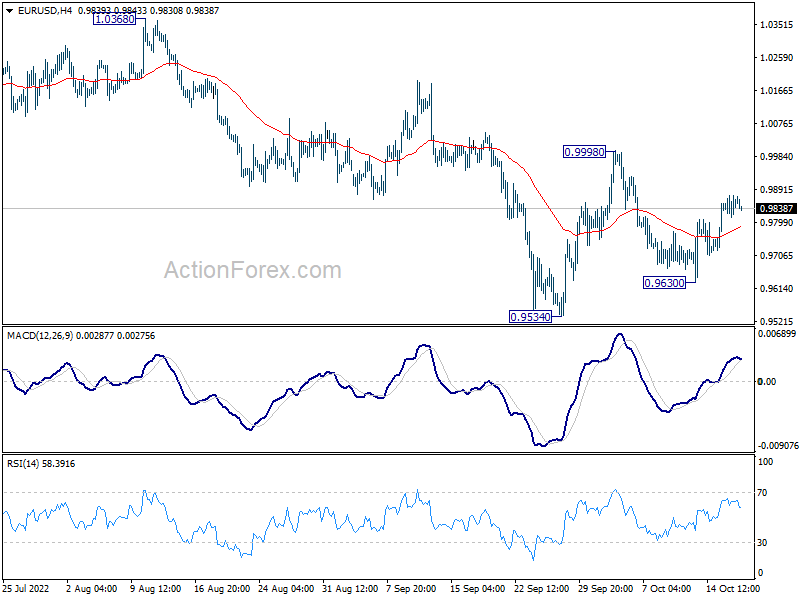
Range trading continues in EUR/USD and intraday bias remains neutral. Deeper decline is expected with 0.9998 resistance intact. Below 0.9630 will bring retest of 0.9534 low first. Firm break there will resume larger down trend. However, break of 0.9998 will confirm short term bottoming and turn bias back the upside for stronger rebound.
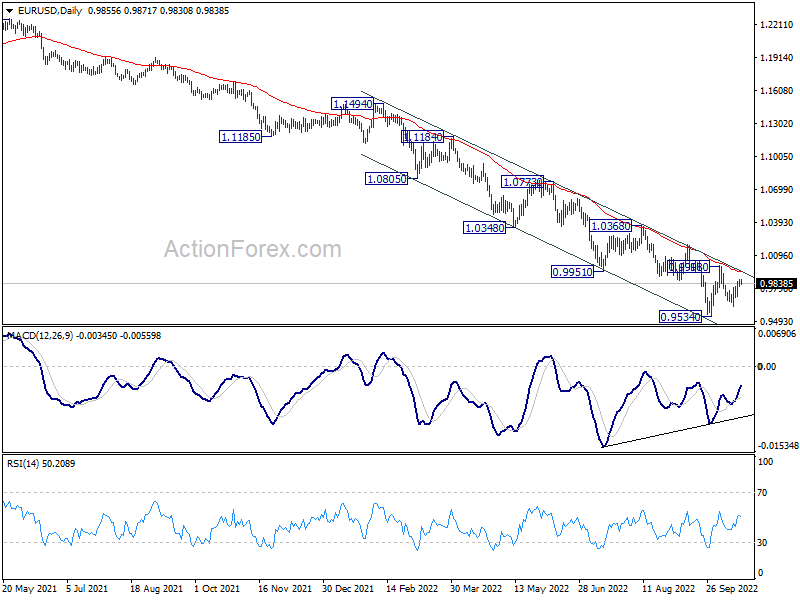
In the bigger picture, down trend from 1.6039 (2008 high) is still in progress. Next target is 100% projection of 1.3993 to 1.0339 from 1.2348 at 0.8694. In any case, break of 0.9998 resistance is needed to be the first sign of medium term bottoming. Otherwise, outlook will stay bearish even with strong rebound.
GBP/USD Daily Outlook
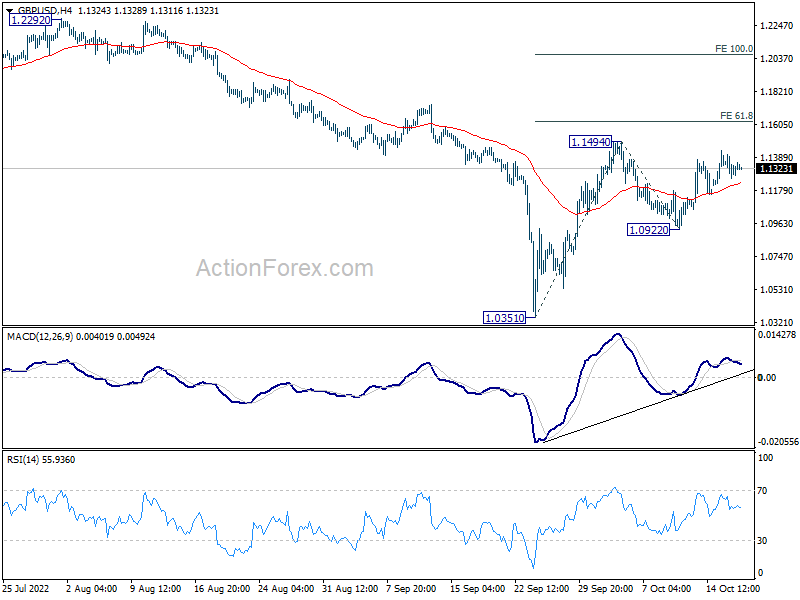
Daily Pivots: (S1) 1.1247; (P) 1.1329; (R1) 1.1401; More...
Intraday bias in GBP/USD remains neutral as sideway trading continues. On the upside, break of 1.1494 will resume the rise from 1.0351 to 61.8% projection of 1.0351 to 1.1494 from 1.0922 at 1.1628. On the downside, below 1.0922 will turn bias back to the downside for 1.0351 low instead.
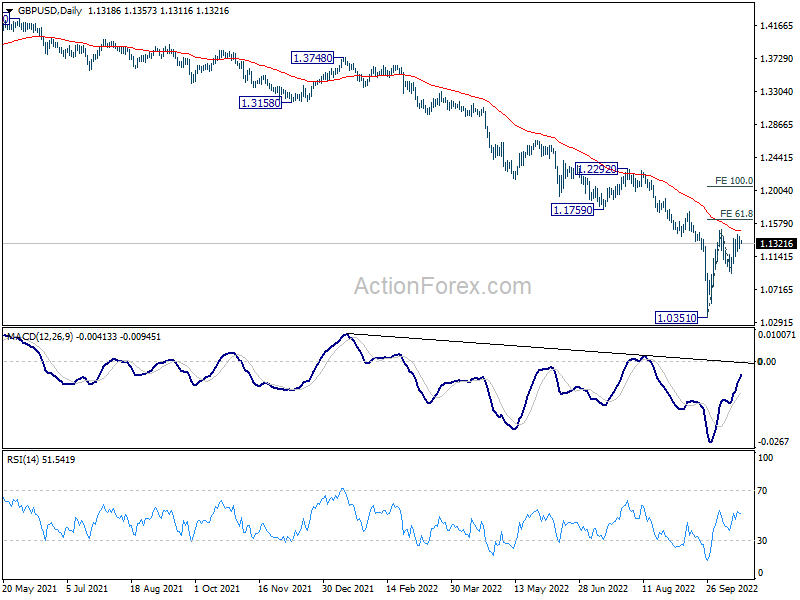
In the bigger picture, fall from 1.4248 (2018 high) is resuming long term down trend from 2.1161 (2007 high). Next target is 100% projection of 2.1161 to 1.3503 from 1.7190 at 0.9532. There is no scope of a medium term rebound as long as 1.1759 support turned resistance holds.
USD/CHF Daily Outlook
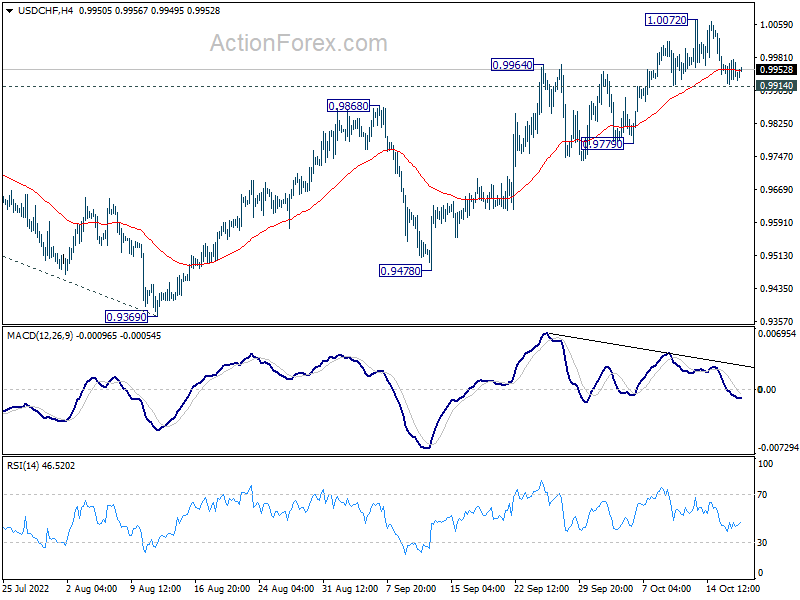
Daily Pivots: (S1) 0.9915; (P) 0.9986; (R1) 1.0027; More...
Intraday bias in USD/CHF stays neutral as it's bounded in range of 0.9914/1.0072. Further rise is still mildly in favor. On the upside, break of 1.0072, and sustained trading above 1.0063, will confirm larger up trend resumption. Next target is 1.0283 projection level. However, break of 0.9914 support will indicate rejection by 1.0063, and turn bias back to the downside for 0.9779 support first.
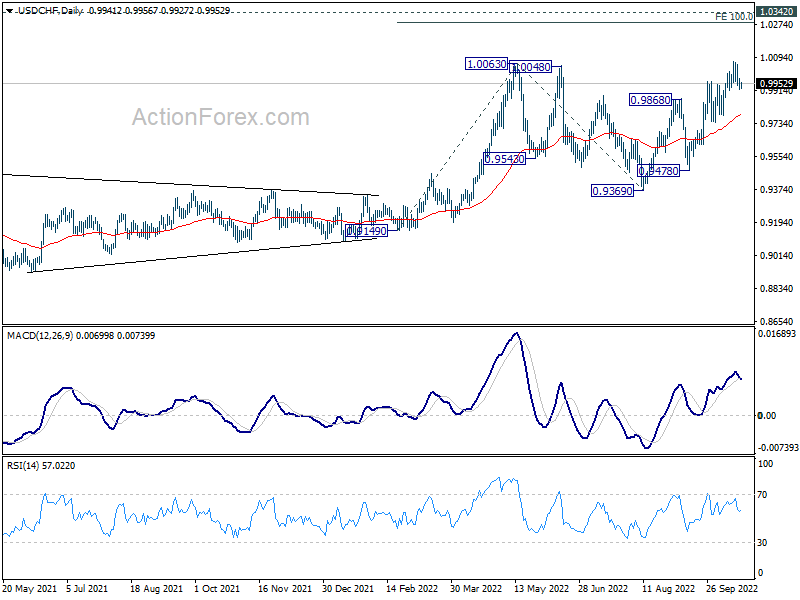
In the bigger picture, current development suggests that up trend from 0.8756 (2021 low) is still in progress. Sustained break of 1.0063 will target 100% projection of 0.9149 to 1.0063 from 0.9369 at 1.0283, and then 1.0342 (2016 high). For now, this will remain the favored case as long as 0.9369 support holds, even in case of deep pull back.
Cheaper Energy
Market movers today
In the UK, September inflation figures are released. We expect headline to increase by 0.2p.p to 10.1% yoy which would be 0.2 p.p above Bank of England's (BoE) latest inflation forecast. We see a slightly smaller increase in core inflation to 6.4% yoy (from 6.3%). Markets are currently pricing in 300bp hikes from BoE until November next year, which we think is too aggressive. Today's figures could however add further pressure on the current market pricing.
In the US, September Housing starts are expected to continue declining following the weak NAHB housing market indicator released yesterday, which fell to the lowest level since May 2020.
Fed's Kashkari and Evans will be on the wires. This week's speeches mark the final communication from the Fed before the blackout period begins on Saturday ahead of the November meeting.
Overnight, Australian labour market data is released, key info for the Reserve Bank of Australia.
The 60 second overview
Macro: German ZEW expectations showed a small rebound amid less gloomy outlook on energy markets. The current situation assessment declined in October, though. Overall, ZEW still provides a clear recession signal and sets the scene for another round of weaker PMIs for October.
Bank of England: The FT story from yesterday is "inaccurate", according to a spokesperson from BoE. That is, the BoE had not decided to delay sales of government bonds. Later, BoE pushed the date one day forward to 1 November due to fiscal announcements on 31 October.
China: Data releases in China on GDP etc. have been postponed until after the Congress of the Communist Party (CPC). It seems CPC wants full attention on the Congress, but it sends a signal that the data are probably not great.
Energy: Brent crude oil traded below USD90 per barrel yesterday not least on the postponement of (potentially weak) data, from the world's top crude oil importer, China. Reports that the US will continue releasing oil reserves was another factor. Today, President Biden will announce the sale of an additional 15 million barrels in December. In Europe, natural gas prices remain around EUR60 per MwH, the lowest levels in more than a year.
Equities continued the rebound but lost some of its steam. US indices closed up 1%. Risk on, but this time with value cyclicals outperforming, such as industrials and materials. VIX has moved lower over the past week, but only mildly so and is still way above 30. This is an example of the positioning tailwind driving this rebound. US futures are 1% higher this morning too.
FI: It was a volatile session with the new 7y German bond sale barely oversubscribed at only 1.04x. Hawkish comments from Villeroy in the morning superseded the UK developments but in the end, UK was yet again the catalyst for most directional moves in Euro space.
FX: Energy importing currencies in EUR, CZK and PLN had a strong session yesterday only surpassed by the spike in NZD as a consequence of higher-than-expected inflation. GBP, ZAR and NOK all traded on the back foot while USD/JPY continues to edge higher. USD/CNY hovers just around 7.20.
Credit: Credit markets had a slightly positive tone - supported by a general risk-on sentiment. That said, the level of turn-over in the corporate bond market was still relatively low. During Tuesday, the iTraxx main tightened marginally to 125bp while Xover tightened 5bp to 599bp.
Technical Outlook and Review
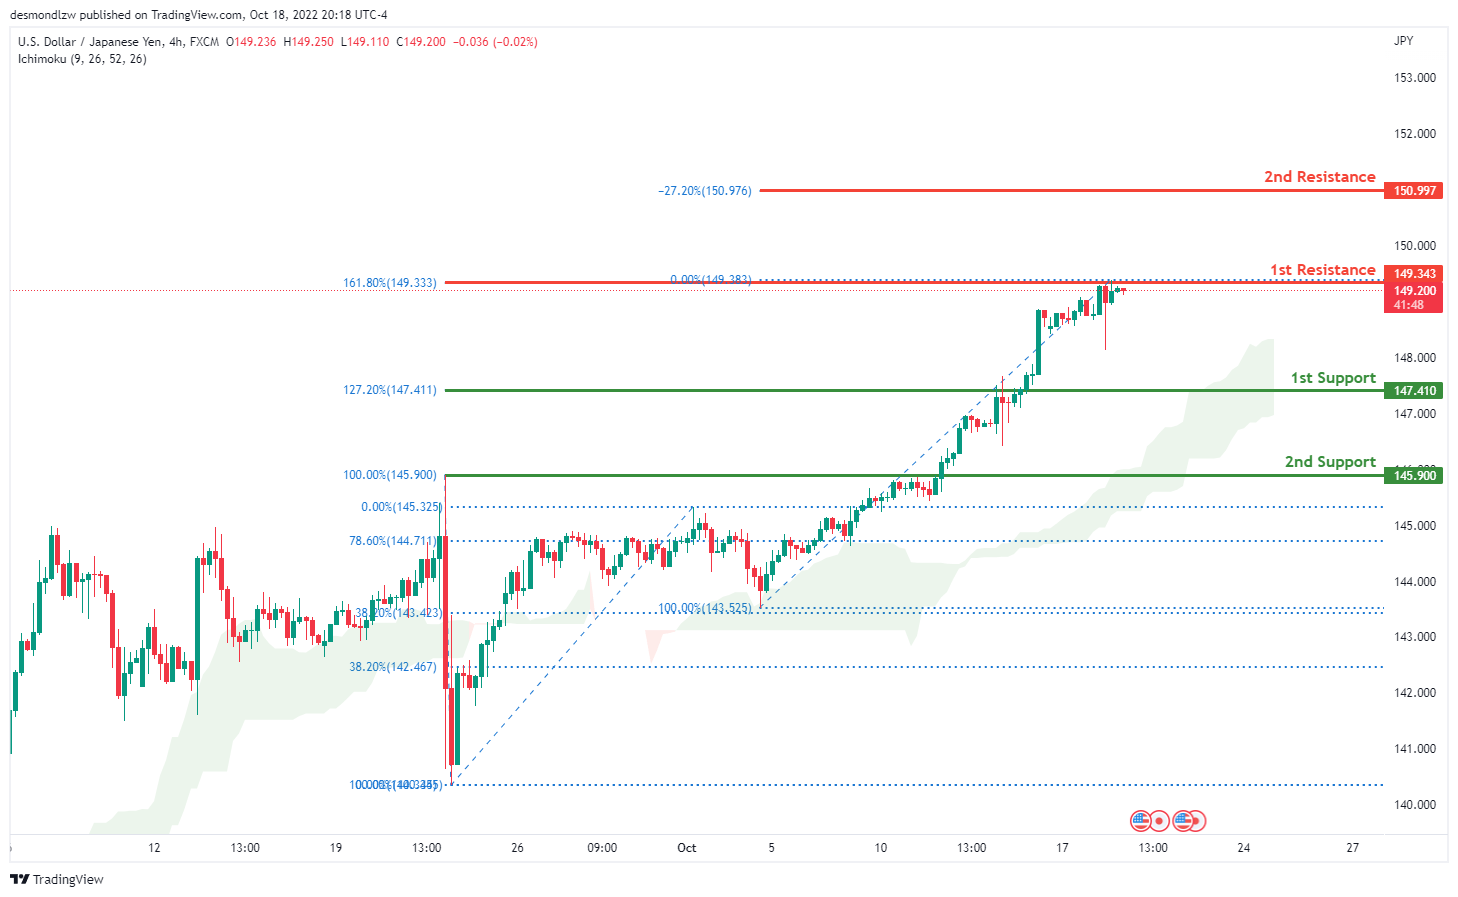
USD/JPY:
The current general bias for USDJPY on the H4 chart is bullish. To add to this bias, the price is currently trading above the Ichimoku cloud, indicating a bullish market. Price has maintained its strong bullish momentum and crossed the key level at 149.00 with price currently at the 1st resistance at 149.313 where the 161.8% Fibonacci extension is located. If this strong bullish momentum continues, expect price to continue towards the 2nd resistance at 150.997 where the -27.2% Fibonacci expansion is located.
Areas of consideration:
- H4 time frame, 1st resistance at 147.410
- H4 time frame, 2nd resistance at 150.997
- H4 time frame, 1st support at 145.900
DXY:
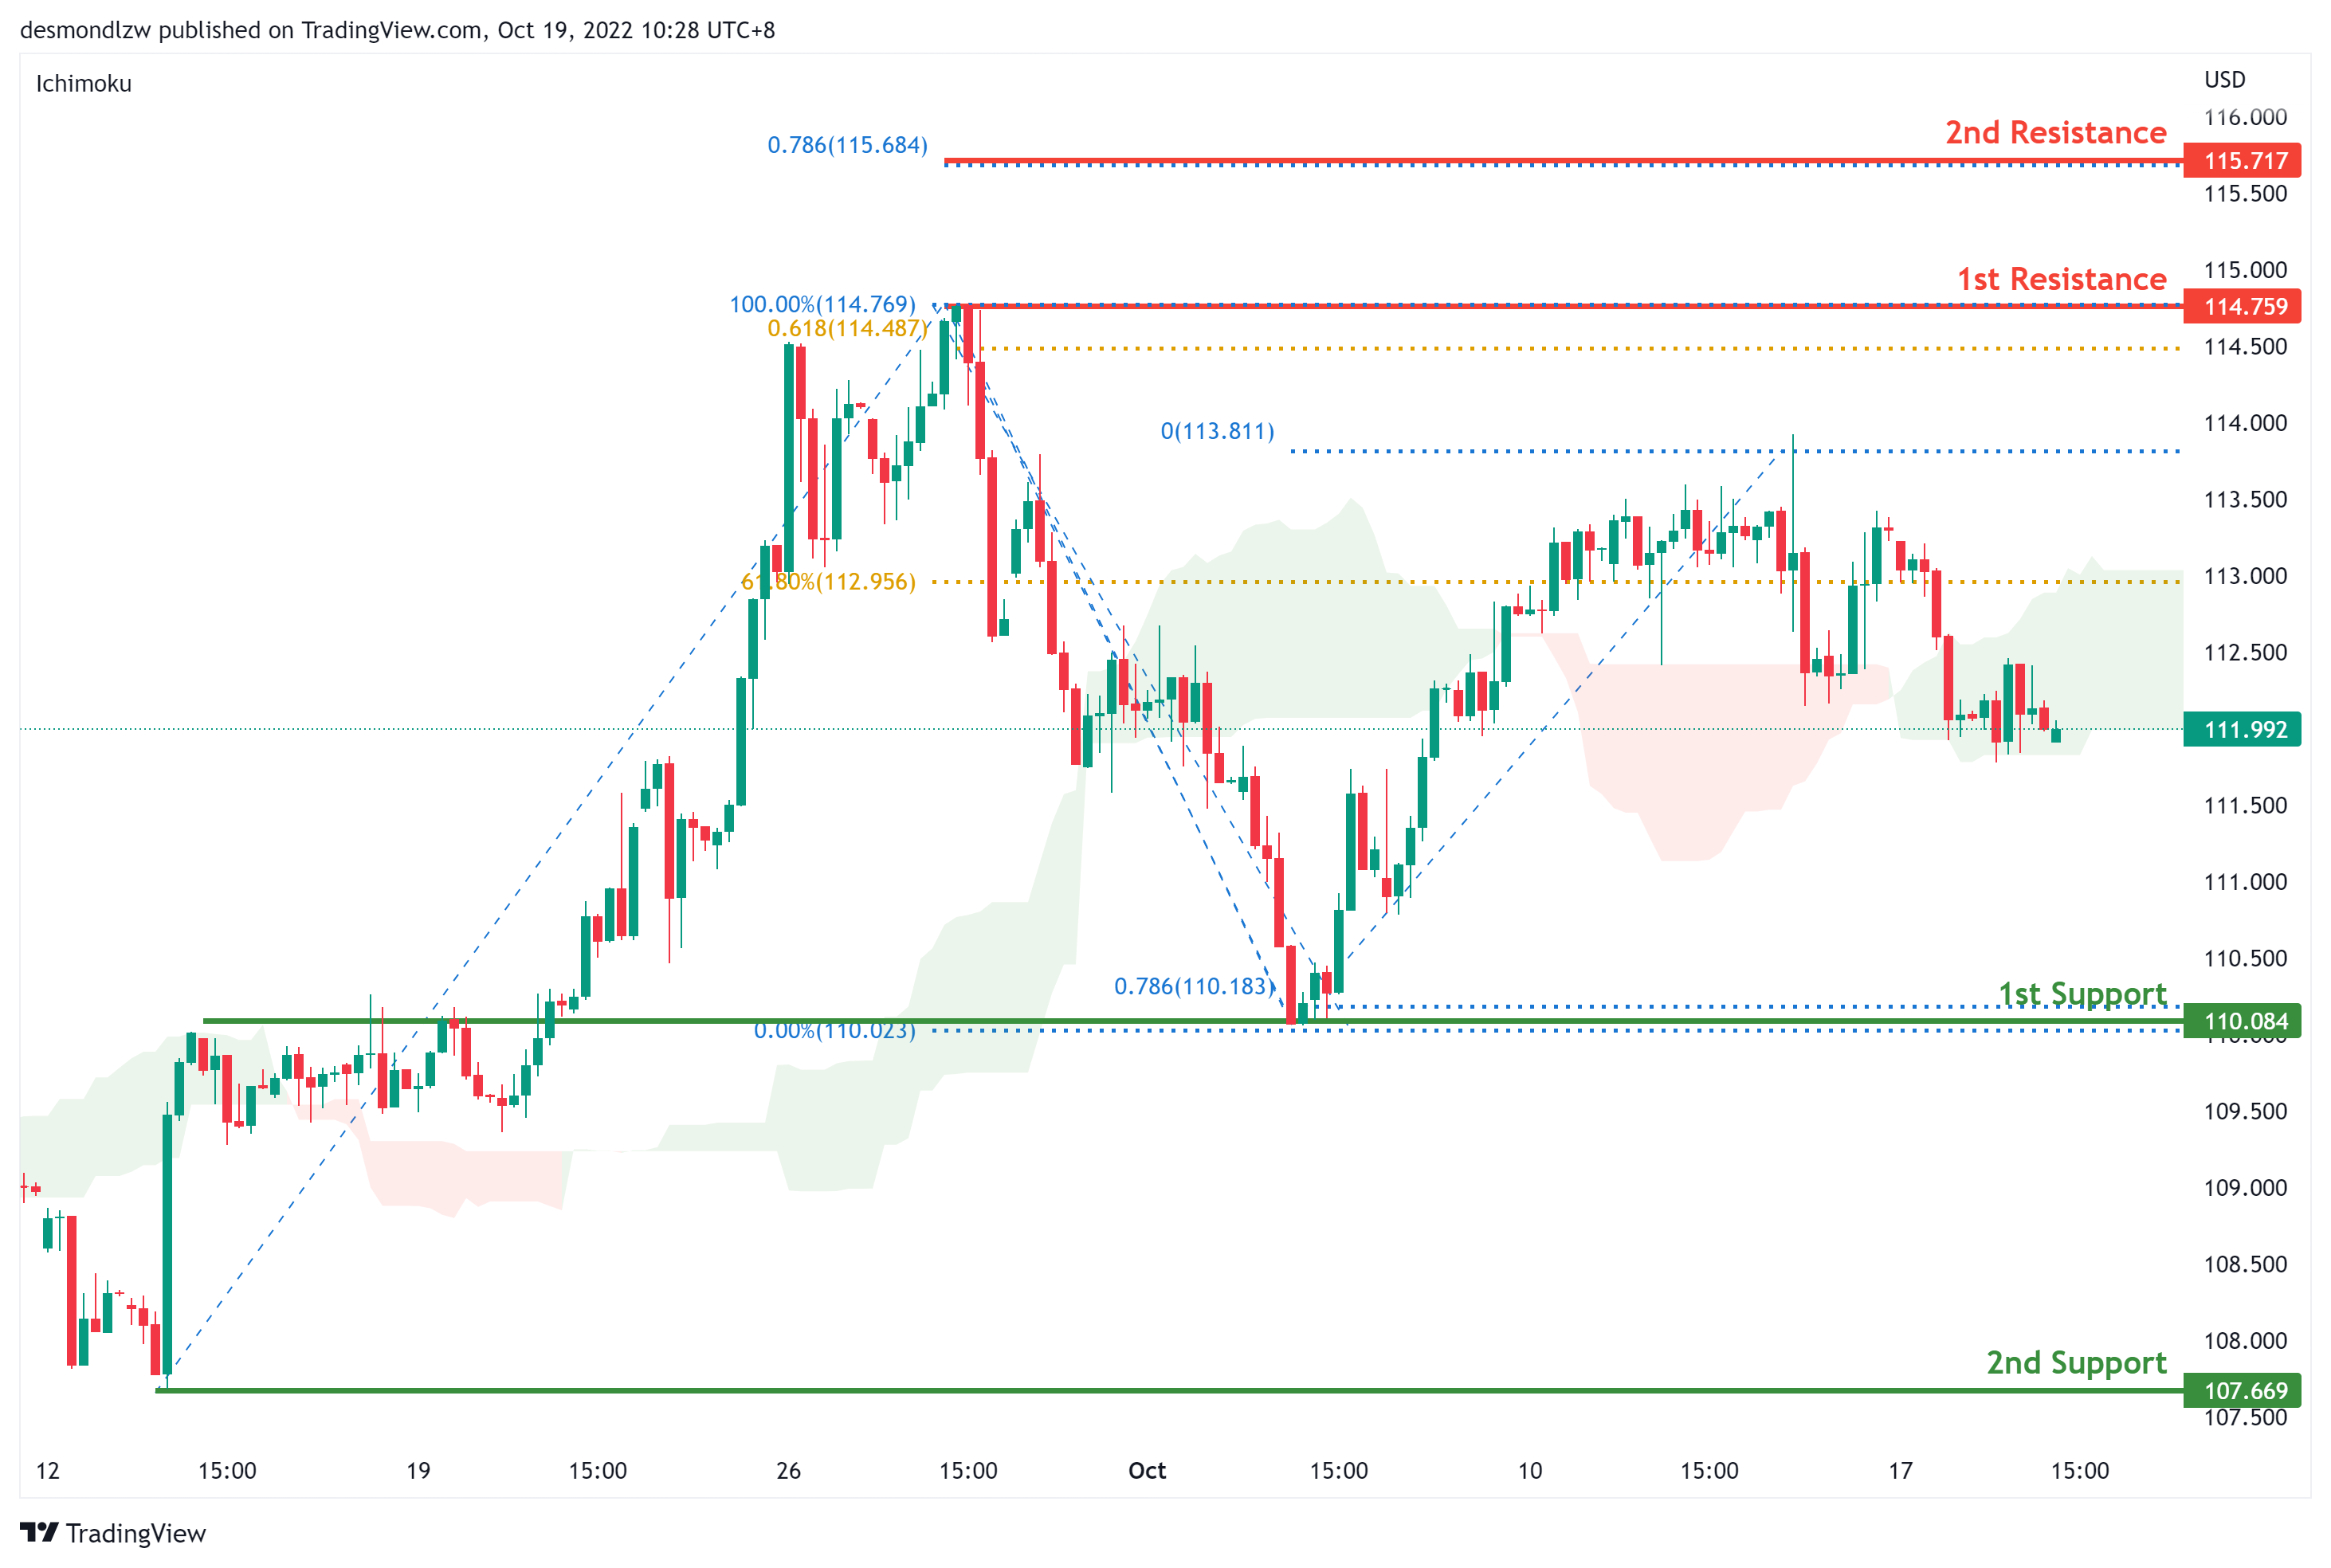
On the H4 chart, prices are moving in a descending trend signalling a bearish momentum. Prices are moving towards the first support at 110.084 where the swing low sits. if it breaks this level, bearish momentum will bring price to second support at 107.669. Alternatively if bullish momentum continues it will bring price to 114.759 and if it breaks this level, bullish momentum will carry price to 115.717 where the 78.6% projection.
Areas of consideration:
- H4 time frame, 1st resistance at 114.759
- H4 time frame, 1st support at 110.084
EUR/USD:
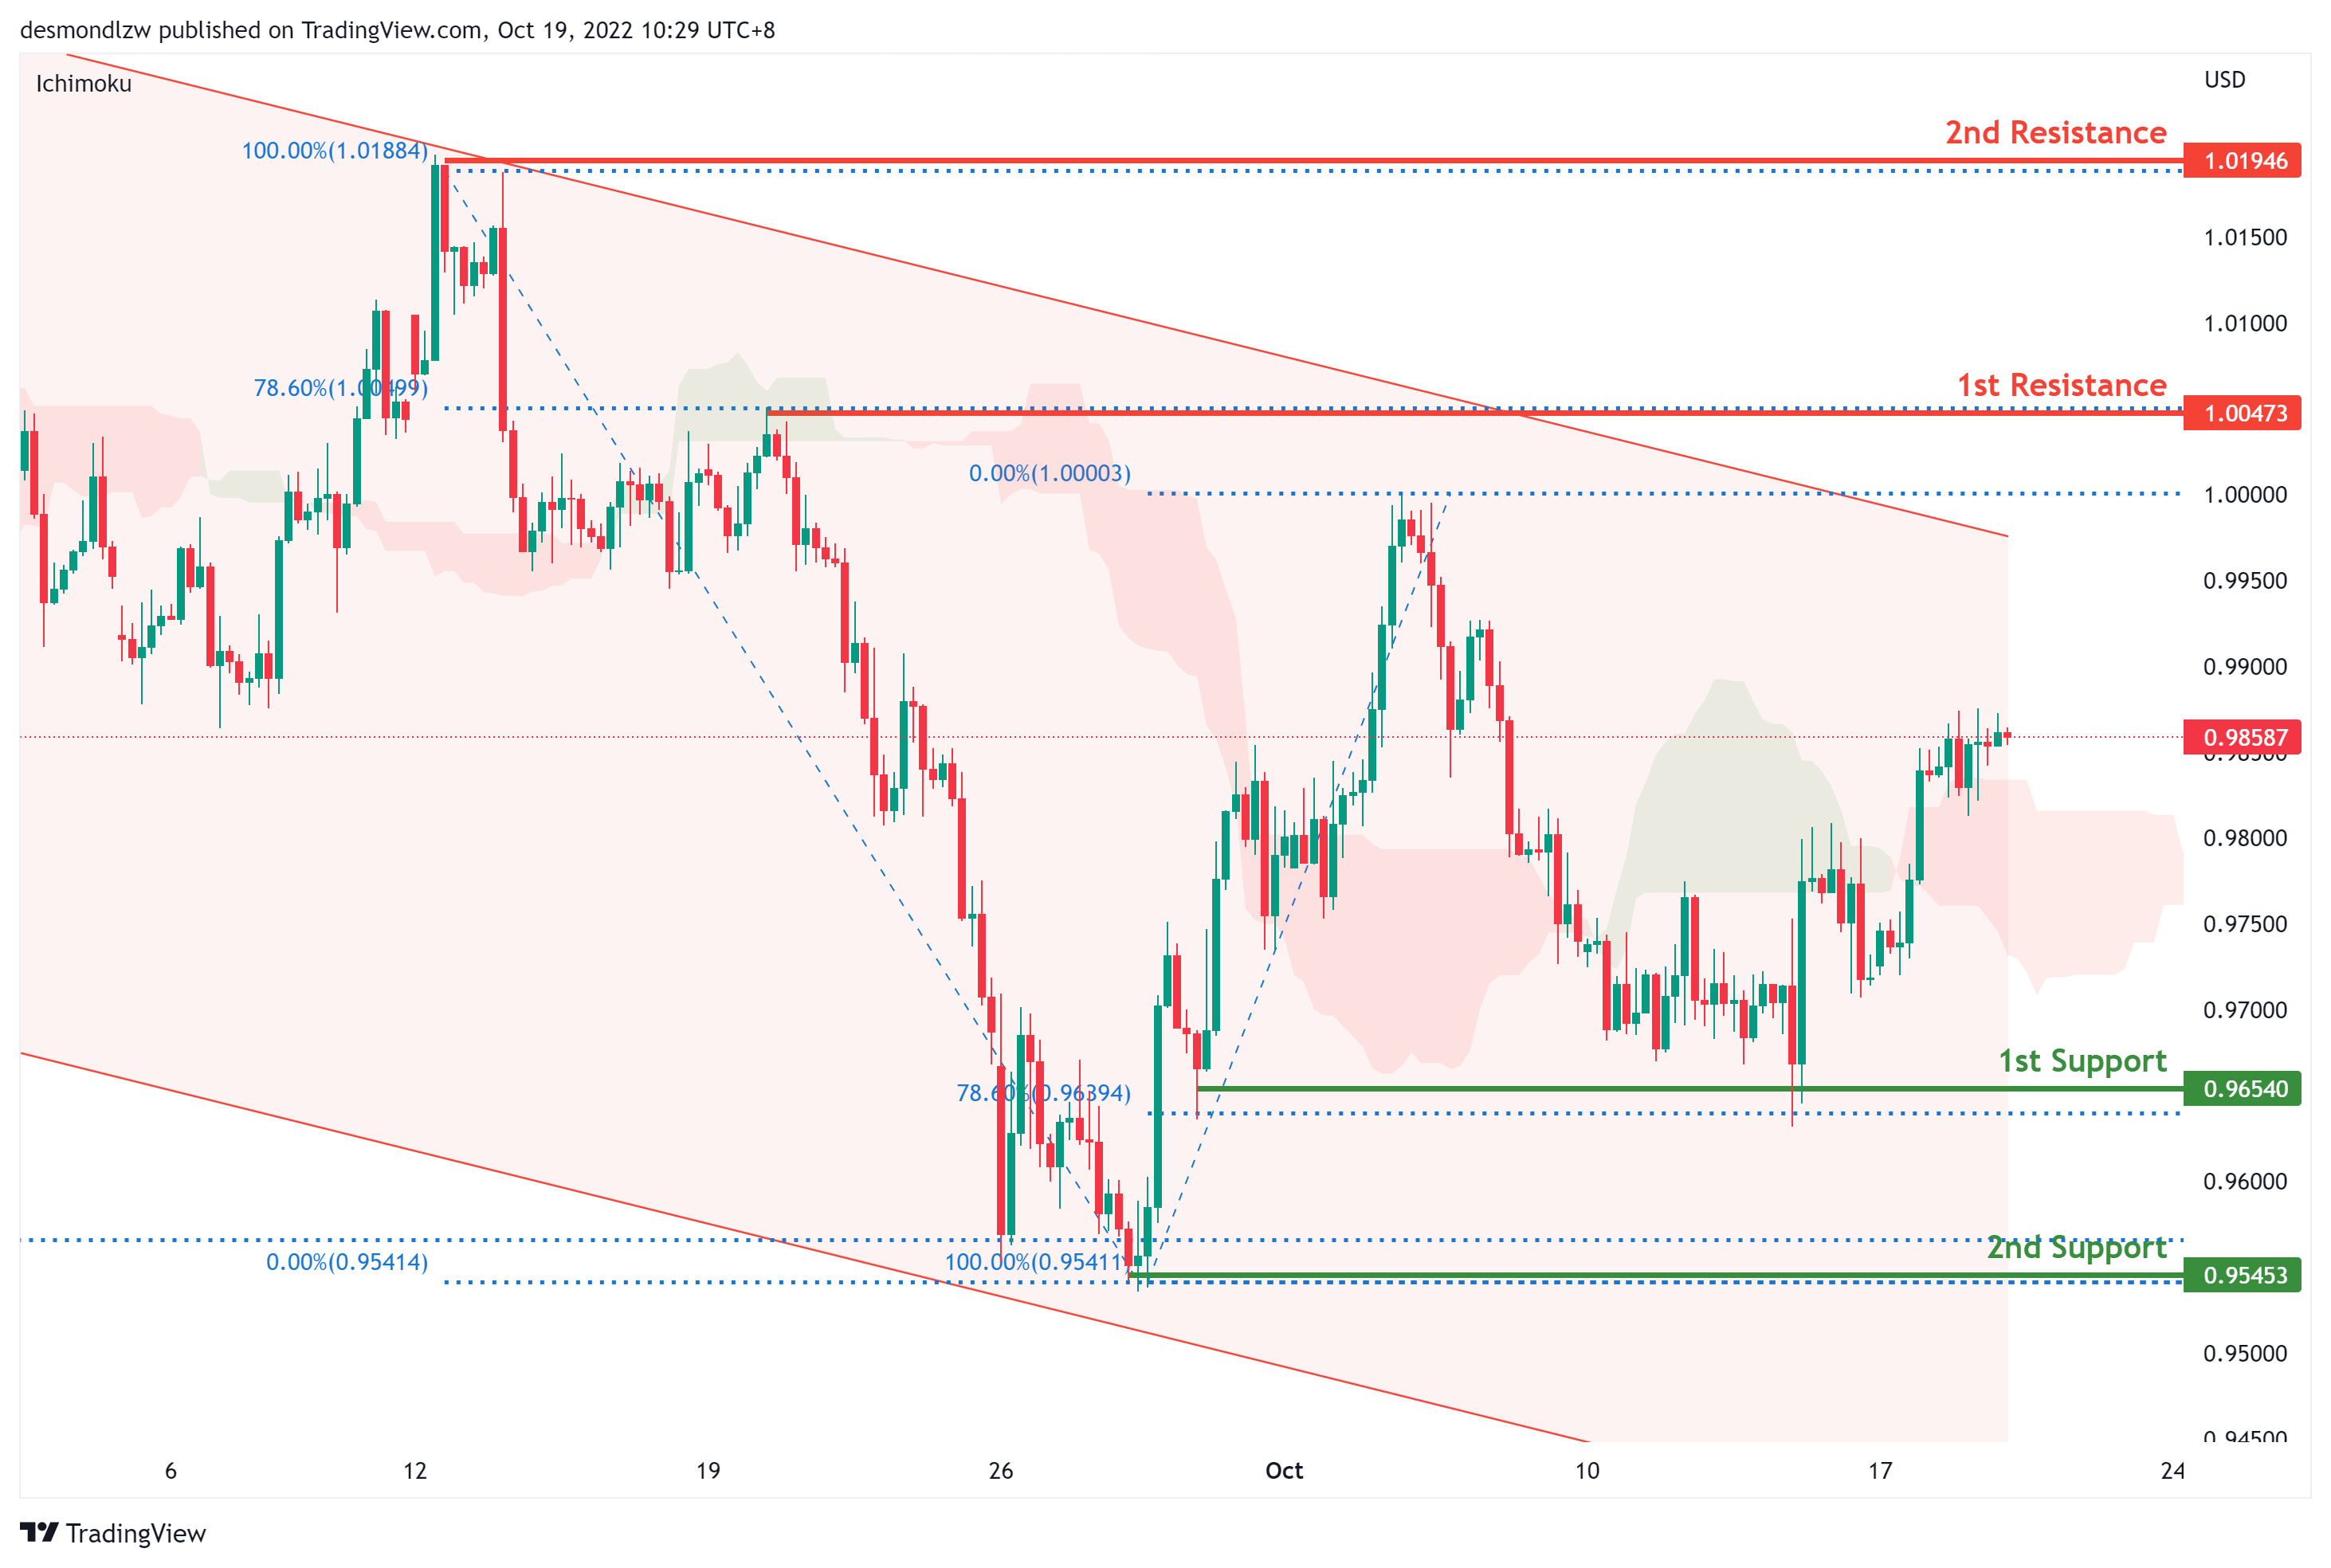
On the H4, price is moving within the descending trendline in a descending manner, with the price moving below ichimoku cloud- we are still overall bearish biased. Price has bounced off the first support hence it might test the first resistance at 1.0047 where the 78.6% retracement sits. If price breaks this level, it may test the second resistance at 1.0194, where the previous swing high sits. Alternatively, bearish momentum might bring price to 0.9695 where the 78.6% retracement sits. if it breaks this level, price would test the second support at 0.9545 where the swing low and 161.8% extension sit.
Areas of consideration :
- H4 1st resistance at 1.0047
- H4 2nd resistance at 1.0194
GBP/USD:
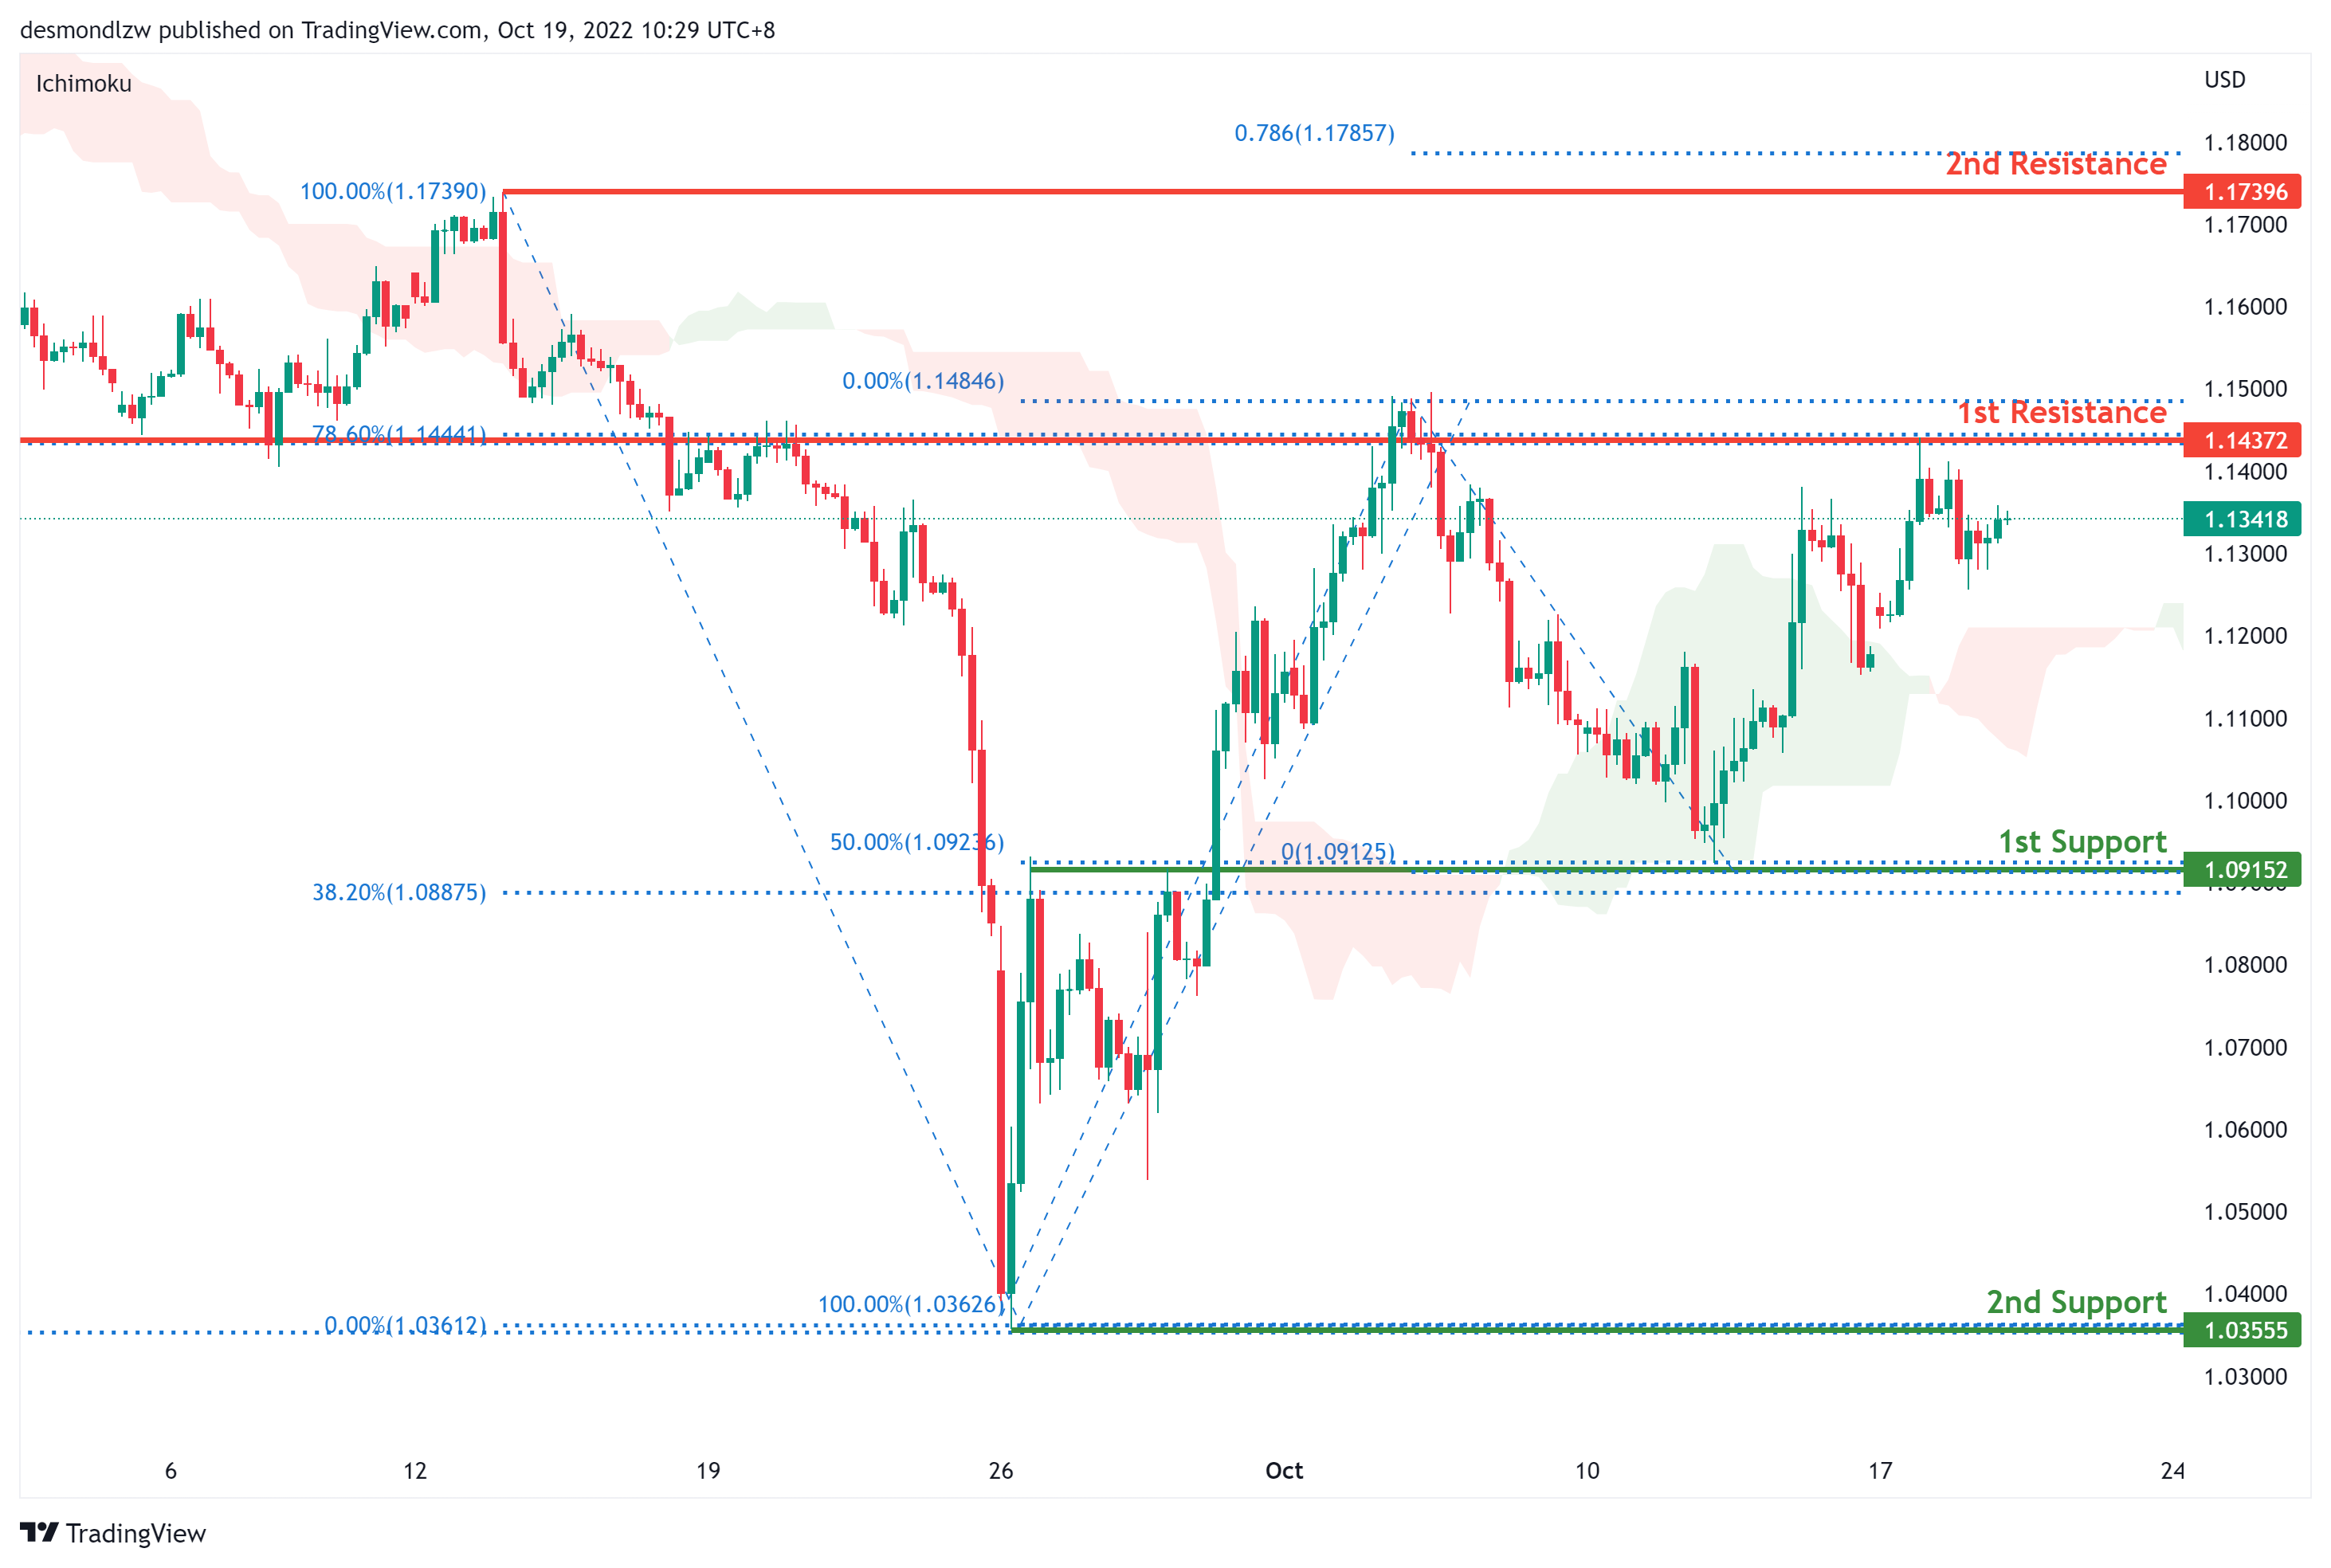
On the H4, price has rejected the resistance and is moving in a descending trend hence we are slightly bearish bias- price looks like its moving toward the first support at 1.0915 where the 50% retracement sits, bearish momentum will bring price to the second support at 1.0355 where the previous swing low sits. Alternatively, price could test the first resistance at 1.1437 where the 78.6% retracement and overlap resistance sit. If it breaks this level, it should test the second resistance at 1.1739.
Areas of consideration:
- H4 1st support at 1.0915
- H4 1st resistance at 1.1437
USD/CHF:
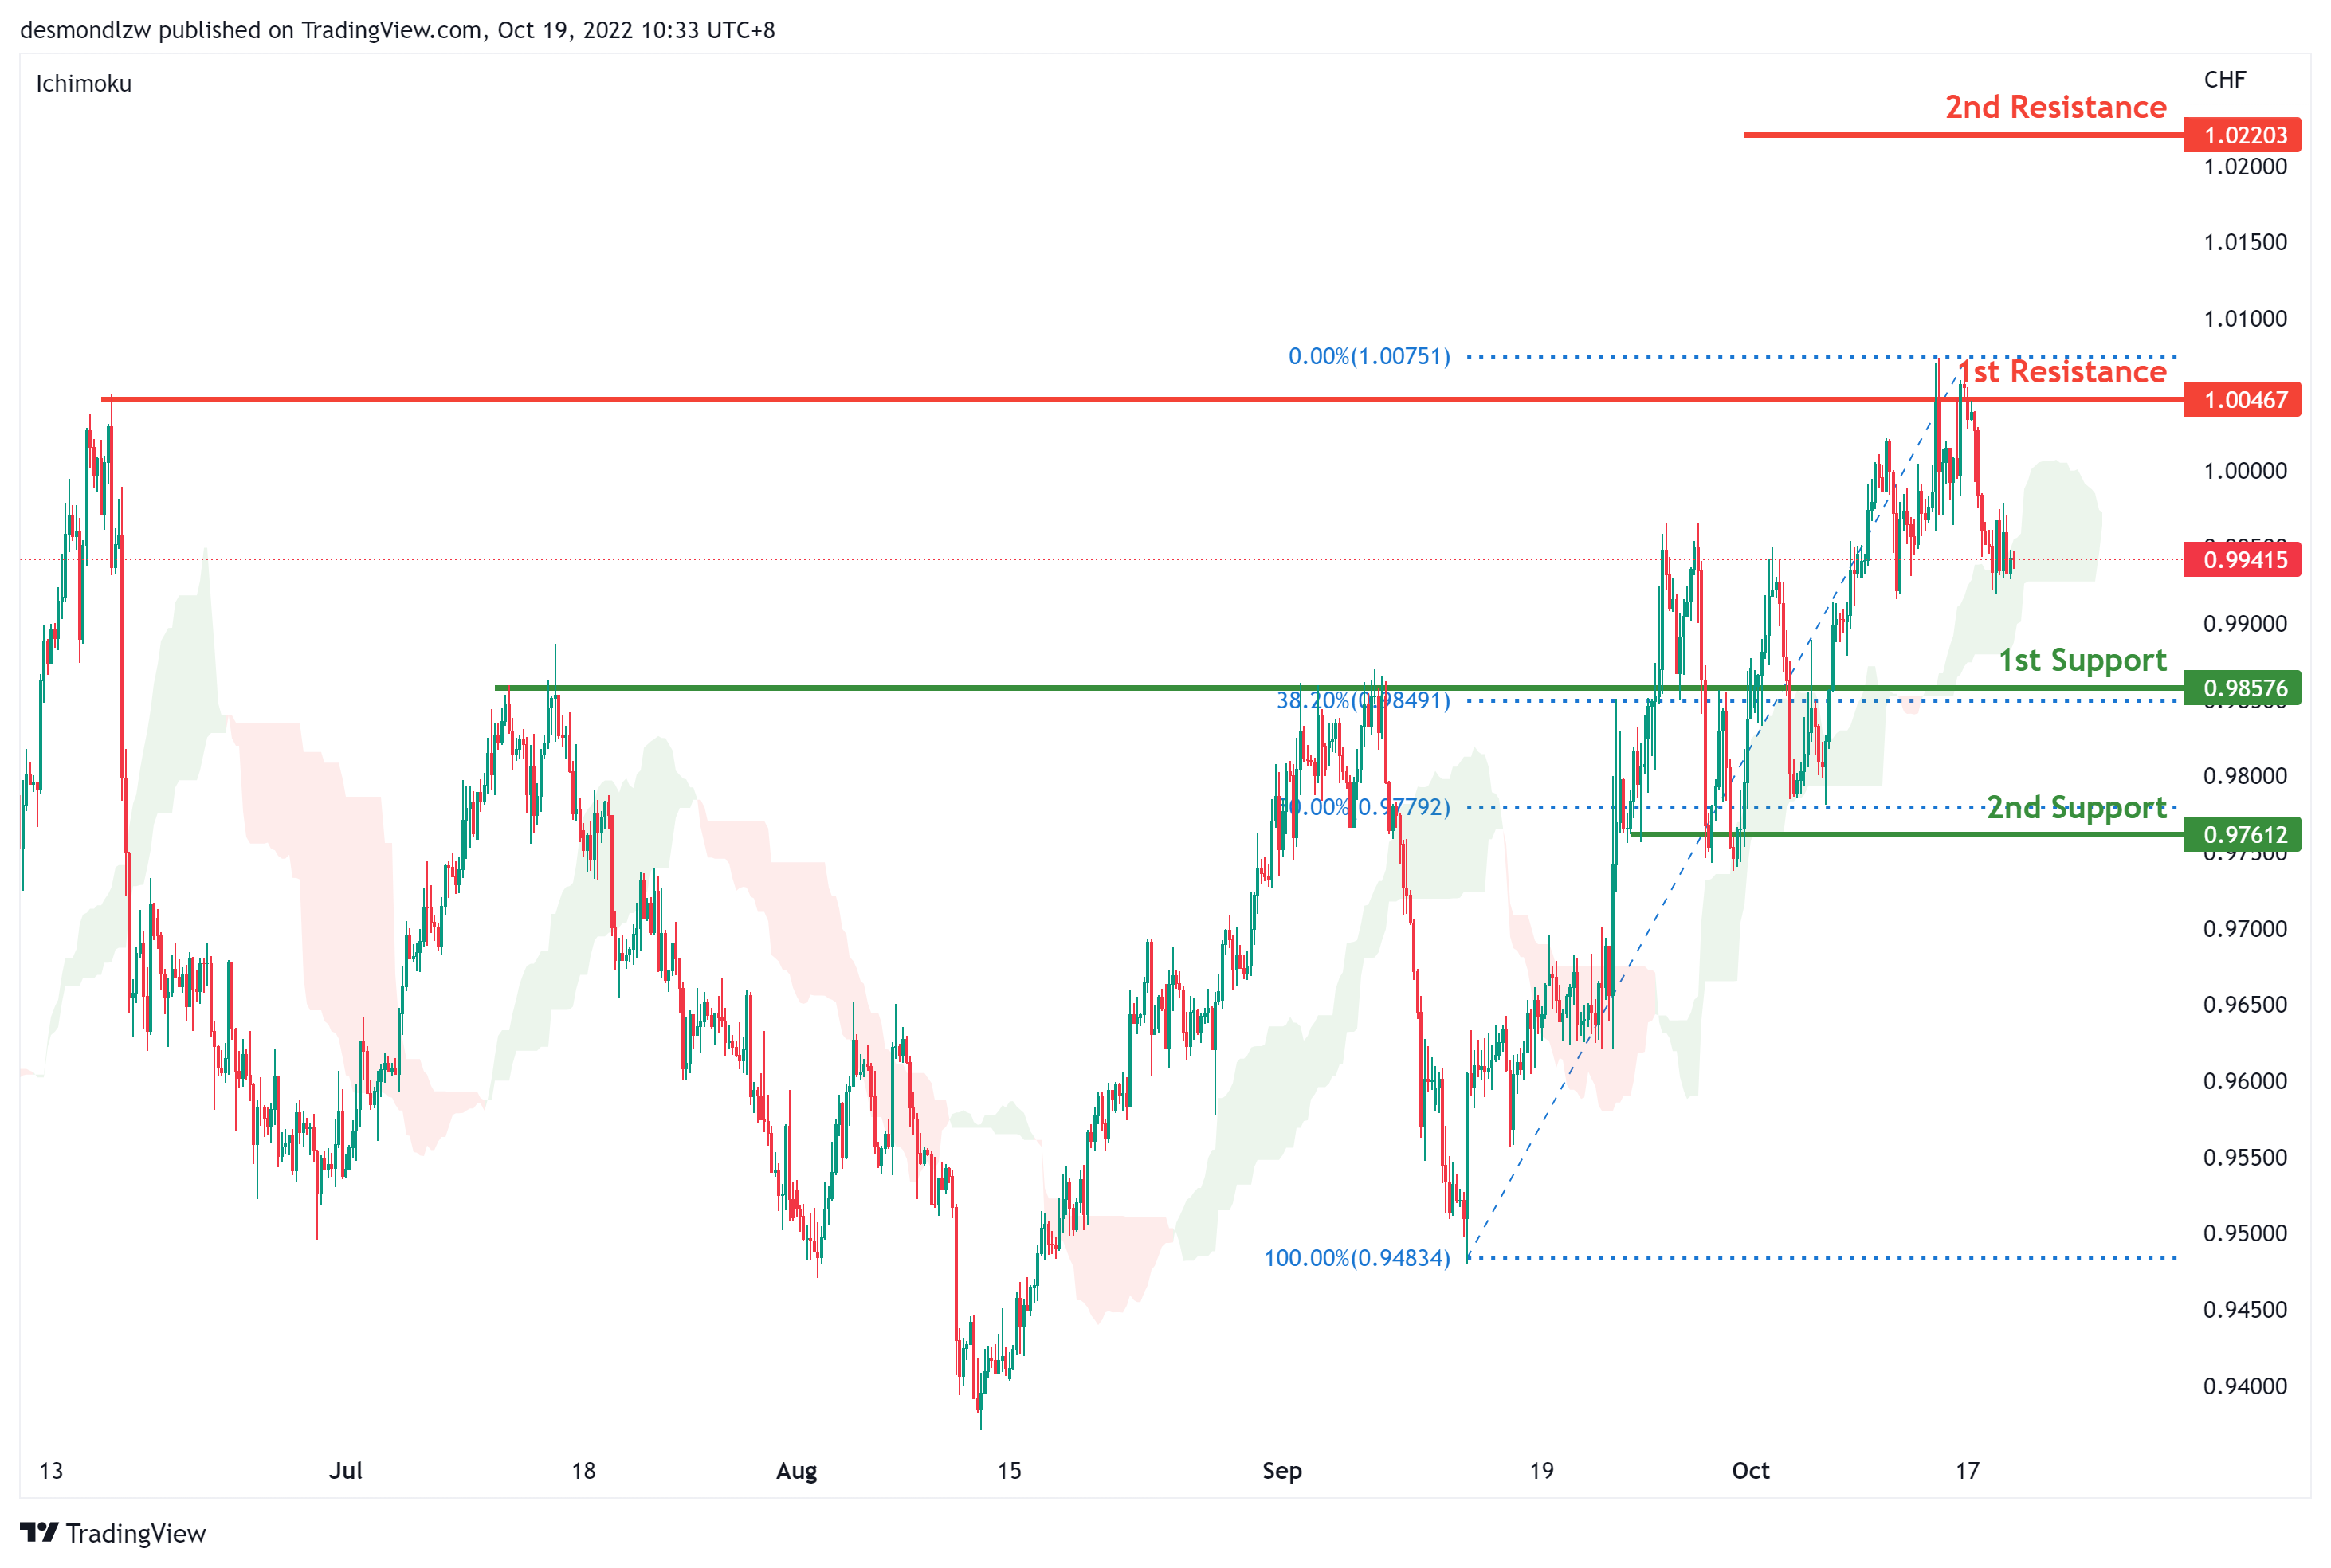
USDCHF is in a strong bullish trend on the H4 chart. Price is trading above the Ichimoku cloud signalling a bullish trend. Price has tested the first resistance at 1.0046 where the previous swing high sits and it’s pulling back slightly. Bullish momentum could potentially drive price up to 1.0220. But if bearish momentum continues, price can test the first support at 0.9868 where the overlap support and 23.6% retracement sits then the second support at 0.9757 where the 50% retracement sits
Areas of consideration
- H4 1st support at 0.9868
- H4 1st resistance at 1.0046
XAU/USD (GOLD):
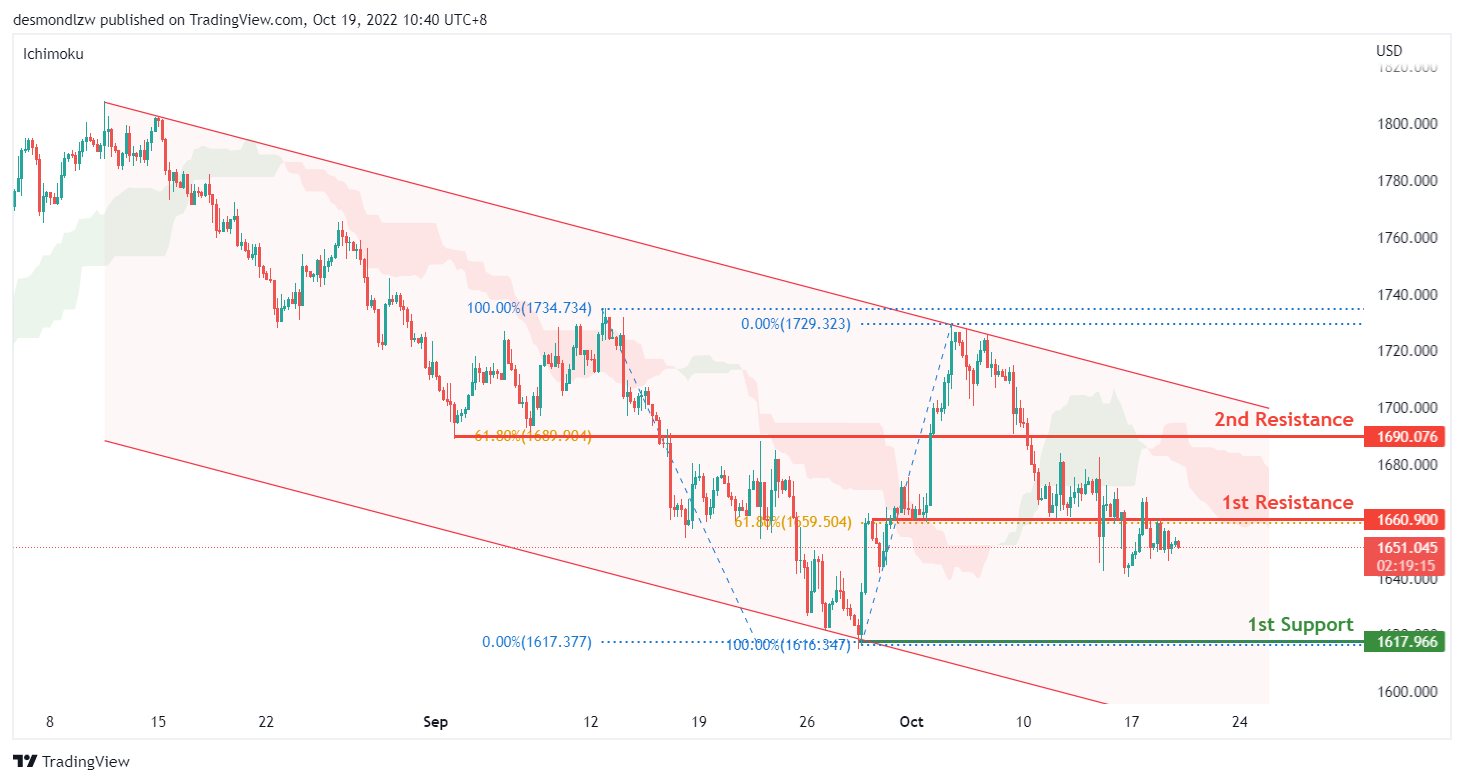
On the H4, price continues to trade below the 1st resistance at 1660.90 which is in line with the 61.8% fibonacci retracement and overlap support. As the price is still within the descending channel, we could expect the price to reverse from the 1st resistance to drop to the 1st support 1617.96, where the previous swing low is. Alternatively, the price may break through the 1st resistance and rise to test the 2nd resistance at 1690, where the 61.8% fibonacci retracement and overlap support is.
Areas of consideration:
- H4 time frame, 1st support at 1617.96
- H4 time frame, 1st resistance at 1660.90
- H4 time frame, 2nd resistance at 1690
AUD/USD:
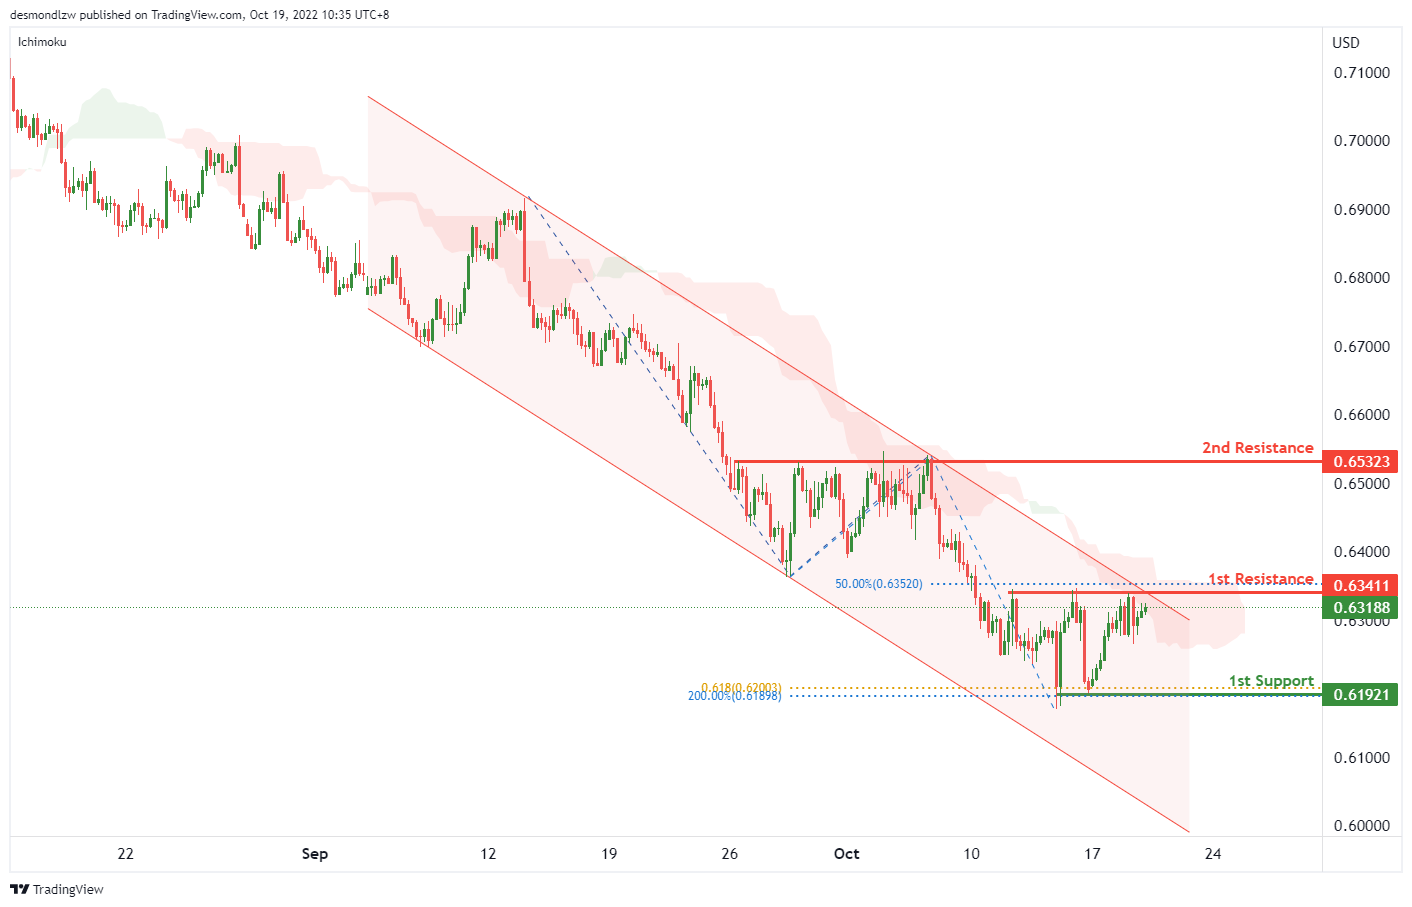
On the H4, the price is reversing from 1st support, with the price is below the descending channel and ichimoku cloud, we can expect the price test the 1st resistance at 0.63411, which is in line with the 23.6% fibonacci retracement and 50% fibonacci retracement. If the 1st resistance is broken, as the descending channel and ichimoku cloud are both broken, we can expect the bullish momentum to carry the price to the 2nd resistance at 0.65323, which is in line with the overlap resistance. Alternatively, the price may drop to the 1st support at 0.61921, where the previous swing low, 61.8% fibonacci projection and 200% fibonacci extension are.
Areas of consideration
- H4, 1st resistance at 0.63411
- H4, 2nd resistance at 0.65323
NZD/USD:
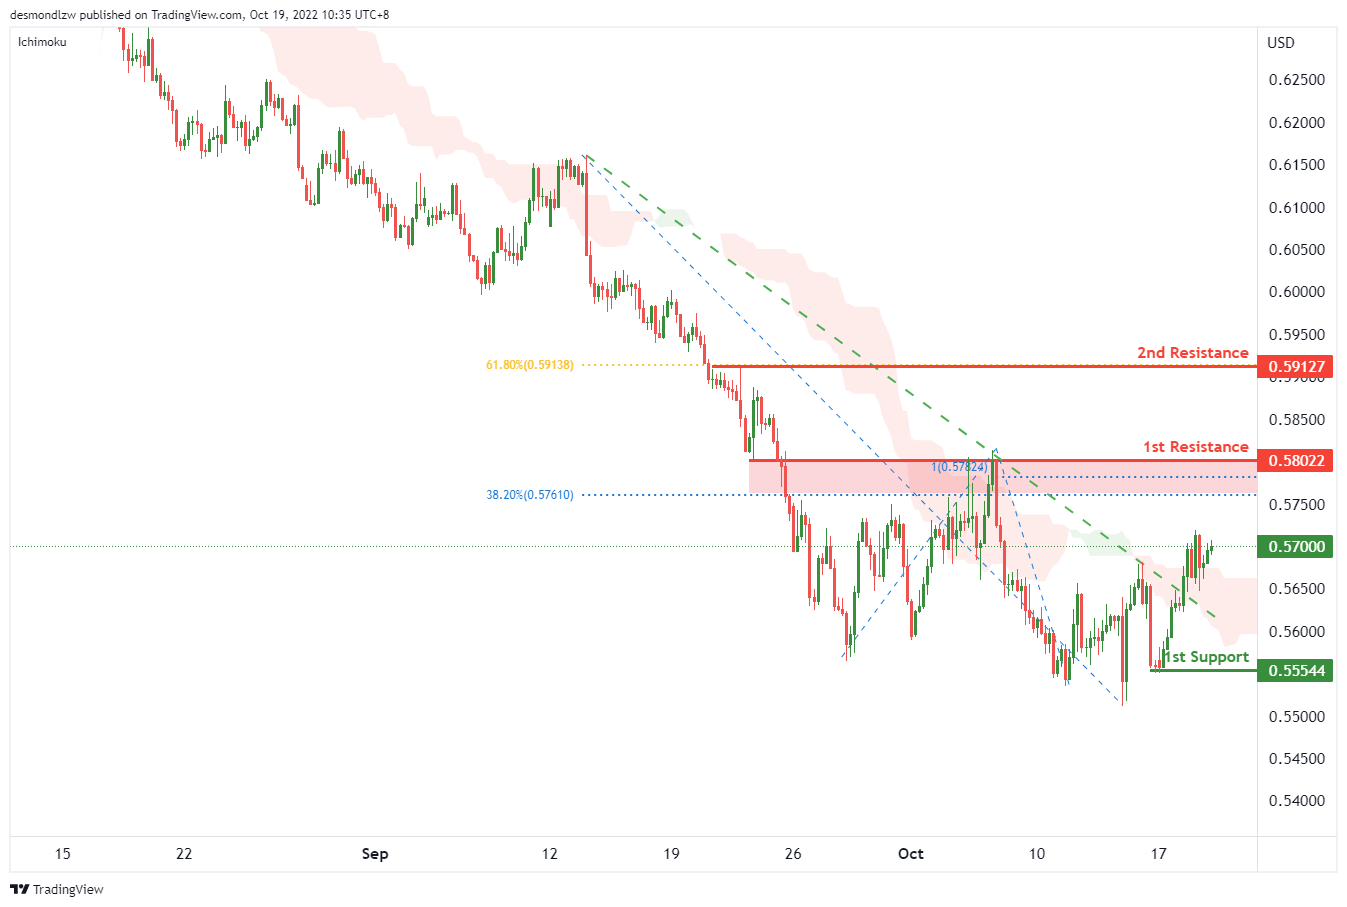
On the H4, the price is breaking the ichimoku cloud and descending trendline, we can expect the price to rise to the 1st resistance at 0.58022, where the previous swing high, 100% fibonacci projection and 38.2% fibonacci retracement are. If the price can break the 1st resistance, we can expect the price rise to the 2nd resistance at 0.59127, where the 61.8% fibonacci retracement is. Alternatively, the price may drop to the 1st support at 0.55544, where the swing low support is.
Areas of consideration:
- H4 time frame, 1st resistance at 0.58022
- H4 time frame, 2nd resistance at 0.59127
USD/CAD:
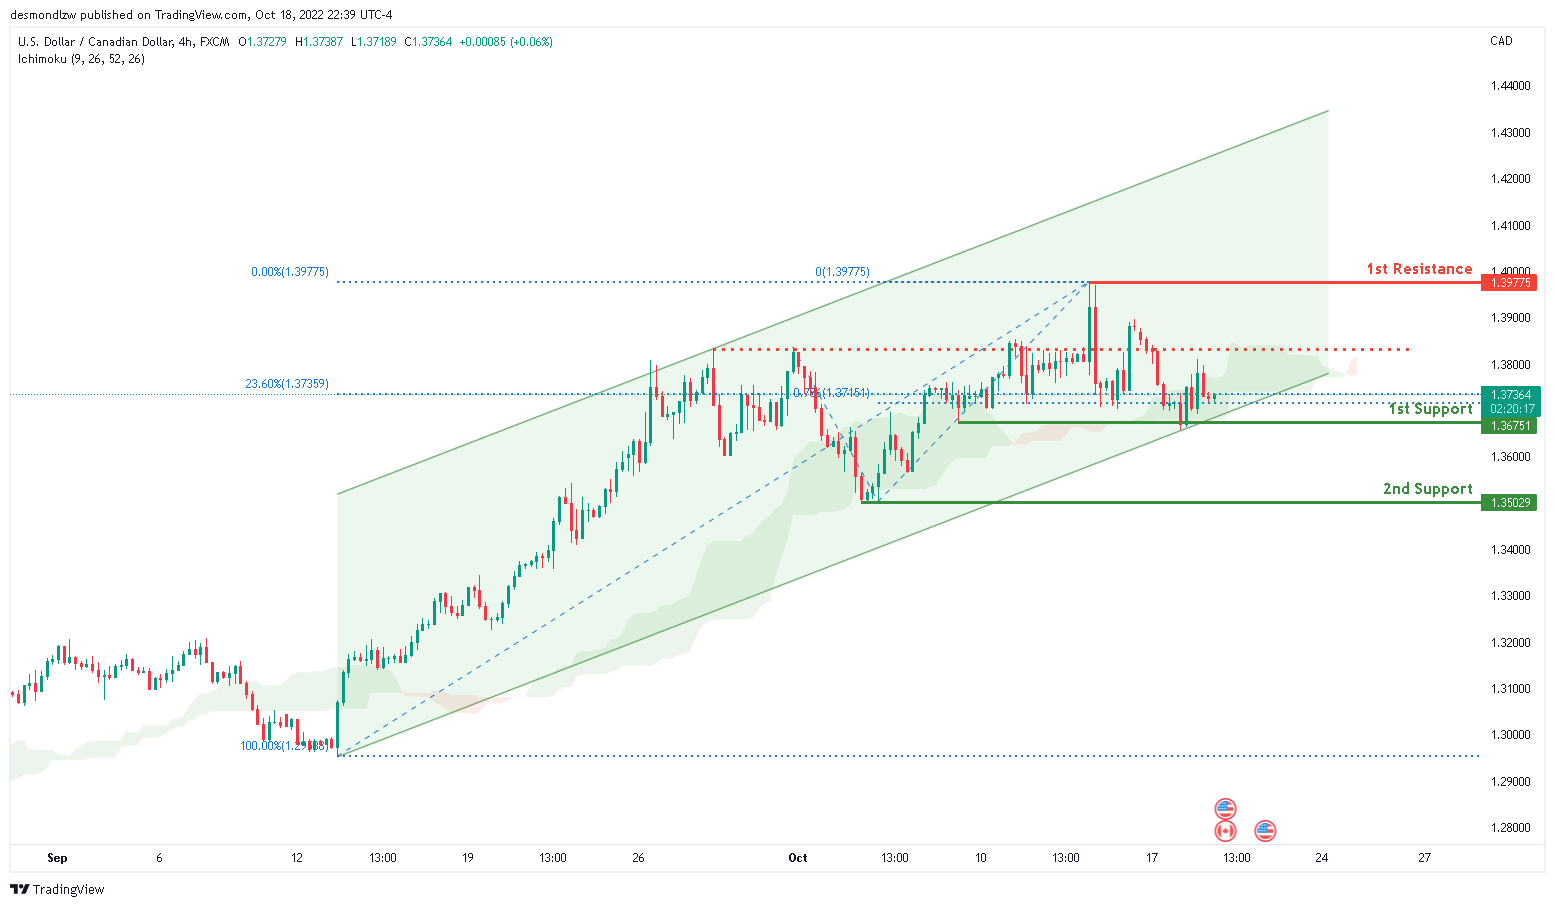
On the H4 chart, the overall bias for USDCAD is bullish. To add confluence to this, price is above the Ichimoku cloud which indicates a bullish market. Overnight, price has reflected off the 1st support line at 1.36751 where the 23.6% Fibonacci line and 78.6% Fibonacci projection line is. If this bullish momentum continues, expect price to head towards the 1st resistance at 1.3967 where the high is located.
Areas of consideration:
- H4 time frame, 1st resistance at 1.3967
- H4 time frame, 1st support at 1.36751
OIL:
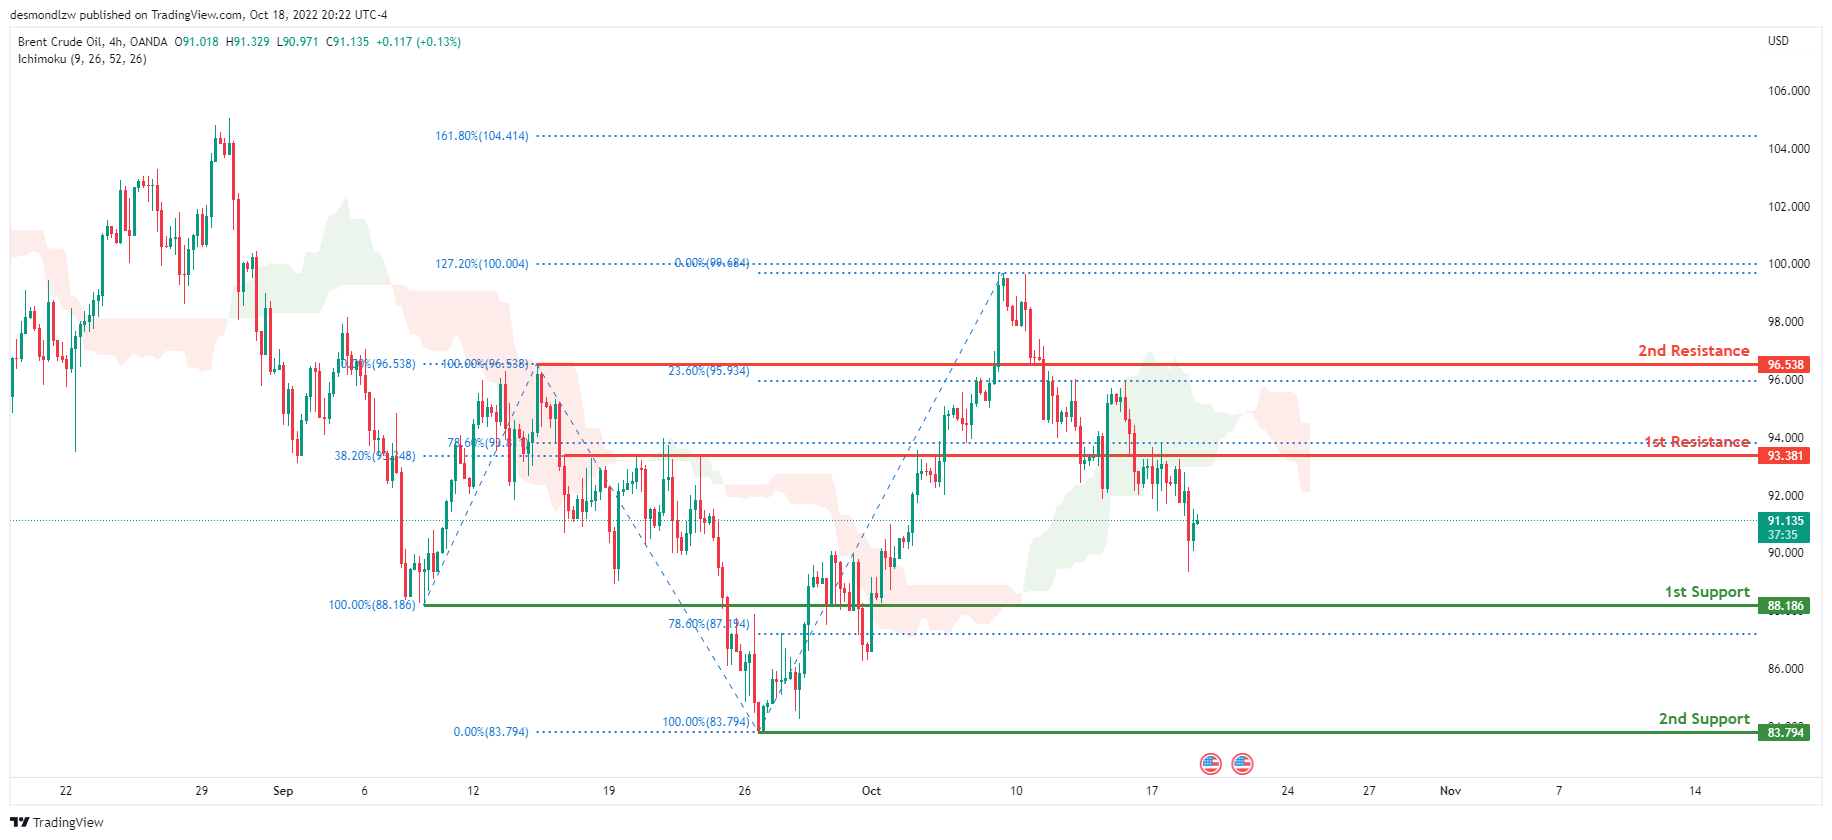
Looking at the H4 chart, the current overall bias for Oil is bearish. To add confluence to this bias, the price is currently below the Ichimoku cloud which indicates a bearish market. Overnight, price continued its bearish momentum downwards. If this bearish momentum continues, expect the price to head towards the 1st support at 88.186 where the 100% Fibonacci line and 78.6% Fibonacci line are located.
Areas of consideration:
- H4 time frame, 1st resistance at 93.381
- H4 time frame, 1st support at 88.186
Dow Jones Industrial Average:
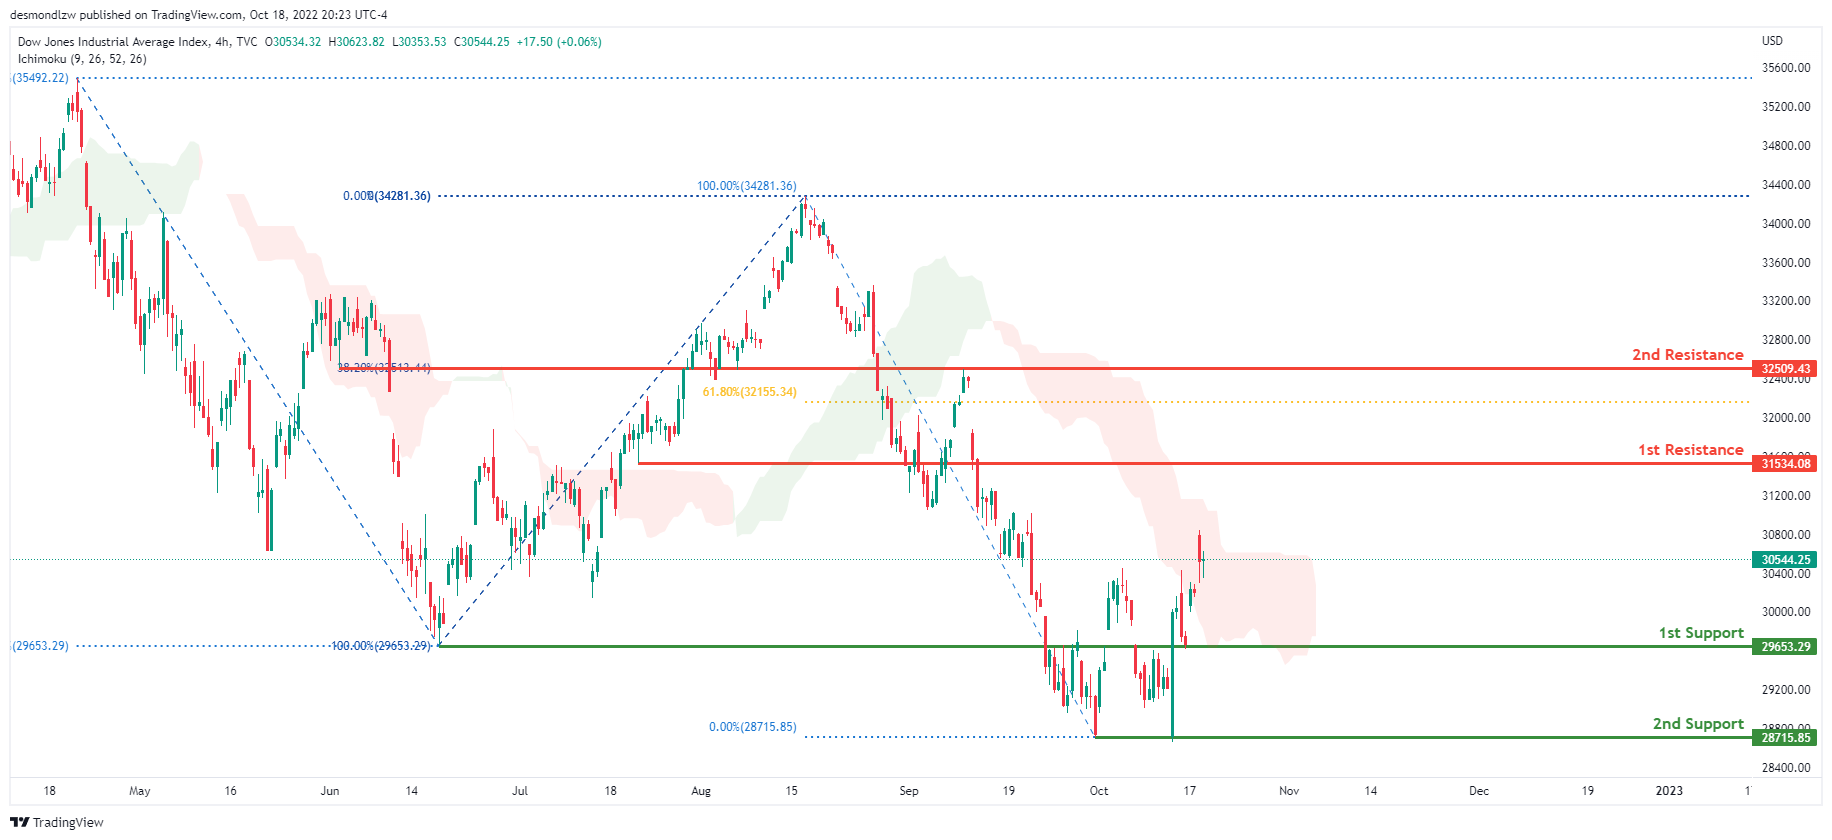
The current overall bias for DJI is bearish, according to the H4 chart. Overnight, price continued its bullish momentum upwards. If this short term bullish momentum continues, expect the price to possibly head towards the 1st resistance at 30982.97 where the 38.2% Fibonacci line is located.
Areas of consideration:
- H4 time frame, 1st support at 29653.29
- H4 time frame, 2nd support at 28715.85
- H4 time frame, 1st Resistance at 30982.97
DAX:
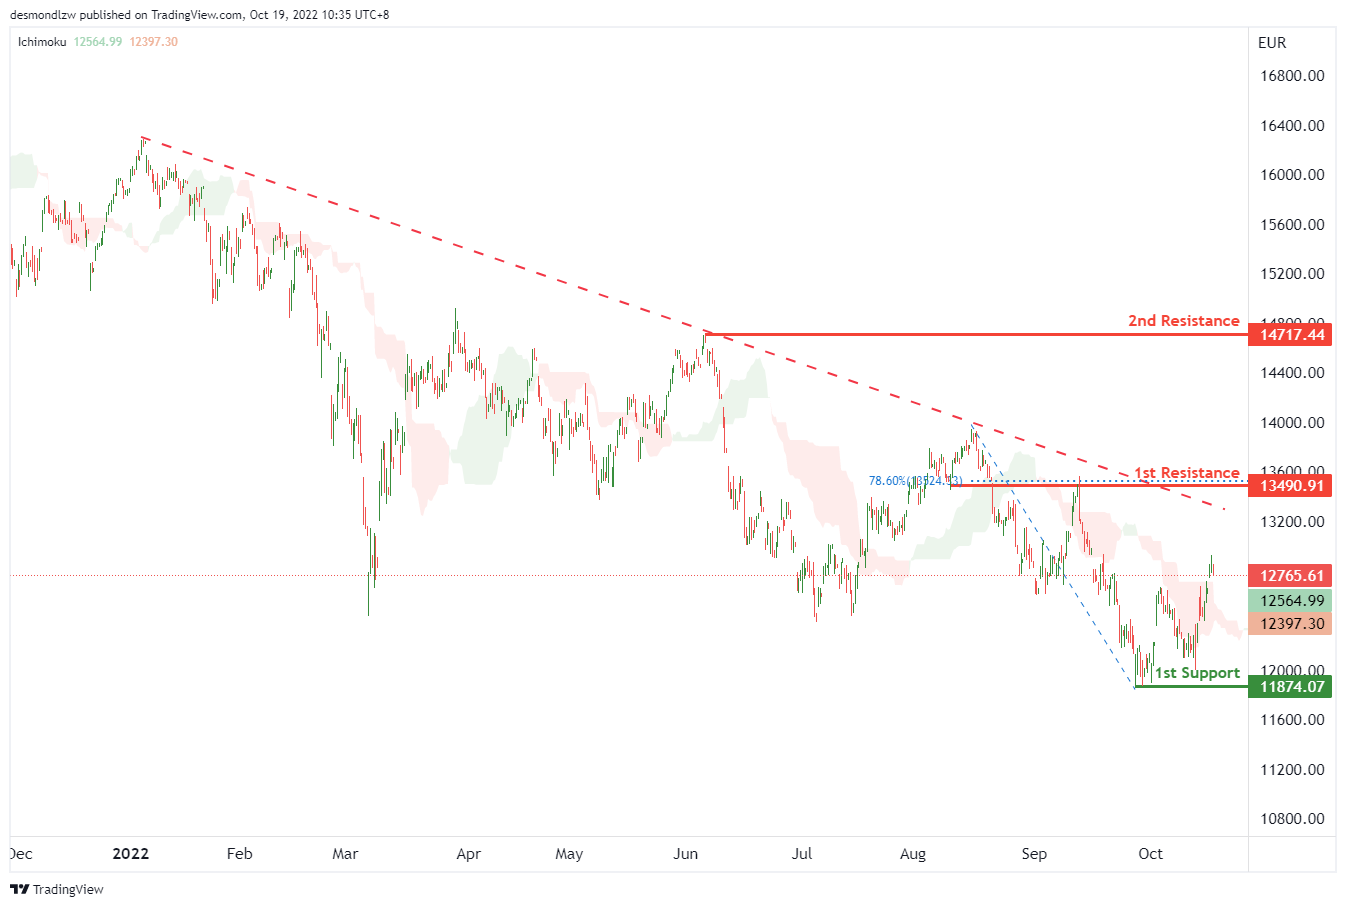
On the H4, as the price is crossing the ichimoku cloud, we can expect the price to break the 1st resistance at 13490.91, where the overlap resistance and 78.6% fibonacci retracement are. If the 1st resistance is broken, the 2nd resistance is at 14717.44, which is in line with the previous swing high. Alternatively, as the price is below the descending trendline, the price may drop to the 1st support at 11874.07, which is in line with the swing low.
Areas of consideration:
- H4 time frame, current price
- H4 time frame, 1st resistance at 12668.06
ETHUSD:
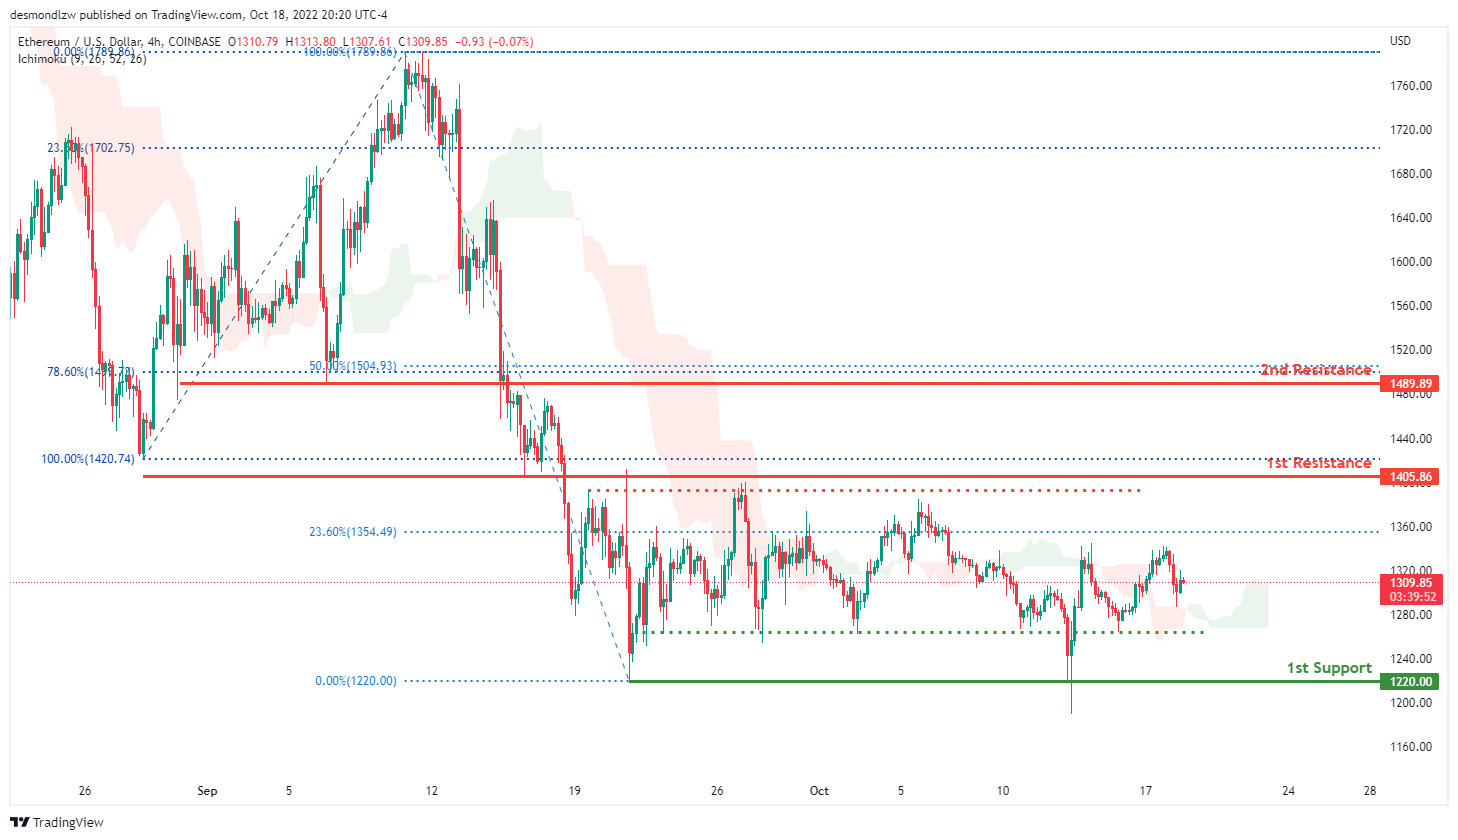
Looking at the H4 chart, the current overall bias for ETHUSD is bearish. However overnight, price has closed above the Ichimoku cloud which might indicate a short term bullish momentum. For the past 1 month, price has been consolidating between the 1st resistance at 1405.86 and 1st support at 1405.86. Expecting price to continue consolidating in this area with no clear signs of direction.
Areas of consideration:
- H4 time frame, 1st resistance of 1405.86
- H4 time frame, 1st support at 1220.00
BTCUSD:
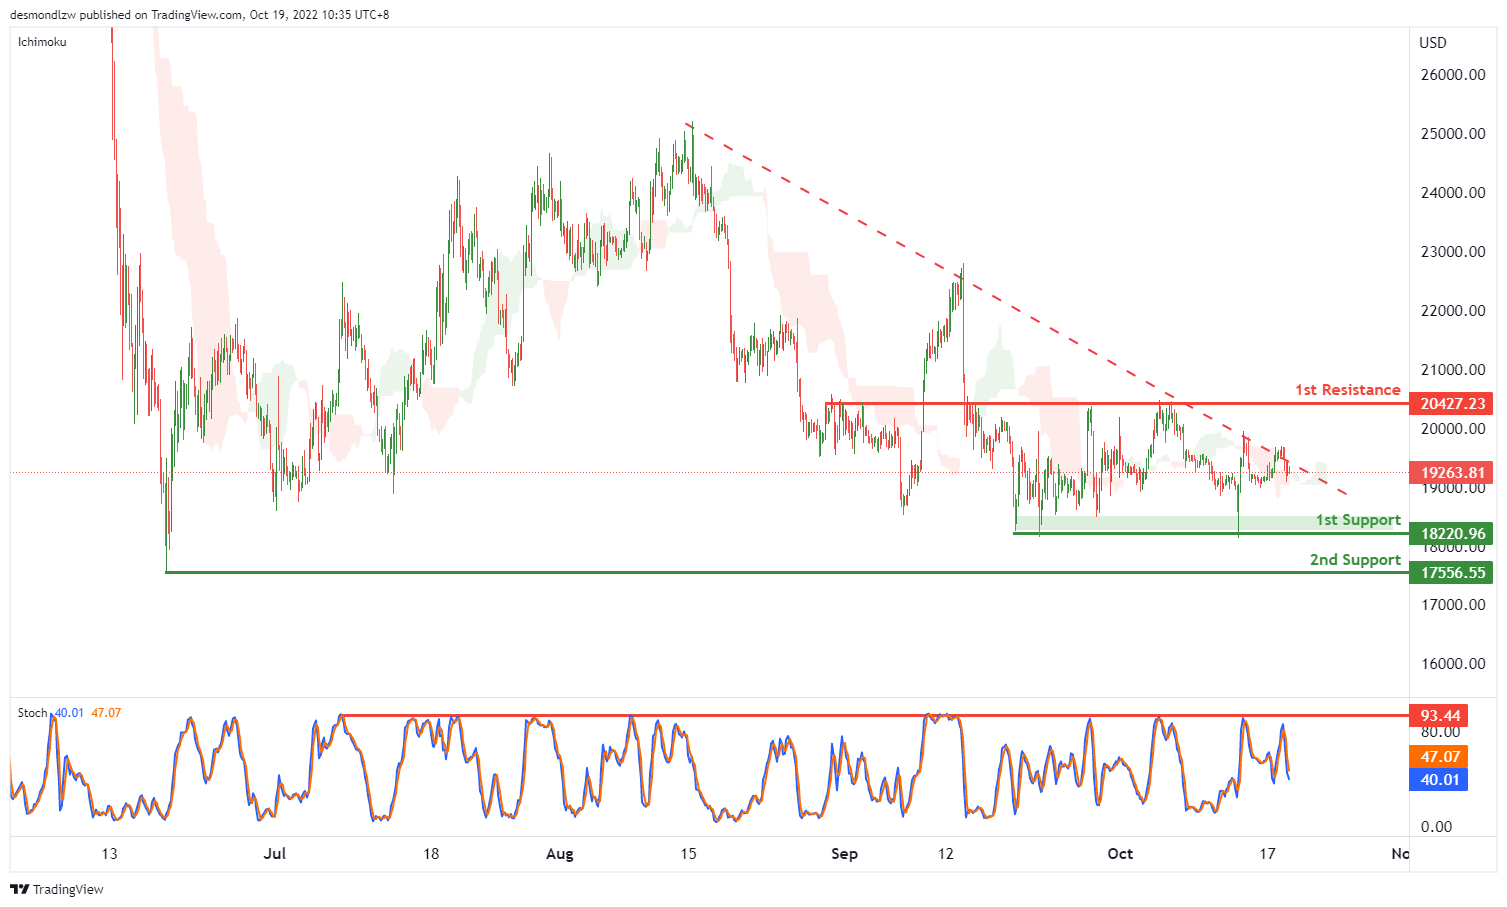
On the H4, price is crossing ichimoku cloud, and Stoch is dropping from the resistance, we have a bearish bias that the price may drop to the 1st support at 18220.96, which is in line with the previous swing lows and if the 1st support is broken, the 2nd support is at 17556.55, where the previous swing low is. Alternatively, the price may rise to the 1st resistance at 20427.23, where the overlap resistance and 50% fibonacci retracement are.
Areas of consideration:
- H4 time frame, current price
- H4 time frame, 1st support at 18220.96
S&P 500:
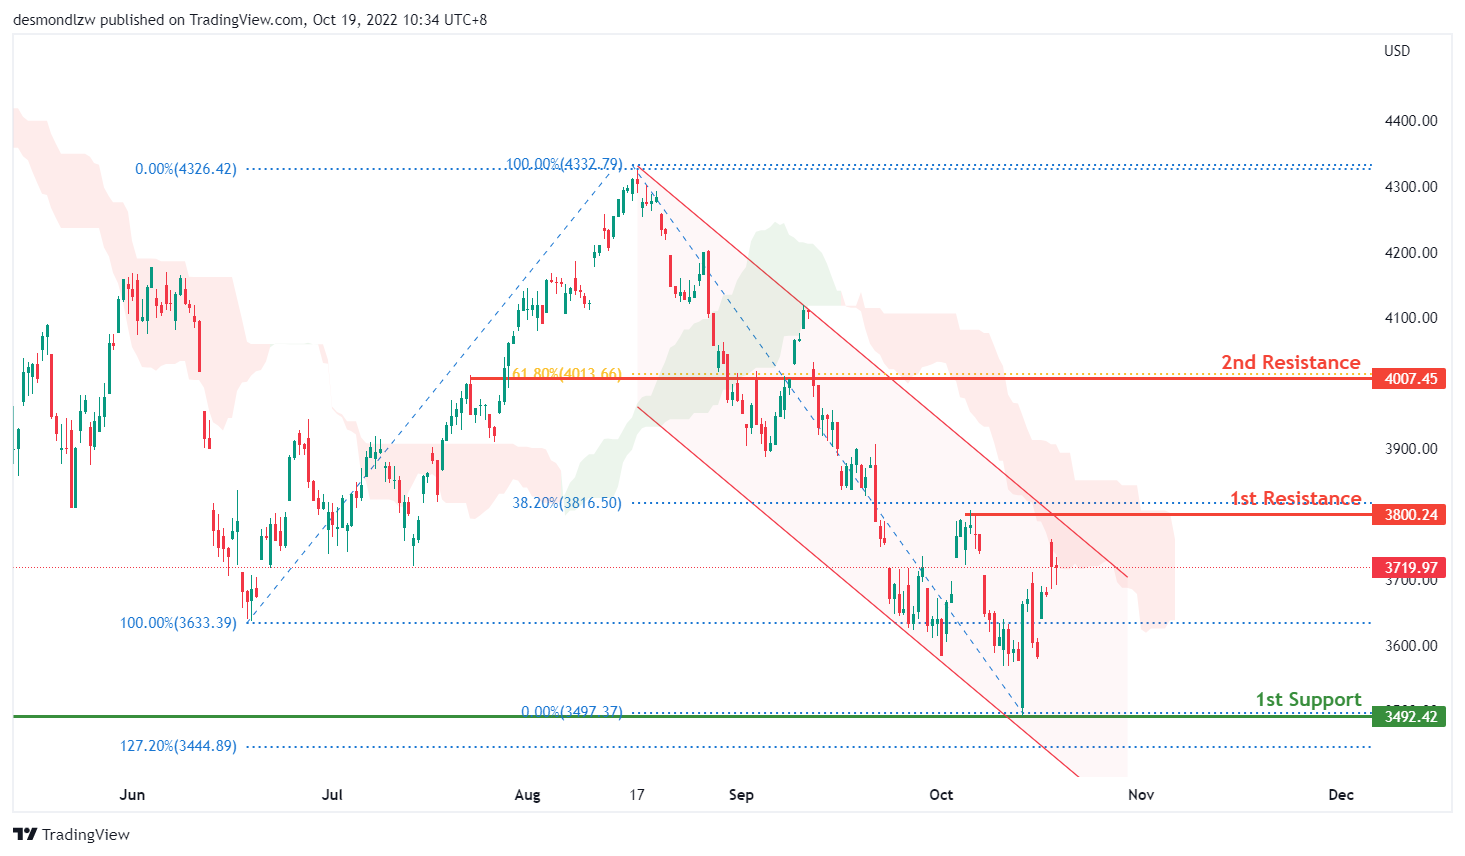
Based on the H4 chart, the S&P500 is still within the bearish channel and approaching the 1st resistance of 3800, which is in line with the 38.2% fibonacci retracement level and previous swing high. However, we have a short term bullish bias that price could break above the resistance level, and climb higher towards the 2nd resistance of 4007 which is in line with the 61.8% fibonacci retracement level.
Areas of consideration:
- H4 time frame, 1st support at 3492.42
- H4 time frame, 1st resistance at 3800
- H4 time frame, 2nd resistance at 4007.45
USD/JPY Daily Outlook
Daily Pivots: (S1) 148.80; (P) 149.09; (R1) 149.52; More...
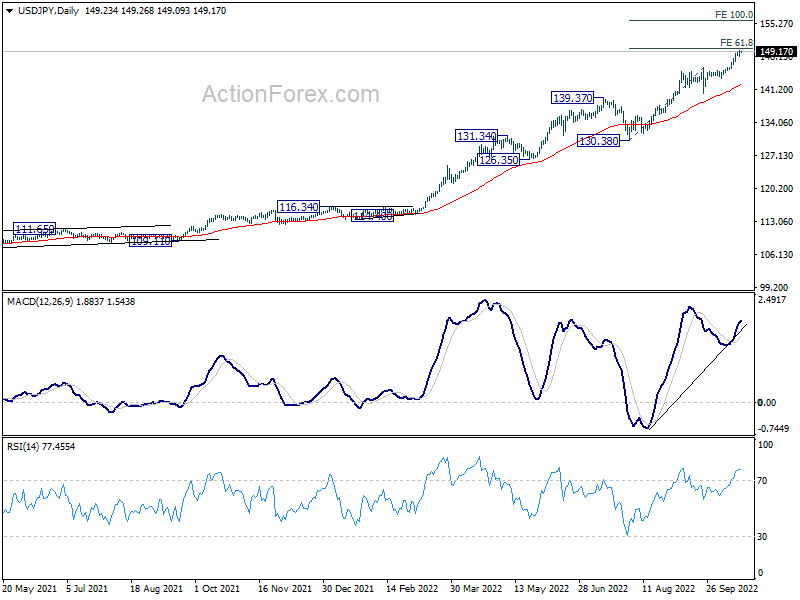
There is no clear sign of topping in USD/JPY yet even though it continues to lose upside moment. Further rise is in favor to 61.8% projection of 130.38 to 140.33 from 145.89 at 149.91. Yet, beware that Japan might intervene again to defend 150 psychological level. On the downside, break of 146.43 minor support will indicate short term topping and bring deeper pull back.
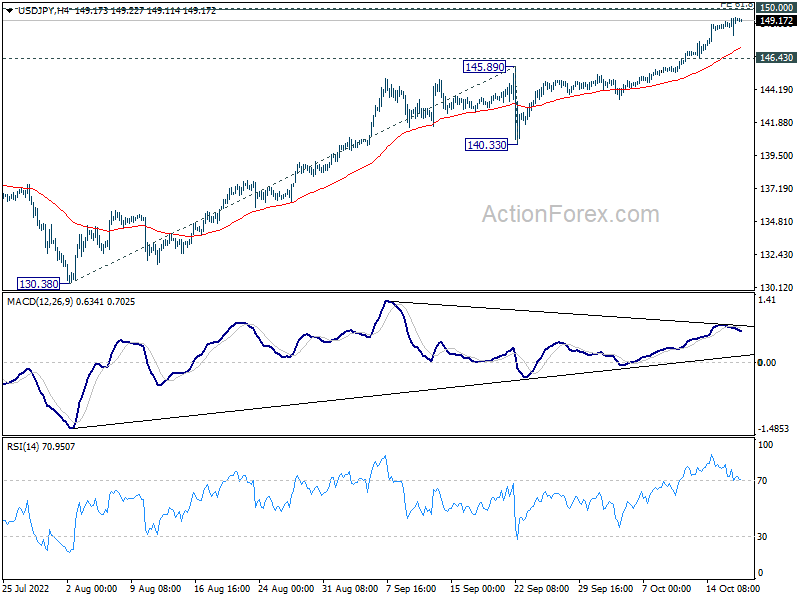
In the bigger picture, up trend from 101.18 is still in progress, as part of the whole up trend from 75.56 (2011 low). 147.68 (1998 high) was already met and there is not clearly sign of topping yet. In any case, break of 139.37 resistance turned support is needed to be the first sign of medium term topping. Otherwise, further rise is in favor to next target at 160.16 (1990 high).
Yen Selloff Slowing Slightly after Intervention
Yen remains the worst performer for the week but selling appears to have slowed after Japan's intervention yesterday. Dollar is following as next weakest, as risk sentiment stabilized. Also, Dollar bulls are clearly on guard against sudden volatility in Yen. Australian Dollar is the strongest one together with New Zealander. European majors are mixed, with Sterling with a slight upper hand against Euro and Swiss Franc.
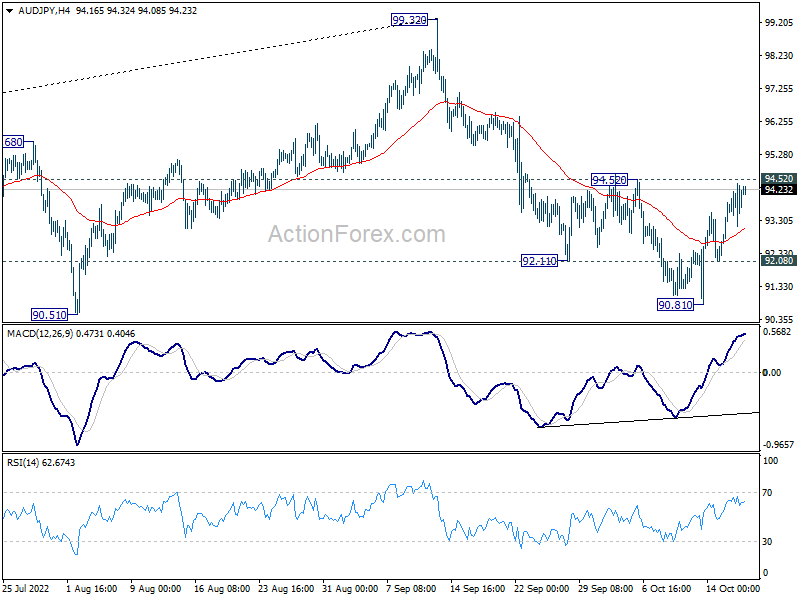
Technically, Aussie's rise this week is seen generally as a corrective move, which might not extend much further. To be more specific, AUD/USD is held below 0.6362 minor resistance while EUR/AUD is staying above 1.5429 minor support. Even against the weak Yen, AUD/JPY's recovery is capped by 94.52 resistance, keeping near term outlook bearish. Break of 92.08 minor support in AUD/JPY will argue that fall from 99.32 is ready to resume through 90.81 low. But of course, break of the mentioned levels will indicate that Aussie's rebound is gaining momentum finally.
In Asia, at the time of writing, Nikkei is up 0.73%. Hong Kong HSI is down -0.96%. China Shanghai SSE is down -0.40%. Singapore Strait Times is up 0.32%. Japan 10-year JGB yield is down -0.0021 at 0.257. Overnight, DOW rose 1.12%. S&P 500 rose 1.14%. NASDAQ rose 0.90%. 10-year yield dropped -0.017 to 3.998.
Fed Kashkari: I don't see how we can stop if underlying inflation doesn't flatten out
Minneapolis Fed President Neel Kashkari said yesterday, "I've said publicly that I could easily see us getting into the mid-4%s early next year."
"But if we don't see progress in underlying inflation or core inflation, I don't see why I would advocate stopping at 4.5%, or 4.75% or something like that," he added. "We need to see actual progress in core inflation and services inflation and we are not seeing it yet."
"That number that I offered is predicated on a flattening out of that underlying inflation," Kashkari said. "If that doesn't happen, then I don't see how we can stop."
BoJ Kuroda: Recent depreciation of Yen was sharp and one-sided
BoJ Governor Haruhiko Kuroda told a parliamentary committee that recent depreciation of Yen was sharp and one-sided "This kind of yen weakening makes it difficult for companies to set their business plans and raises uncertainties in their outlook," he said. "This is negative for our economy and not desirable."
Separately, board member Seiji Adachi said, "When looking at the global financial and economic environment surrounding Japan, downside risks are building up rapidly... When downside risks are so high, we should be cautious of shifting toward monetary tightening."
Australia Westpac leading index points to material loss in momentum heading into 2023
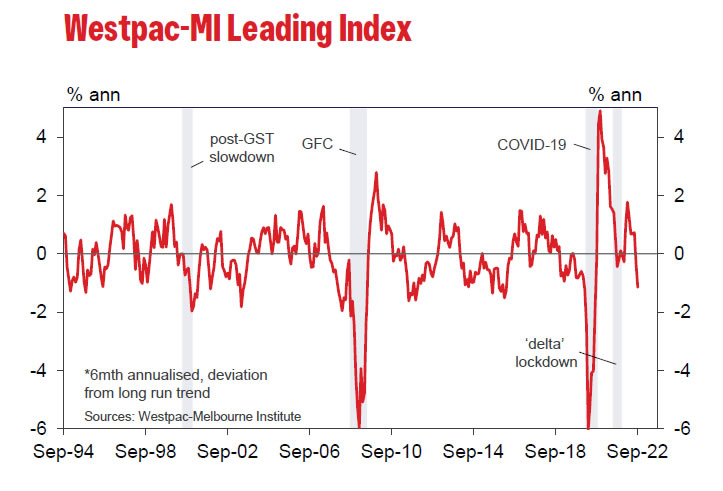
Australia Westpac leading index six-month annualized growth rate declined from -0.33% to -1.15% in September. It's now at the weakest level since the pandemic first hit in 2020, and prior to that, since early 2016. The index continued to point to a "material loss in momentum to a below-trend growth pace heading into 2023."
Westpac added that the signal in broadly in line with forecast that economic growth will slow from 3.4% in 2022 to 1.0% in 2023, with sharp slowdown in consumer spending. It said, "that slowdown is likely to intensify through 2023 as rising interest rates and a softening labour market take their toll."
On RBA policy, Westpac pointed to minutes of October meeting, which noted, "drawing out policy adjustments would also help to keep public attention focused for a longer period on the Board's resolve to return inflation to target." The thinking was in line with Westpac's forecast that RBA will have a series of 25bps rate hikes in the future months of November, December, February, and March.
Looking ahead
UK CPI and PPI are the main feature in European session. Eurozone will also release CPI final. Later in the day, Canada CPI will take center stage with RMPI and IPPI. US will release building permits and housing starts, as well as Fed's Beige Book report.
USD/JPY Daily Outlook
Daily Pivots: (S1) 148.80; (P) 149.09; (R1) 149.52; More...
There is no clear sign of topping in USD/JPY yet even though it continues to lose upside moment. Further rise is in favor to 61.8% projection of 130.38 to 140.33 from 145.89 at 149.91. Yet, beware that Japan might intervene again to defend 150 psychological level. On the downside, break of 146.43 minor support will indicate short term topping and bring deeper pull back.
In the bigger picture, up trend from 101.18 is still in progress, as part of the whole up trend from 75.56 (2011 low). 147.68 (1998 high) was already met and there is not clearly sign of topping yet. In any case, break of 139.37 resistance turned support is needed to be the first sign of medium term topping. Otherwise, further rise is in favor to next target at 160.16 (1990 high).
Economic Indicators Update
| GMT | Ccy | Events | Actual | Forecast | Previous | Revised |
|---|---|---|---|---|---|---|
| 23:30 | AUD | Westpac Leading Index M/M Sep | 0.00% | -0.10% | -0.20% | |
| 06:00 | GBP | CPI M/M Sep | 0.40% | 0.50% | ||
| 06:00 | GBP | CPI Y/Y Sep | 10.00% | 9.90% | ||
| 06:00 | GBP | Core CPI Y/Y Sep | 6.40% | 6.30% | ||
| 06:00 | GBP | RPI M/M Sep | 0.50% | 0.60% | ||
| 06:00 | GBP | RPI Y/Y Sep | 12.40% | 12.30% | ||
| 06:00 | GBP | PPI Input M/M Sep | 1.10% | -1.20% | ||
| 06:00 | GBP | PPI Input Y/Y Sep | 17.20% | 20.50% | ||
| 06:00 | GBP | PPI Output M/M Sep | 0.60% | -0.10% | ||
| 06:00 | GBP | PPI Output Y/Y Sep | 15.00% | 16.10% | ||
| 06:00 | GBP | PPI Core Output M/M Sep | 0.90% | 0.30% | ||
| 06:00 | GBP | PPI Core Output Y/Y Sep | 12.70% | 13.70% | ||
| 09:00 | EUR | Eurozone CPI M/M Sep F | 10.00% | 10.00% | ||
| 09:00 | EUR | Eurozone CPI Core Y/Y Sep F | 4.80% | 4.80% | ||
| 12:30 | USD | Building Permits Sep | 1.55M | 1.54M | ||
| 12:30 | USD | Housing Starts Sep | 1.46M | 1.58M | ||
| 12:30 | CAD | Raw Material Price Index Sep | -3.50% | -4.20% | ||
| 12:30 | CAD | Industrial Product Price M/M Sep | -0.90% | -1.20% | ||
| 12:30 | CAD | CPI M/M Sep | -0.10% | -0.30% | ||
| 12:30 | CAD | CPI Y/Y Sep | 6.80% | 7.00% | ||
| 12:30 | CAD | CPI Median Y/Y Sep | 4.80% | 4.80% | ||
| 12:30 | CAD | CPI Trimmed Y/Y Sep | 5.10% | 5.20% | ||
| 12:30 | CAD | CPI Common Y/Y Sep | 5.60% | 5.70% | ||
| 14:30 | USD | Crude Oil Inventories | 2.5M | 9.9M | ||
| 18:00 | USD | Fed's Beige Book |
Australia Westpac leading index points to material loss in momentum heading into 2023
Australia Westpac leading index six-month annualized growth rate declined from -0.33% to -1.15% in September. It's now at the weakest level since the pandemic first hit in 2020, and prior to that, since early 2016. The index continued to point to a "material loss in momentum to a below-trend growth pace heading into 2023."
Westpac added that the signal in broadly in line with forecast that economic growth will slow from 3.4% in 2022 to 1.0% in 2023, with sharp slowdown in consumer spending. It said, "that slowdown is likely to intensify through 2023 as rising interest rates and a softening labour market take their toll."
On RBA policy, Westpac pointed to minutes of October meeting, which noted, "drawing out policy adjustments would also help to keep public attention focused for a longer period on the Board's resolve to return inflation to target." The thinking was in line with Westpac's forecast that RBA will have a series of 25bps rate hikes in the future months of November, December, February, and March.
BoJ Kuroda: Recent depreciation of Yen was sharp and one-sided
BoJ Governor Haruhiko Kuroda told a parliamentary committee that recent depreciation of Yen was sharp and one-sided "This kind of yen weakening makes it difficult for companies to set their business plans and raises uncertainties in their outlook," he said. "This is negative for our economy and not desirable."
Separately, board member Seiji Adachi said, "When looking at the global financial and economic environment surrounding Japan, downside risks are building up rapidly... When downside risks are so high, we should be cautious of shifting toward monetary tightening."