Sample Category Title
UK’s Inflation Sluggish Slowdown
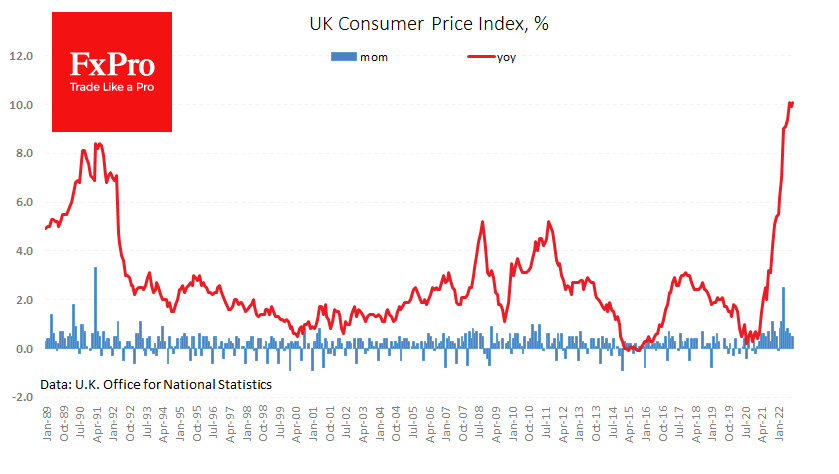
The portion of the UK inflation data showed that the problem is in no hurry to recede. The consumer price index returned to 10.1% y/y, changing hopes that the trend had already reversed. The retail price index is climbing further upwards, reaching 12.6%. The contribution of food to inflation has already exceeded the impact of transport costs.
Excluding these volatile components, the acceleration continues, with the core CPI rising to 6.5% compared to 6.3% the previous month. UK’s Retail Price Index at 12.6% y/y was last seen in March 1981. However, producer prices signal an easing of inflationary pressures, albeit not as quickly as previously hoped.
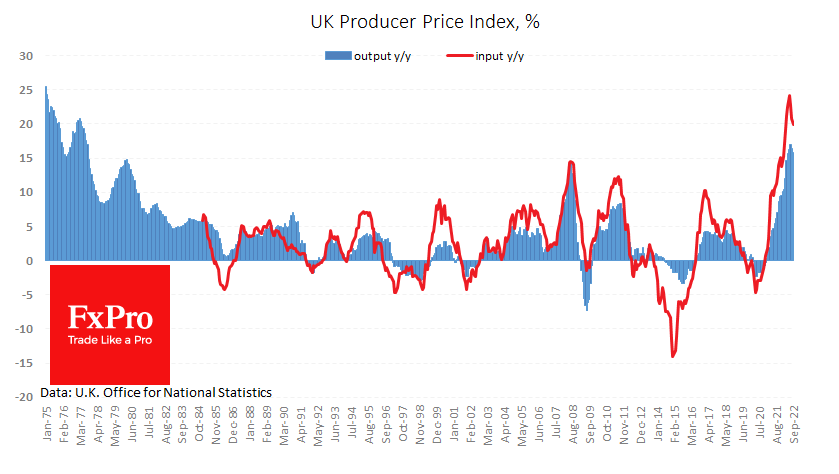
Input PPI has slowed to 20% from 20.9% a month earlier and peaked at 24.2% in June. Output PPI inflation slowed to 15.9% after peaking at 17% in July. The persistent downward trend in exchange prices for agricultural and energy products has reinforced disinflationary trends all these months.
The higher inflation trajectory is creating pressure on the Bank of England to take even more steps to raise rates. The Bank of England’s recent statements about its willingness to move to quantitative tightening from November and its reluctance to stretch out its emergency government bond-buying programme show that the central bank is indeed concerned about inflationary pressures.
Pound Falls as Inflation Rises
GBP/USD is in negative territory today. In the European session, the pound is trading at 1.1261, down 0.48%.
Inflation rises to double-digits
UK inflation rose to 10.1% in September, up from 9.9% in August and above the consensus of 10.0%. It was a similar story from Core CPI, which edged up to 6.5%, up from 6.4% and higher than the forecast of 6.3%. A return to double-digit inflation is certainly not something the Bank of England wanted to see. Inflation is not showing any signs of peaking, which leaves no doubt that the BoE will have to continue to raise interest rates.
The cash rate remains relatively low at 2.25% in comparison with the Federal Reserve (3.25%) and other major central banks. The cash rate will likely hit 4% or even higher by mid-2023, which means some oversize rate hikes are on the way. The BoE meets next on November 3rd and policy makers will need to deliver a hike of 0.75% or a full point in order to maintain credibility. The recent political maelstrom, in which Chancellor Hunt has abolished most of the planned tax cuts and signalled spending cuts instead, means that the BoE may not have to act as aggressively as anticipated just a few weeks ago.
A key point in the fiscal U-turn provided by Hunt is the energy cap plan. The cap, which was supposed to remain in place for two years, has been scaled down to just six months. Higher energy bills for households will mean higher inflation unless energy falls substantially in the winter.
The economic outlook for the UK does not look all that bright, which will likely be reflected in a weaker British pound. Goldman Sachs has downgraded its UK growth outlook, with the economy expected to decline by 1% in 2023, worse than the previous estimate of -0.4%.
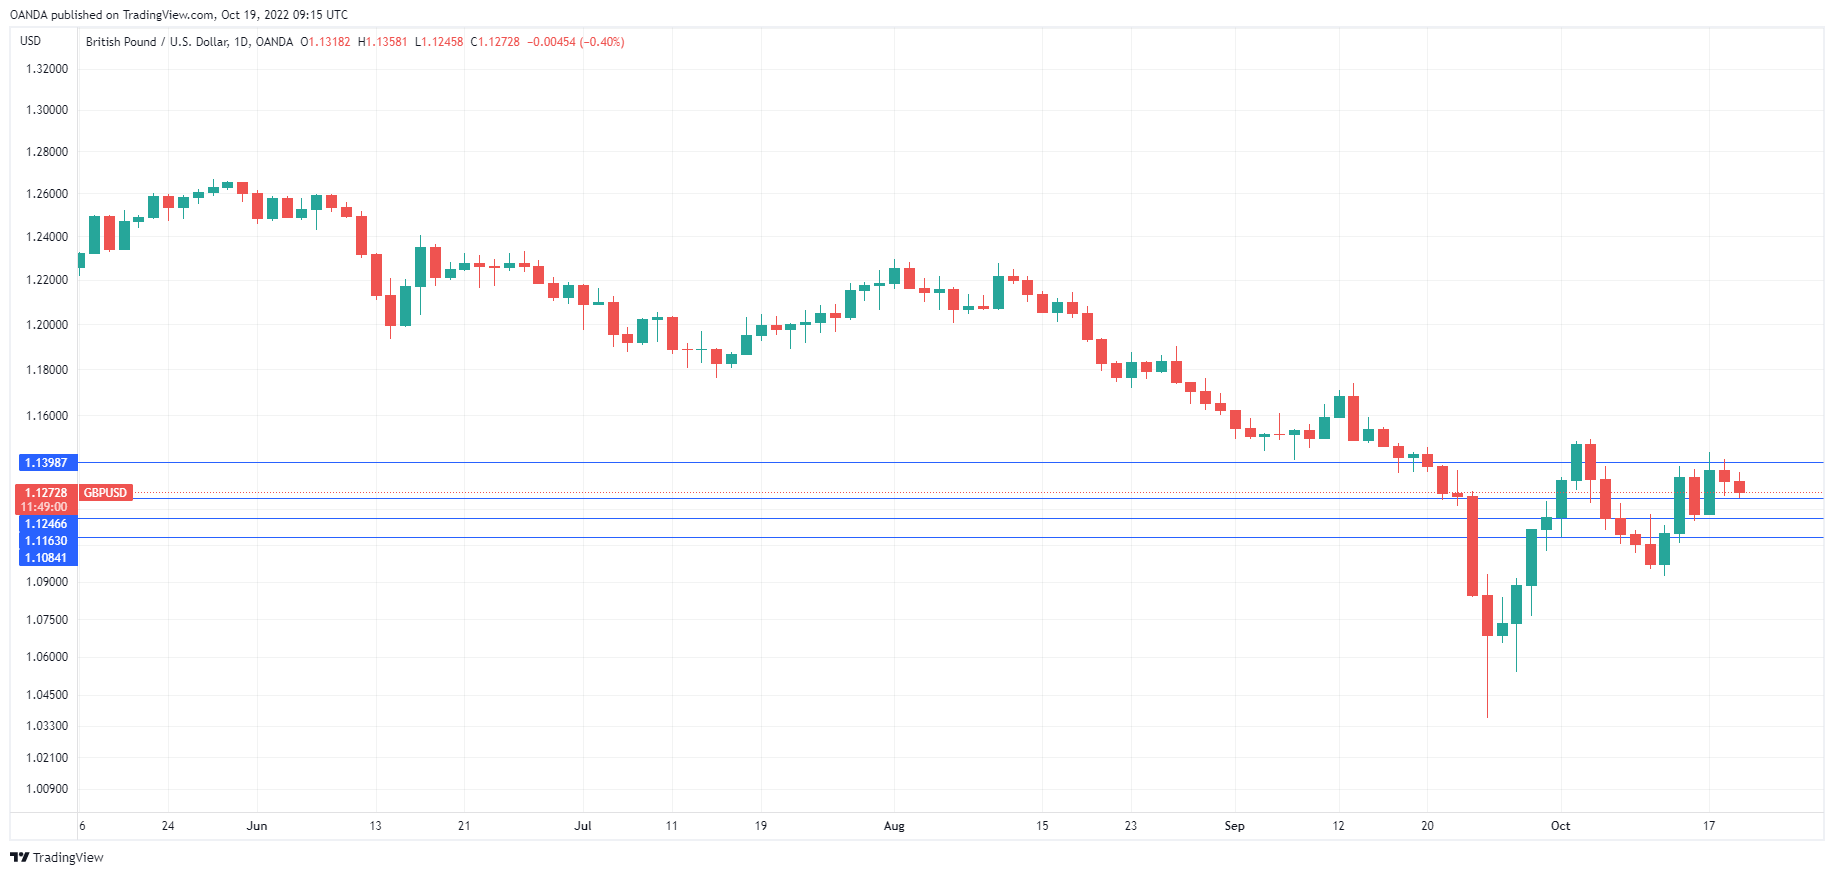
GBP/USD Technical
- GBP/USD faces resistance at 1.1373 and 1.1455
- There is support at 1.1214 and 1.1085
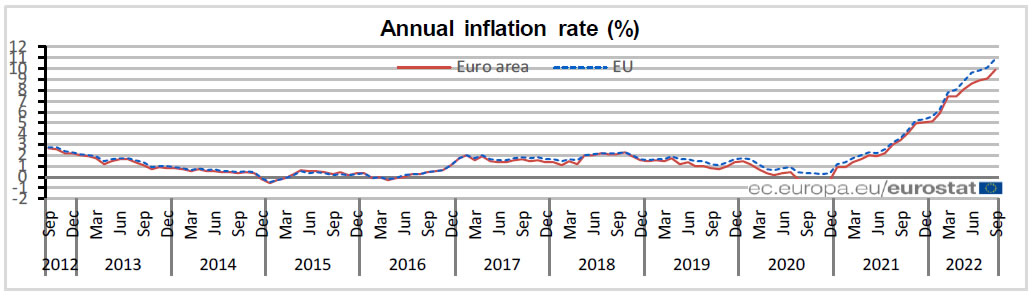
Eurozone CPI finalized at 9.9% yoy in Sep, core at 4.8% yoy
Eurozone CPI was finalized at 9.9% yoy in September, up from August's 9.1% yoy, but revised down from flash reading of 10.0% yoy. CPI core (all items excluding energy, food, alcohol & tobacco) was finalized at 4.8% yoy, up from August's 4.3% yoy
The highest contribution to the annual Eurozone inflation rate came from energy (+4.19%), followed by food, alcohol & tobacco (+2.47%), services (+1.80%) and non-energy industrial goods (+1.47%).
EU CPI was finalized at 10.9% yoy, up from August's 10.1% yoy. The lowest annual rates were registered in France (6.2%), Malta (7.4%) and Finland (8.4%). The highest annual rates were recorded in Estonia (24.1%), Lithuania (22.5%) and Latvia (22.0%). Compared with August, annual inflation fell in six Member States, remained stable in one and rose in twenty.
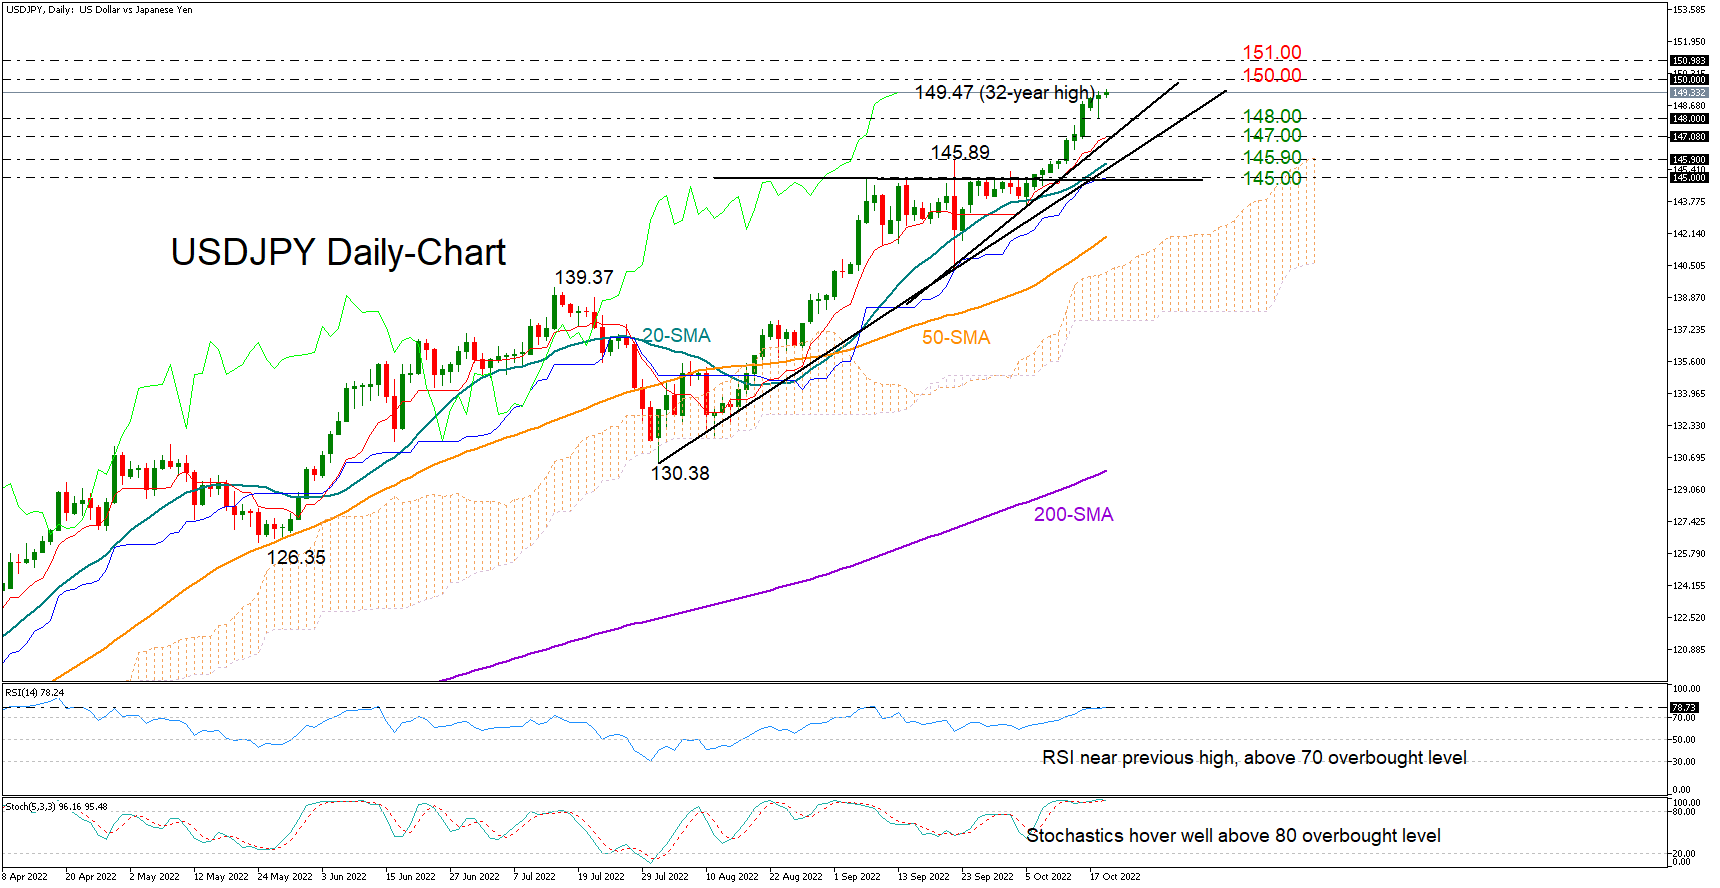
USDJPY Aims for 150; Overbought Signals Strong
USDJPY has trimmed its bullish momentum since the spike above the 1998 top of 147.71, gradually moving northwards within the 149.00 area – the highest since 1990.
The pair is in its tenth week of gains well above the Ichimoku cloud, increasing speculation that the bull run is probably nearing a peak. The RSI is flirting with its previous high in the overbought area, while the stochastics are also comfortably above their 80 overbought level, backing that narrative too.
If the 150.00 psychological mark proves easy to break, the pair could chart a new higher high within the 151.00 – 152.00 territory last seen in August 1990. Should the bulls persist, the next obstacle could pop up around 153.30.
In the event upside pressures falter, with the price pulling below 148.00, the focus will immediately return to the tentative ascending trendline currently around 147.00. A step lower could meet the 20-day simple moving average (SMA) and a longer-term tentative ascending trendline near 145.90. Yet, traders may pay greater attention to the 145.00 region for any aggressive declines that may press the price towards the 50-day SMA.
All in all, USDJPY is looking cautiously bullish in the short-term picture as the technical picture signals overbought conditions. A close above 150.00 could see another extension higher, whilst a move below 148.00 could activate profit-taking orders.
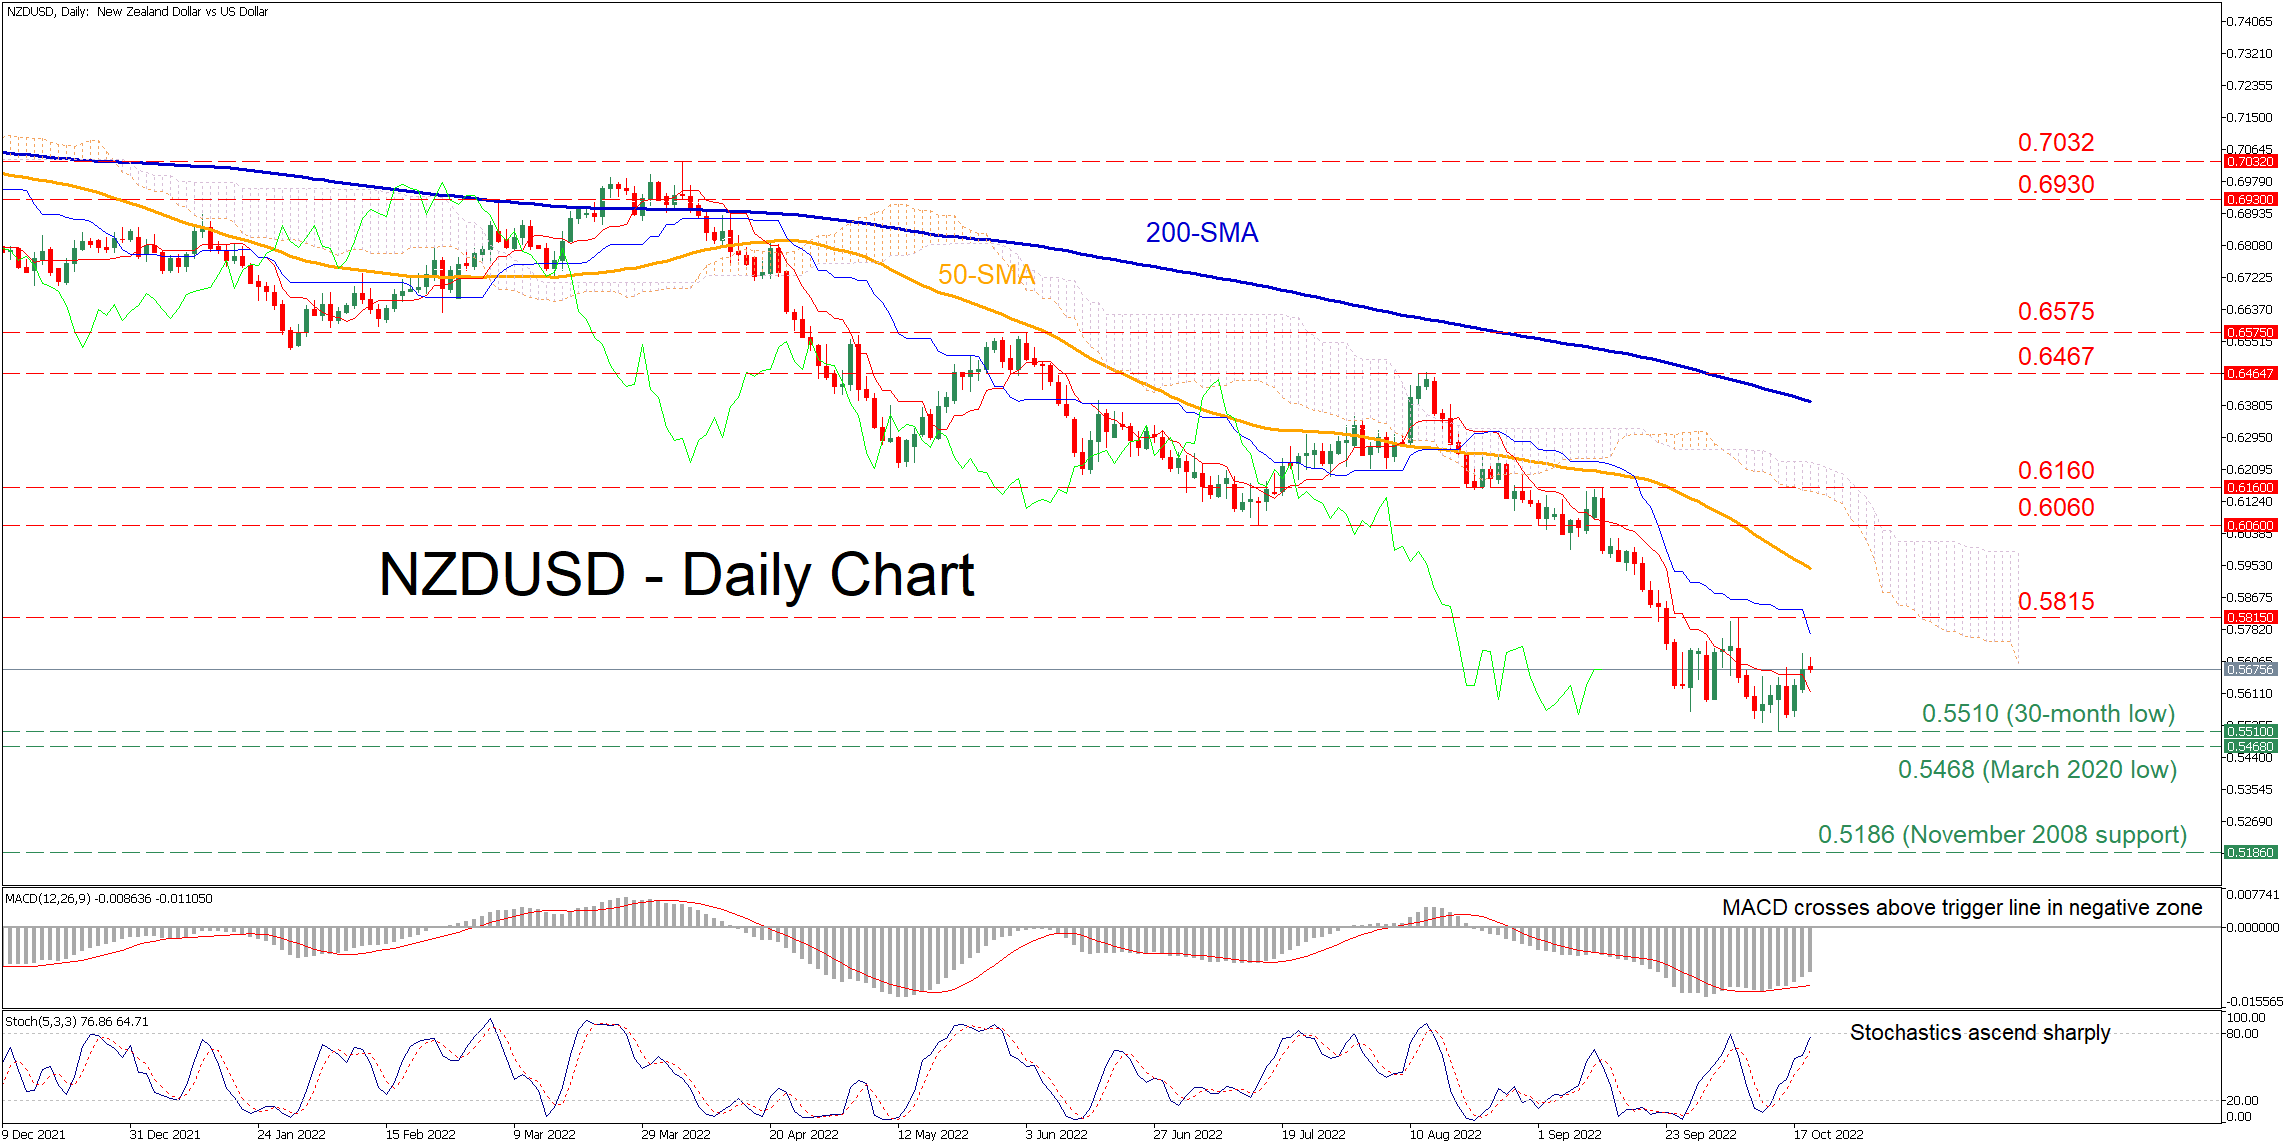
NZDUSD Rangebound after Bouncing Off 30-Month Low
NZDUSD has been trending lower since March, generating a profound structure of lower highs and lower lows. Nevertheless, the pair has been trading sideways in the last few daily sessions, attempting a minor recovery after hitting a 30-month low of 0.5510.
The momentum indicators are endorsing a cautiously positive near-term tone. Specifically, the MACD histogram has jumped above its red signal line but remains in the negative territory, while the stochastic oscillator is ascending sharply towards its 80-overbought region.
To the upside, bullish actions could send the price to test the recent resistance region of 0.5815. Piercing through this barrier, the pair might ascend towards the July low of 0.6060, which could now act as resistance. A break above the latter may turn the spotlight to 0.6160 before the August high of 0.6467 comes under examination.
Alternatively, should selling pressures intensify, the price could encounter initial support at the 30-month low of 0.5510. Sliding beneath that floor, the bears could target the March 2020 bottom of 0.5468. If that floor collapses, the pair will dive towards levels not seen in the past 13 years, where the November 2008 support of 0.5186 might provide downside protection.
Overall, even though the market is pushing for some recovery, it seems that NZDUSD lacks the necessary momentum to alter its short-term picture back to positive. For the latter to be accomplished, a close above the 0.5815 ceiling is initially required.
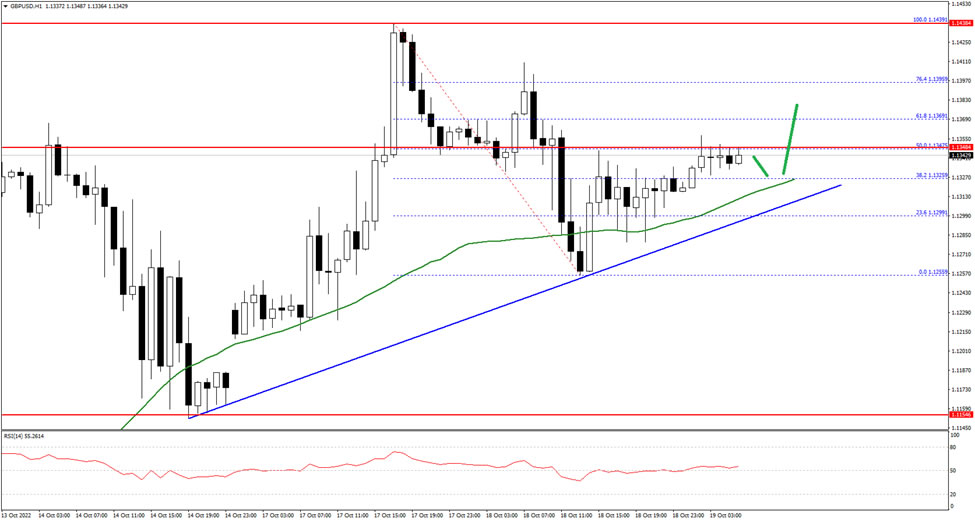
GBP/USD Pair is Consolidating Near 1.1340
The British Pound started a fresh decline from the 1.1440 resistance zone against the US Dollar. The GBP/USD pair declined below the 1.1300 support.
It traded as low as 1.1255 and is currently rising. There was a move above the 1.1300 level and the pair settled above the 50 hourly simple moving average. It is now consolidating near the 1.1340 level, with an immediate resistance at 1.1350 on FXOpen.
If there is a clear upside break above the 1.1350 resistance, the pair could rise steadily towards the 1.1400 level in the near term. The next major resistance sits near the 1.1450 level.
On the downside, the first major support is near the 1.1310 level. The main support is forming near the 1.1300 level and a connecting bullish trend line on the hourly chart. A break below the 1.1300 support could even push the pair below the 1.1250 support.
FTSE 100 Tests Resistance
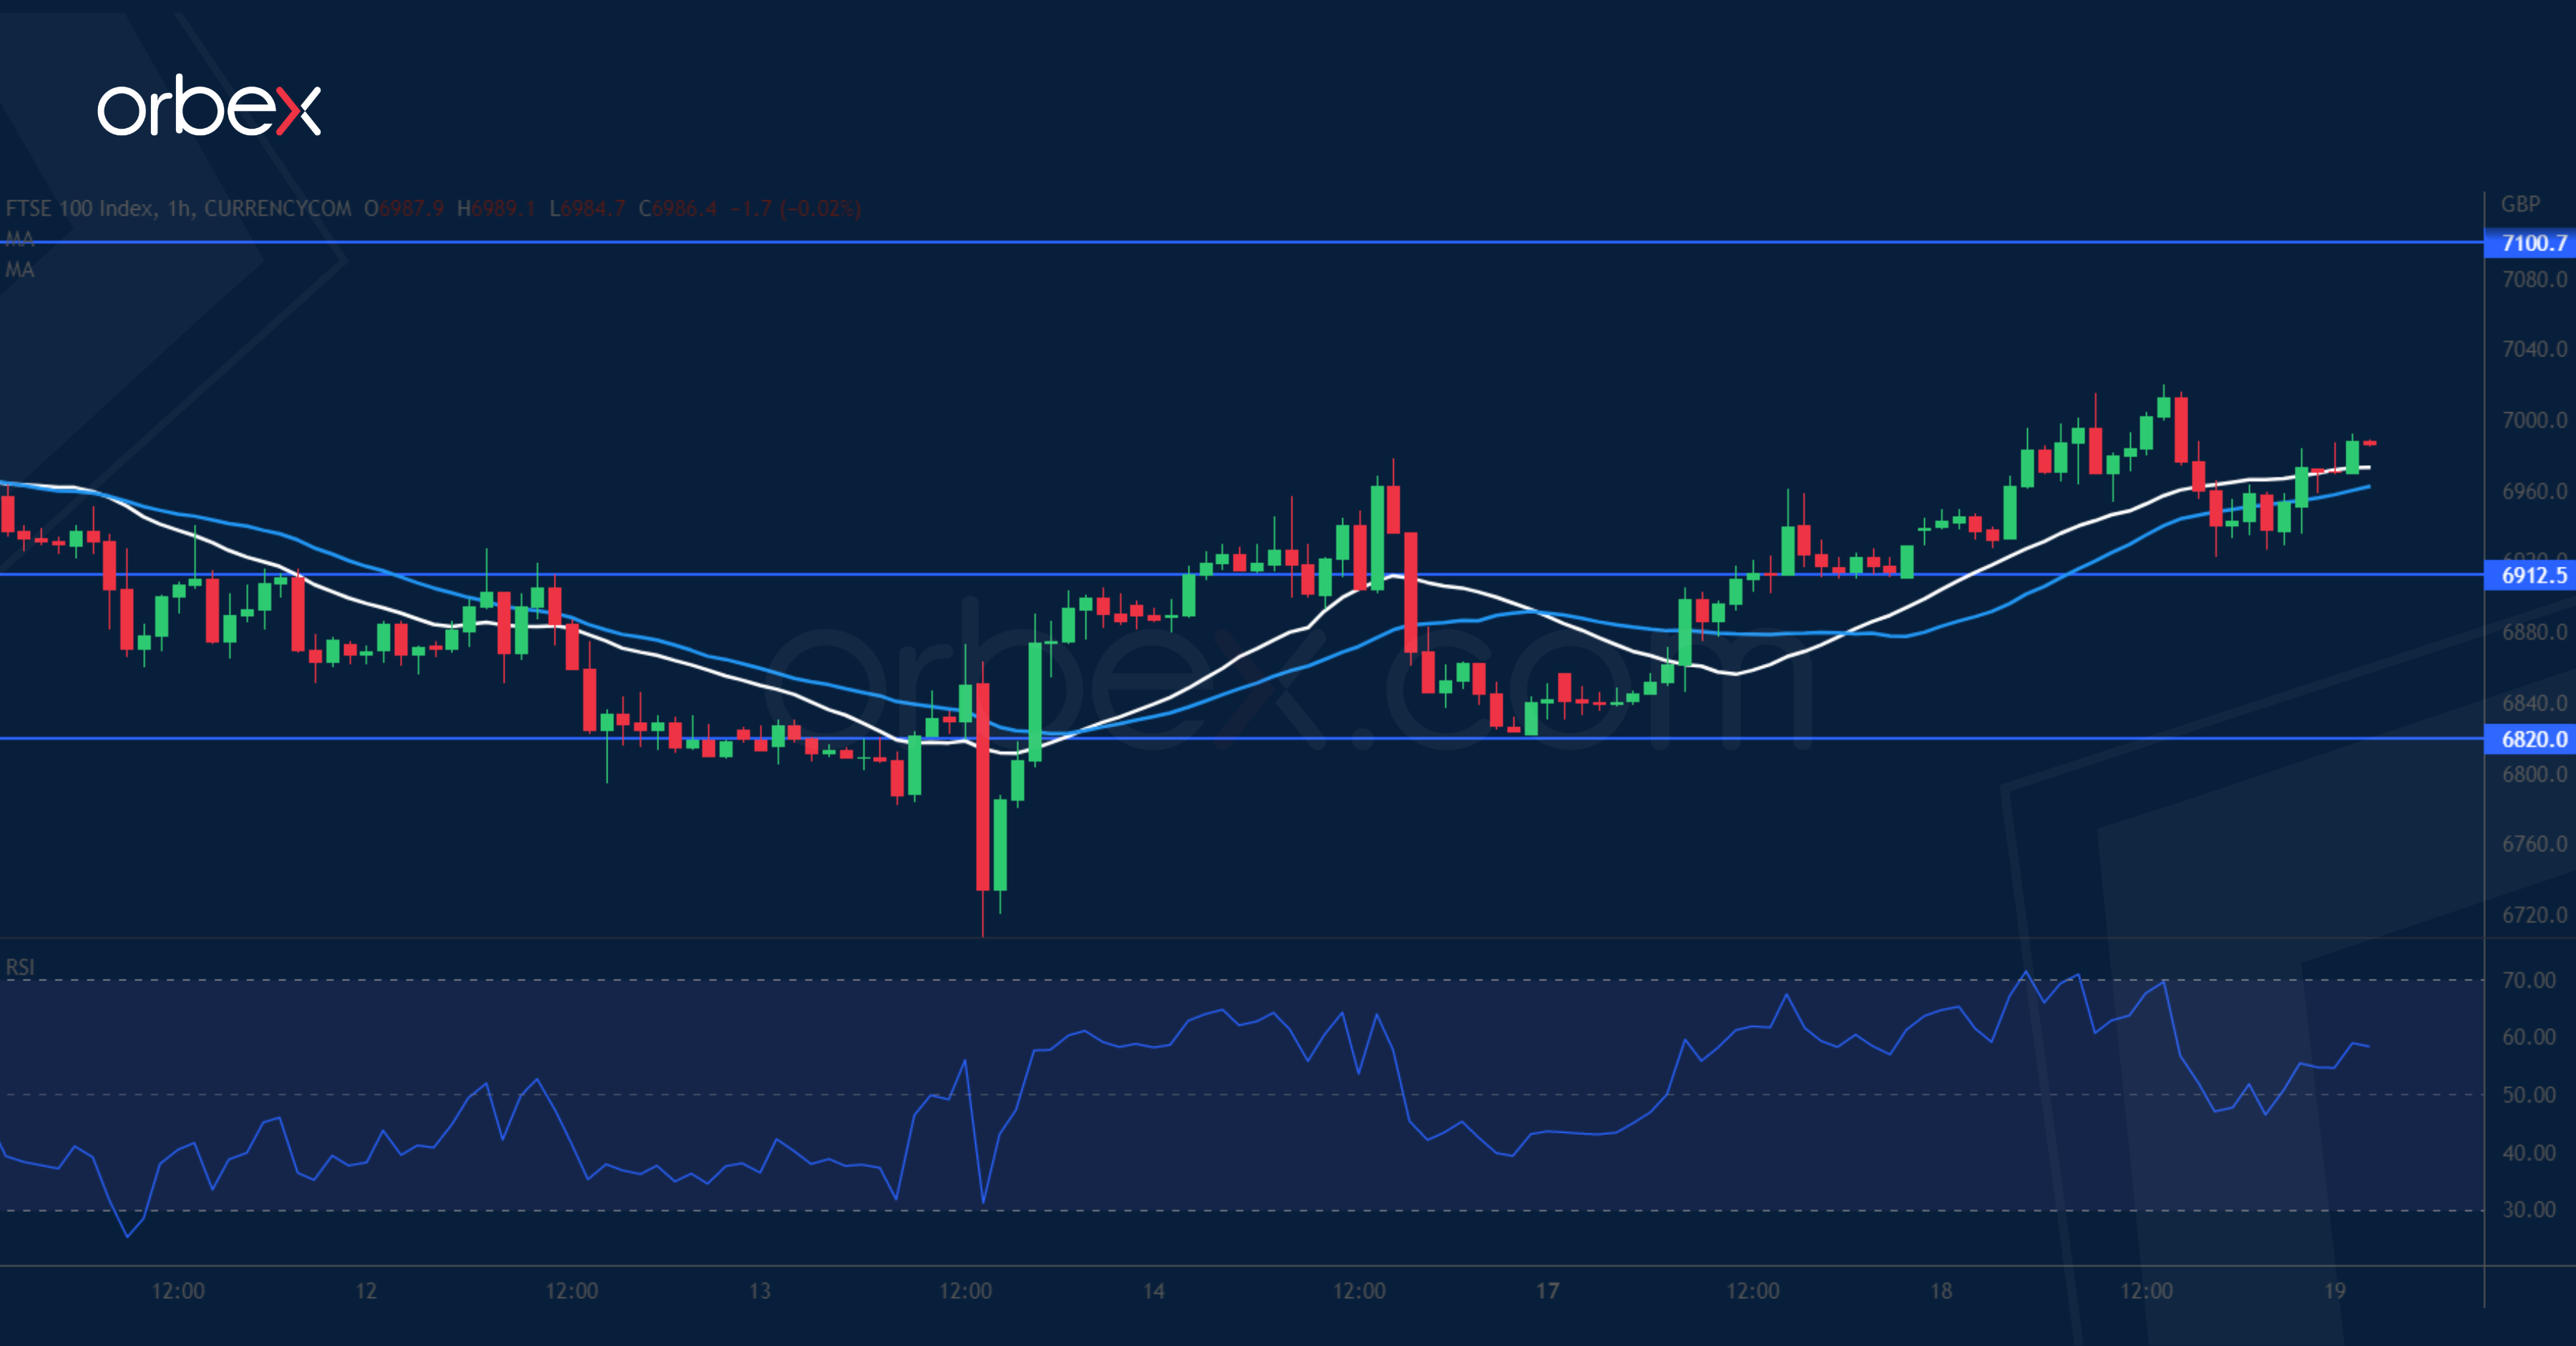
The FTSE 100 inches higher on improved risk sentiment. A break above 6900 prompted some short interests to cover, easing the downward pressure. A series of higher lows would further boost buyers’ confidence and send the index to the daily resistance at 7100 where a breakout could extend the recovery towards 7300. In the meantime, an overbought RSI may cause a limited pullback with 6912 as the closest support. Further down, 6820 is the bulls’ second line of defence to keep the price action afloat.
XAU/USD Seeks Support
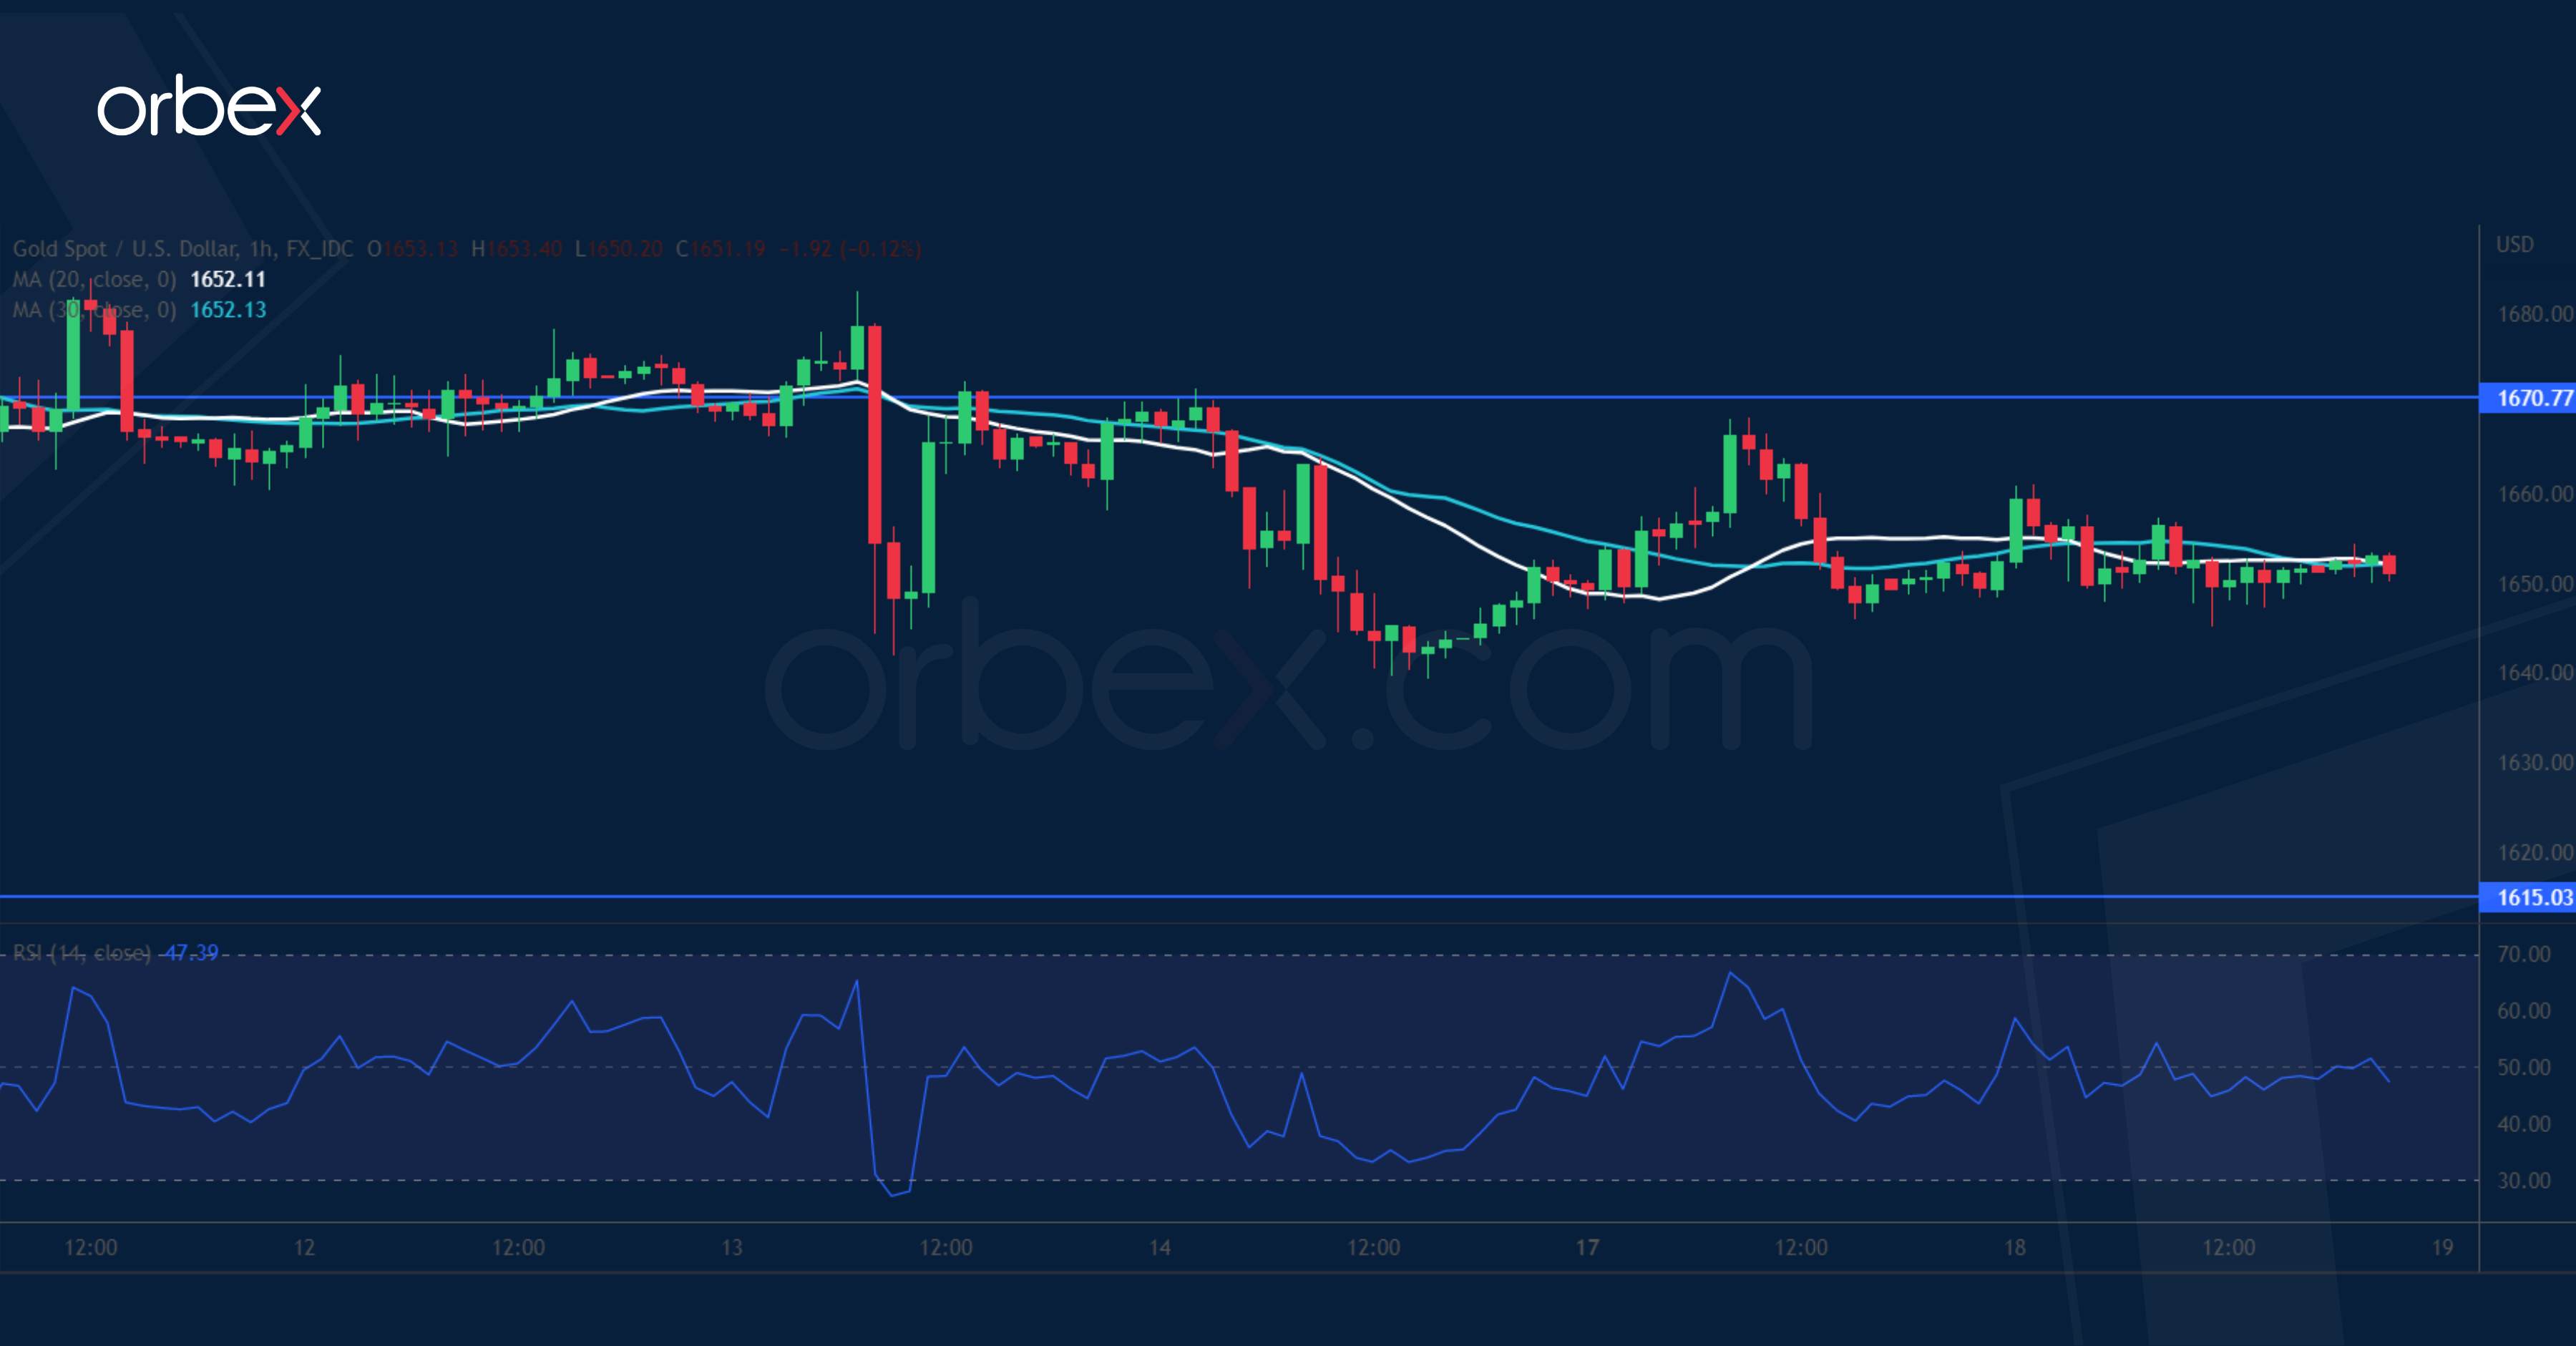
Bullions steadies as the US dollar softens across the board. After meeting stiff selling pressure in the supply zone (1730), the precious metal has been struggling to hold onto its recent gains. The trend remains bearish and may bring in more followers to depress the price action. 1615 is a critical level to keep the rebound relevant and its breach would trigger a new round of sell-off to April 2020’s low at 1570. The support-turned-resistance 1670 is the first level to crack then the real challenge would be to lift 1730.
USD/CHF Takes Breather
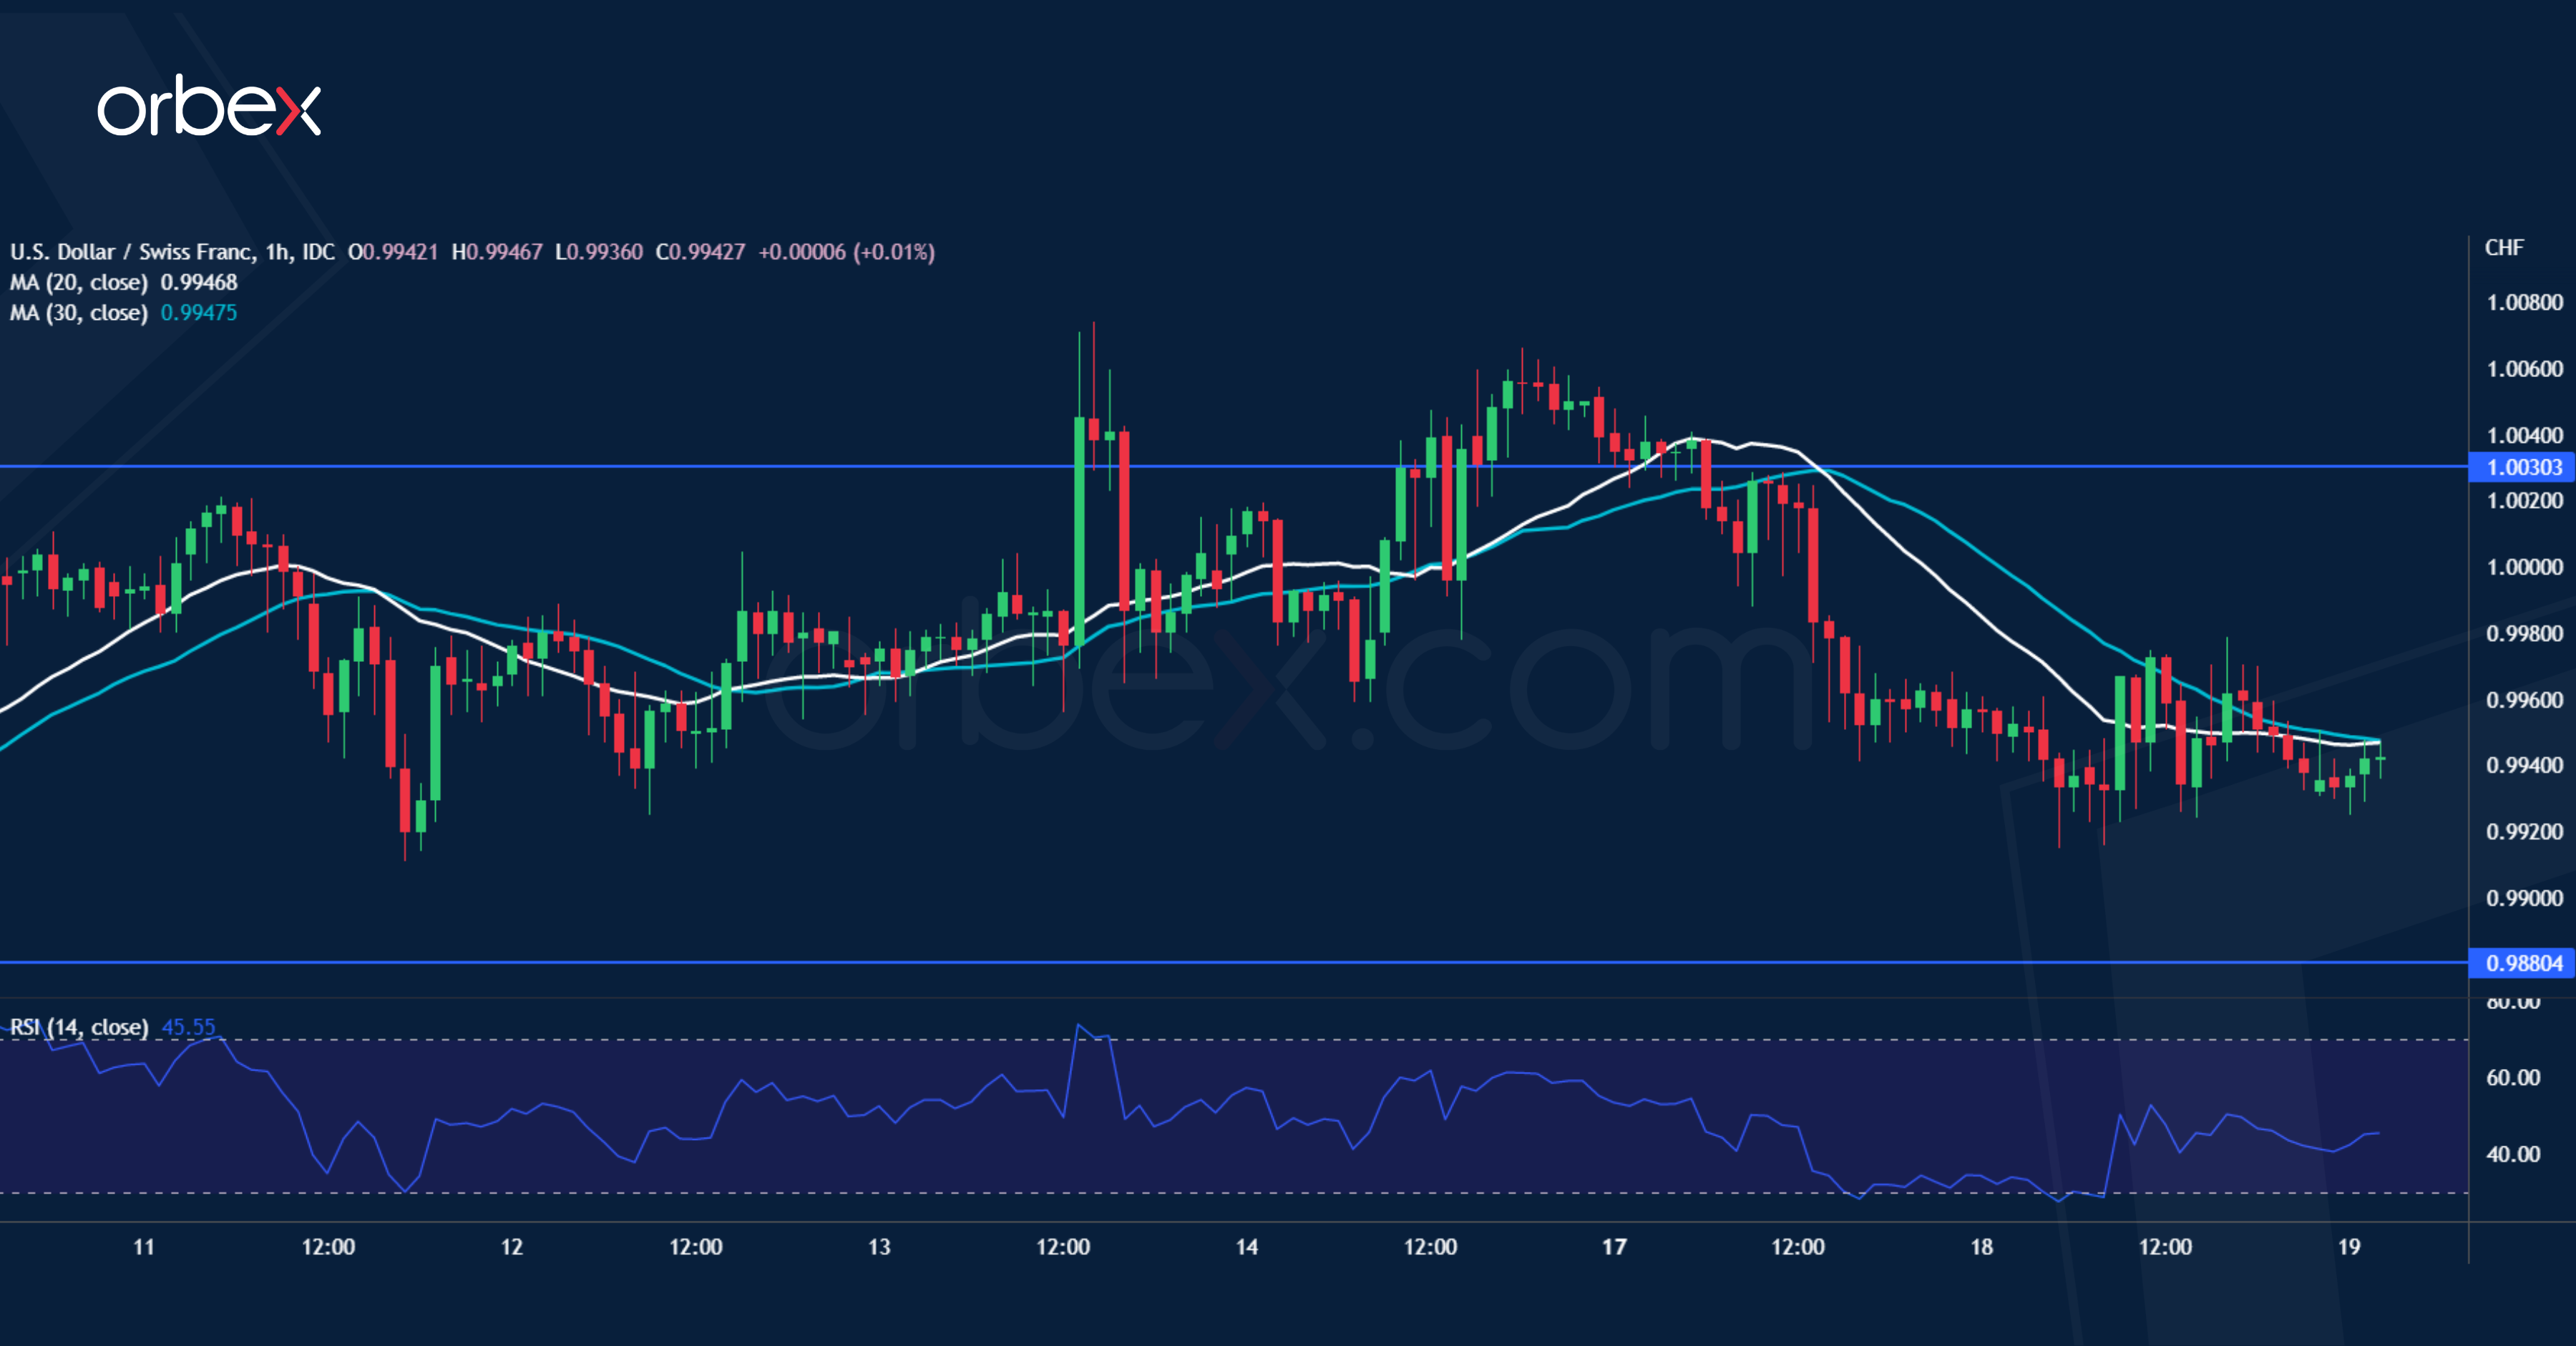
A regain in risk appetite keeps the US dollar in check. A drop below 0.9960 led intraday buyers to take profit. The price is taking a breather after it broke above the double top at 1.0040, a key resistance on the daily chart. The bullish breakout may have paved the way for an extended rally in the medium-term. The current pullback might be an opportunity for the bulls to stake in. 0.9880 over the 20-day moving average is the first support and the RSI’s oversold condition may attract bids. A close above 1.0030 would resume the uptrend.
Elliott Wave View: EURUSD Should Be Near To Pullback
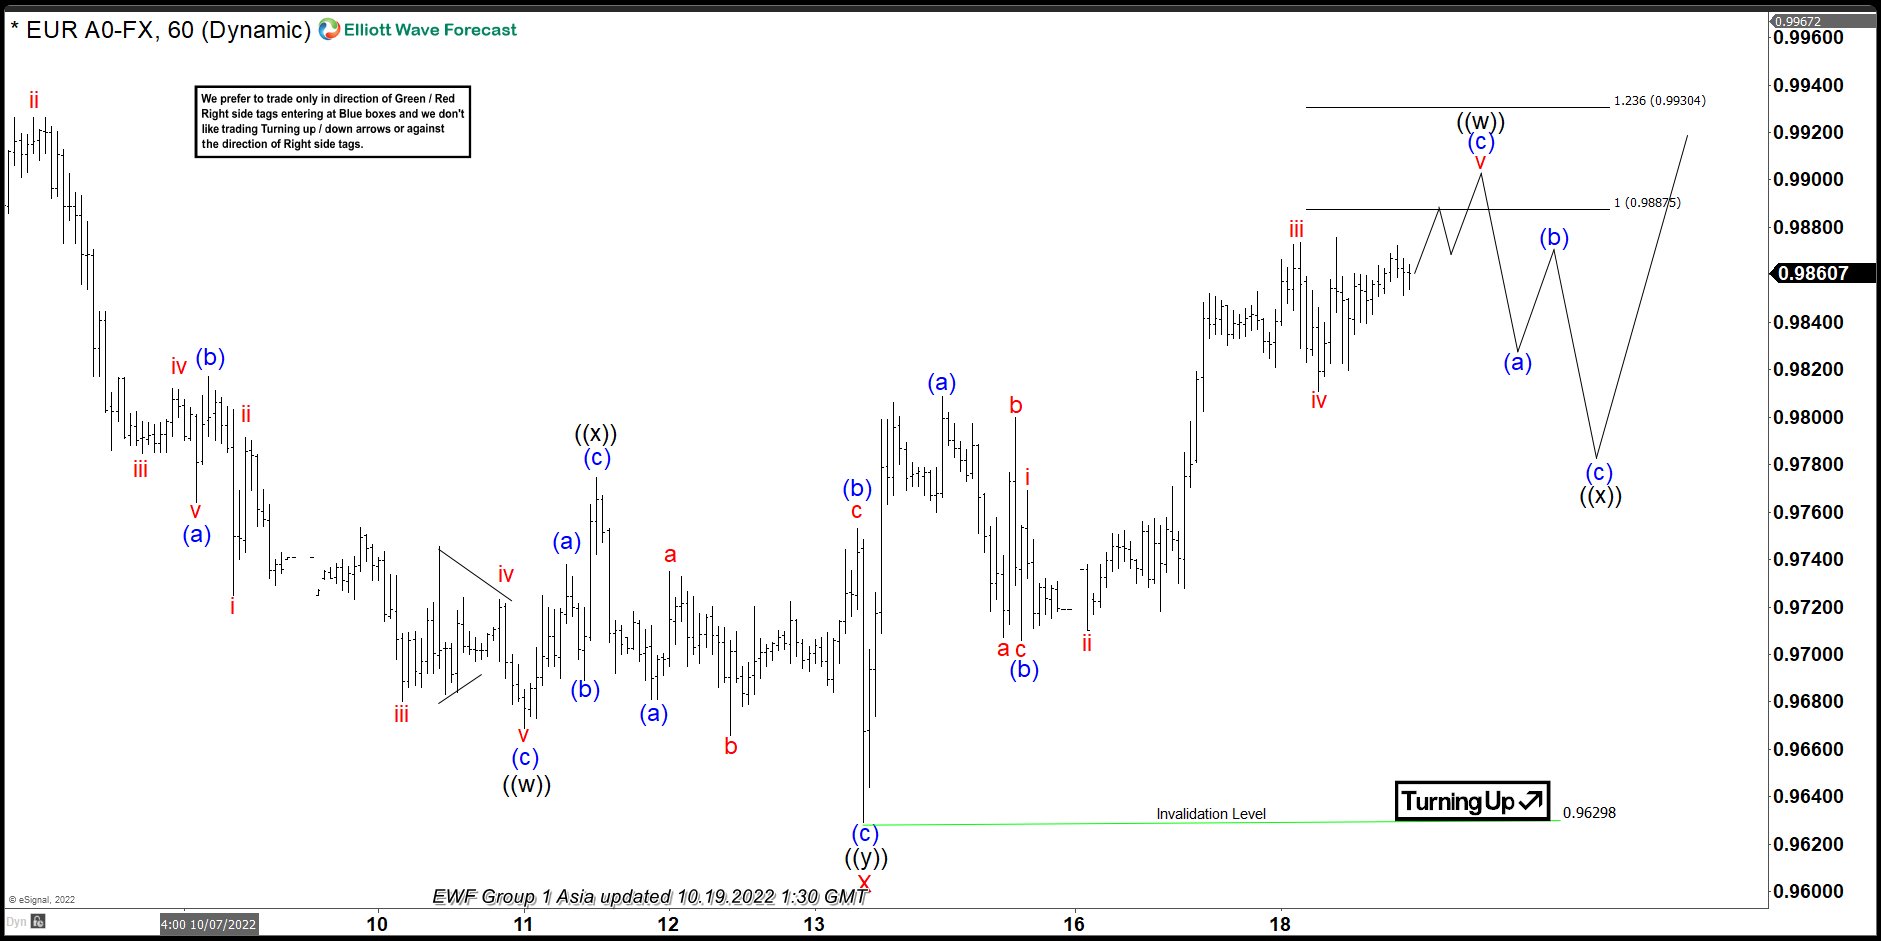
Short term Elliott Wave view on EURUSD suggests the cycle from 10.04.2022 high is over at 0.9630 low as a double correction structure. The market bounced and a new double correction is in progress to end the cycle from 9.28.2022. Up from 10.13.2022 low, wave (a) ended at 0.9808 and dips in wave (b) ended at 0.9706 as a flat correction.
Pair then resumes higher in wave (c). In lesser degree wave i of (c) ended at 0.9768. Pullback in wave ii ended at 0.9710 with internal subdivision as a zigzag structure. Then rally resume and wave iii finish at 0.9873 and corrective wave iv ended at 0.9811. Near term, we are developing last push higher. This should complete wave v of (c) and the first leg of the double correction as wave ((w)). We are expecting that wave ((w)) should fail in 0.9888 – 0.9930 area and the pair should enter in a correction. As far as pivot at 0.9630 low stays intact, expect dips to find support in 3, 7, or 11 swing for further upside.
EURUSD 60 Minutes Elliott Wave Chart