

Sample Category Title
Japan exports rose 28.9% yoy in Sep, imports surged 45.2% yoy
Japan's exports rose 28.9% yoy to JPY 8189B in September. Exports to China grew 17.1% yoy while shipments to the US increased 45.2% yoy. Imports rose 45.9% yoy to JPY 10913B. However, the surge in import was unlikely a reflection of domestic demand, but sharp depreciation in Yen's exchanged rate. Trade deficit came in at JPY -2094B, down from August's record high of JPY -2817B
In seasonally adjusted term, exports rose 3.2% mom to JPY 8672B. Imports dropped -0.6% mom to JPY 10682B. Trade deficit narrowed to JPY -2010B, slightly smaller than expectation of JPY -2.06T.
Australia employment grew 0.9k in Sep, unemployment rate unchanged at 3.5%
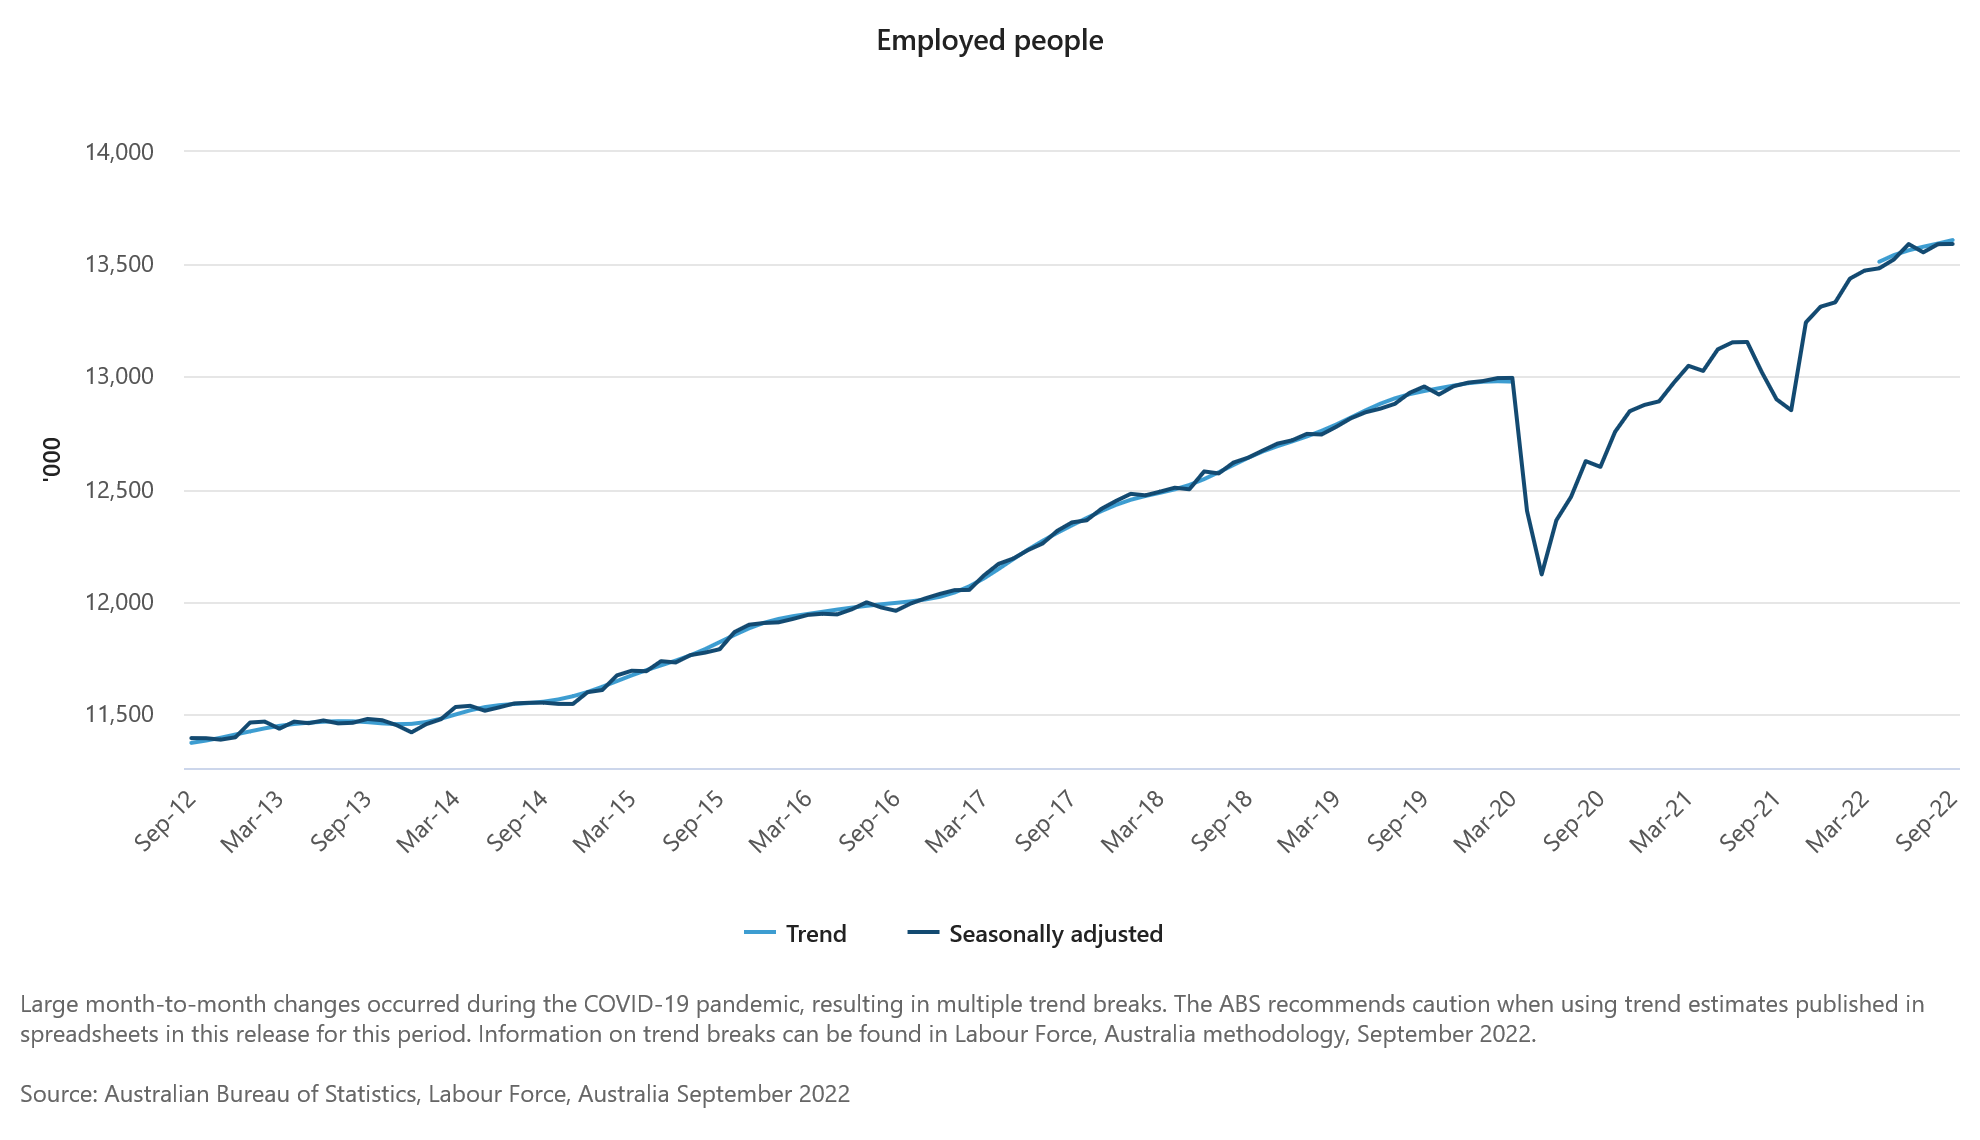
Australia employment rose 0.9k in September, below expectation of 25.0k. Full-time employment increased by 13.3k while part0time employment contracted -12.4k.
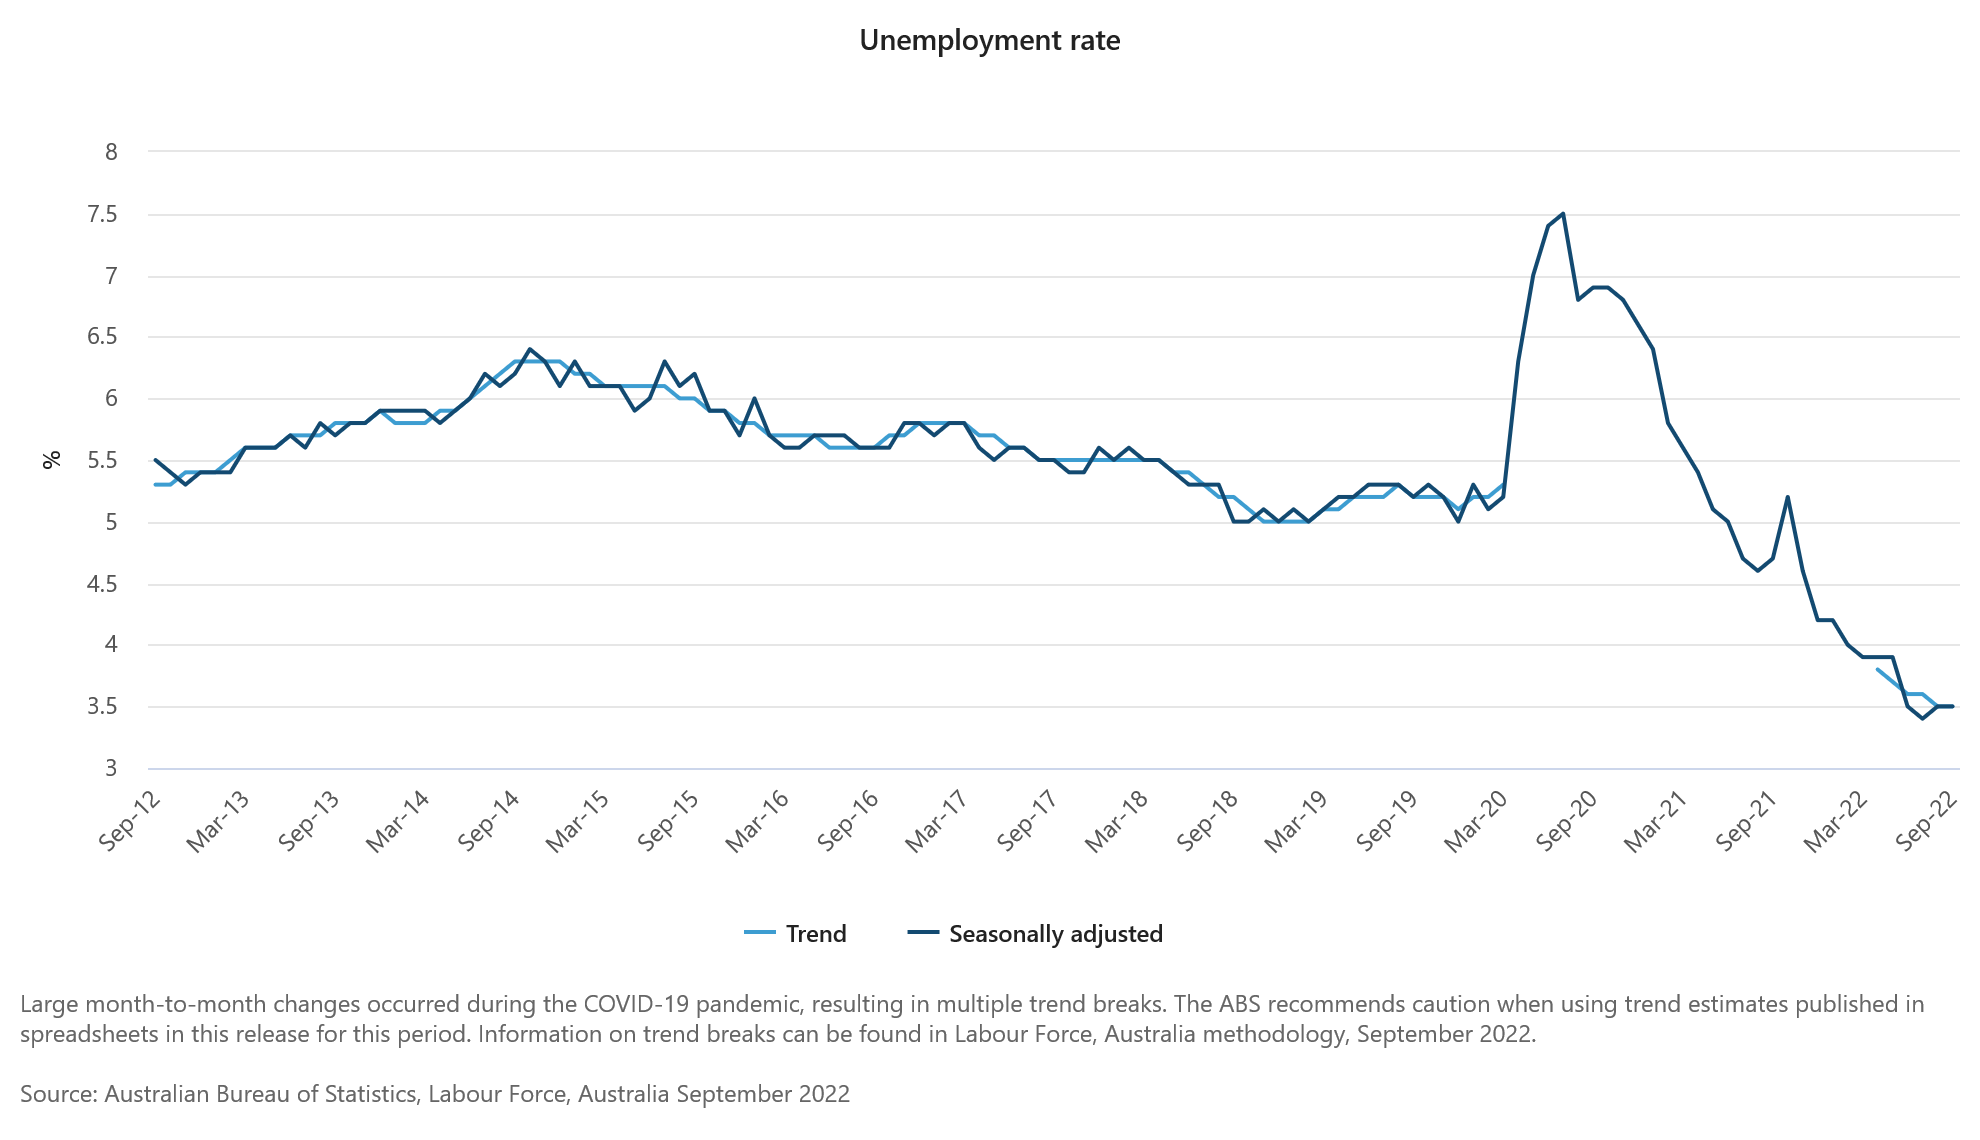
Unemployment rate was unchanged at 3.5%, matched expectations. Participation rate was unchanged at 66.6%. Monthly hours worked dropped -1m hours to 1853 hours.
"It is important to remember that the 1,000 employed people is a net figure – the difference between two large numbers. While employment growth has slowed in recent months, there are still close to half a million people entering employment each month, and around the same number leaving employment each month," Bjorn Jarvis, head of labour statistics at the ABS, said.
Fed Evans: We need to continue on the path we’ve been indicating
Chicago Fed President Charles Evans said yesterday, "inflation is just much too high, and so we need to continue on the path that we've been indicating -- at least that. And I'm hopeful that that will be enough."
"Continued increases in the funds rate along the lines of our September SEP (Summary of Economic Projections) could lead to a economic outlook where we're going to see below-trend growth -- we'll be challenged in that regard -- we'll see the unemployment rate go up, but I think that it won't take off," Evans said.
"I think if we have to increase the path of the funds rate much more, though, it really does begin to weigh on the economy. I worry that it's sort of a nonlinear kind of event."
Fed Bullard: Goal is to raise rates to some meaningfully restrictive level
St. Louis Fed President James Bullard said yesterday that Fed's goal is to front-load aggressive rate hikes to move to "some meaningfully restrictive level" that would push inflation down.
For November meeting, Bullard said the results "has been more or less priced in to markets" for a 75 basis-point hike, even though he'd prefer to decide at the meting. As for December, didn't want to "prejudge".
Then, in 2023, "I think we'll be closer to the point where we can run what I would call ordinary monetary policy," he said. "Now you're at the right level of the policy rate, you're putting downward pressure on inflation, but you can adjust as the data come in in 2023."
Fed Kashkari: I can’t see how I would recommend pausing interest rate increases
Minneapolis Fed President Neel Kashkari said yesterday that while headline inflation may have peaked, there is no evidence that core inflation has stopped climbing. So, "I can't see how I would recommend pausing interest rate increases," he added.
"My best guess right now is yes, do I think inflation is going to level out over the next few months, the services, the core inflation, and then that would position us some time next year to potentially pause," he added.
"I've seen very little evidence in my region that the labor market is softening," Kashkari said. "The No. 1 issue I hear from businesses small and large is that they're struggling to find workers, how they're having to pay more wages to keep their employees and to attract employees."
Bitcoin Price Is Facing Uphill Task, $20K Is The Key
Key Highlights
- Bitcoin price is facing a major resistance near $19,400 and $20,000.
- A major bearish trend line is in place with resistance near $19,400 on the 4-hours chart.
- A close above $20,000 might start a strong increase.
- The main breakdown support sits near the $18,500 zone.
Bitcoin Price Technical Analysis
Bitcoin price remained in a bearish zone below the $20,000 level against the US dollar. BTC/USD made a few attempts to gain strength above $19,500 but failed.
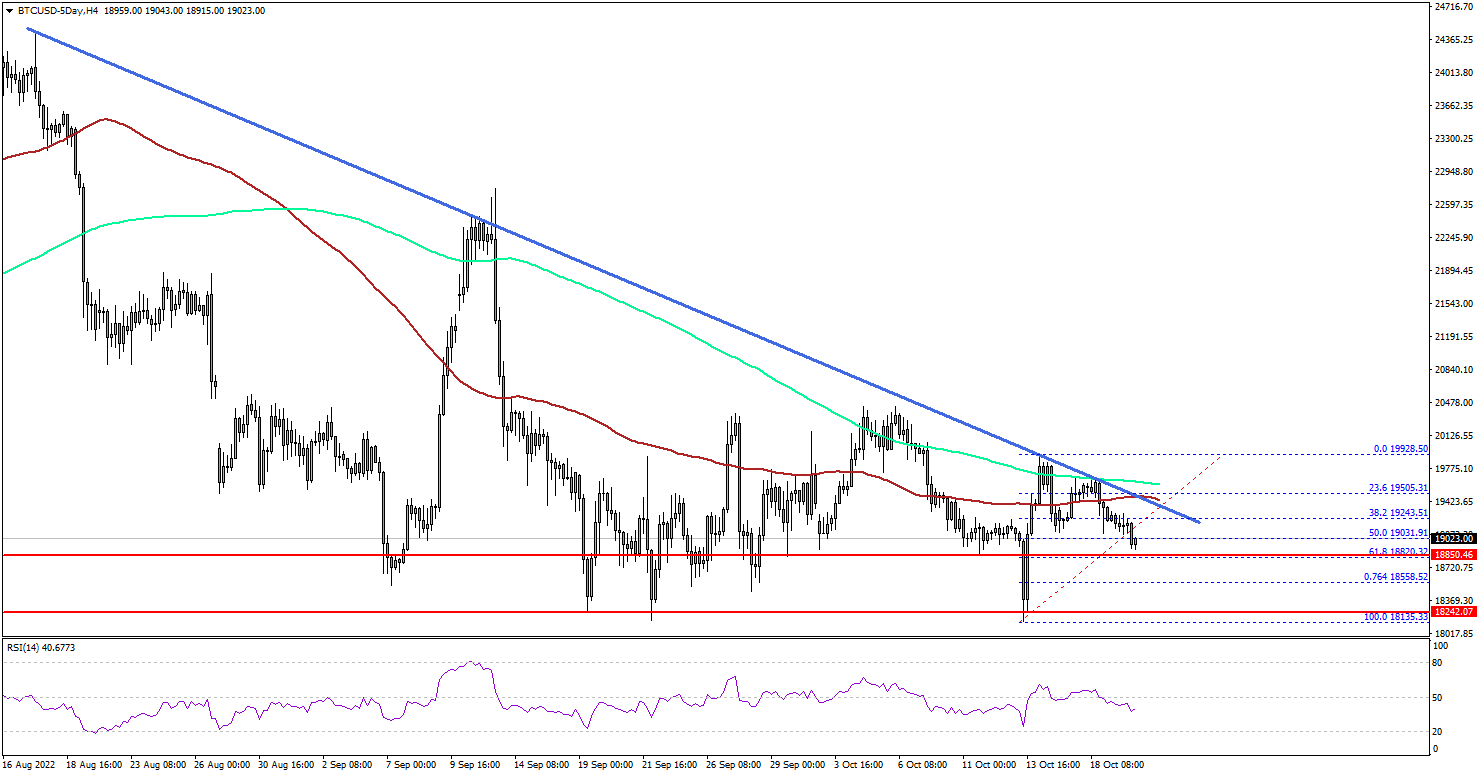
Looking at the 4-hours chart, the pair started a fresh decline from the $19,920 swing high. The price declined below the $19,500 level. It settled below the $19,500 level, the 100 simple moving average (red, 4-hours), and the 200 simple moving average (green, 4-hours).
On the upside, the price is facing a significant resistance at $19,400. There is also a major bearish trend line in place with resistance near $19,400 on the same chart.
The main resistance sits near the $20,000 level. A close above the $20,000 level may perhaps start a steady increase in the coming days. In the stated case, the price could rise towards the $21,000 level. Any more gains could set the pace for a move towards the $22,500 level.
On the downside, an initial support sits near the $18,800 level. The main breakdown support sits near the $18,500 zone. If there is a downside break, bitcoin might decline towards the $17,500 support in the coming sessions.
The overall price action and chart suggest that bitcoin price is facing an uphill task near $19,400 and $20,000, above which it could start a strong increase.
Economic Releases
- US Initial Jobless Claims - Forecast 230K, versus 228K previous.
- US Existing Home Sales for Sep 2022 (MoM) - Forecast -0.1%, versus -0.4% previous.
After Failed Upturn, Gold May Be Heading to $1150
Gold is down more than 1% on Wednesday and 5.5% in the last two weeks, failing to find any firm buying support after taking off at the end of September. Declining almost daily over the previous two weeks, it wiped away nearly all its gains of the recent rally, going back to levels of $1630. The technical picture looks contradictory, with something for both bulls and bears.
During the sell-off last week, gold returned under the 200-week moving average, signalling that the bears are still in control of the long-term trend in the metal. The last time we saw a similar technical pattern was in 2013. The analogy is reinforced by the fact that there were several years of solid gold price increases in response to the recession, rate cuts and QE. This was followed by a correction and a false attempt to push gold to renewed highs. But the economic slowdown played against the demand for the precious metal.
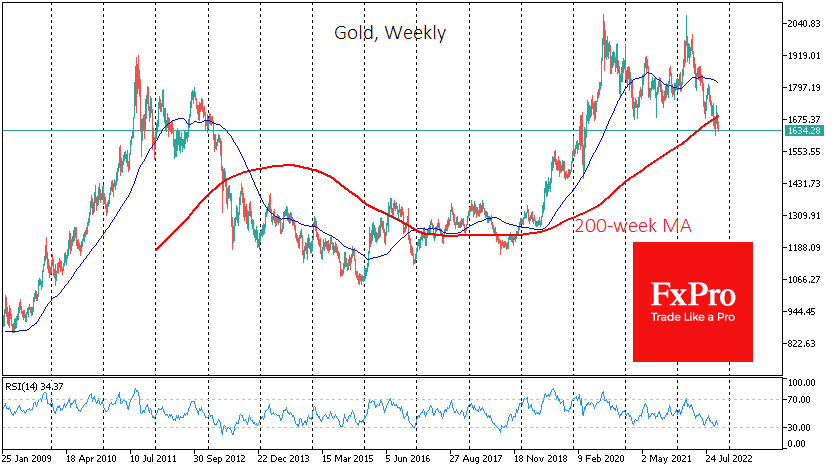
At that time, a renewed failure under the 200-week mark was followed by an absolute surrender, which took 18% off the price within seven weeks. The bearish trend finally died out two and a half years later.
Despite the frightening similarity in the weekly chart, there are differences from what happened ten years prior. Back then, the price of gold reached the bottom on the day of the first Fed rate hike, an event that did not stop the pressure this time.
On the daily candlestick charts, the rally in gold was stopped by the 50-day moving average, which has acted as resistance more than once since April of this year. However, the bullish divergence between the price and the RSI remains in force, indicating that the bearish momentum is locally exhausted.
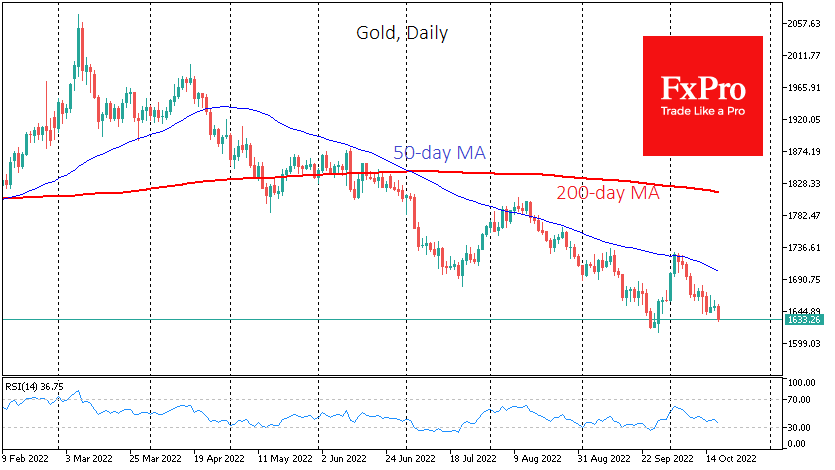
Should gold close this week below its 200-week average, which is now near $1680, the chances of a bearish scenario would increase sharply. In the recent history of free-floating, gold has fallen 18-30% after falling below the 200-week average. Translated to our prices, that implies a downside potential to $1350 or down to $1150, where the first level coincides with the upper bound of the 2013-2018 trading range and the lower level is near the lows of that same prolonged range.
Canadian Dollar Yawns After Inflation Report
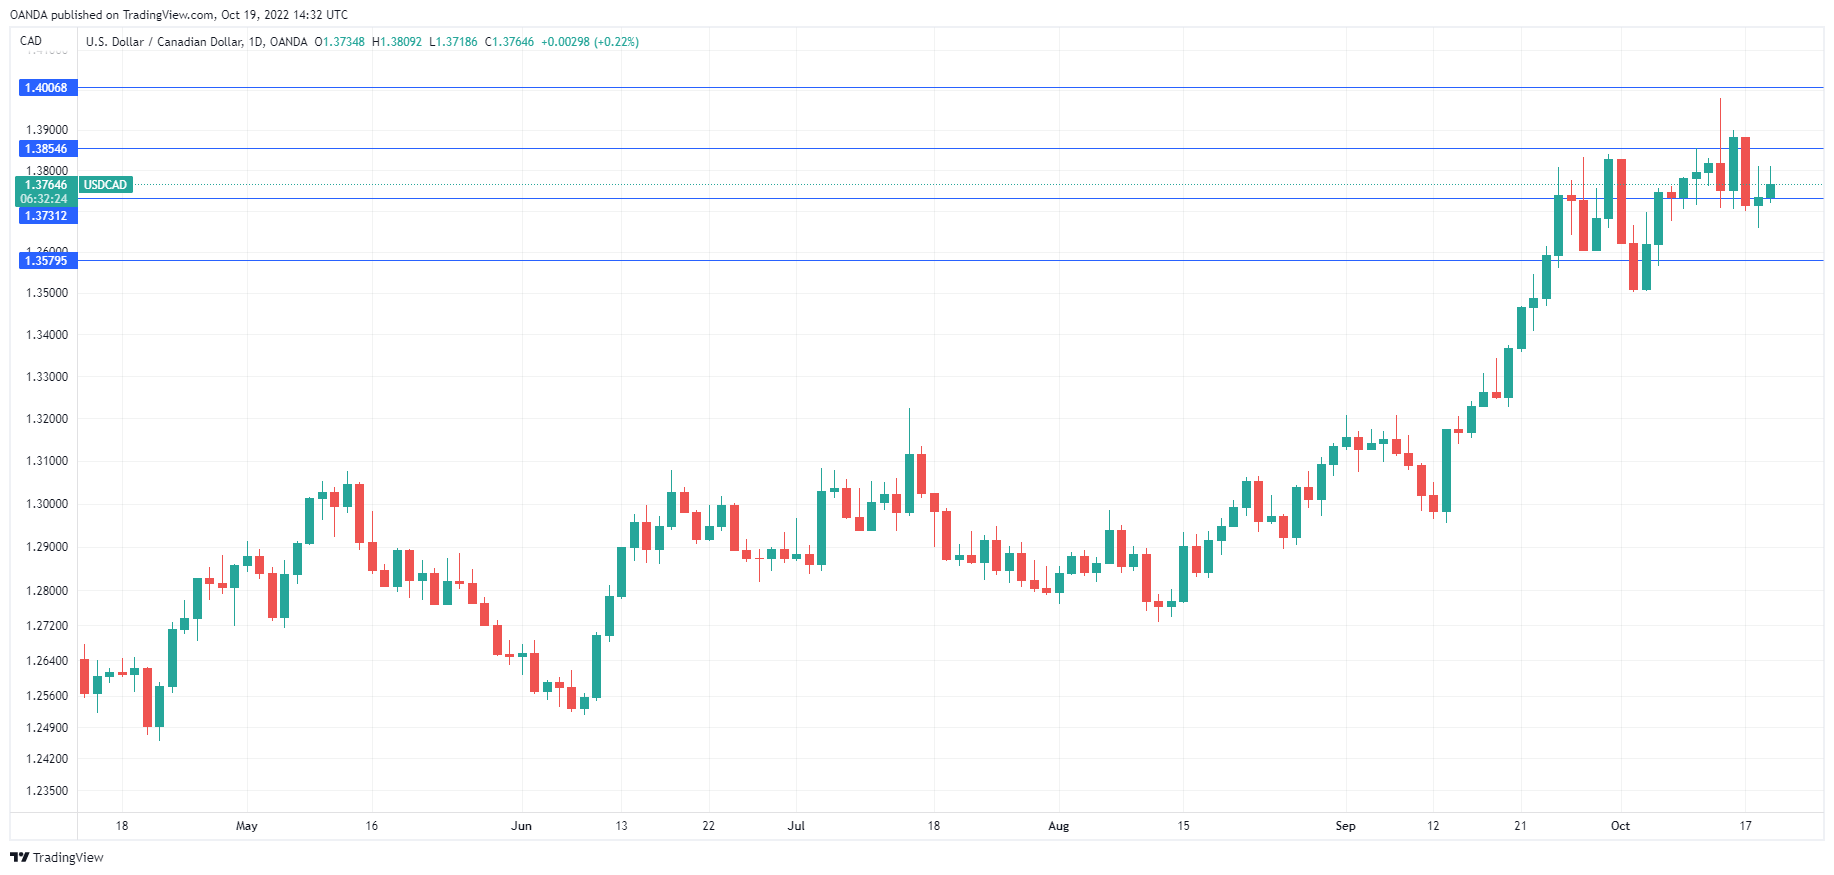
USD/CAD pushed higher earlier in the day but has pared most of those gains. In the North American session, the Canadian dollar is trading at 1.3757, up o.17%.
Canada’s CPI ticks lower
Headline inflation ticked lower to 6.9% in September, down from 7.0% in August. Still, the reading was higher than the consensus of 6.8%. Core inflation remains even more stubborn, rising to 6.0%, up from 5.8% and above the forecast of 5.6%.
The inflation report takes on added significance as the Bank of Canada meets next week, and as is the case with most major central banks, the question is not if rates will rise, but by how much. The Bank will be unhappy with core inflation rising, although I doubt this was much of a surprise for Bank policy makers, as most BoC core inflation indicators are around 6%. The takeaway from the inflation data is that there will be more support for a 75 basis point hike, as opposed to a 50bp move, with inflation remaining stubbornly high.
With the Federal Reserve possibly looking at a 75bp rate hike in November, a matching hike from the BoC will prevent the US/Canada rate differential from widening, which is good news for the Canadian dollar. The BoC’s aggressive rate tightening has pushed the economy closer to a recession, but inflation remains public enemy number one for the Bank, which means more oversize rate hikes are on the way.
In the US, the Fed’s rate tightening has led to the economy showing signs of cooling down, such as the housing market. The NAHB housing market index fell for a 10th straight month, dropping to 38 in October, down from 43 in September.
USD/CAD Technical
- 1.3927 and 1.4024 are the next resistance lines
- There is support at 1.3744 and 1.3647
ECB Preview – Focus on the Technicalities
Next week's ECB meeting is set to bring another 75bp rate hike in all three policy rates. We expect Lagarde to say that the probability of the ECB staff's downside risk scenario from the September projection exercise is becoming more likely, but fall short of giving new significant policy signals. We expect the ECB to continue to hike its policy rates until early next year, with the risk of potential further hikes if fiscal initiatives support the growth outlook in such a way that inflation remains too high over the medium-term.
Markets will focus on the risk of the ECB ending its APP reinvestments, which will complement the liquidity tightening that will take place as TLTROs mature next year. We do not expect the ECB to present a roadmap on how to end reinvestments at this meeting, but we expect the ECB to announce a change in its reserve remuneration system, which may initially cause some market jitters. We expect the ECB to calibrate the new system in such a way that the market relevant policy rate will continue to be the deposit rate, but we acknowledge risks to short-end credit spreads.