Sample Category Title
US Oil Attempts to Bounce Back
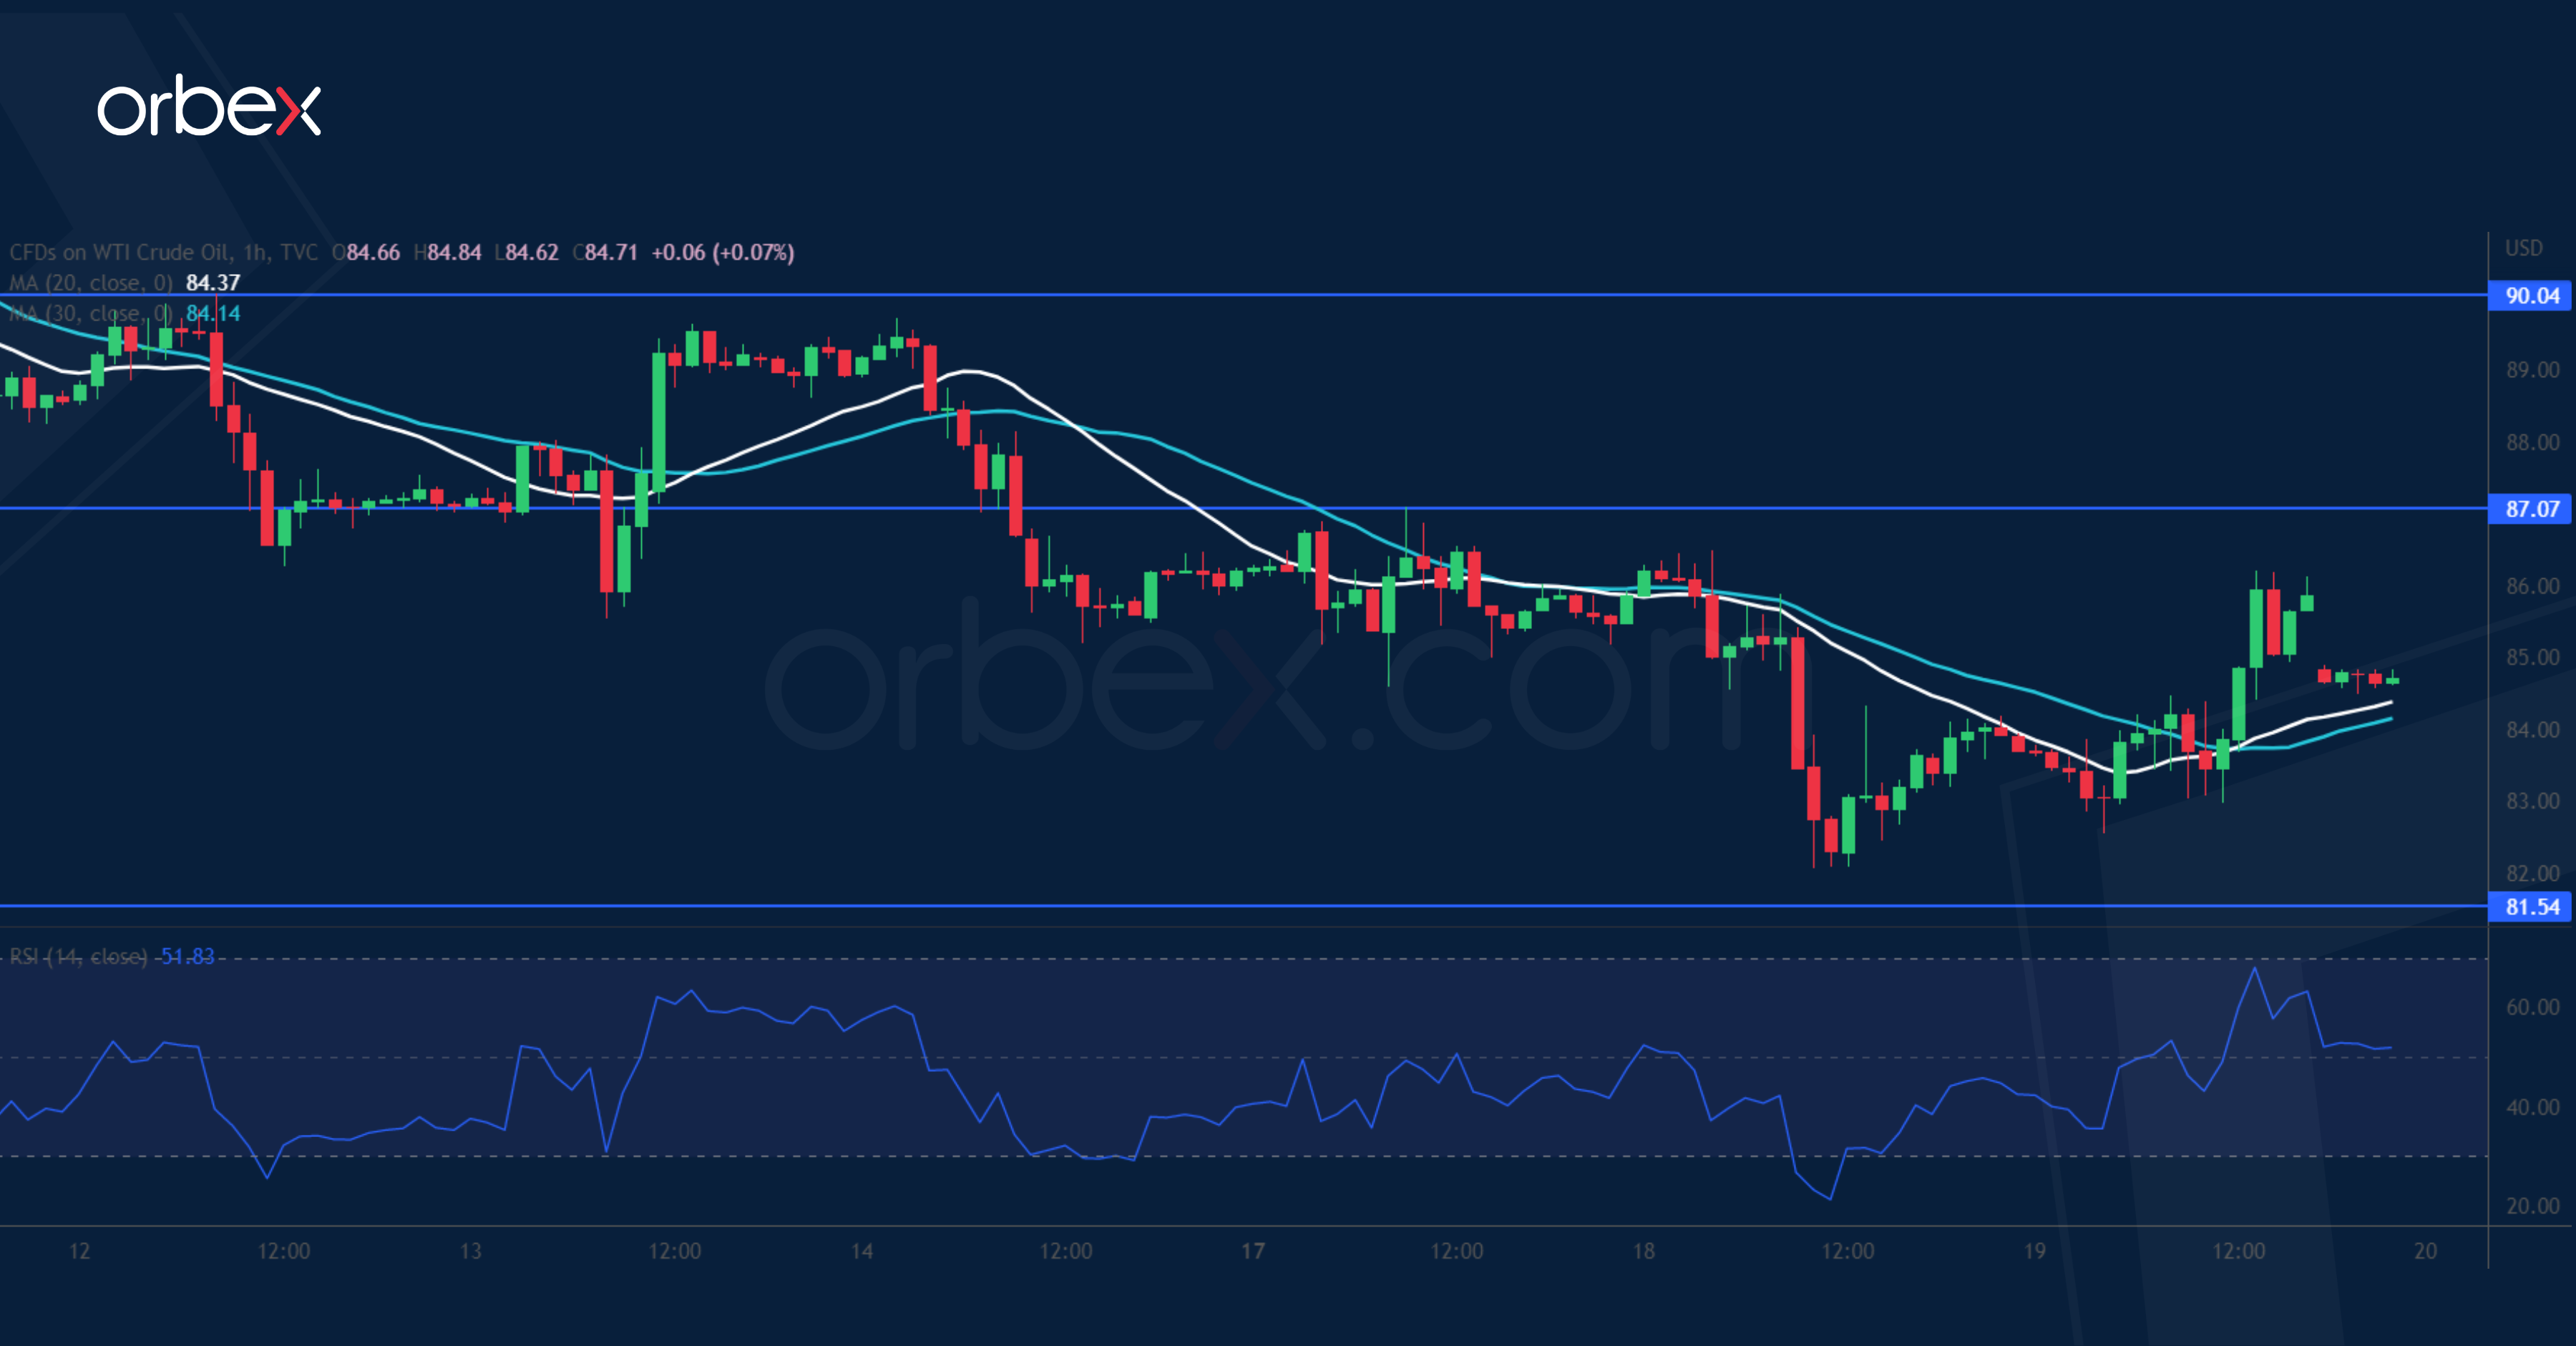
WTI rallied after US inventories showed a surprise drawdown. While the rally above 86.00 and 90.00 has eased some pressure, the price hit resistance at the origin (93.50) of the late August sell-off and struggled to secure bids. This suggests that the bears may have doubled down. 81.50 is the immediate support and its breach would cause a retest of 77.00 where the crude could be vulnerable to a new round of liquidation. 87.00 is the first hurdle in case of a rebound and only a rally above 90.00 may turn the mood around.
USD/CAD Consolidates Gains
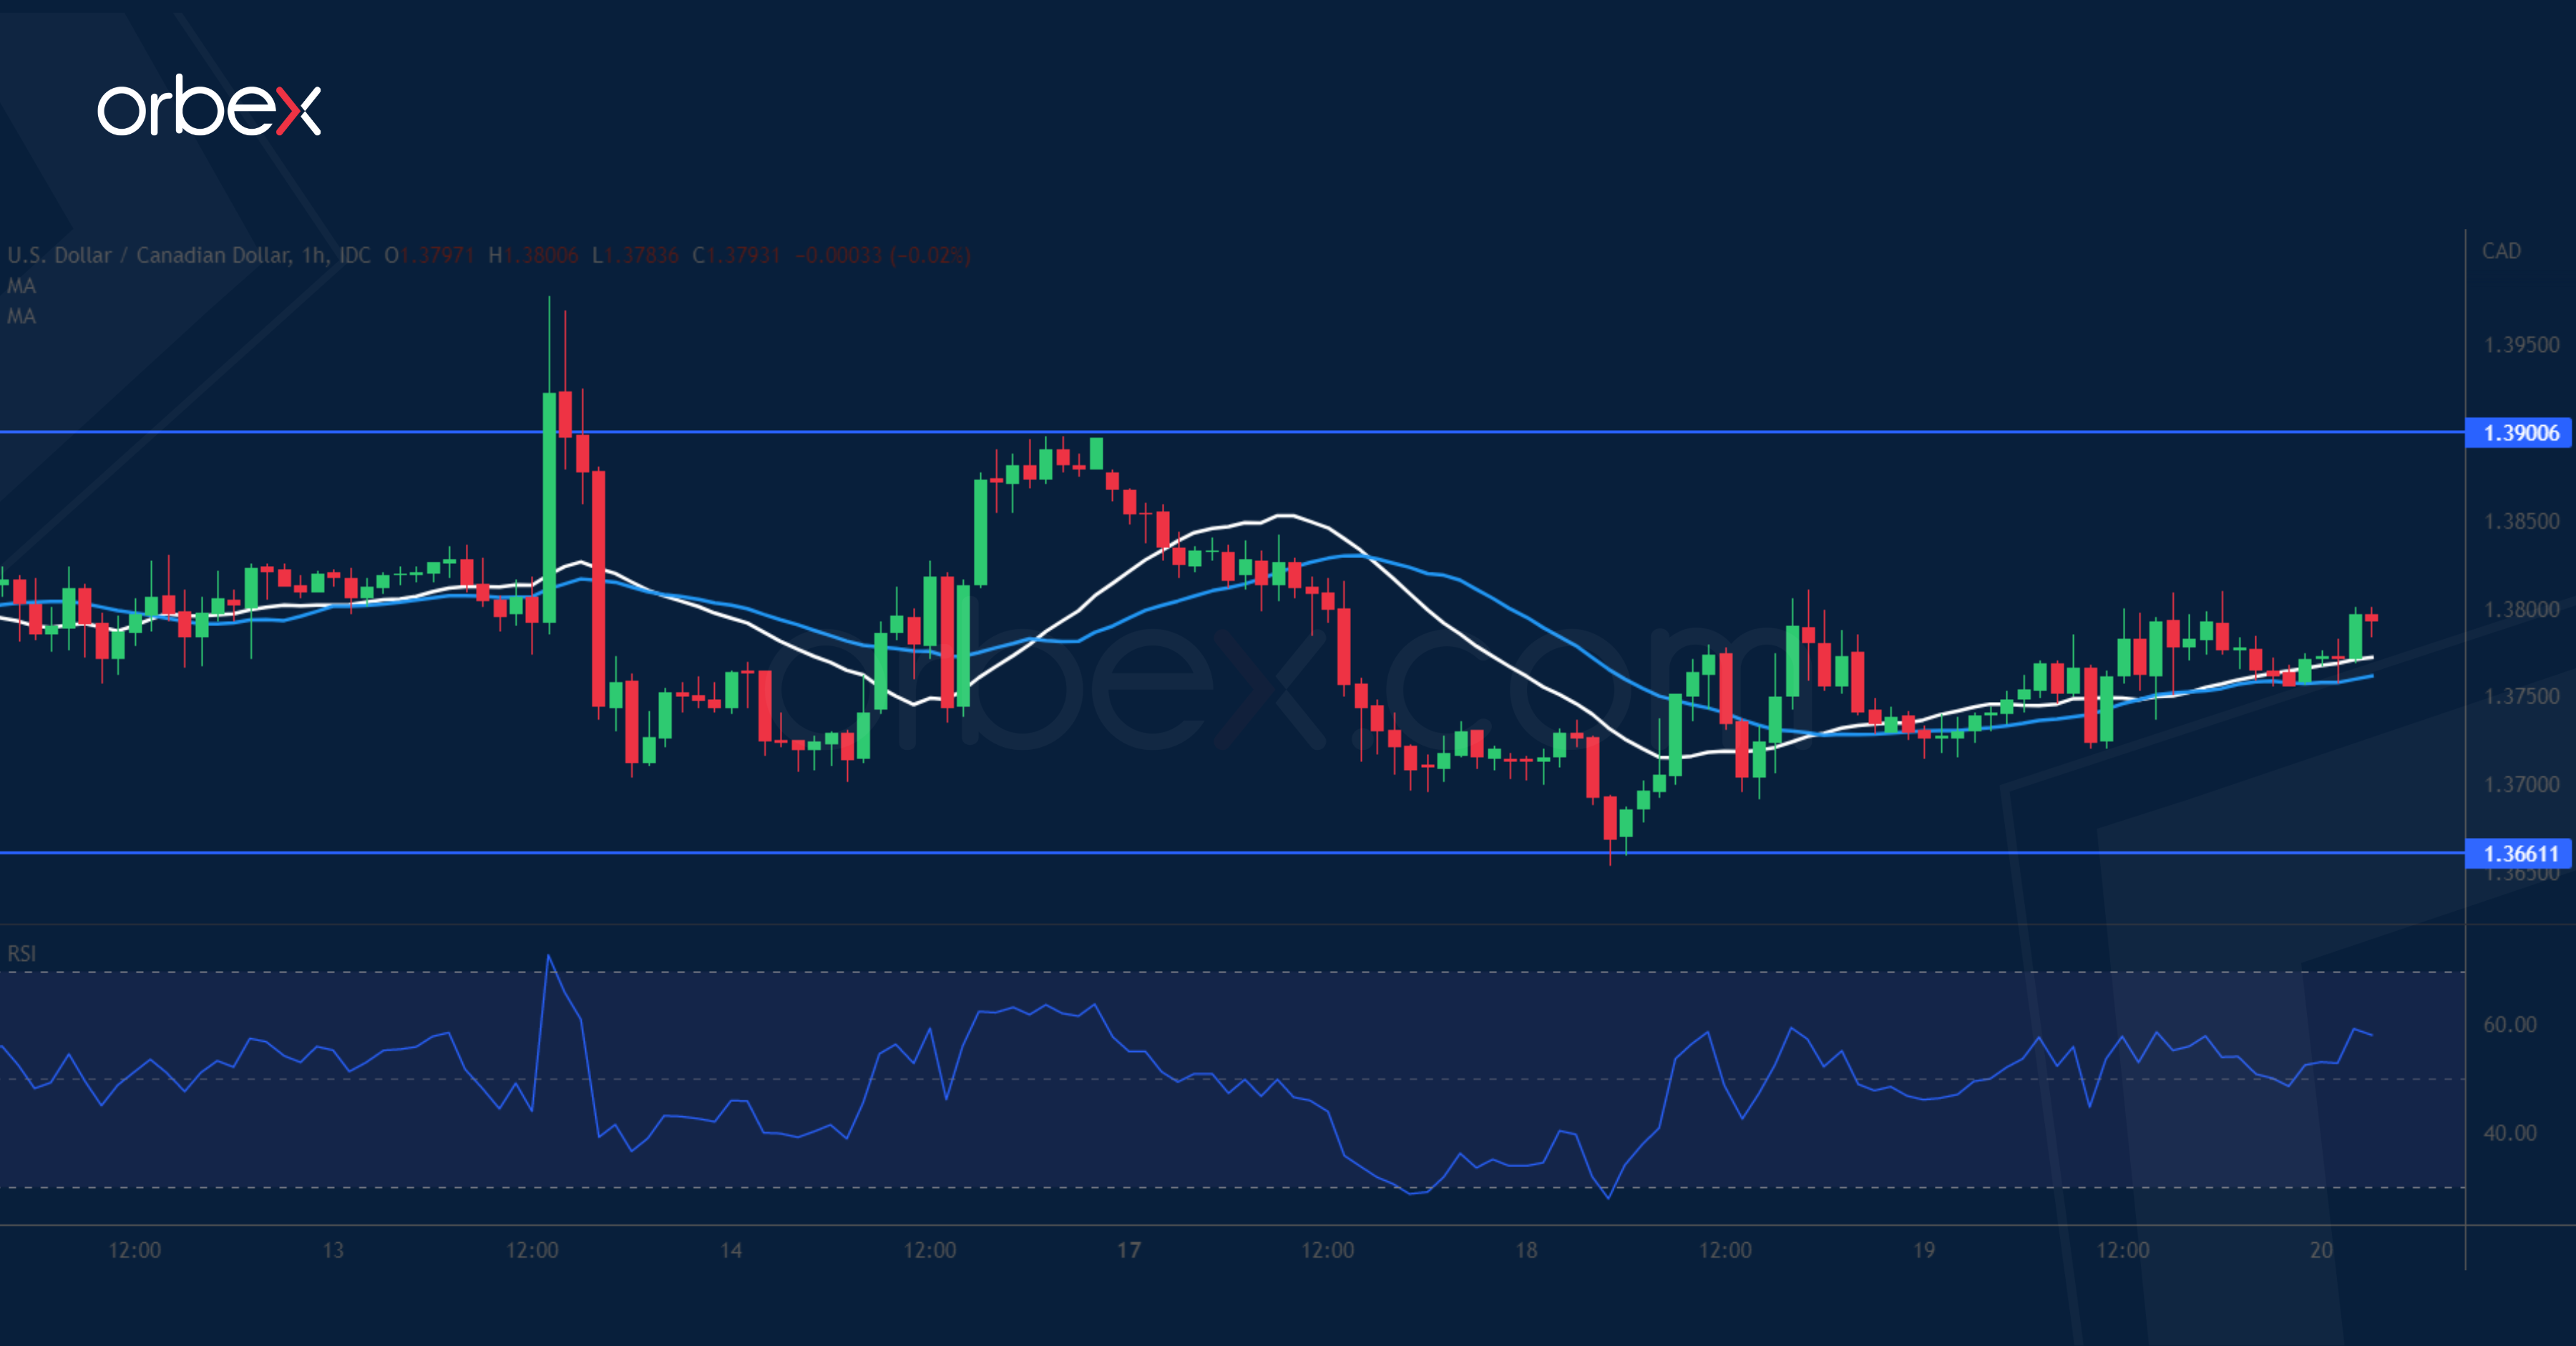
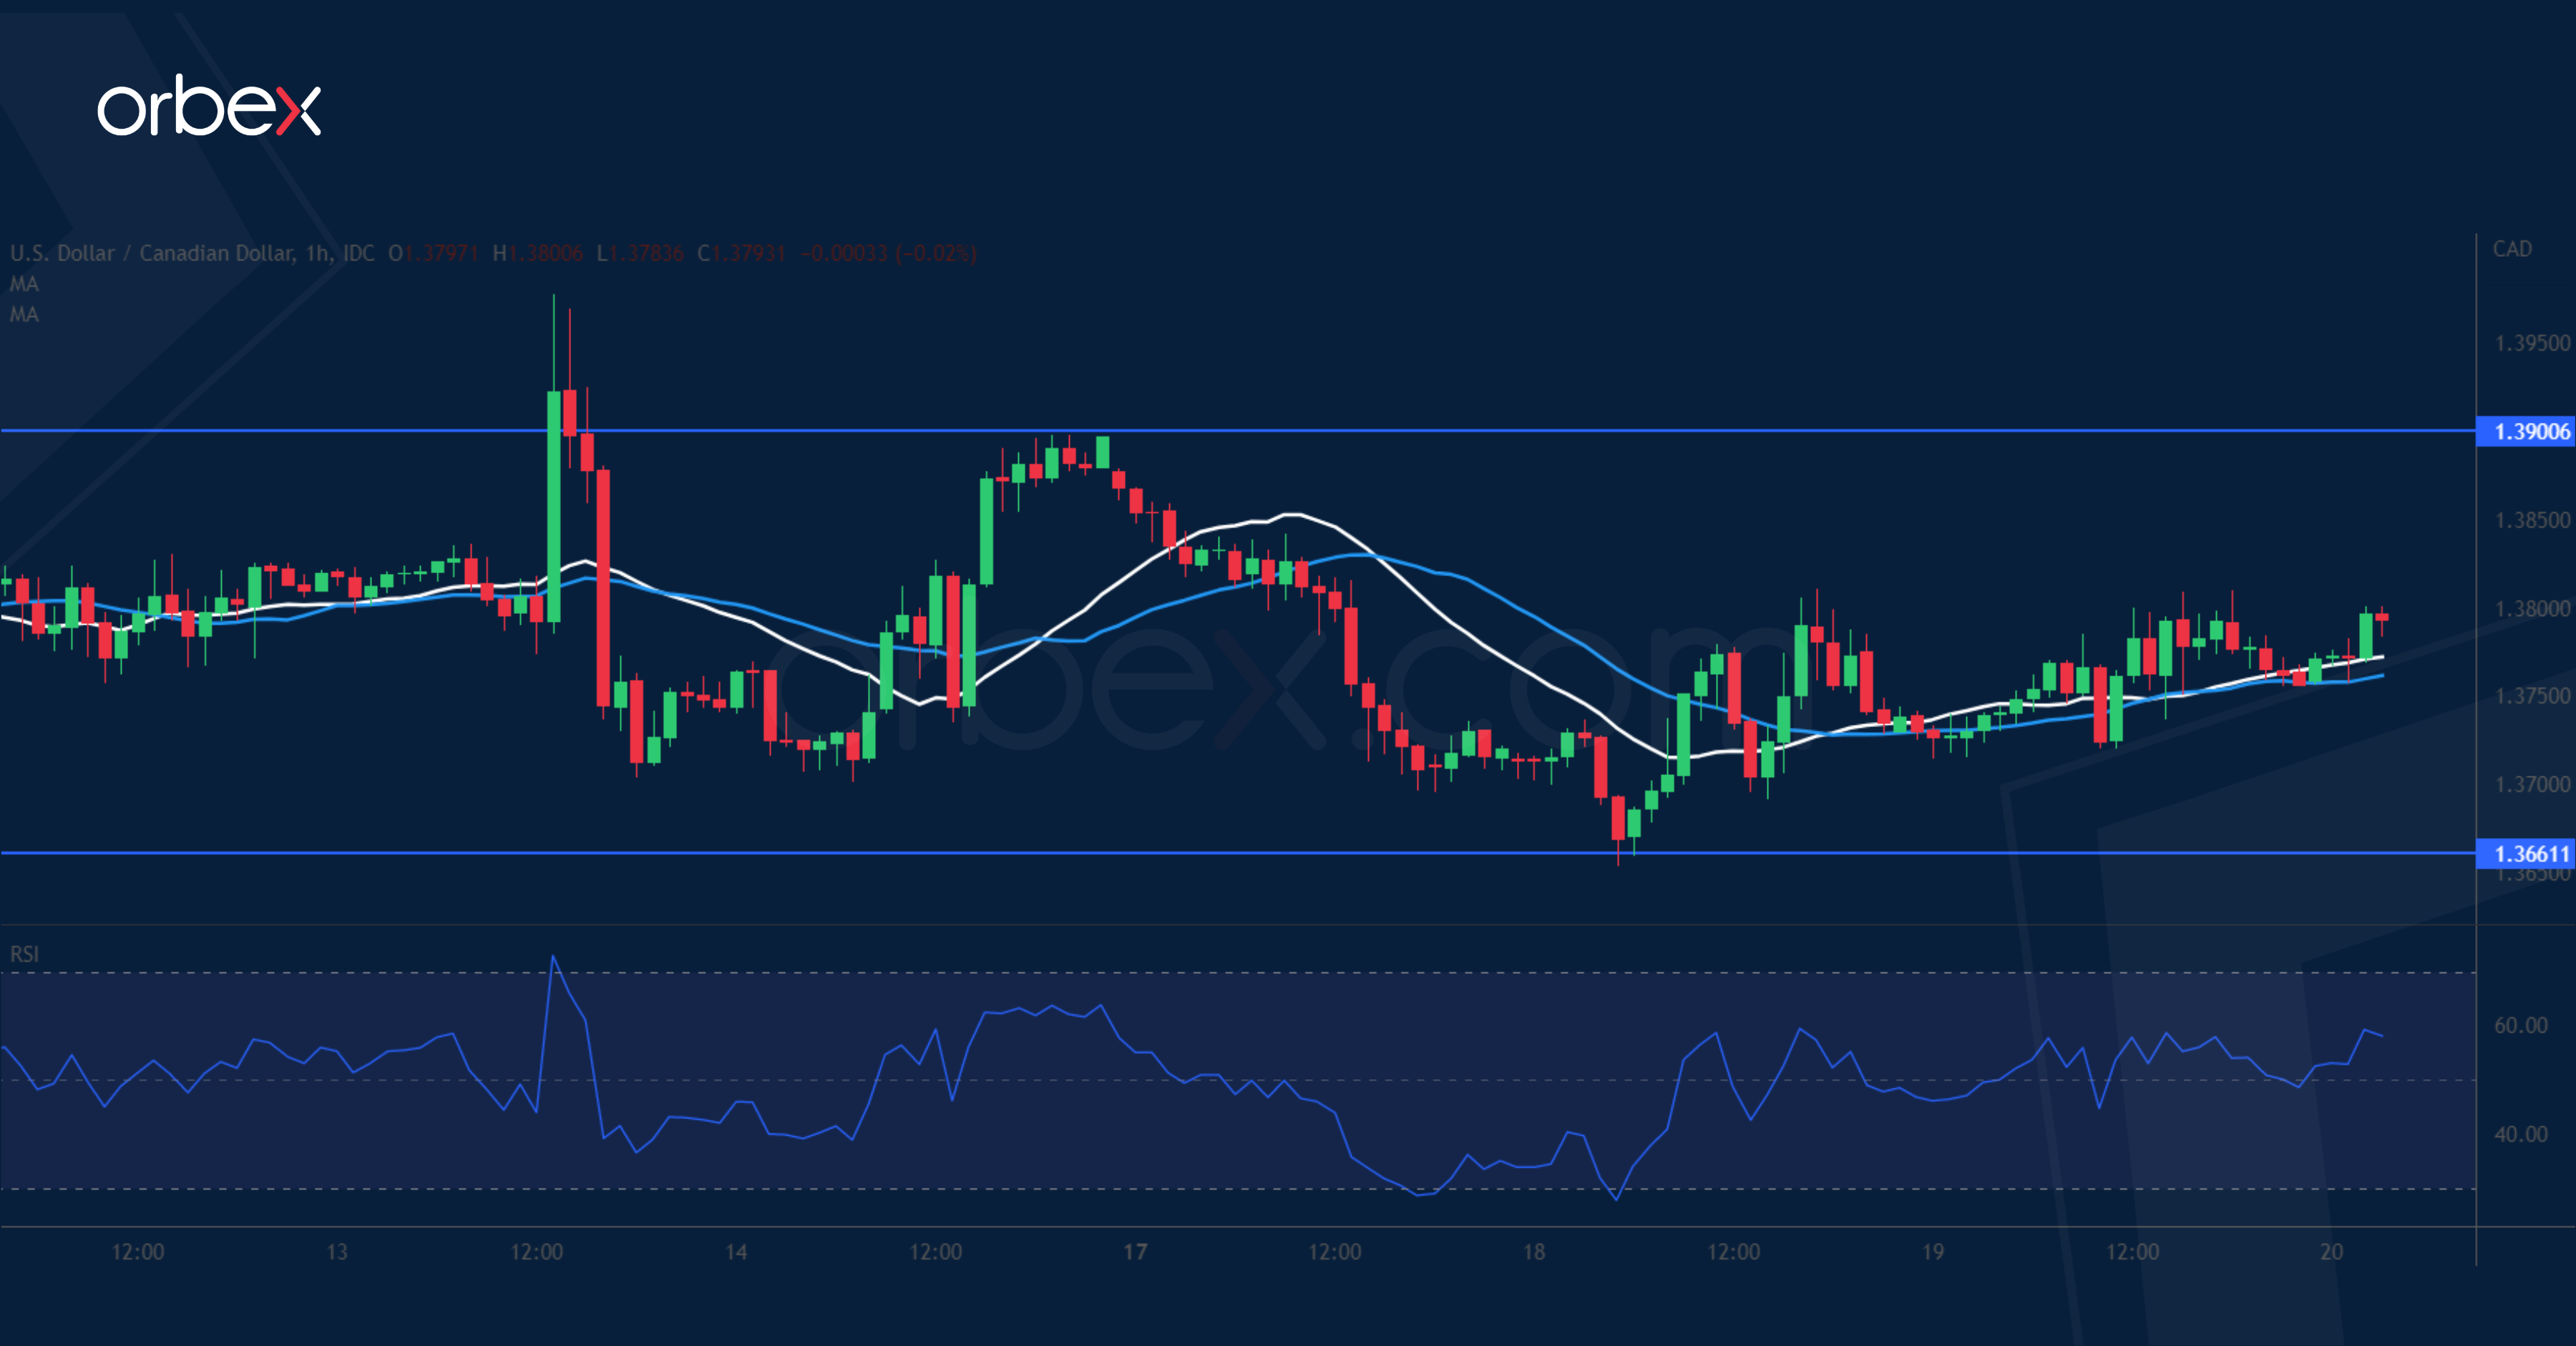
The Canadian dollar softened after the annual CPI eased to 6.9% in September. The price action is consolidating its latest gains after making a new high above 1.3840. A drop below 1.3700 has shaken out some weak hands but overall sentiment still points to the upside. The bulls may see the current pause as an opportunity to join the rally. 1.3660 is the first support while 1.3500 on the 30-day moving average is a key level to see follow-up interests. On the upside, a close above 1.3900 would resume the uptrend.
GBP/USD Seeks Support
The pound holds steady as Britain’s inflation rose to 10.1% in September. From the daily chart’s perspective, the pair is forming a flag-shaped pattern after its recent sharp slide. While Sterling clawed back some losses, the directional bias remains bearish in the medium-term which may attract more trend followers. 1.1500 is an important ceiling and its breach could lift offers to September’s high at 1.1700. 1.1070 at the base of the latest rally is a key support. A bearish breakout would send the price back to 1.0760.
Bank of Japan This Morning Announced an Unscheduled Bond Buying Operation
Markets
We’ve grown more used to large bond yield moves over the past few months. But it still feels extraordinary when they appear out of thin air. That’s what happened yesterday during a trading session that hadn’t much to offer in terms of important economic data or other events. Yet core bond yields hit new (closing) cycle highs at almost all maturities. US bond rates shot up between 9.5 bps and 13.6 bps in a flattener even with housing data coming in mixed – at best. Comments from Fed’s Kashkari (“no evidence that core inflation has peaked”, “more serious risk from not enough tightening”) and Evans helped sustain the move going into the US close. Bullard said that frontloading could end this year before shifting to keeping policy sufficiently restrictive with small adjustments as inflation cools in 2023. German yields added 11.8 to 12.3 bps in the 2y-5y segment, again underperforming swaps. Gilt yields were the exception even as UK CPI went back to the double digit area (10.1%). The ultralong end tanked more than 30 basis points, bringing the 30y back below 4% for the first time since end September. This is still a direct consequence of the Bank of England excluding that part of the curve (for now) in its bond selling programme starting November 1. Stock markets pared gains in Europe to just 0.2% or suffered minor losses up to 0.85% in the US. The US dollar held sway in currency markets with everyone eyeballing USD/JPY as it neared the 150 (intervention-triggering?!) barrier. EUR/USD retreated from 0.986 to 0.9777. Sterling traded without a clear direction. EUR/GBP closed unchanged above 0.87.
Asian stock sentiment was gloomy but got a little boost from reports that China is considering to cut quarantine time. The country’s very strict Covid rules weigh on demand and continue to hamper supply chains. The news is seen a first step in the other direction. Chinese stocks erased losses to turn slightly positive and is pulling peers away from intraday lows too. The dollar pared gains. Core bonds trade around or even slightly below yesterday’s closing levels. The BoJ this morning stepped in with an unscheduled bond buying spree (see below). Given the empty economic calendar and upcoming events (ECB next week), we would normally argue for wait-and-see trading behaviour. However, yesterday showed this doesn’t need to be the case per se. Especially with many parts of the yield curve, both in the US and Europe, having risen above previous cycle (closing) highs there’s room left for more from a technical point of view. On currency markets all attention is going to USD/JPY. 149.95 and counting.
News Headlines
Job growth in Australia unexpectedly came almost to a standstill in September, with a rise of only 900, compared to market expectations for a gain of about 25 000. Full time jobs rose modestly (13.3k). Part time employment declined. The participation rate stabilized at 66.6%. At the same time, the unemployment rate stayed very low at 3.5%. The labour market gradually moving to a more balanced condition supports the case for the RBA holding to a slower pace of rate hikes. At the October 4 meeting the RBA raised to policy rate by ‘only’ 25 bps to 2.6%, while markets expected a bigger increase. For the next RBA meeting on November 1, the market expects a similar 25 bps step. Despite the softer than expected labour market data, Australian bond yields are rising about 13 bps across the curve this morning on the global market repositioning. AUD/USD dropped to currently trade in the 0.6245 area, with the cycle low set earlier this month at 0.617.
The Bank of Japan this morning announced an unscheduled bond buying operation as the broader rise in global yields pushed the 10-y Japanese government bond yield above the 0.25% cap. To prevent a further rise the BOJ announced to buy an unlimited amount of 10-y Notes at a 0.25% yield. The BoJ also intends to by JPY 250 bln of bonds starting from a maturity of 5-year. The operation today illustrates that the BoJ continues to withstand the global trend op yield normalization, which also translates into persistent weakness of the Japanese currency. This weakening in September also resulted in a 44.9% Y/Y rise in the import bill. However, the value of exports also rose to 28.2% to JPY 8.8 trillion record level, slightly easing the adjusted trade deficit to JPY 2.01 trillion.
Mixed Earnings, Hawkish Fed, Growing Pressure on Truss and USD/JPY
Equities give back early-week gains on hawkish Fed talk, and mixed earnings. Netflix soared 13% yesterday, but Tesla lost more than 6% after the bell, after announcing a slight revenue miss in Q3. The UK’s political turmoil gets worse by the day, and the dollar-yen tests the 150 level amid mounting expectation of a Bank of Japan (BoJ) intervention.
Overall
The market mood was rather bearish yesterday, as the major US indices gave back a part of the early week gains. The S&P500 slid 0.67%, Nasdaq gave back 0.85%, and the Dow Jones eased 0.33%.
One of the biggest gainers was Netflix which jumped 13% to meet its 200-DMA for the first time since January, while other FANG stocks, or MAMAA stocks, including Microsoft, did poorly on hawkish Fed expectations, as Minneapolis Fed President Kashkari said that the Fed could push the interest rates beyond 4.75% if inflation doesn’t stop rising. The US 2-year yield rallied above 4.50%, as the US dollar strengthened across the board.
Mixed earnings, mixed sentiment
Mixed earnings didn’t really help improve sentiment.
Procter & Gamble did better than the earnings and revenue expectations, but said that the sales for the fiscal year 2023 could fall between 1 to 3%.
Nestle reported its strongest 9-month sales growth in 14 years, mostly driven by higher prices to offset rising costs, and raised its full-year guidance. But the latter could hardly give a boost to the share price, which fell around 1.30% yesterday.
IBM also did better than analyst expectations, and boosted its full year profit forecast, and the stock lost 0.35%.
Tesla announced a better-than-expected earnings per share, but slightly missed on revenue expectations. The company said that the rising raw material prices and inefficiencies in the Berlin factory, combined to the strong US dollar weighed on results. And Tesla missing revenue expectations is not good for the stock price, as any misstep has the power of sending the share price aggressively lower. Tesla shares slipped more than 6% in the afterhours trading. That means that Tesla will be testing a critical support approaching the $200 support again, and could break it, if the market mood remains bearish.
Philip Morris and Dow are due to announce earnings today, American Express and Barclay on Friday.
Oil rebounds
The barrel of American crude rebounded yesterday, after falling toward $82 earlier this week. With the recession fears already priced in, and with the US having played its ‘strategic oil reserve’ card, there is not much left to pull the price of a barrel below the $80/82 range.
Still, offers are expected to come in play above the 50-DMA, which stands around $87 per barrel
Dear, oh dear
Liz Truss is really in a hot seat, as the chaos among the Tories got worse yesterday, after Home Secretary Braverman got fired for sharing confidential information.
It is said that many Conservative Party members want Truss to resign immediately.
Cable continued falling, while the gilt yields eased - more on the long-end of the curve as the Bank of England (BoE) said it will not be selling that part of the curve. But the Financial Times said that the UK is now paying extra money to borrow due to the ‘moron risk’, as the British leaders are a ‘few sandwiches short of a tea party’.
Elsewhere, the EURUSD remains sold below the 50-DMA and the Japanese yen continues diving against the US dollar. The dollar-yen is now testing the 150 resistance. There is, of course, a mounting speculation that the Bank of Japan (BoJ) could intervene directly at any moment, which would clean some speculative positions, but the medium run outlook remains bearish for the yen, as the growing divergence between the increasingly hawkish Fed expectations, and the soft BoJ hints that the BoJ may not stop bleeding in the yen unless it hints of adjustment in rate policy. Some analysts see the dollar-yen advance toward 160 level.
Meanwhile, Turkey is expected to cut its policy rate by another 100bp to 11%, which would push the Turkish inflation-adjusted rate down to -71.5%. But tell that to Mr. Erdogan!
EU Energy Discussions in Focus
Market movers today
Today the two-day EU Council meeting kicks off. Measures to limit energy price increases will be the main focus of the talks, but discussions about another round of EU-backed borrowing could also take place behind the scenes.
We get September producer prices from Germany. It is an interesting release given the extreme development we have seen recently, which has also spilled over to two-digit consumer price inflation. Producer price inflation stood at 45.8% in August.
In Norway, we expect the manufacturing confidence survey to show a further deterioration in growth in Q3.
The parliamentary hearing of the Riksbank will be held today at 9.00 CET, after being postponed due to the new government announcement by PM Kristersson on Tuesday.
The central bank of Turkey meets today and we expect an unchanged policy rate of 12%.
The 60 second overview
Inflation: Despite the latest decline in natural gas and oil prices, consumer price inflation will remain elevated for some time yet in Europe. Soaring food prices drove UK inflation to 10.1% in September, intensifying pressure on the government and Bank of England to act. Euro area HICP inflation was revised a tad lower in the final reading to 9.9% in September. However, underlying inflation pressures remain strong and the weakening demand environment has yet to discourage consumer price increases on a broad scale. With no victory on the inflation fighting front yet in sight, we think ECB is gearing up for another 75bp hike at the meeting next week, read more in ECB Preview - Focus on the technicalities, 19 October.
Fed: US housing starts continued their decline in September, as rising mortgage rates take their toll. But hawkish Fed comments yesterday underlined that an end to monetary tightening is not yet in sight. Bullard expects "front-loading" of aggressive hikes to end only by early next year. Kashkari also said the Fed could potentially pause its rate increases sometime next year, but sees no evidence of core inflation moderating yet and Evans said the Fed may need to do more if price pressures get worse.
Oil: The Biden administration announced that another 15 million barrels will be released from the Strategic Petroleum Reserve in December to ease high gasoline prices. The sale would complete the release of the 180mn barrels Biden committed to injecting into the market in March, but the White House has retained the option of future intervention if petrol prices rise. Strategic reserves are already at the lowest level since 1984. Oil prices held steady around USD/bbl 92.
Equities: Rising yields set the tone in equity markets. Equities broke the two-day-streak of gains with Dow -0.3%, S&P 0.7%, Nasdaq -0.9% and small caps underperforming as Russell 2000 -1.7%. Despite rates rising, financials were one of the worst performers and in fact, communication services (Netflix) and tech were among the outperformers. As rates rise due to inflation - and not growth - rising yields is not triggering the value rotation we are used to in H1 2022. Futures are lower this morning too.
FI: The German finance agency (DFA) announced an increase of the outstanding amount of 18 bonds by EUR 3bn each into their own accounts. That decision was a catalyst to a sharp sell-off in European yields and ASW tightening (-6bp tighter ASW across maturities). It was particularly the belly of the curve that underperformed by 13-15bp, while the long end rose only marginally by 2bp, yet the latter was driven by a strong rally in long-end Gilts. The additional German expenses to fight the energy crisis as well as the repo market stress were the drivers behind DFA's decision. DFA said that they would keep the funds at their Bundesbank account until year-end and over the turn of the year, but that the EUR 54bn may be included in the 2023 funding plan, which will be released in December. The repo market observed an initial relief. Spreads were broadly unchanged on the day.
FX: The shift in market sentiment has lifted the USD, while cyclically sensitive currencies are back trading on the back-foot. SEK and HUF were yesterday's biggest underperformers, but also EUR and GBP downsides vs the greenback were prominent.
Credit: Credit indices were slightly soft yesterday, where iTraxx Xover closed 3.5bp wider and Main 1.2bp wider.
Nordic macro
All leading indicators in Norway now point to a sharp slowdown in the economy, including manufacturing. We therefore expect the manufacturing confidence survey to show a further deterioration in growth in Q3, especially as new orders were already in negative territory last time around. Further, we will look for any tightening in credit standards in the Q3 senior loan survey from Norges Bank (NB). Finally, NB governor Wolden Bache will give a speech at the CME titled 'Monetary policy and inflation', which could be interesting even though NB rarely sends new signals in between MPC-meetings.
The parliamentary hearing of the Riksbank will be held today at 9.00 CET after being postponed due to the new government announcement by PM Kristersson on Tuesday. The last parliamentary hearing was held in February, just before the Riksbank U-turned, and hence today's hearing will be interesting given the high inflation and worsening economic outlook. The Riksbank will be represented by Stefan Ingves and Per Jansson.
We also get house price data from Valueguard, which we expect to continue downwards in September. Home prices in Sweden are so far down by around 7% YTD.
Elliott Wave View: Silver Needs More Downside Before a Pullback
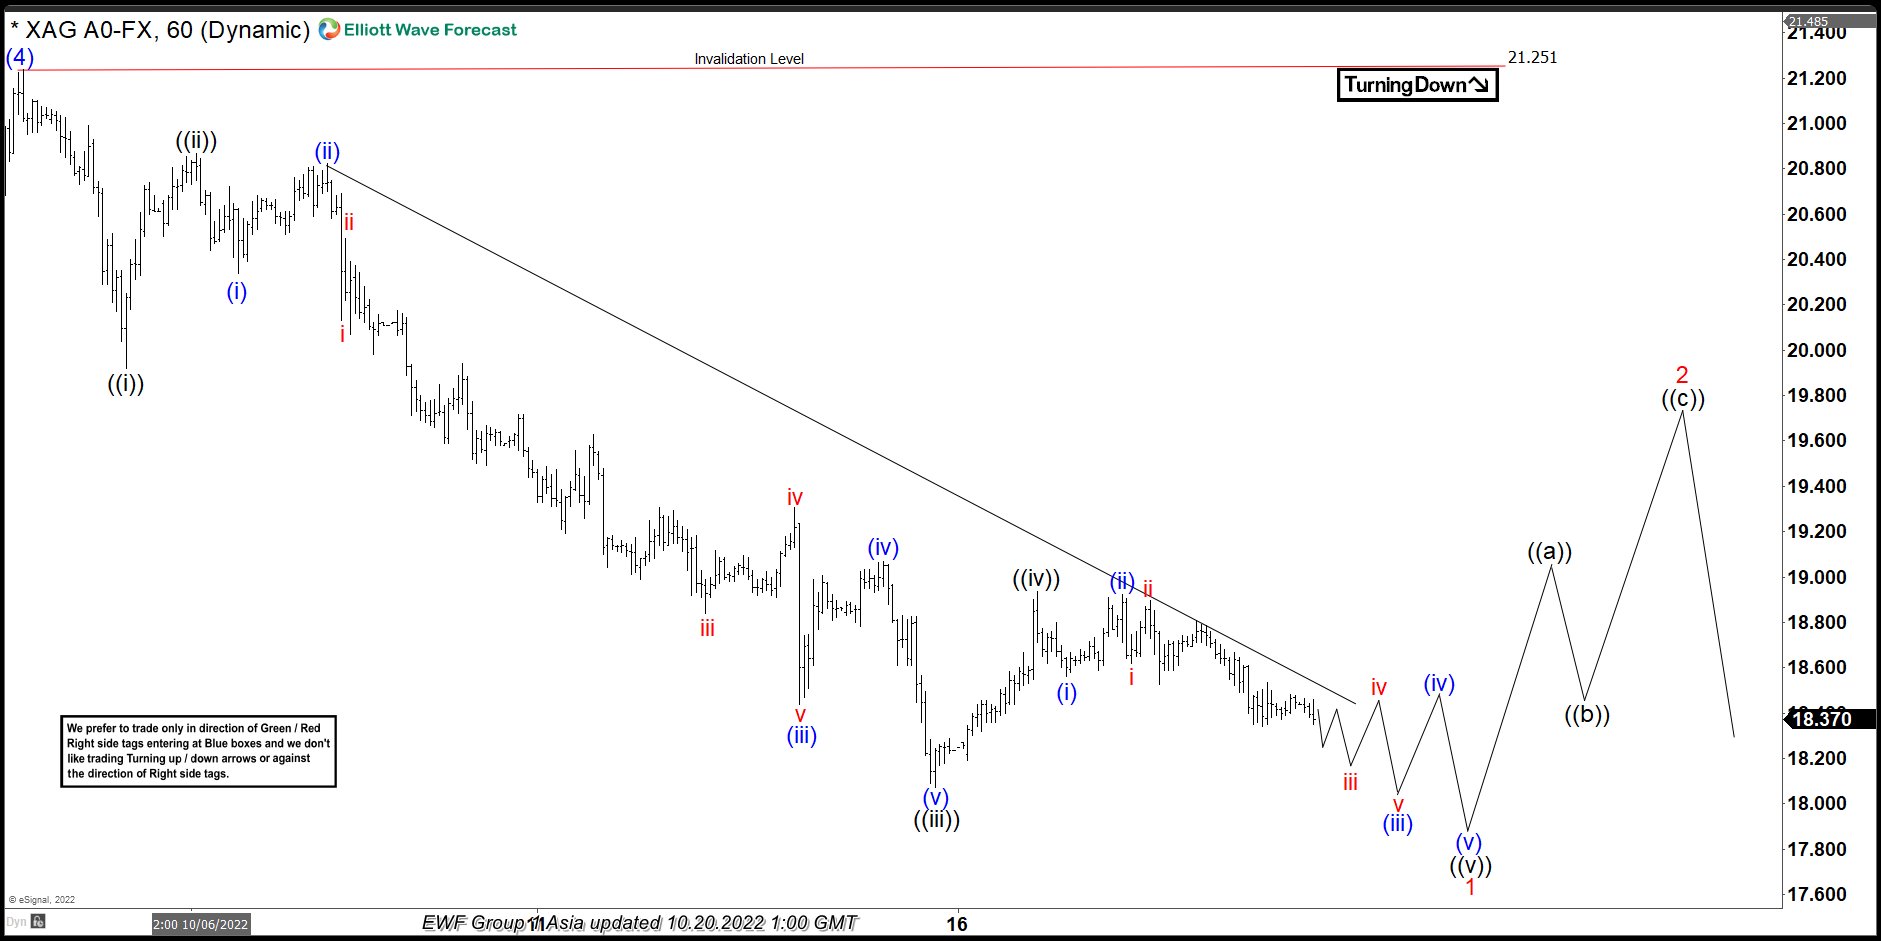
Short term Elliott Wave view on Silver (XAGUSD) continued with bearish momentum from 10.04.2022 high calling for further downside. Decline from 10.04.2022 high is unfolding as a 5 waves impulse. Down from 10.04.2022 high, wave ((i)) ended at 19.92 and rally in wave ((ii)) ended at 20.87. Then silver resumes the drop as wave ((iii)). Internal subdivision has another 5 waves in lesser degree. The 60 minutes chart below shows the internal subdivision of wave ((iii)).
Down from wave ((ii)), wave (i) ended at 20.34 and rally in wave (ii) ended at 20.82. Down from wave (ii), wave (iii) ended at 18.84 and wave (iv) ended at 19.30. Wave ((iii)) decline ended at 18.34 and wave ((iv)) ended at 19.07. Final leg lower wave ((v)) is in progress. We are expecting more downside to break 18.34 low to complete a wave ((v)) and wave 1. When the impulse lower has completed we should see a bounce in 3, 7 or 11 swings higher. This correction should fail as far as pivot at 21.25 high stays intact.
SILVER 60 Minutes Elliott Wave Chart
Technical Outlook and Review
USD/JPY:
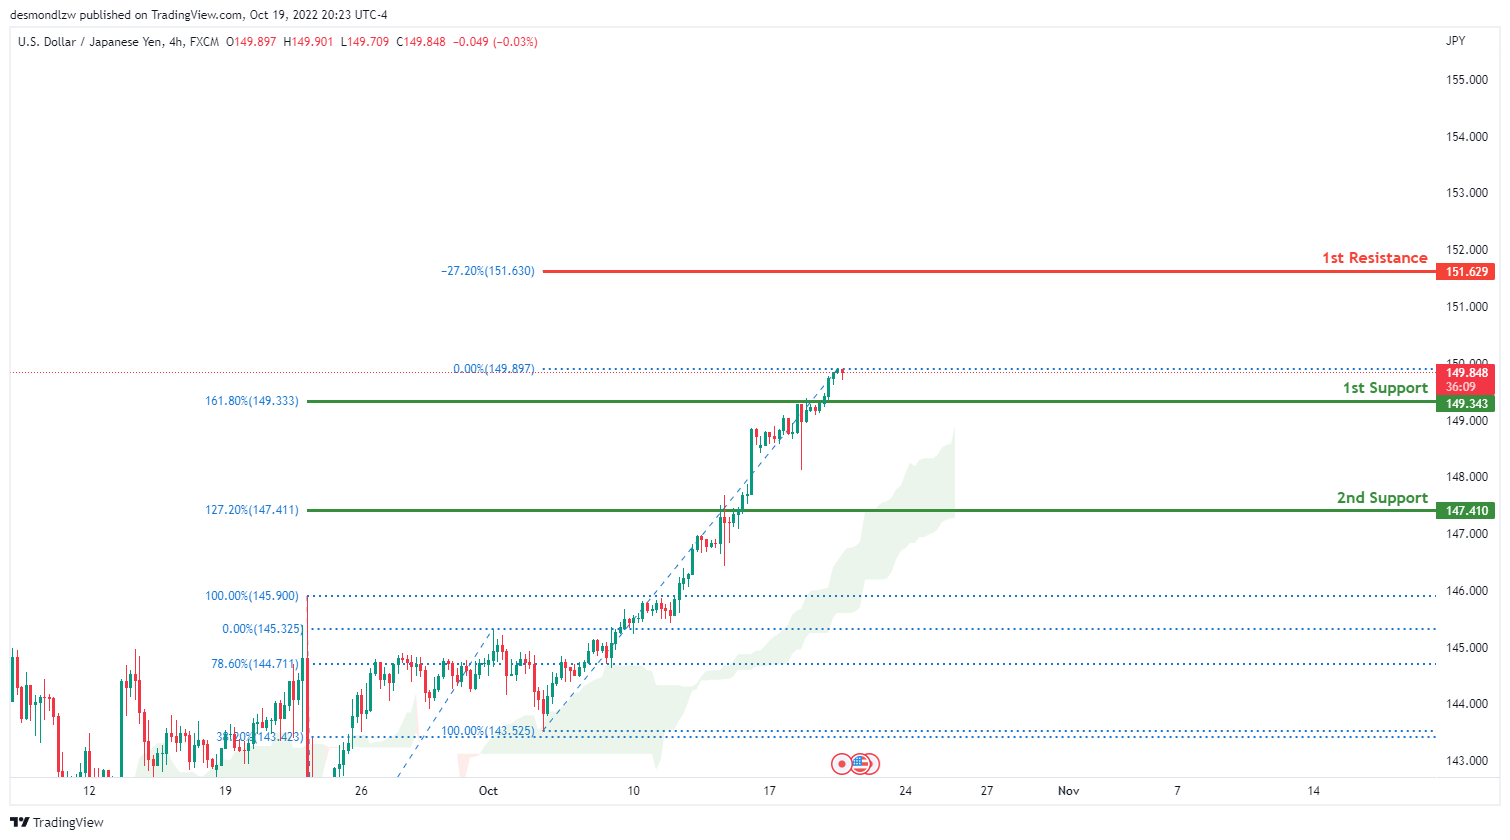
The current general bias for USDJPY on the H4 chart is bullish. To add to this bias, the price is currently trading above the Ichimoku cloud, indicating a bullish market. Price has maintained its strong bullish momentum and crossed the key level at 149.00 with price currently above the 1st support at 149.313 where the 161.8% Fibonacci extension is located. If this strong bullish momentum continues, expect price to continue towards the 1st resistance at 151.629 where the -27.2% Fibonacci expansion is located.
Areas of consideration:
- H4 time frame, 1st resistance at 151.629
- H4 time frame, 1st support at 149.313
DXY:
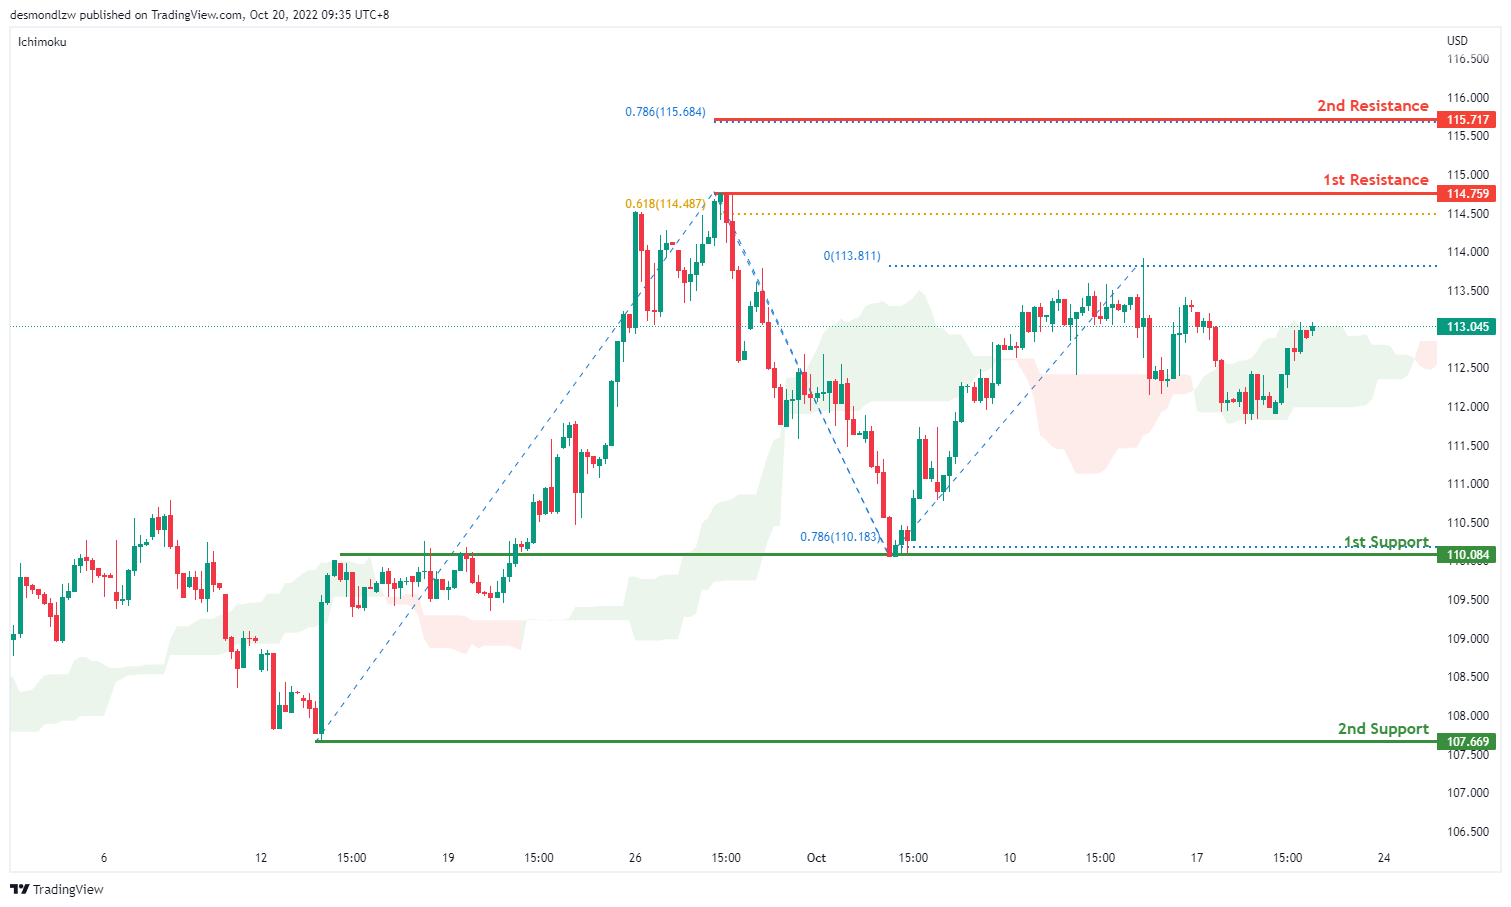
On the H4 chart, prices failed to break the ichimoku cloud and are moving in an ascending trend signalling bullish momentum. if bullish momentum continues it will bring price to 114.759 and if it breaks this level, bullish momentum will carry price to 115.717 where the 78.6% projection. Alternatively prices can move towards the first support at 110.084 where the swing low sits. if it breaks this level, bearish momentum will bring price to second support at 107.669.
Areas of consideration:
- H4 time frame, 1st resistance at 114.759
- H4 time frame, 1st support at 110.084
EUR/USD:
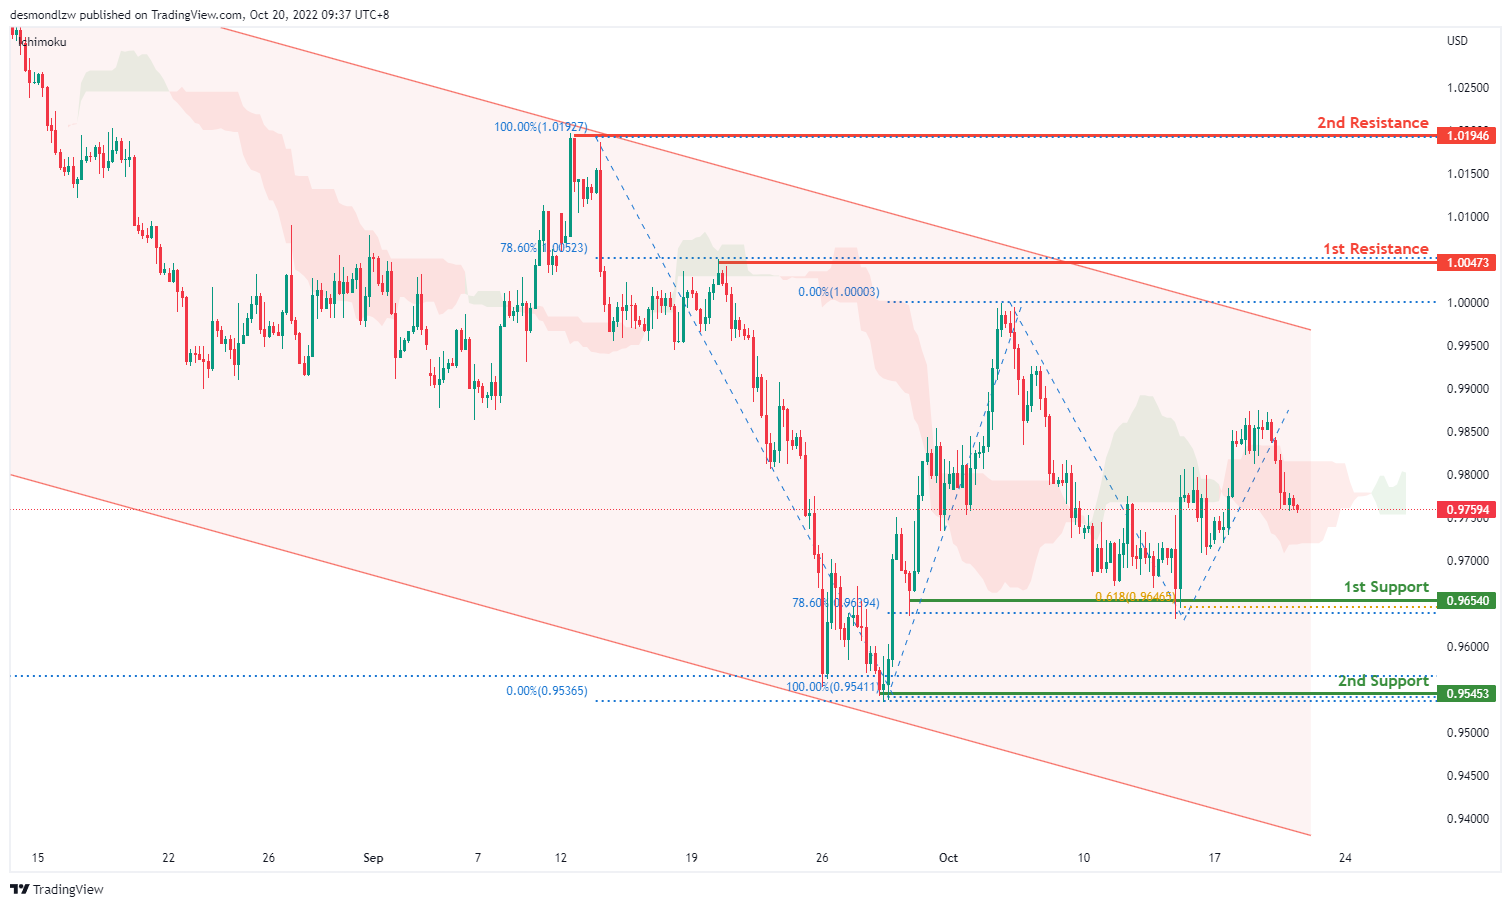
On the H4, price is moving within the descending trendline in a descending manner, with the price moving below ichimoku cloud- we are still overall bearish biased. Price has pulled back slightly and it looks like bearish momentum might bring price to 0.9695 where the 78.6% retracement sits. if it breaks this level, price would test the second support at 0.9545 where the swing low and 161.8% extension sit. Alternatively, price might test the first resistance at 1.0047 where the 78.6% retracement sits. If price breaks this level, it may test the second resistance at 1.0194, where the previous swing high sits.
Areas of consideration :
- H4 1st resistance at 1.0047
- H4 2nd resistance at 1.0194
GBP/USD:
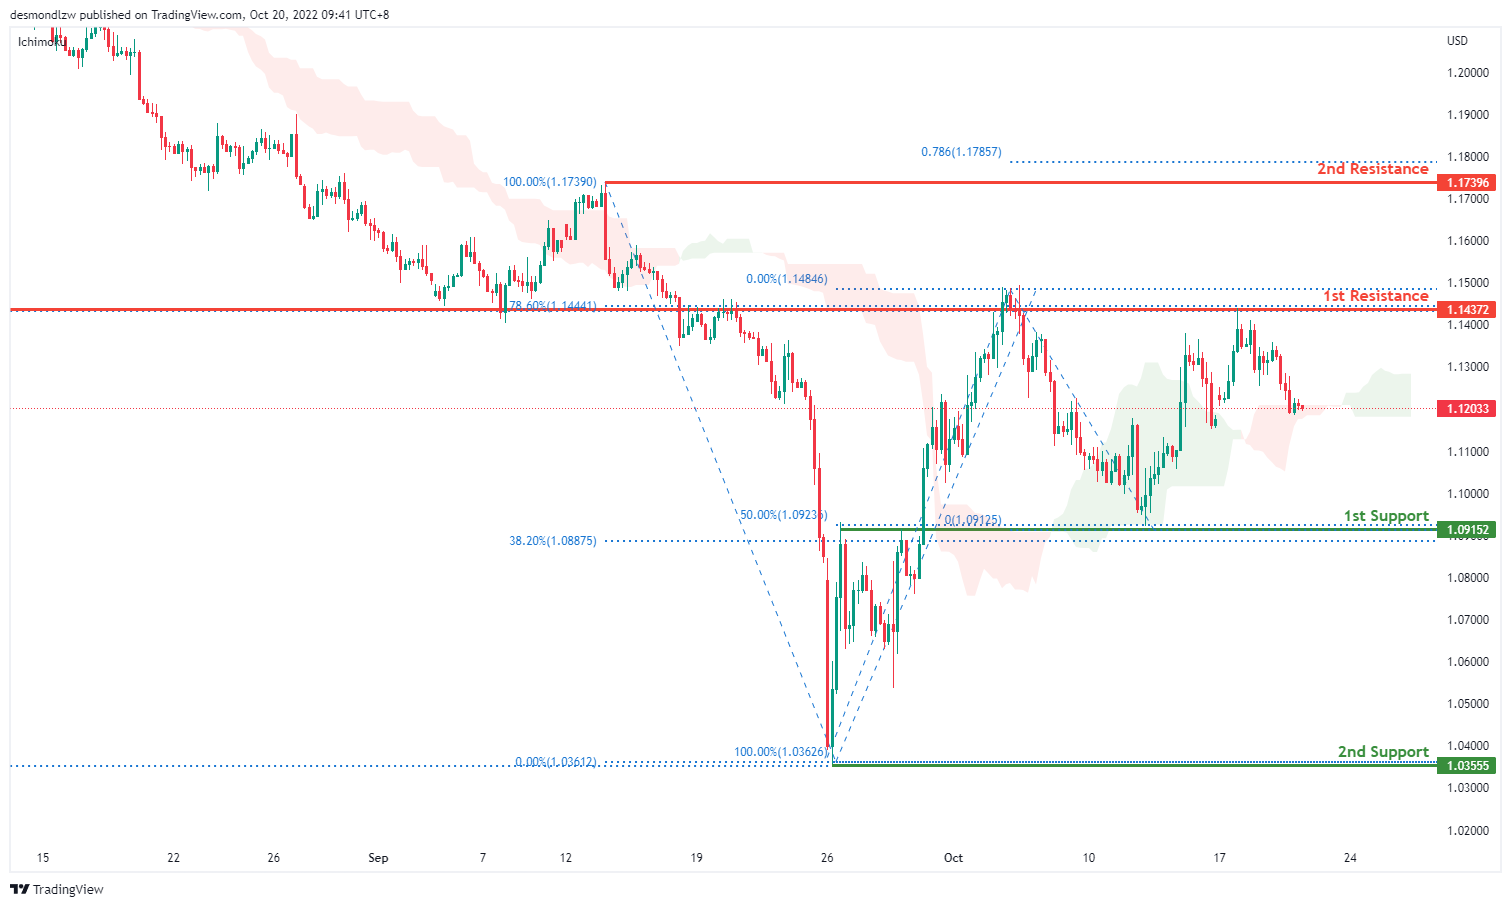
On the H4, price has rejected the resistance and is moving in a descending trend hence we are slightly bearish bias- price looks like its moving toward the first support at 1.0915 where the 50% retracement sits, bearish momentum will bring price to the second support at 1.0355 where the previous swing low sits. Alternatively, price could test the first resistance at 1.1437 where the 78.6% retracement and overlap resistance sit. If it breaks this level, it should test the second resistance at 1.1739.
Areas of consideration:
- H4 1st support at 1.0915
- H4 1st resistance at 1.1437
USD/CHF:
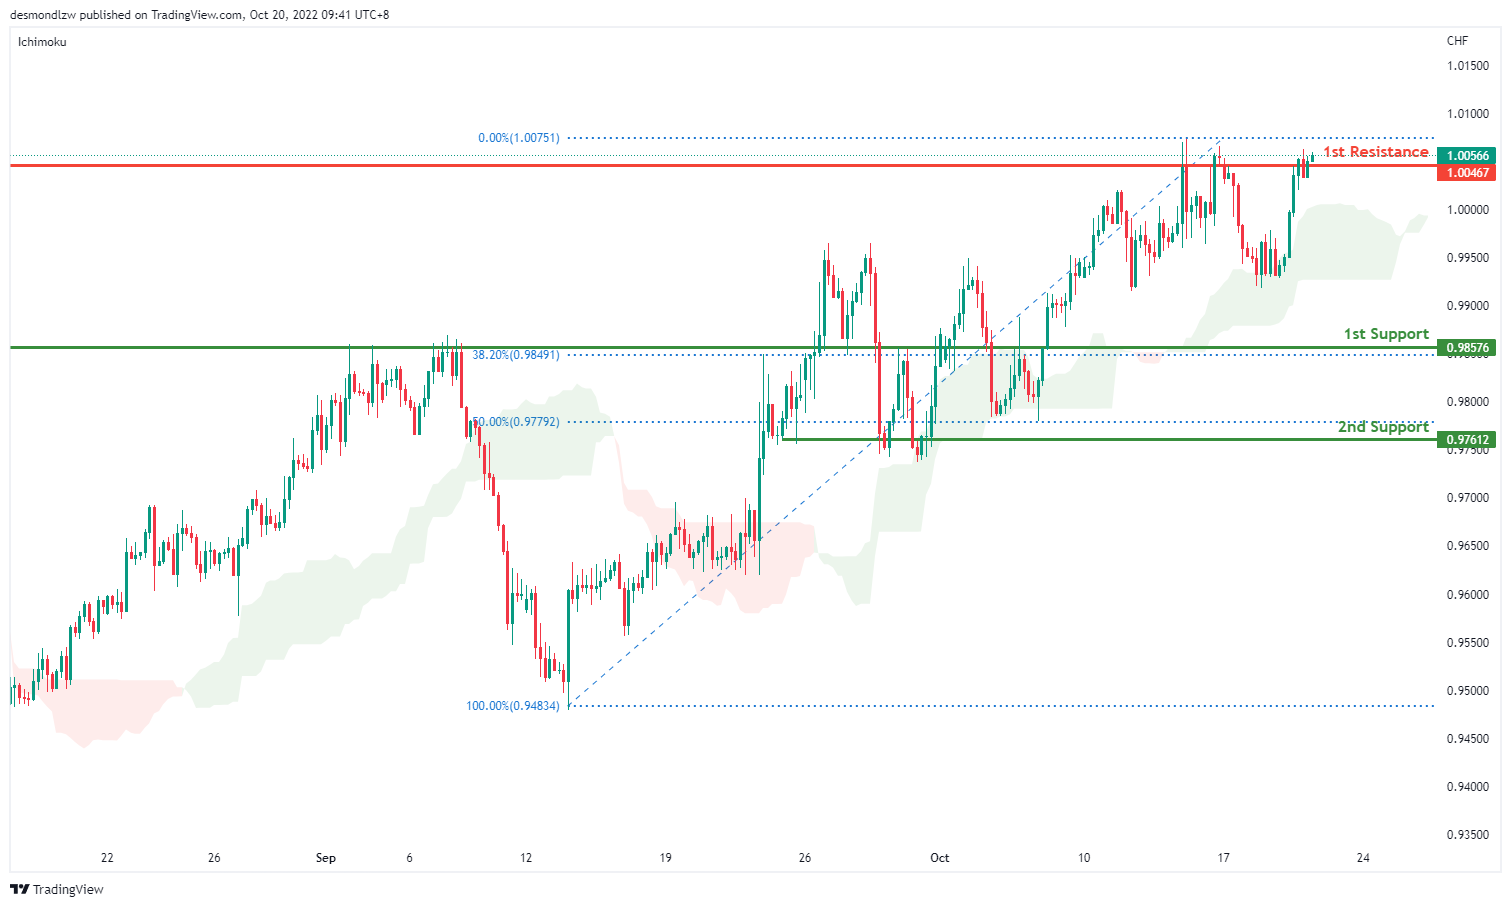
USDCHF is in a strong bullish trend on the H4 chart. Price is trading above the Ichimoku cloud signalling a bullish trend. Price is testing the first resistance at 1.0046 where the previous swing high sits. Bullish momentum could potentially drive prices up to 1.0220. Alternatively, bearish momentum could bring price to test the first support at 0.9857 where the overlap support and 38.2% retracement sits then the second support at 0.9757 where the 50% retracement sits
Areas of consideration
- H4 1st support at 0.9868
- H4 1st resistance at 1.0046
XAU/USD (GOLD):
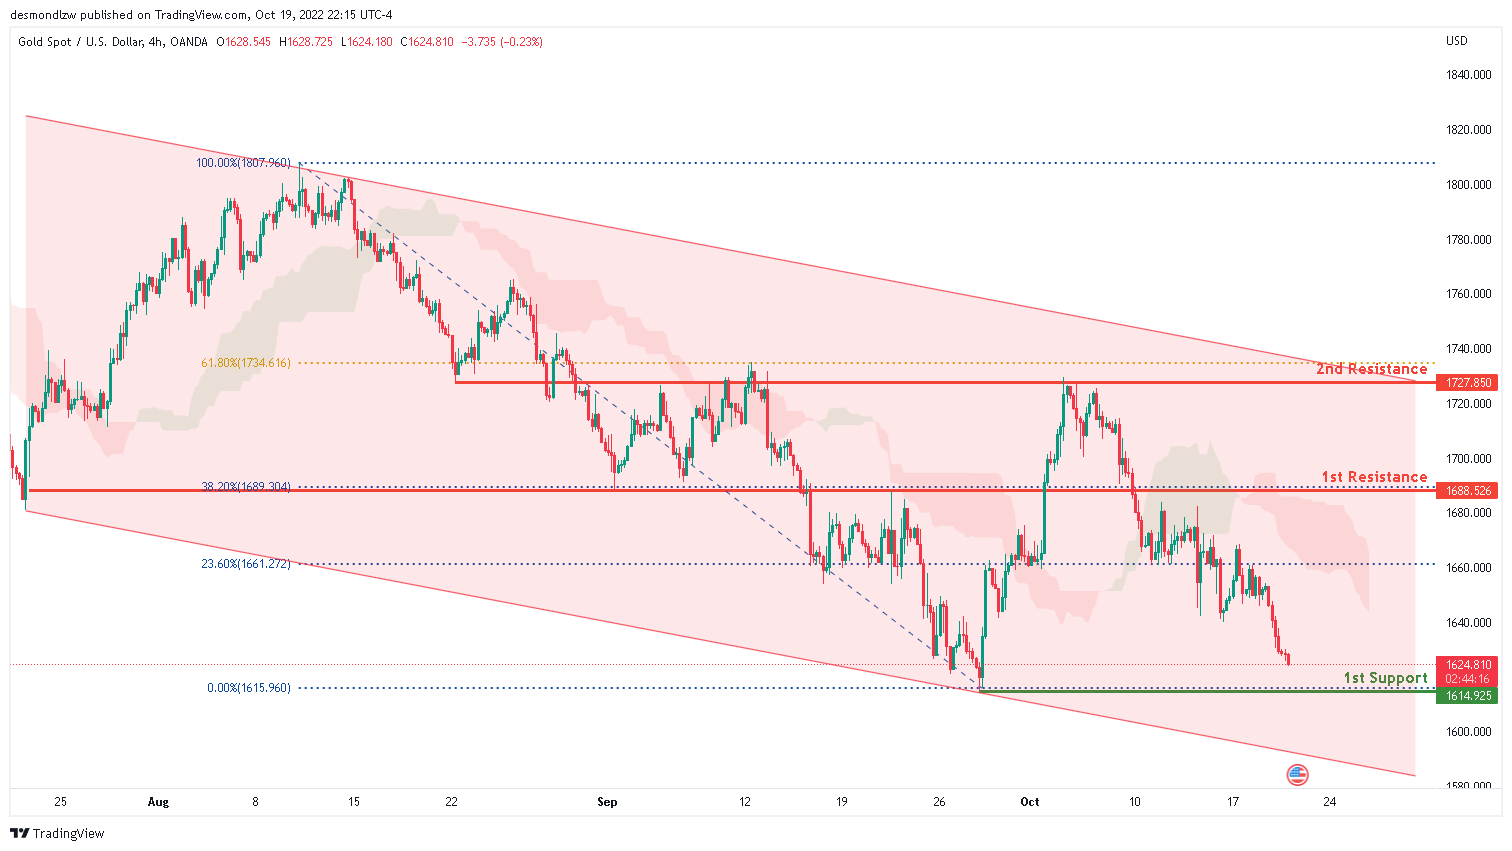
On the H4 chart, the overall bias for XAUUSDis bearish. To add confluence to this, price is below the Ichimoku cloud which indicates a bearish market. Overnight, price has continued it’s bearish momentum downwards. Expecting price to reach the 1st support at 1614.925 where the previous low and 0% Fibonacci line is located.
Areas of consideration:
- H4 time frame, 1st support at 1614.925
- H4 time frame, 1st resistance at 1688.526
AUD/USD:
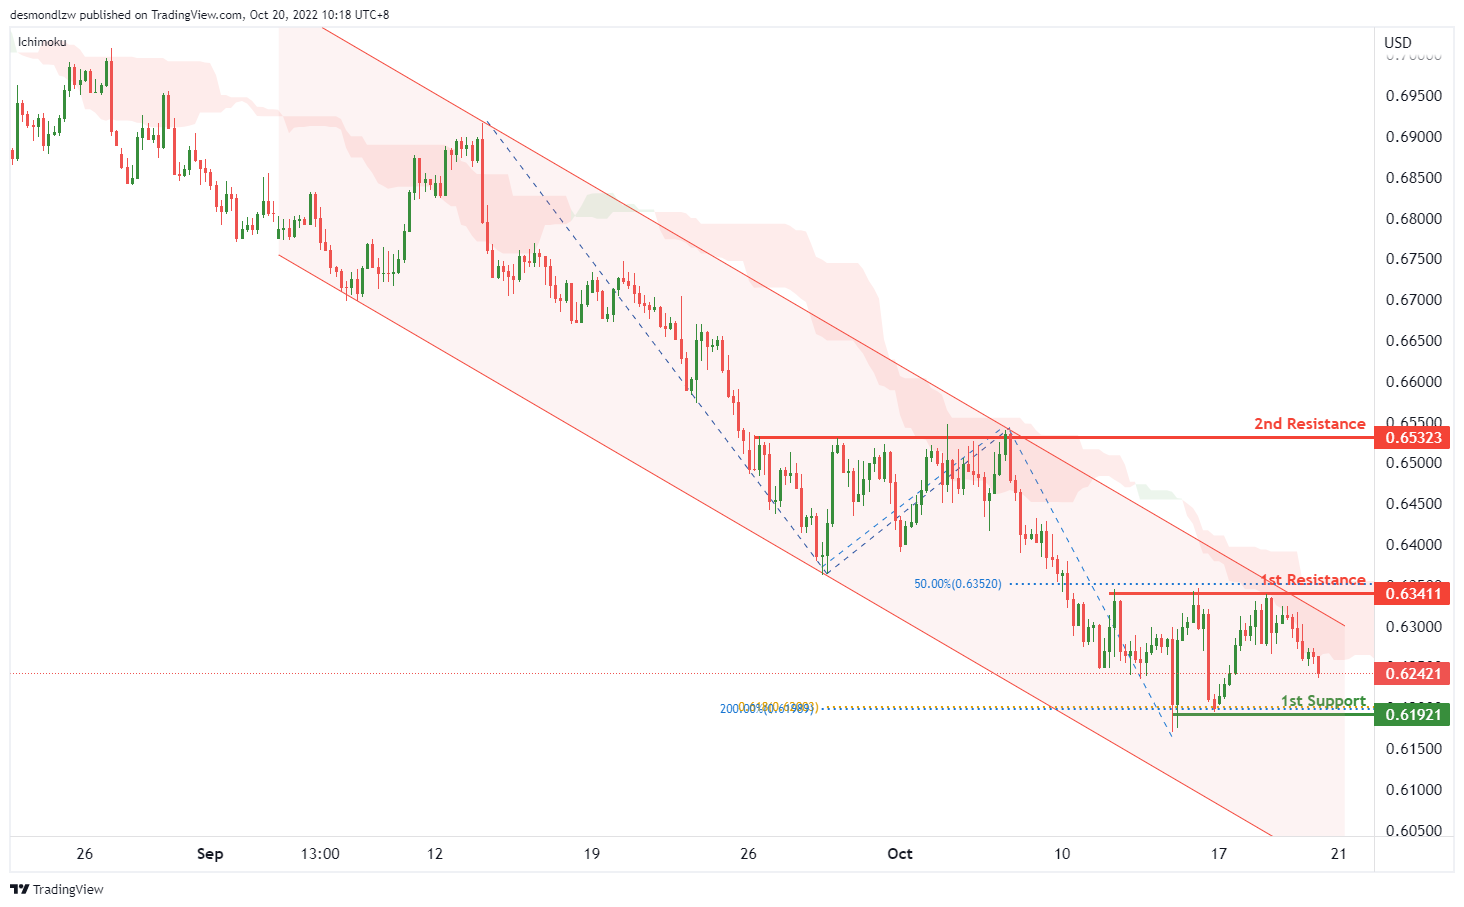
On the H4, the price is dropping from the 1st resistance at 0.63411, with the price is below the descending channel and ichimoku cloud, we can expect the price test the 1st support at 0.61921, where the previous swing low, 61.8% fibonacci projection and 200% fibonacci extension are. Alternatively, the price may retest the 1st resistance and then rise to the 2nd resistance at 0.65323, which is in line with the overlap resistance.
Areas of consideration
- H4, 1st resistance at 0.63411
- H4, 1st support at 0.61921
NZD/USD:
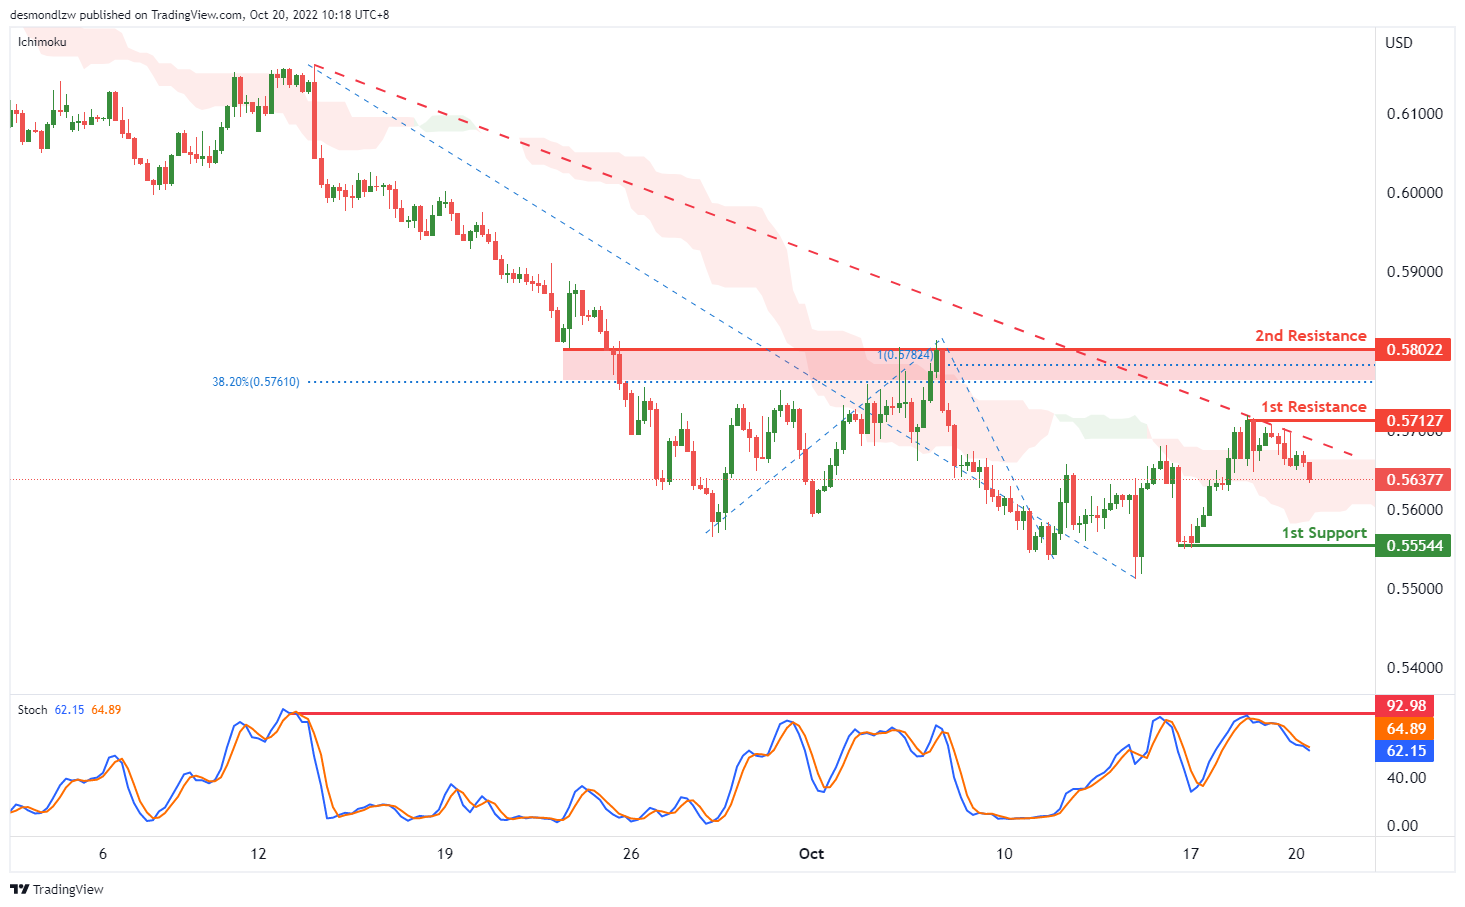
On the H4, the price is below the ichimoku cloud and descending trendline, we can expect the price to drop to the 1st support at 0.55544, where the swing low support is. Alternatively, the price may rise to the 1st resistance at 0.57127, where the previous swing high is. If the 1st resistance level is broken, the 2nd resistance level is at 0.58022, where the previous swing high, 100% fibonacci projection and 38.2% fibonacci retracement are.
Areas of consideration:
- H4 time frame, 1st resistance at 0.57127
- H4 time frame, 1st support at 0.55544
USD/CAD:
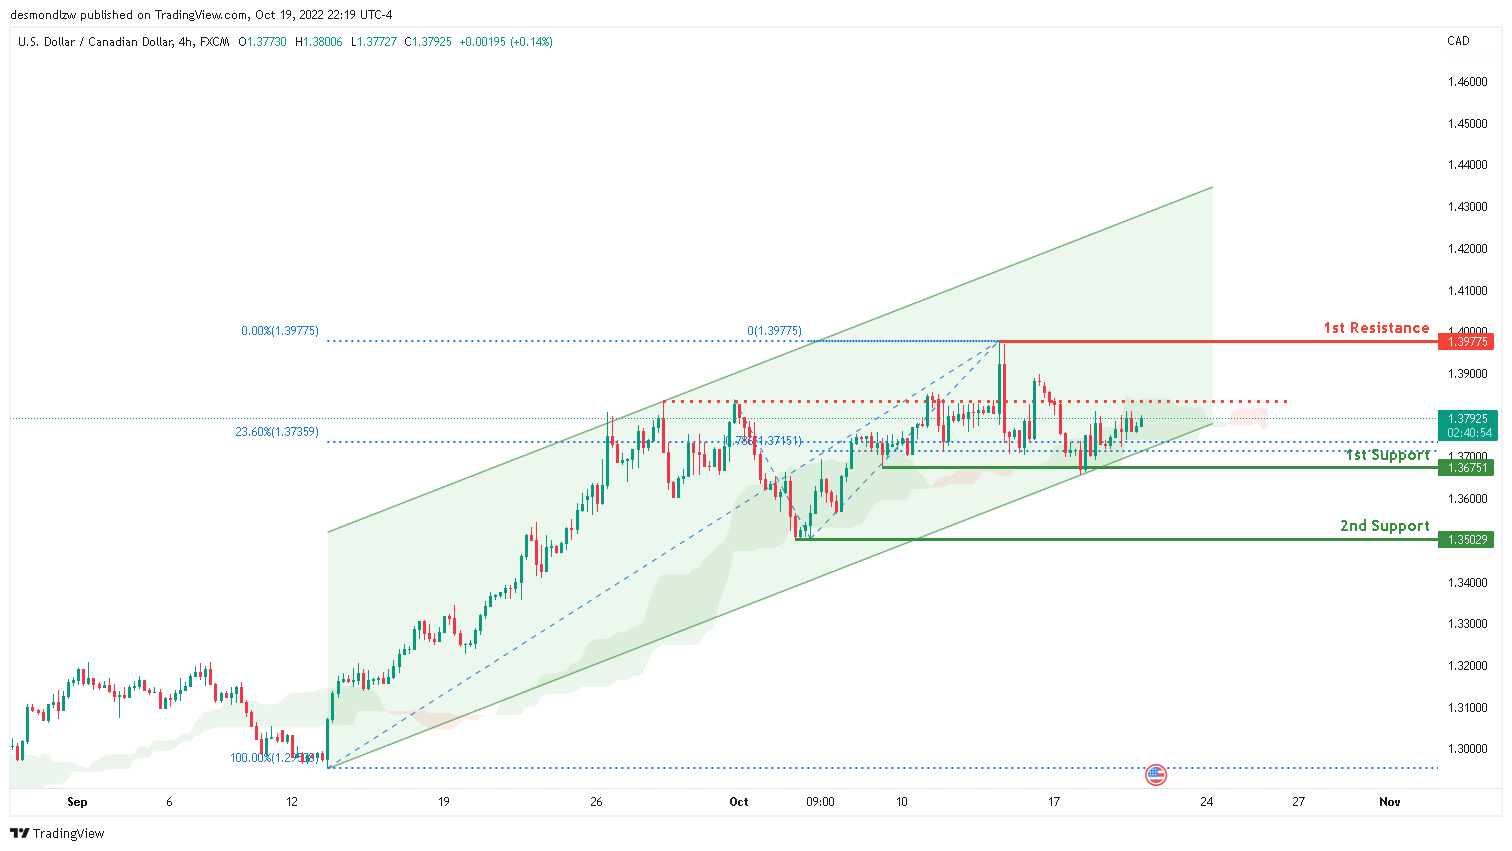
The overall bias for USDCAD on the H4 chart is bullish. Price has a weak bullish momentum upwards overnight. If the bullish trend continues, price might head towards the first resistance level at 1.3967, where the previous high is located.
Areas of consideration:
- H4 time frame, 1st resistance at 1.3967
- H4 time frame, 1st support at 1.36751
OIL:
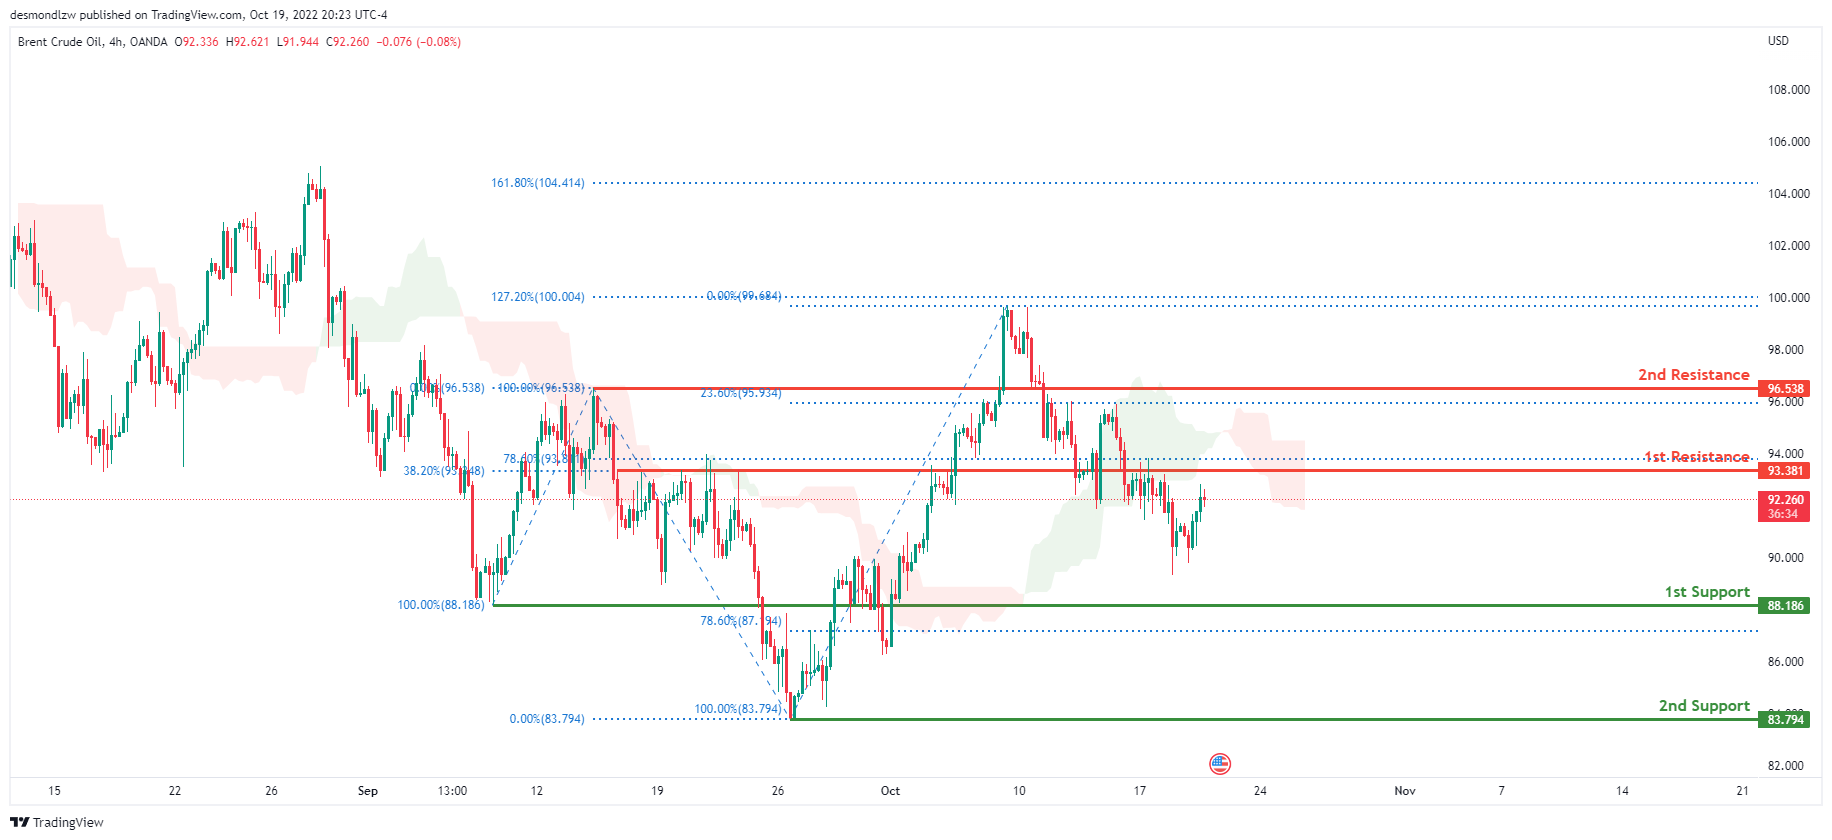
Looking at the H4 chart, the current overall bias for Oil is bearish. To add confluence to this bias, the price is currently below the Ichimoku cloud which indicates a bearish market. Overnight, price had a slight bullish momentum back up towards the 1st resistance line at 93.381 where the 38.2% and 78.6% Fibonacci lines are located. Expect the price to tap onto the 1st resistance today if this short term bullish momentum continues.
Areas of consideration:
- H4 time frame, 1st resistance at 93.381
- H4 time frame, 1st support at 88.186
Dow Jones Industrial Average:
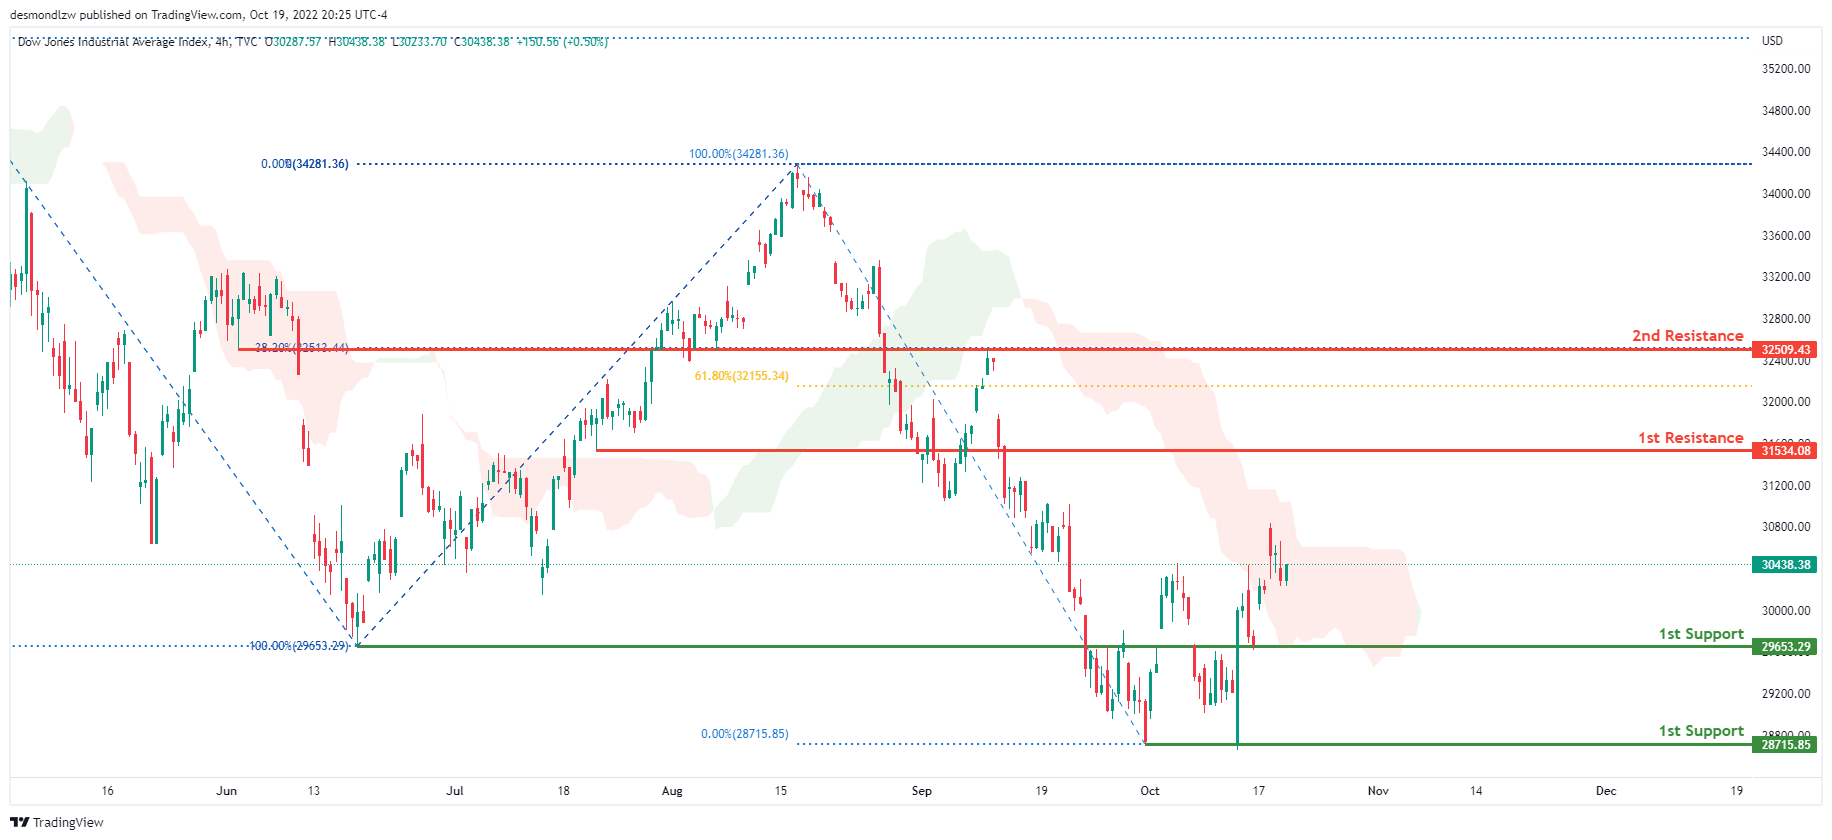
According to the H4 chart, DJI now has a bearish overall bias. Price maintained its bullish upward momentum overnight. Expect the price to potentially move toward the first resistance at 30982.97, where the 38.2% Fibonacci line is placed, if this short-term bullish momentum persists.
Areas of consideration:
- H4 time frame, 1st support at 29653.29
- H4 time frame, 2nd support at 28715.85
- H4 time frame, 1st Resistance at 30982.97
DAX:
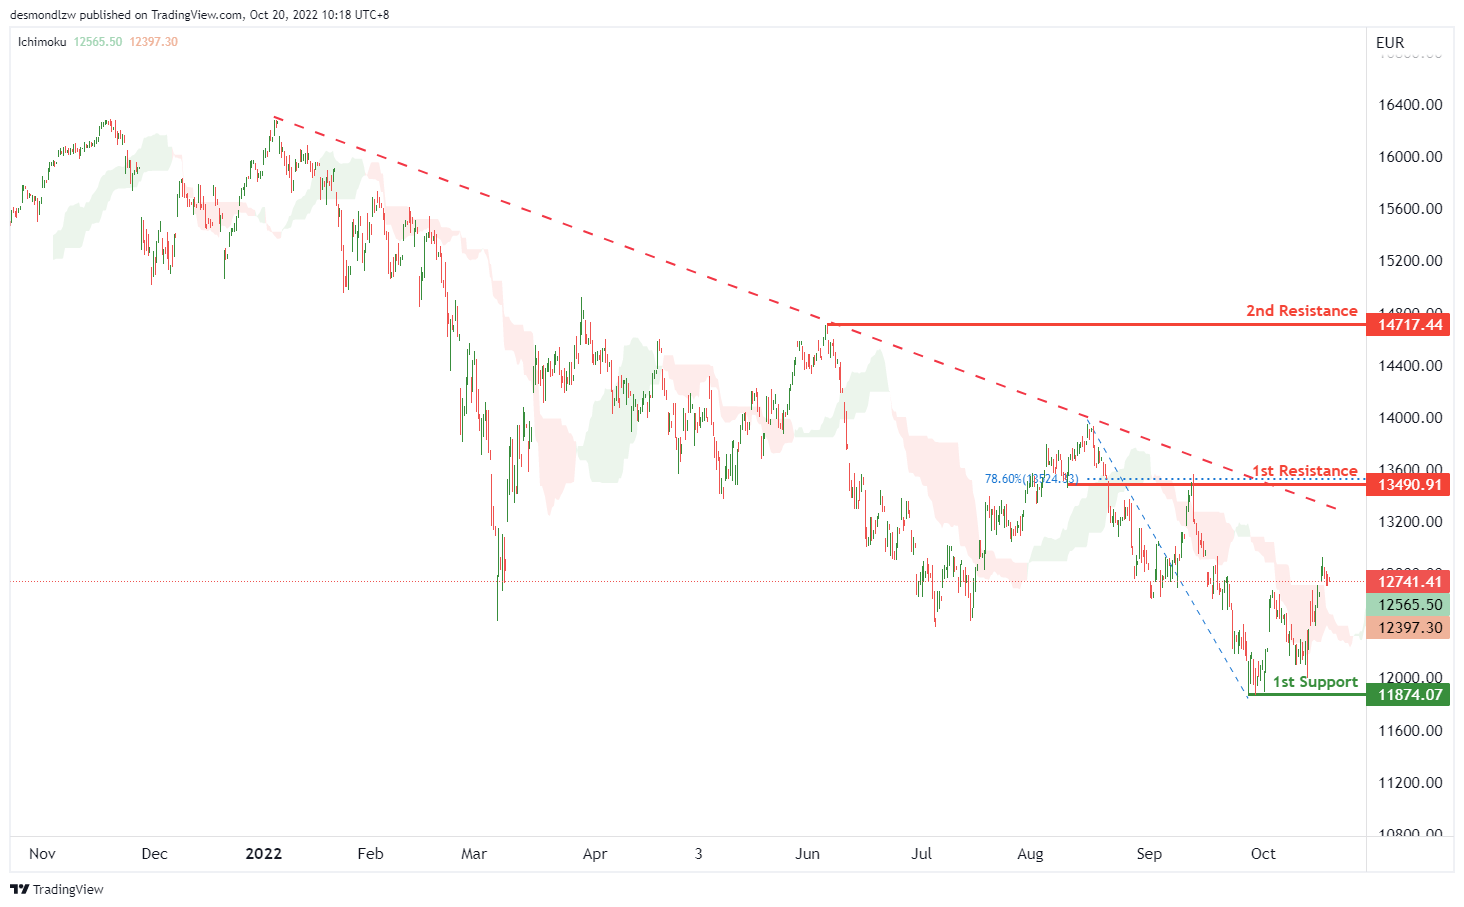
On the H4, as the price is crossing the ichimoku cloud, we can expect the price to break the 1st resistance at 13490.91, where the overlap resistance and 78.6% fibonacci retracement are. If the 1st resistance is broken, the 2nd resistance is at 14717.44, which is in line with the previous swing high. Alternatively, as the price is below the descending trendline, the price may drop to the 1st support at 11874.07, which is in line with the swing low.
Areas of consideration:
- H4 time frame, current price
- H4 time frame, 1st resistance at 12668.06
ETHUSD:
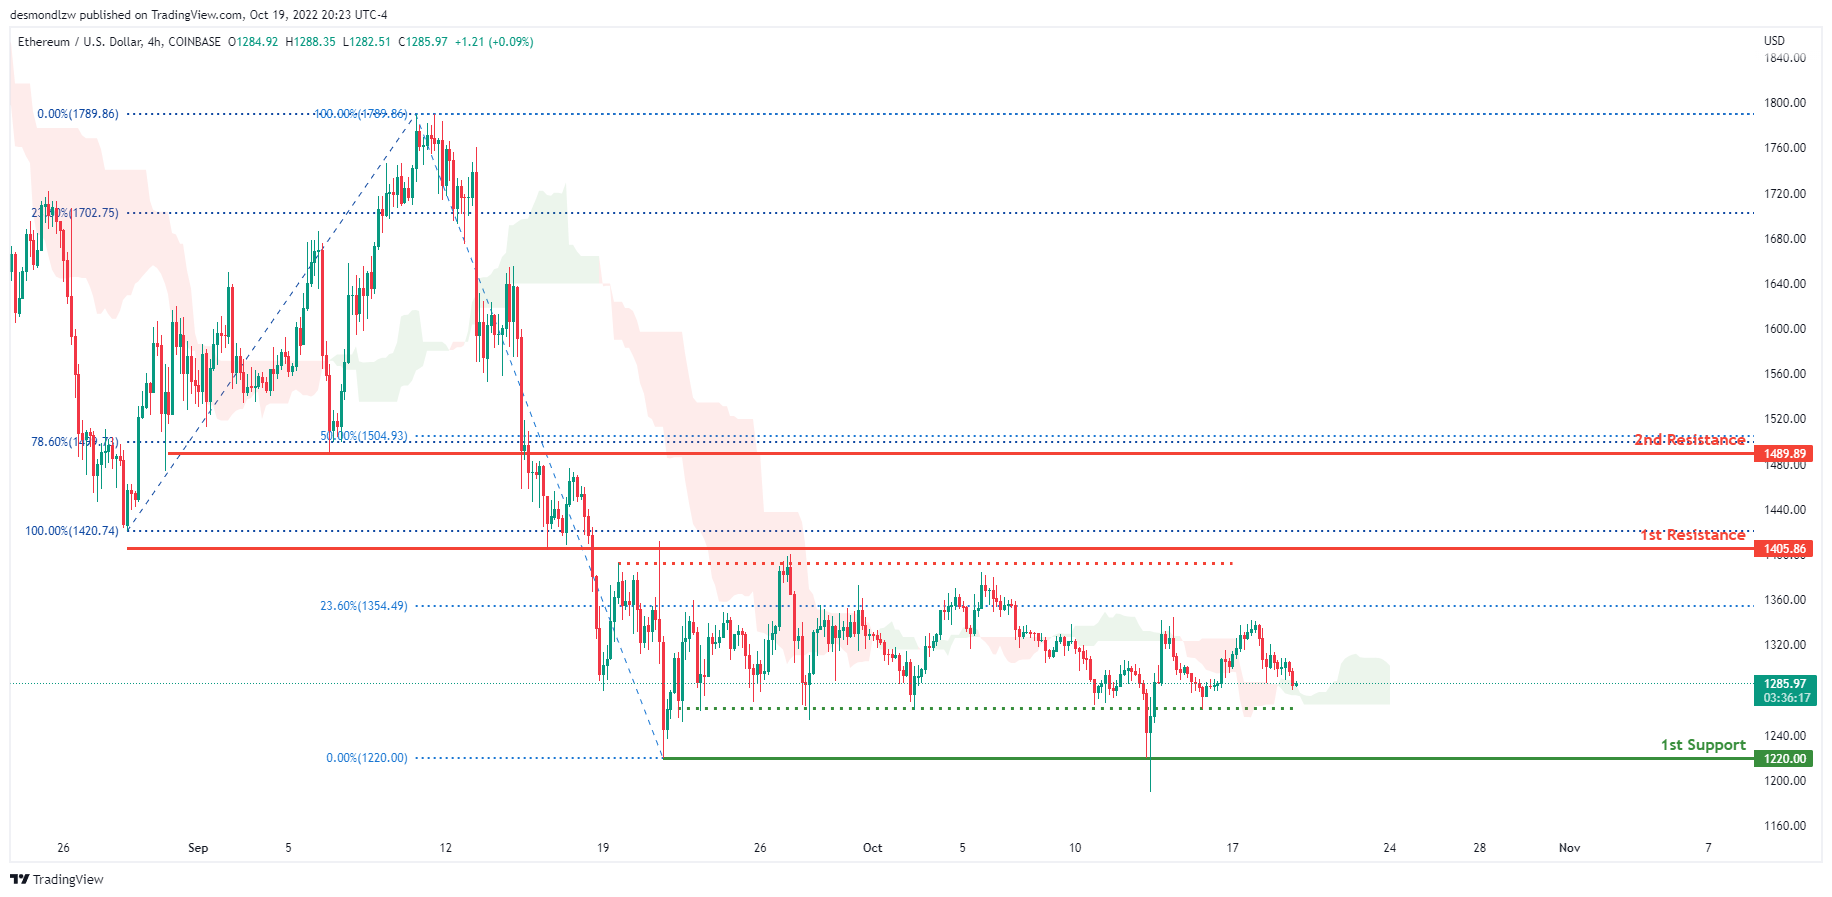
Looking at the H4 chart, the current overall bias for ETHUSD is bearish. However overnight, price has closed above the Ichimoku cloud which might indicate a short term bullish momentum. For the past 1 month, price has been consolidating between the 1st resistance at 1405.86 and 1st support at 1405.86. Expecting price to continue consolidating in this area with no clear signs of direction.
Areas of consideration:
- H4 time frame, 1st resistance of 1405.86
- H4 time frame, 1st support at 1220.00
BTCUSD:
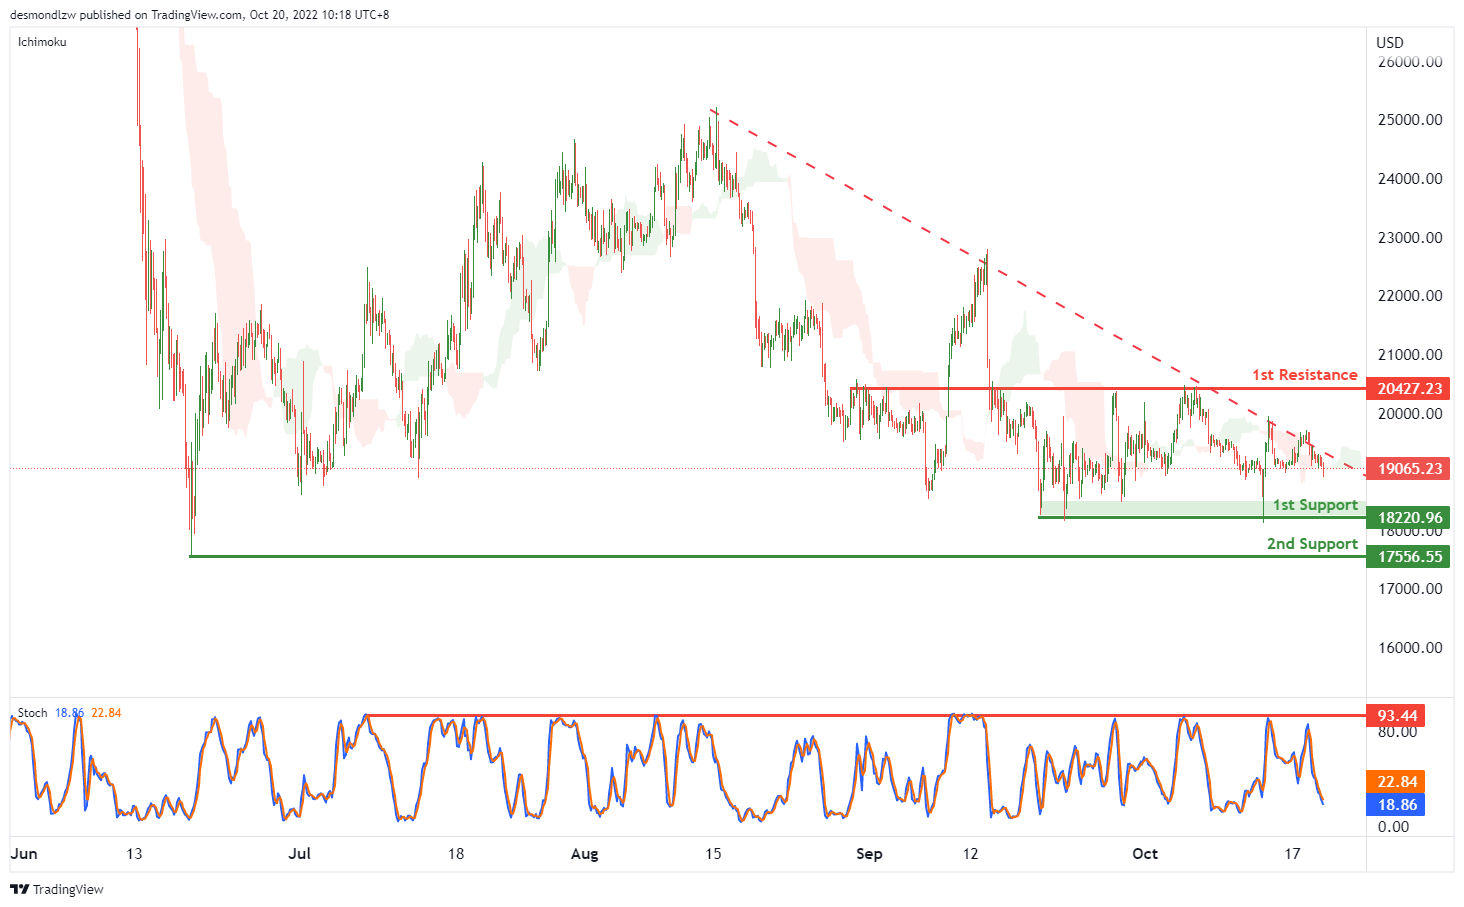
On the H4, price is crossing ichimoku cloud, and Stoch is dropping from the resistance, we have a bearish bias that the price may drop to the 1st support at 18220.96, which is in line with the previous swing lows and if the 1st support is broken, the 2nd support is at 17556.55, where the previous swing low is. Alternatively, the price may rise to the 1st resistance at 20427.23, where the overlap resistance and 50% fibonacci retracement are.
Areas of consideration:
- H4 time frame, current price
- H4 time frame, 1st support at 18220.96
S&P 500:
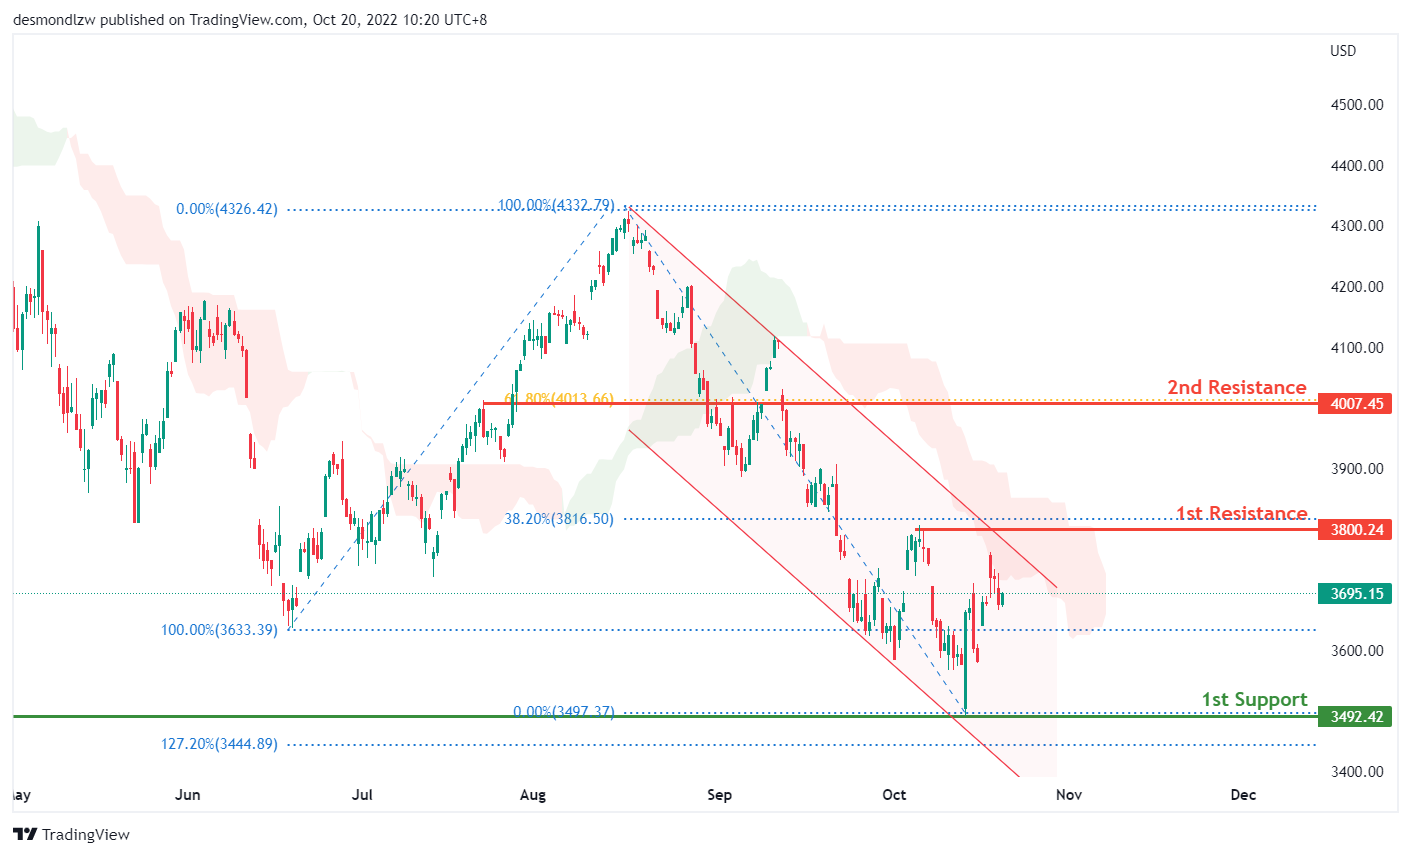
Based on the H4 chart, the S&P500 is still within the bearish channel and has retraced from the the 1st resistance of 3800, which is in line with the 38.2% fibonacci retracement level and previous swing high. We have a short term bearish bias that price could trade lower towards the 1st support of 3492.42 which is in line with the previous swing low.
Areas of consideration:
- H4 time frame, 1st support at 3492.42
- H4 time frame, 1st resistance at 3800
- H4 time frame, 2nd resistance at 4007.4
GBP/JPY Daily Outlook
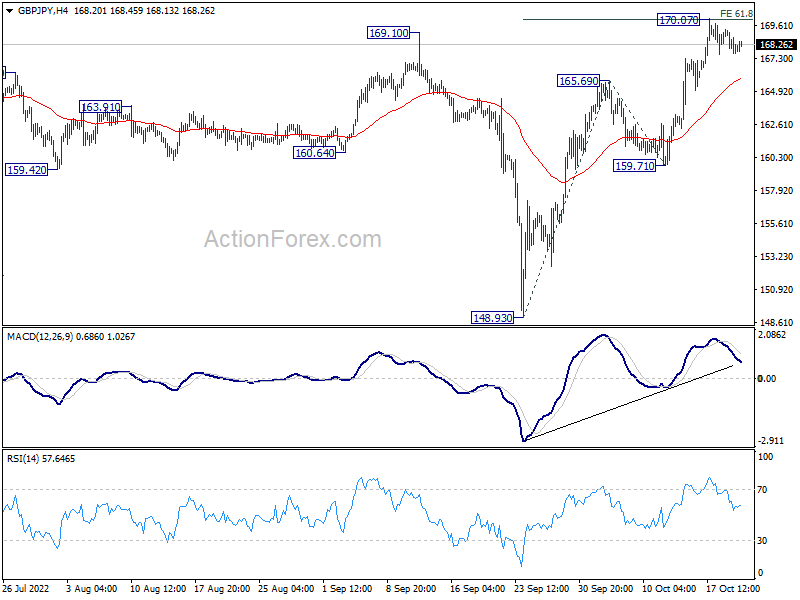
Daily Pivots: (S1) 167.41; (P) 168.40; (R1) 169.15; More...
Intraday bias in GBP/JPY is turned neutral first as consolidation from 170.07 is extending. Downside of retreat should be contained above 159.71 support to bring another rally. Break of 170.07 will target 100% projection of 148.93 to 165.69 from 159.71 at 176.47
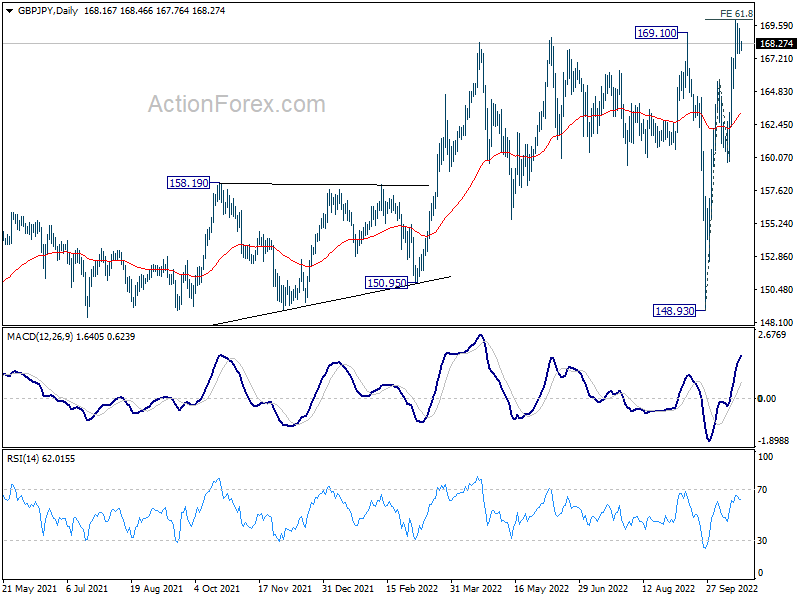
In the bigger picture, current development suggests that up trend from 123.94 (2020 low) is still in progress. Sustained break of 61.8% retracement of 195.86 (2015 high) to 122.75 (2016 low) at 167.93 will pave the way to retest 195.86 high. This will now remain the favored case as long as 148.93 support holds.
EUR/JPY Daily Outlook
Daily Pivots: (S1) 145.97; (P) 146.61; (R1) 147.14; More....
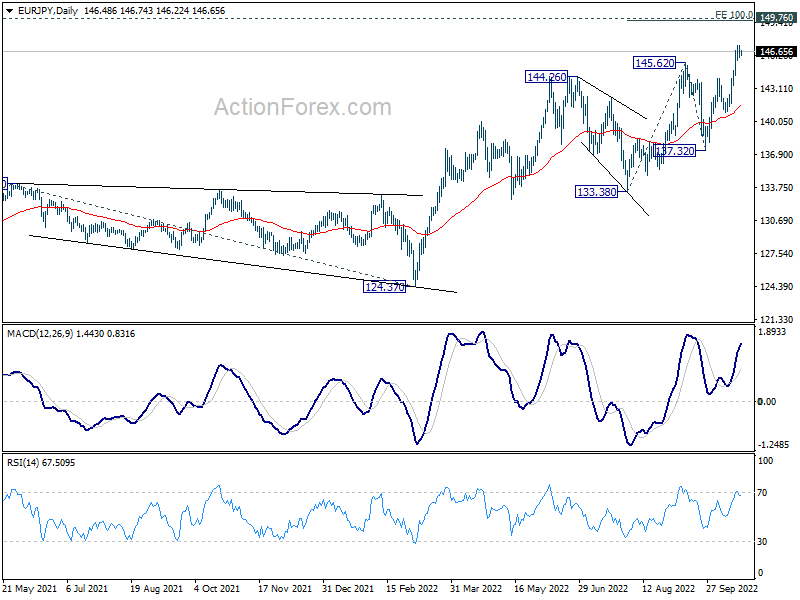
Intraday bias in EUR/JPY is turned neutral first as consolidation from 147.24 is extending. Downside of retreat should be contained by 144.06 resistance turned support On the upside, break of 147.24 will resume larger up trend. Next target is 100% projection of 133.38 to 145.62 from 137.32 at 149.56, which is close to 149.76 long term resistance.
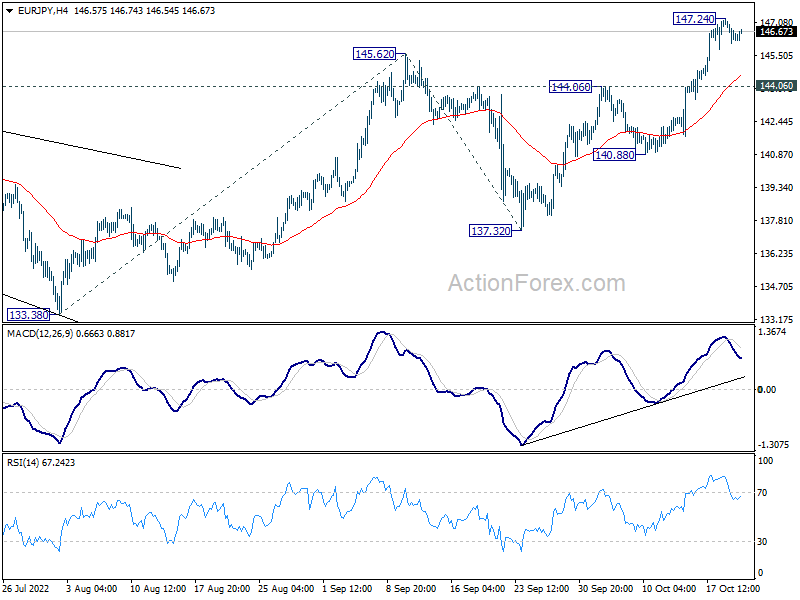
In the bigger picture, the up trend from 114.42 (2020 low) is still in progress for 149.75 (2014 high). Decisive break there will pave the way to 161.8% projection of 114.42 to 134.11 from 124.37 at 156.22. This will now remain the favored case as long as 137.32 support holds.