Sample Category Title
Technical Outlook and Review
USD/JPY:
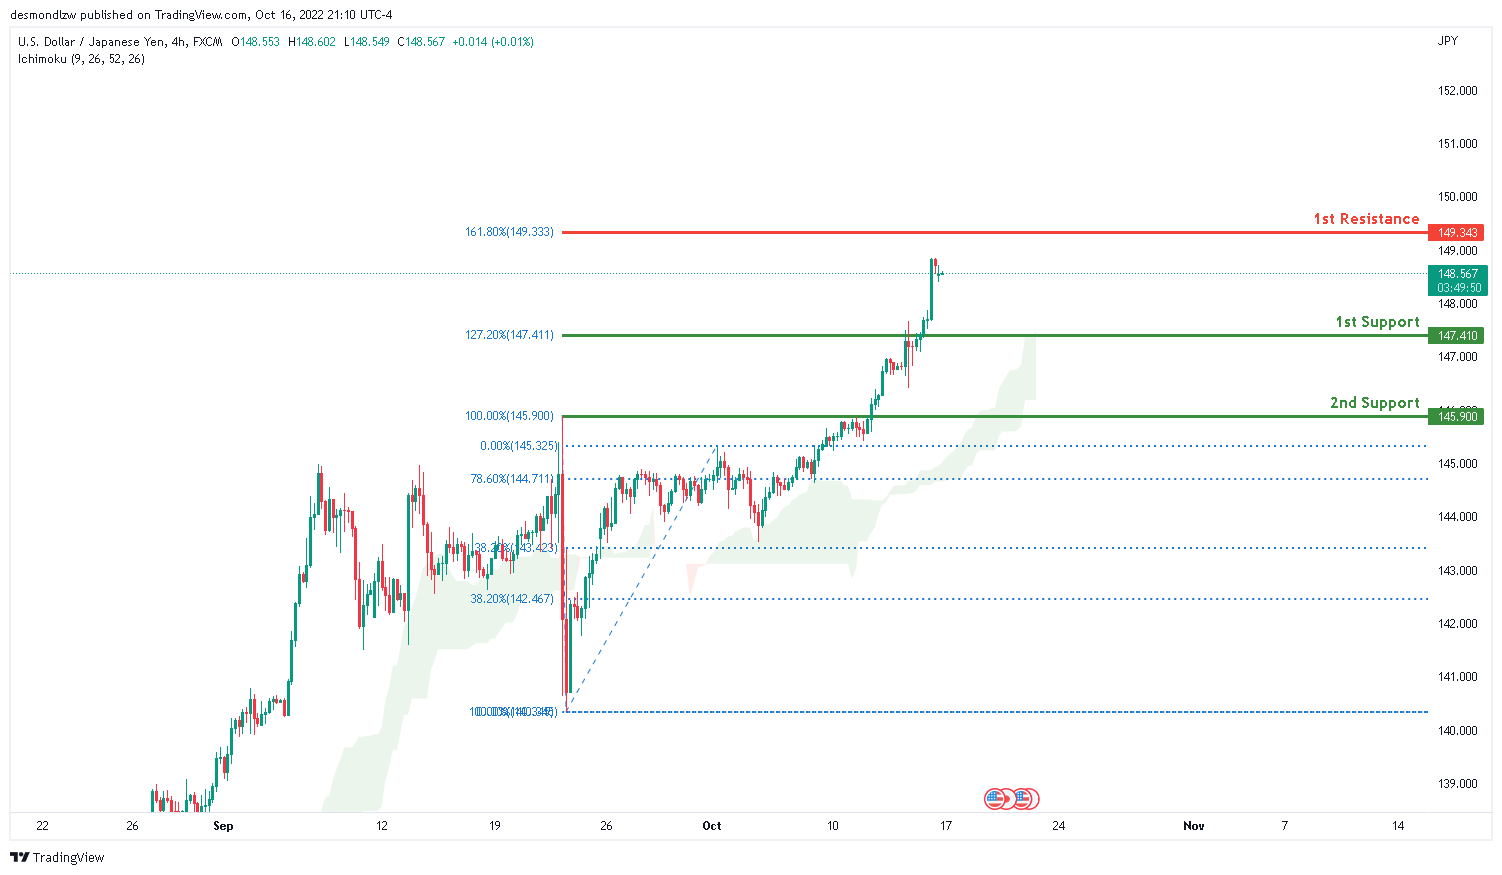
The current general bias for USDJPY on the H4 chart is bullish. To add to this bias, the price is currently trading above the Ichimoku cloud, indicating a bullish market. Price has maintained its strong bullish momentum and crossed the key level at 147.410, which contains the 127.2% Fibonacci extension line where the 1st support lies. If this strong bullish momentum continues, expect price to continue towards the 1st resistance at 149.313 where the 161.8% Fibonacci extension is located.
Areas of consideration:
- H4 time frame, 1st resistance at 147.410
- H4 time frame, 1st support at 145.900
DXY:
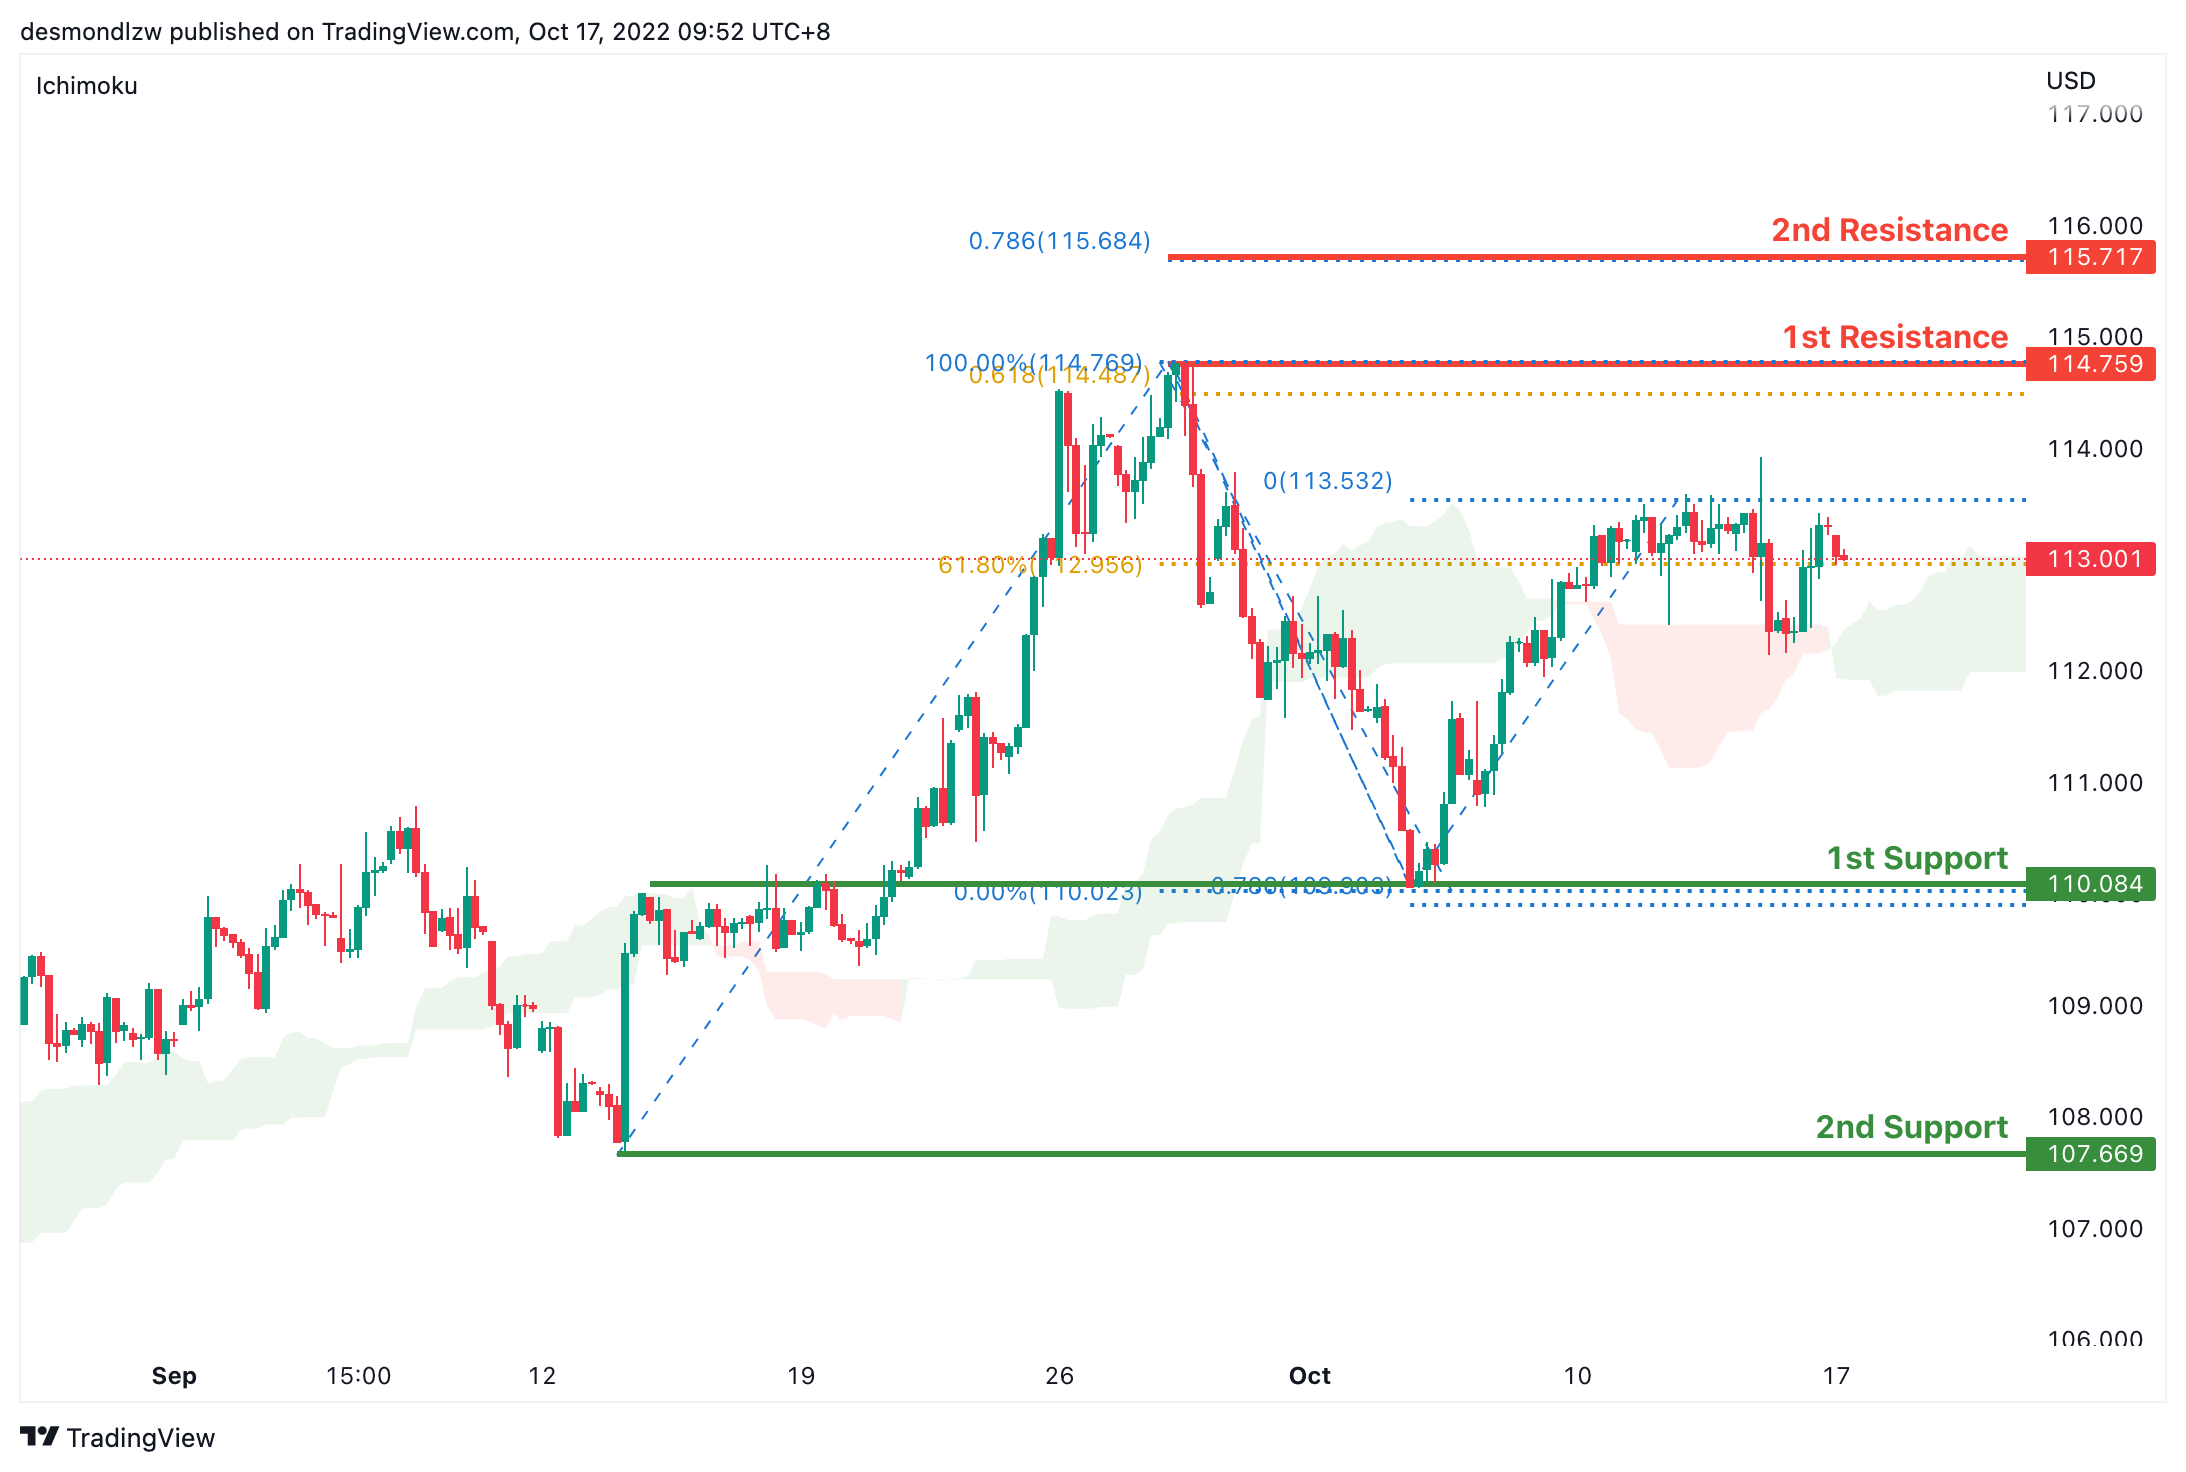
On the H4 chart, prices are moving in an ascending trend signalling an overall bullish momentum. Prices are moving towards the first first resistance at 114.759 where the previous swing high sits. If bullish momentum continues it will bring price to 115.717 where the 78.6% projection. Alternatively it could move to the first support at 110.084 where the swing low sits. if it breaks this level, bearish momentum will bring price to second support at 107.669.
Areas of consideration:
- H4 time frame, 1st resistance at 114.759
- H4 time frame, 1st support at 110.084
EUR/USD:
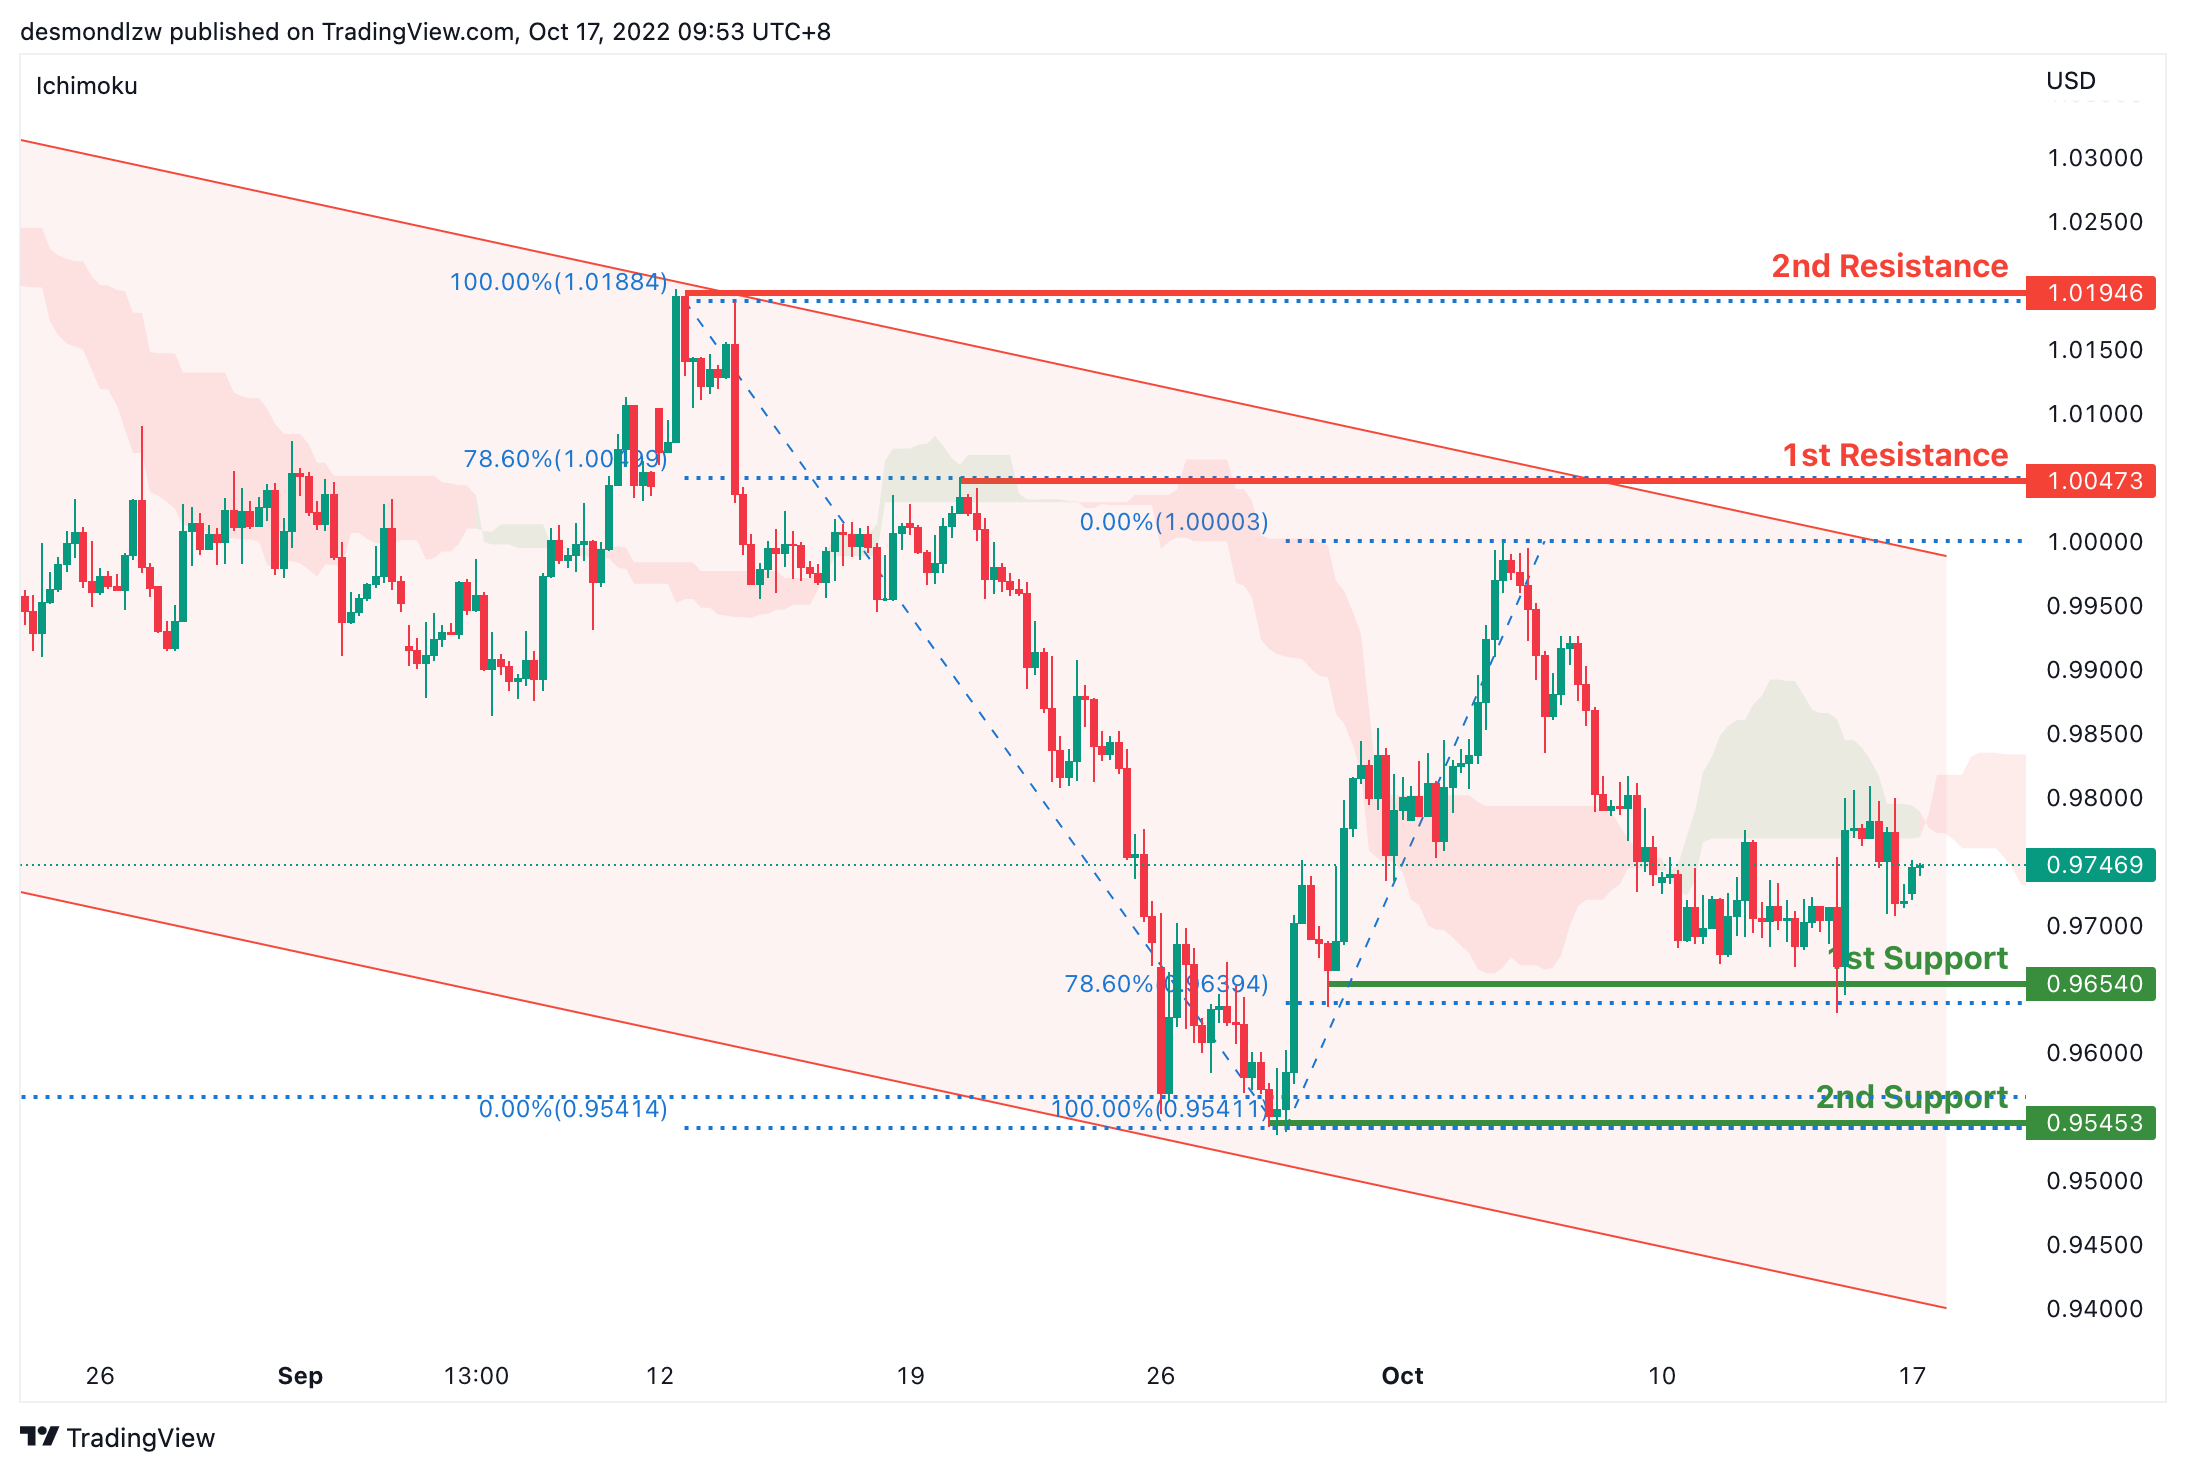
On the H4, price is moving within the descending trendline in a descending manner, with the price moving below ichimoku cloud- we are still overall bearish biassed. Although price has bounced off the first support at 0.9695 where the 61.8% retracement sits, it could still break this level and bring price to second support at 0.9545 where the swing low and 161.8% extension sit. Alternatively, price may test the first resistance at 1.0047 where the 78.6% retracement sits. If price breaks this level, it may test the second resistance at 1.0194, where the previous swing high sits
Areas of consideration :
- H4 1st resistance at 1.0047
- H4 2nd resistance at 1.0194
GBP/USD:
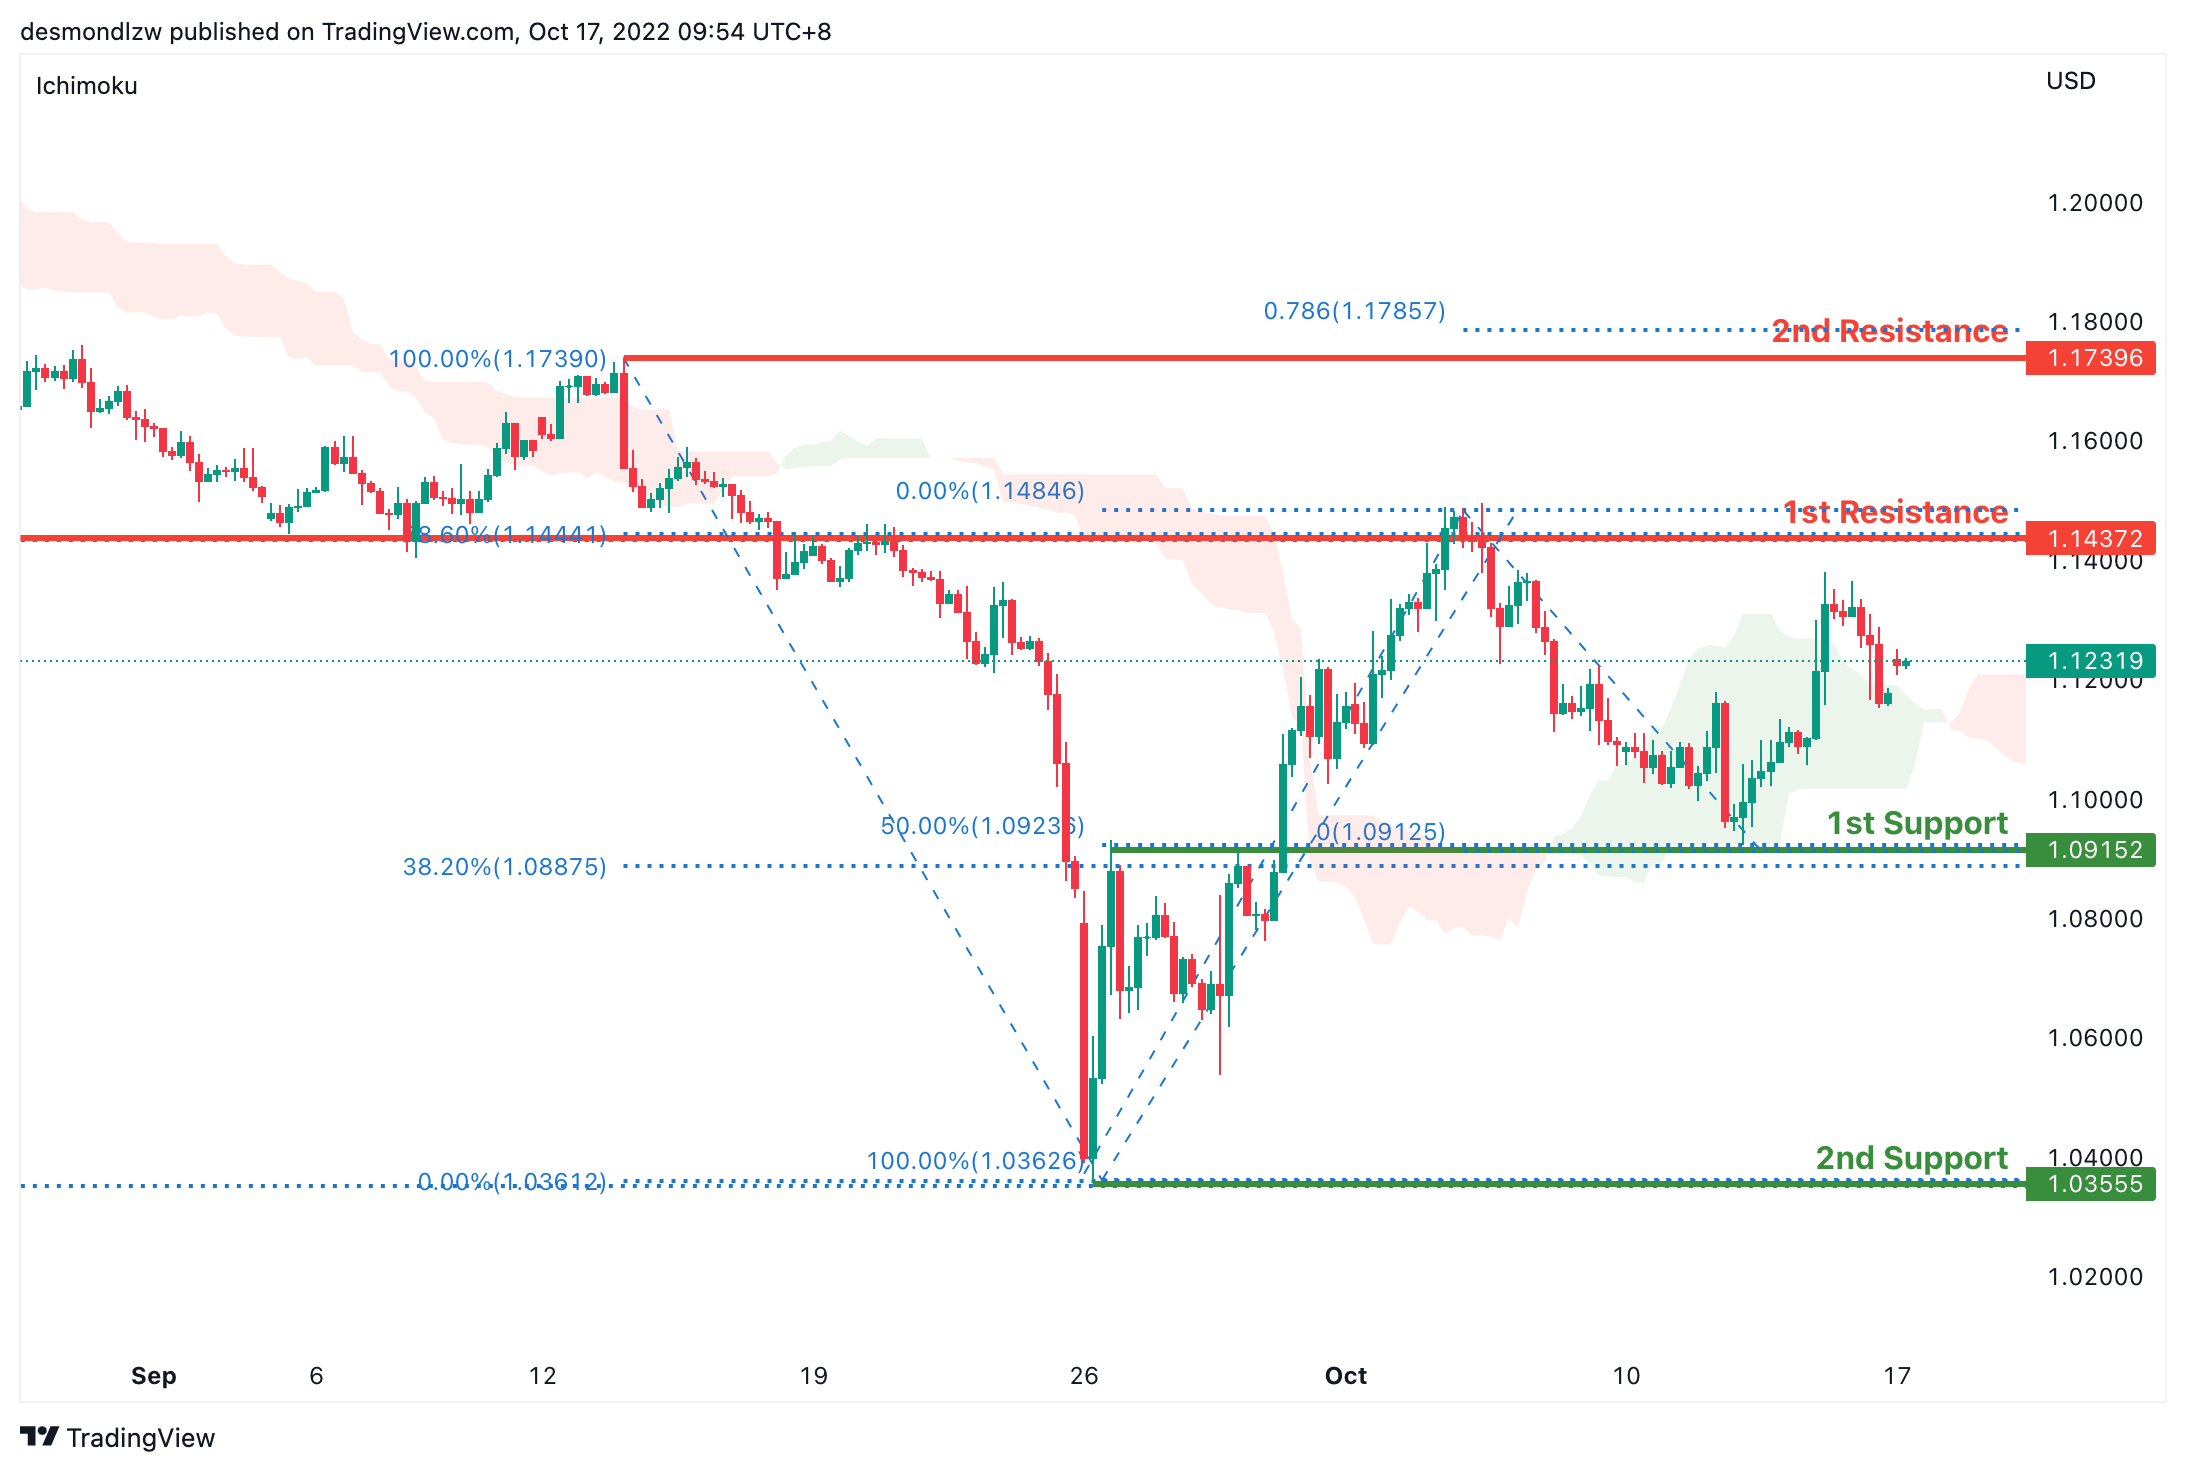
On the H4, price has rejected the first support and is moving in an ascending trend hence we are slightly bullish bias- if price breaks the first support at 1.0915 where the 50% retracement sits, bearish momentum will bring price to the second support at 1.0355 where the previous swing low sits. Alternatively price can test the first resistance at 1.1437 where the 78.6% retracement and overlap resistance sit. Subsequently the second resistance at 1.1739
Areas of consideration:
- H4 1st support at 1.0915
- H4 1st resistance at 1.1437
USD/CHF:
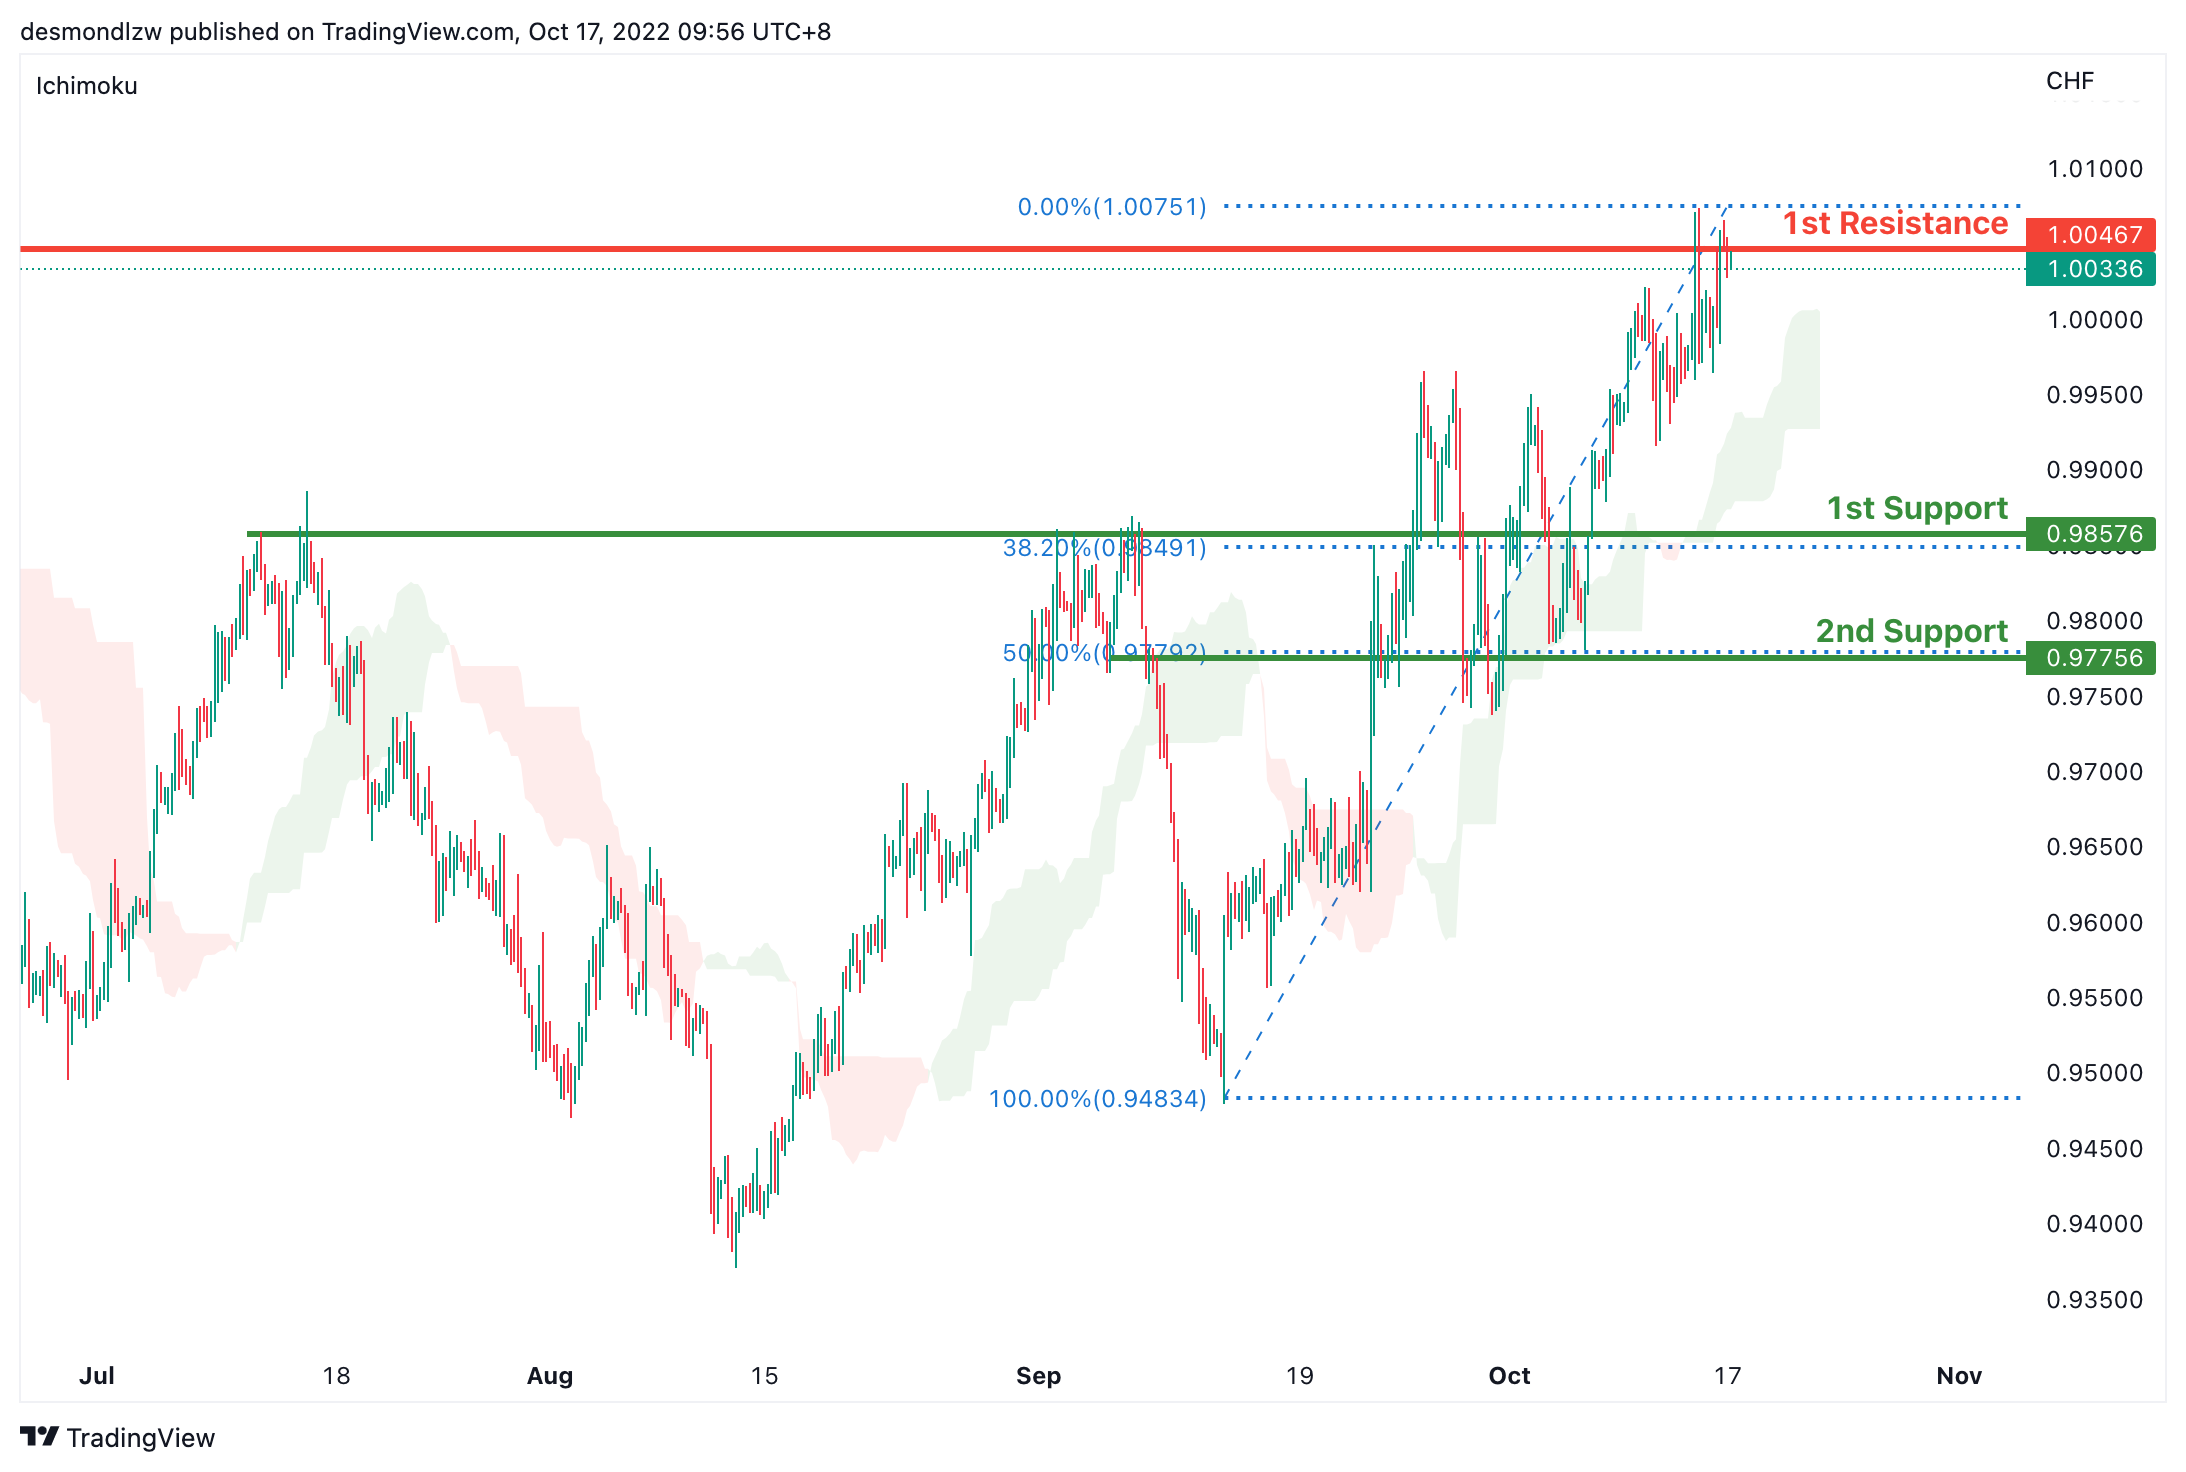
USDCHF is in a strong bullish trend on the H4 chart. Price is trading above the Ichimoku cloud signalling a bullish trend. Price has tested the first resistance at 1.0046 where the previous swing high sits and it’s pulling back slightly. If bearish momentum continues, price can test the first support at 0.9868 where the overlap support and 23.6% retracement sits then the second support at 0.9757 where the 50% retracement sits
Areas of consideration
- H4 1st support at 0.9868
- H4 1st resistance at 1.0046
XAU/USD (GOLD):
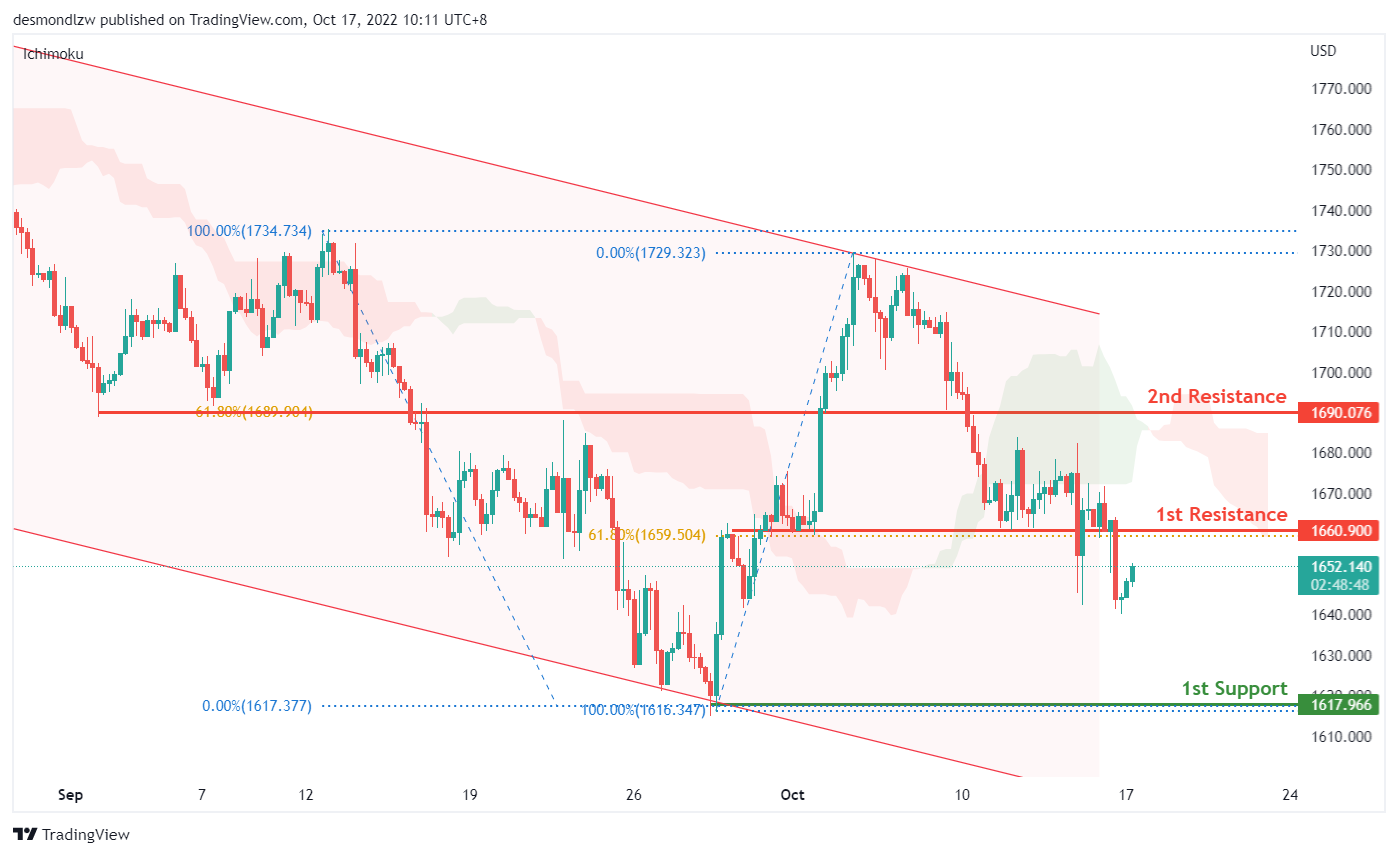
On the H4, after the significant rise, the price is showing a pullback trend now, the 1st resistance is still held at 1660.90 which is in line with the 61.8% fibonacci retracement and overlap support. As the price is within the descending channel, we could expect the price to reverse from the 1st resistance to drop to the 1st support 1617.96, where the previous swing low is. Alternatively, the price may break through the first resistance and rise to test the 2nd resistance at 1690, where the 61.8% fibonacci retracement and overlap support is.
Areas of consideration:
- H4 time frame, 1st support at 1617.96
- H4 time frame, 1st resistance at 1660.90
- H4 time frame, 2nd resistance at 1690
AUD/USD:
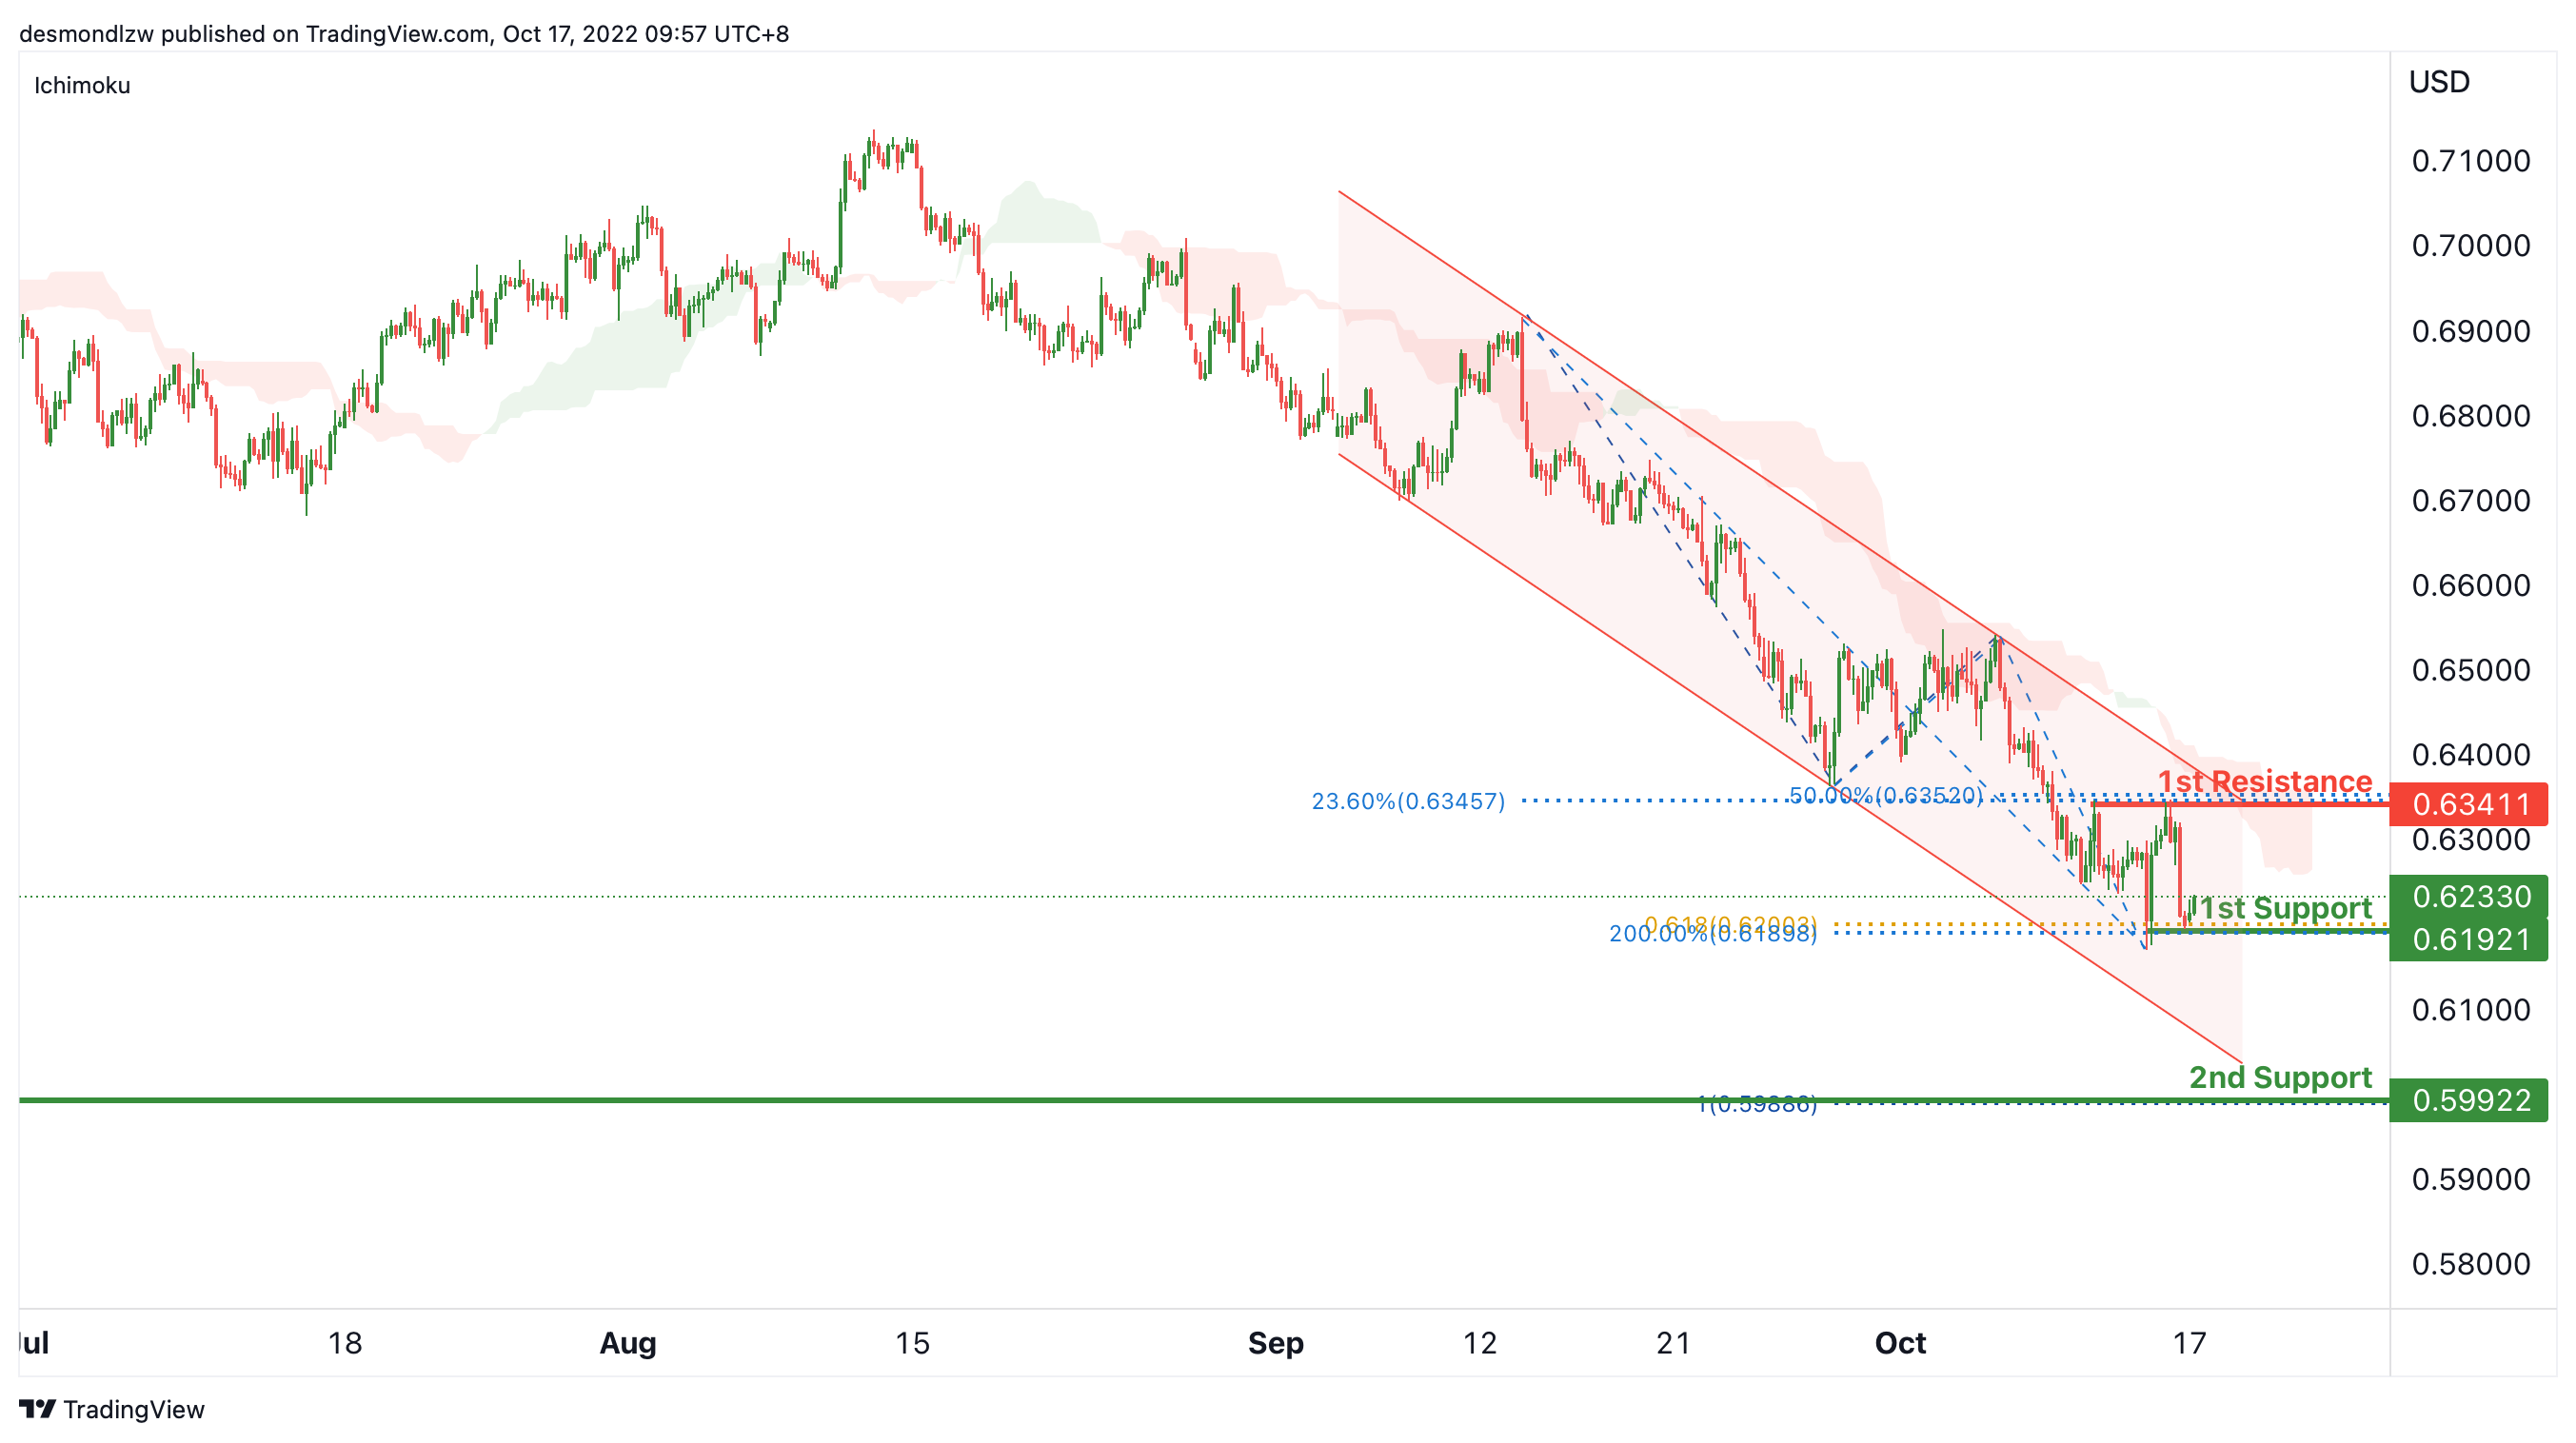
On the H4, the price is below the descending channel and ichimoku cloud, we are looking for the price drop to the 1st support at 0.61921, which is in line with the 61.8% fibonacci projection and swing low support. If the 1st support is broken, the 2nd support could be at 0.59922, where the 100% fibonacci projection and previous swing low are. Alternatively, the price may rise to retest the 1st resistance at 0.63411, which is in line with the 23.6% fibonacci retracement and 50% fibonacci retracement.
Areas of consideration
- H4, 1st support at 0.62085
- H4, 2nd support at 0.59922
NZD/USD:
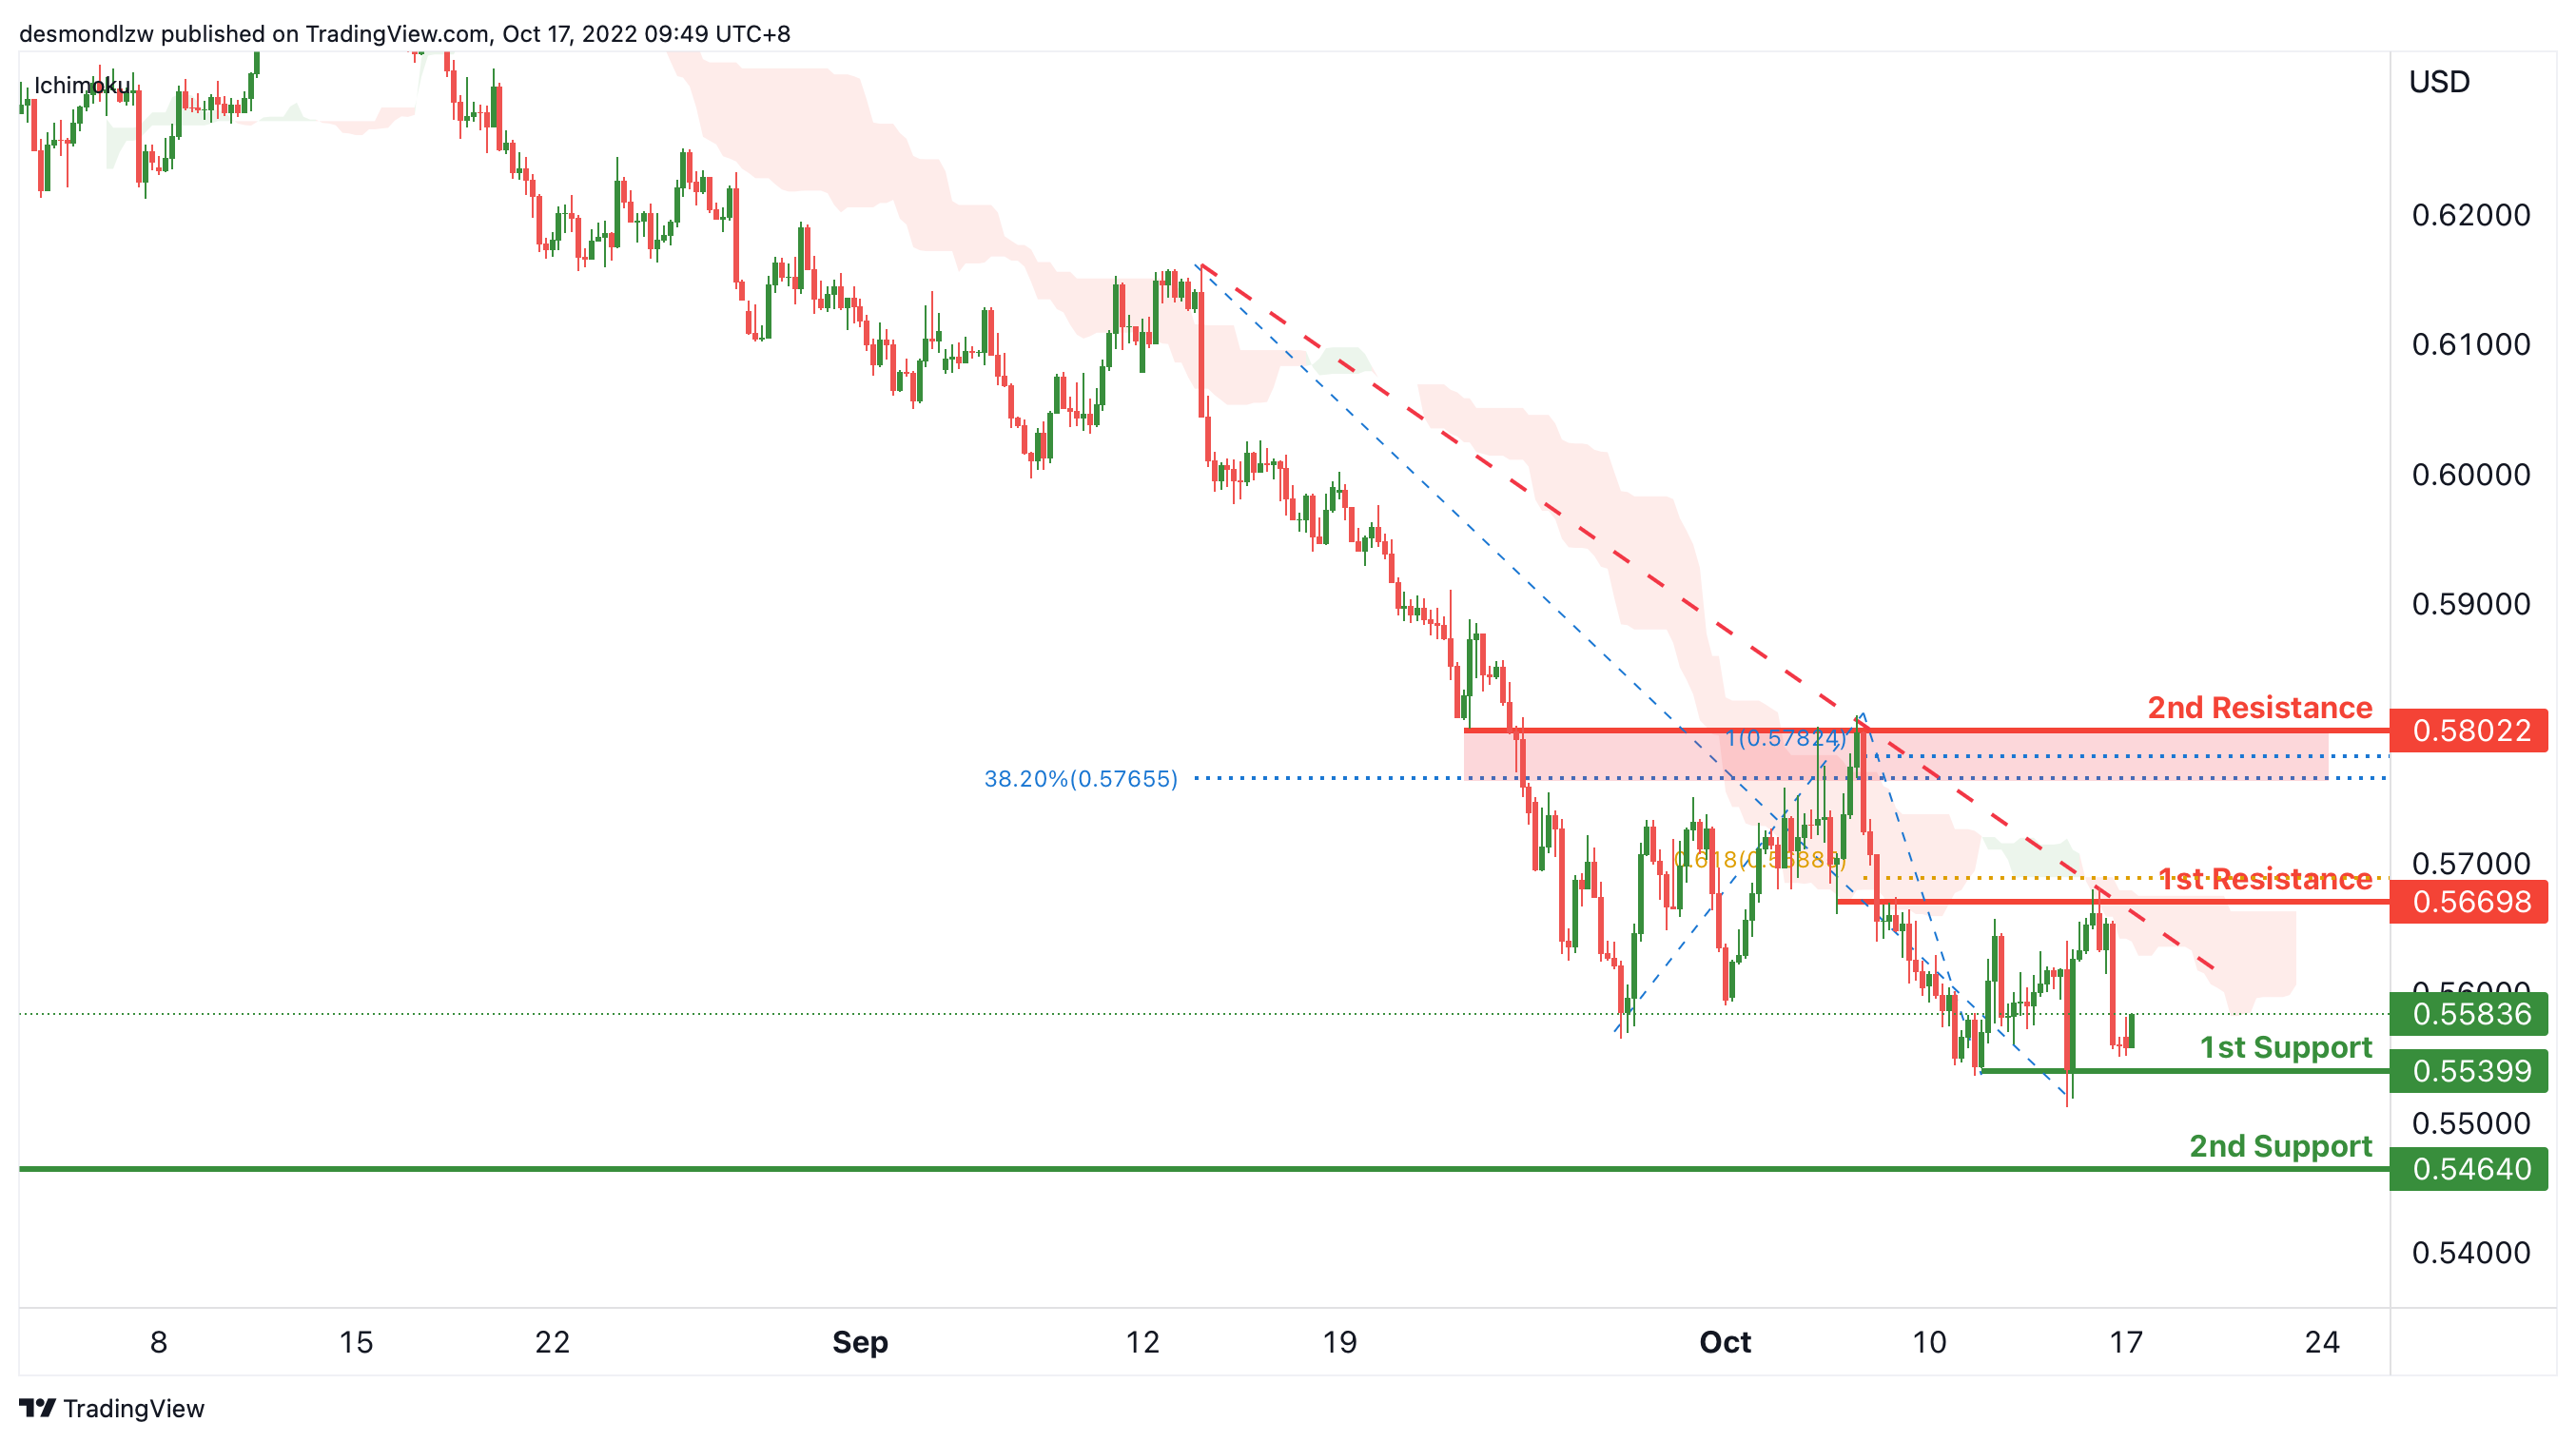
On the H4, the price is below ichimoku cloud and descending trendline, we have a bearish bias that the price may drop to the 1st support at 0.55399, which is in line with the swing low support. If the 1st support is broken, the 2nd support could be at 0.54640, where the previous swing low is. Alternatively, the price may rise to the 1st resistance at 0.56698, which is in line with the overlap resistance and 61.8% fibonacci projection. If the 1st resistance is broken, the 2nd resistance could be at 0.58022, where the previous swing high, 100% fibonacci projection and 38.2% fibonacci retracement are.
Areas of consideration:
- H4 time frame, 1st support at 0.5539
- H4 time frame, 2nd support at 0.54640
USD/CAD:
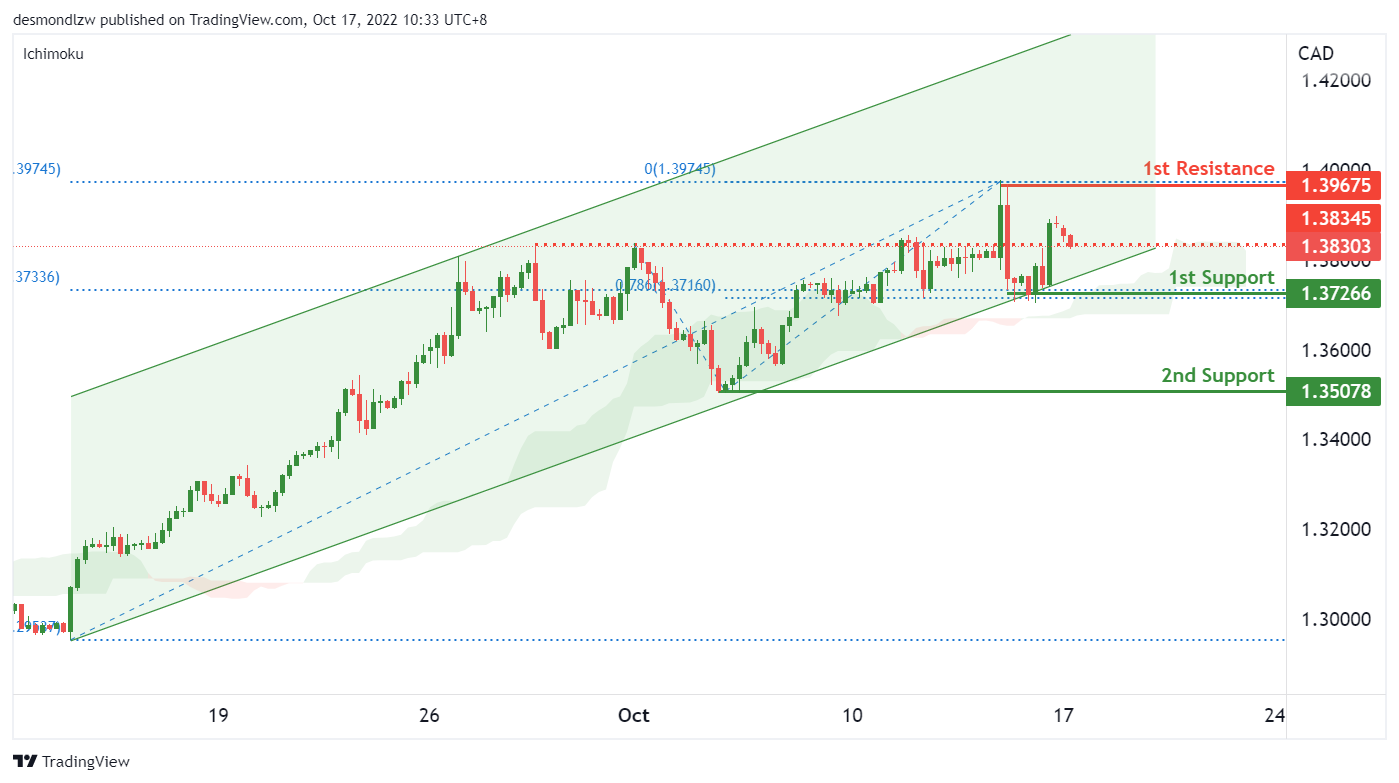
On the H4, the price trades at the risk level of 1.38 which is the previous swing high and overlap resistance level. With the price trading above the ichimoku cloud and within the bullish channel, we continue to have a short term bullish bias. The price could fall to the 1st support which is in line with the 23.6% fibonacci retracement and 78.6% fibonacci extension level before trading higher to the 1st resistance and previous swing high.
Areas of consideration:
- H4 time frame, 1st resistance at 1.3967
- H4 time frame, 1st support at 1.3726
OIL:
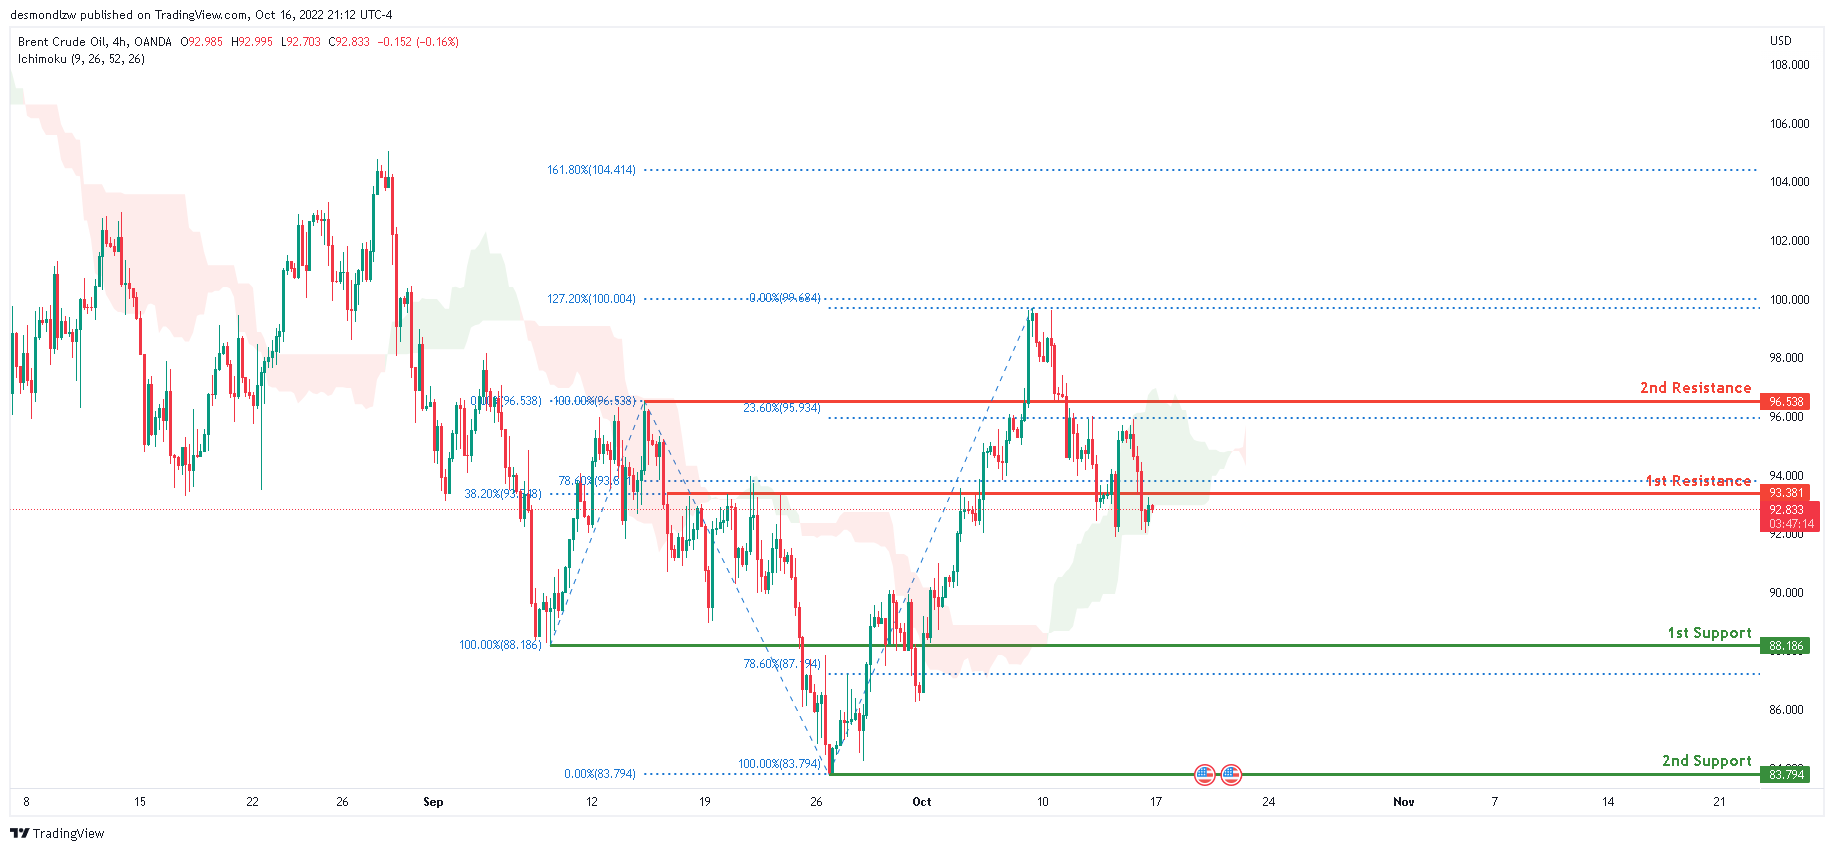
Looking at the H4 chart, the current overall bias for Oil is bearish. To add confluence to this bias, the price is currently below the Ichimoku cloud which indicates a bearish market. Price maintained its bearish retracement and has closed under the 1st resistance at 93.381 where the 78.6% and 38.2% Fibonacci line are. If this bearish momentum continues, expect the price to head towards the 1st support at 88.186 where the 100% Fibonacci line and 78.6% Fibonacci line are located.
Areas of consideration:
- H4 time frame, 1st resistance at 93.381
- H4 time frame, 1st support at 88.18
Dow Jones Industrial Average:
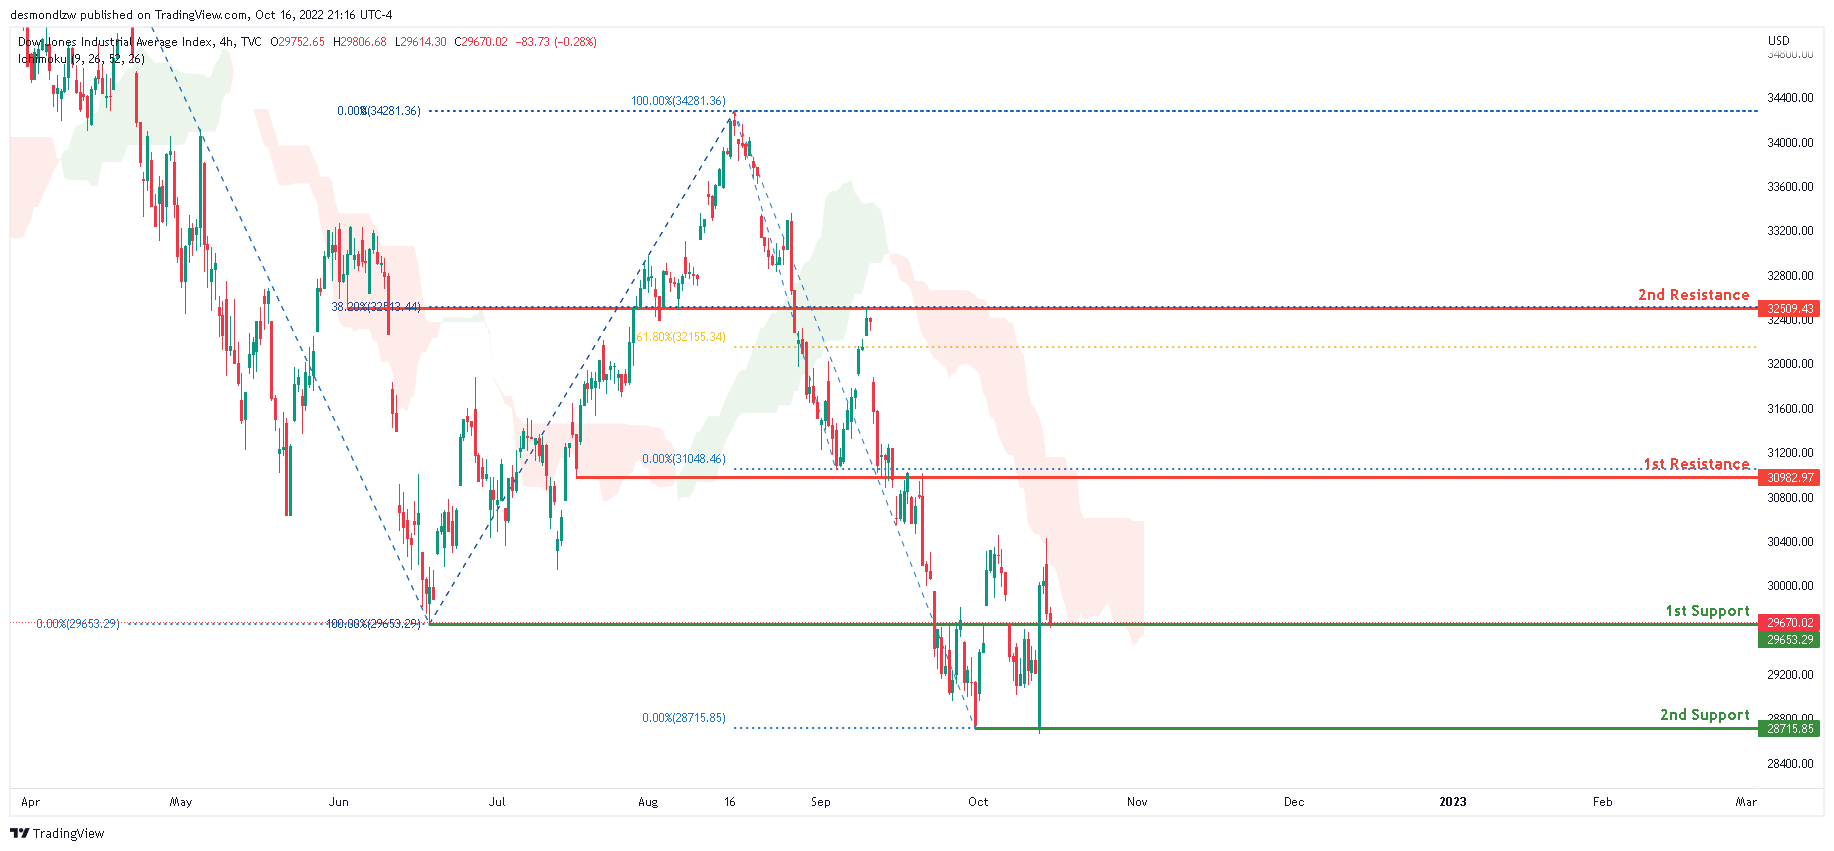
The current overall bias for DJI is bearish, according to the H4 chart. To add to this bias, the price is currently trading below the Ichimoku cloud, indicating a bearish market. Price is currently resting on the 1st support at 29653.29 where the previous low and 100% Fibonacci line is located. If this bearish momentum continues, expect the price to possibly head back down towards the 2nd support at 28715.85 where the 0% Fibonacci line and previous low is located.
Areas of consideration:
- H4 time frame, 1st support at 29653.29
- H4 time frame, 2nd support at 28715.85
- H4 time frame, 1st Resistance at 30982.9
DAX:
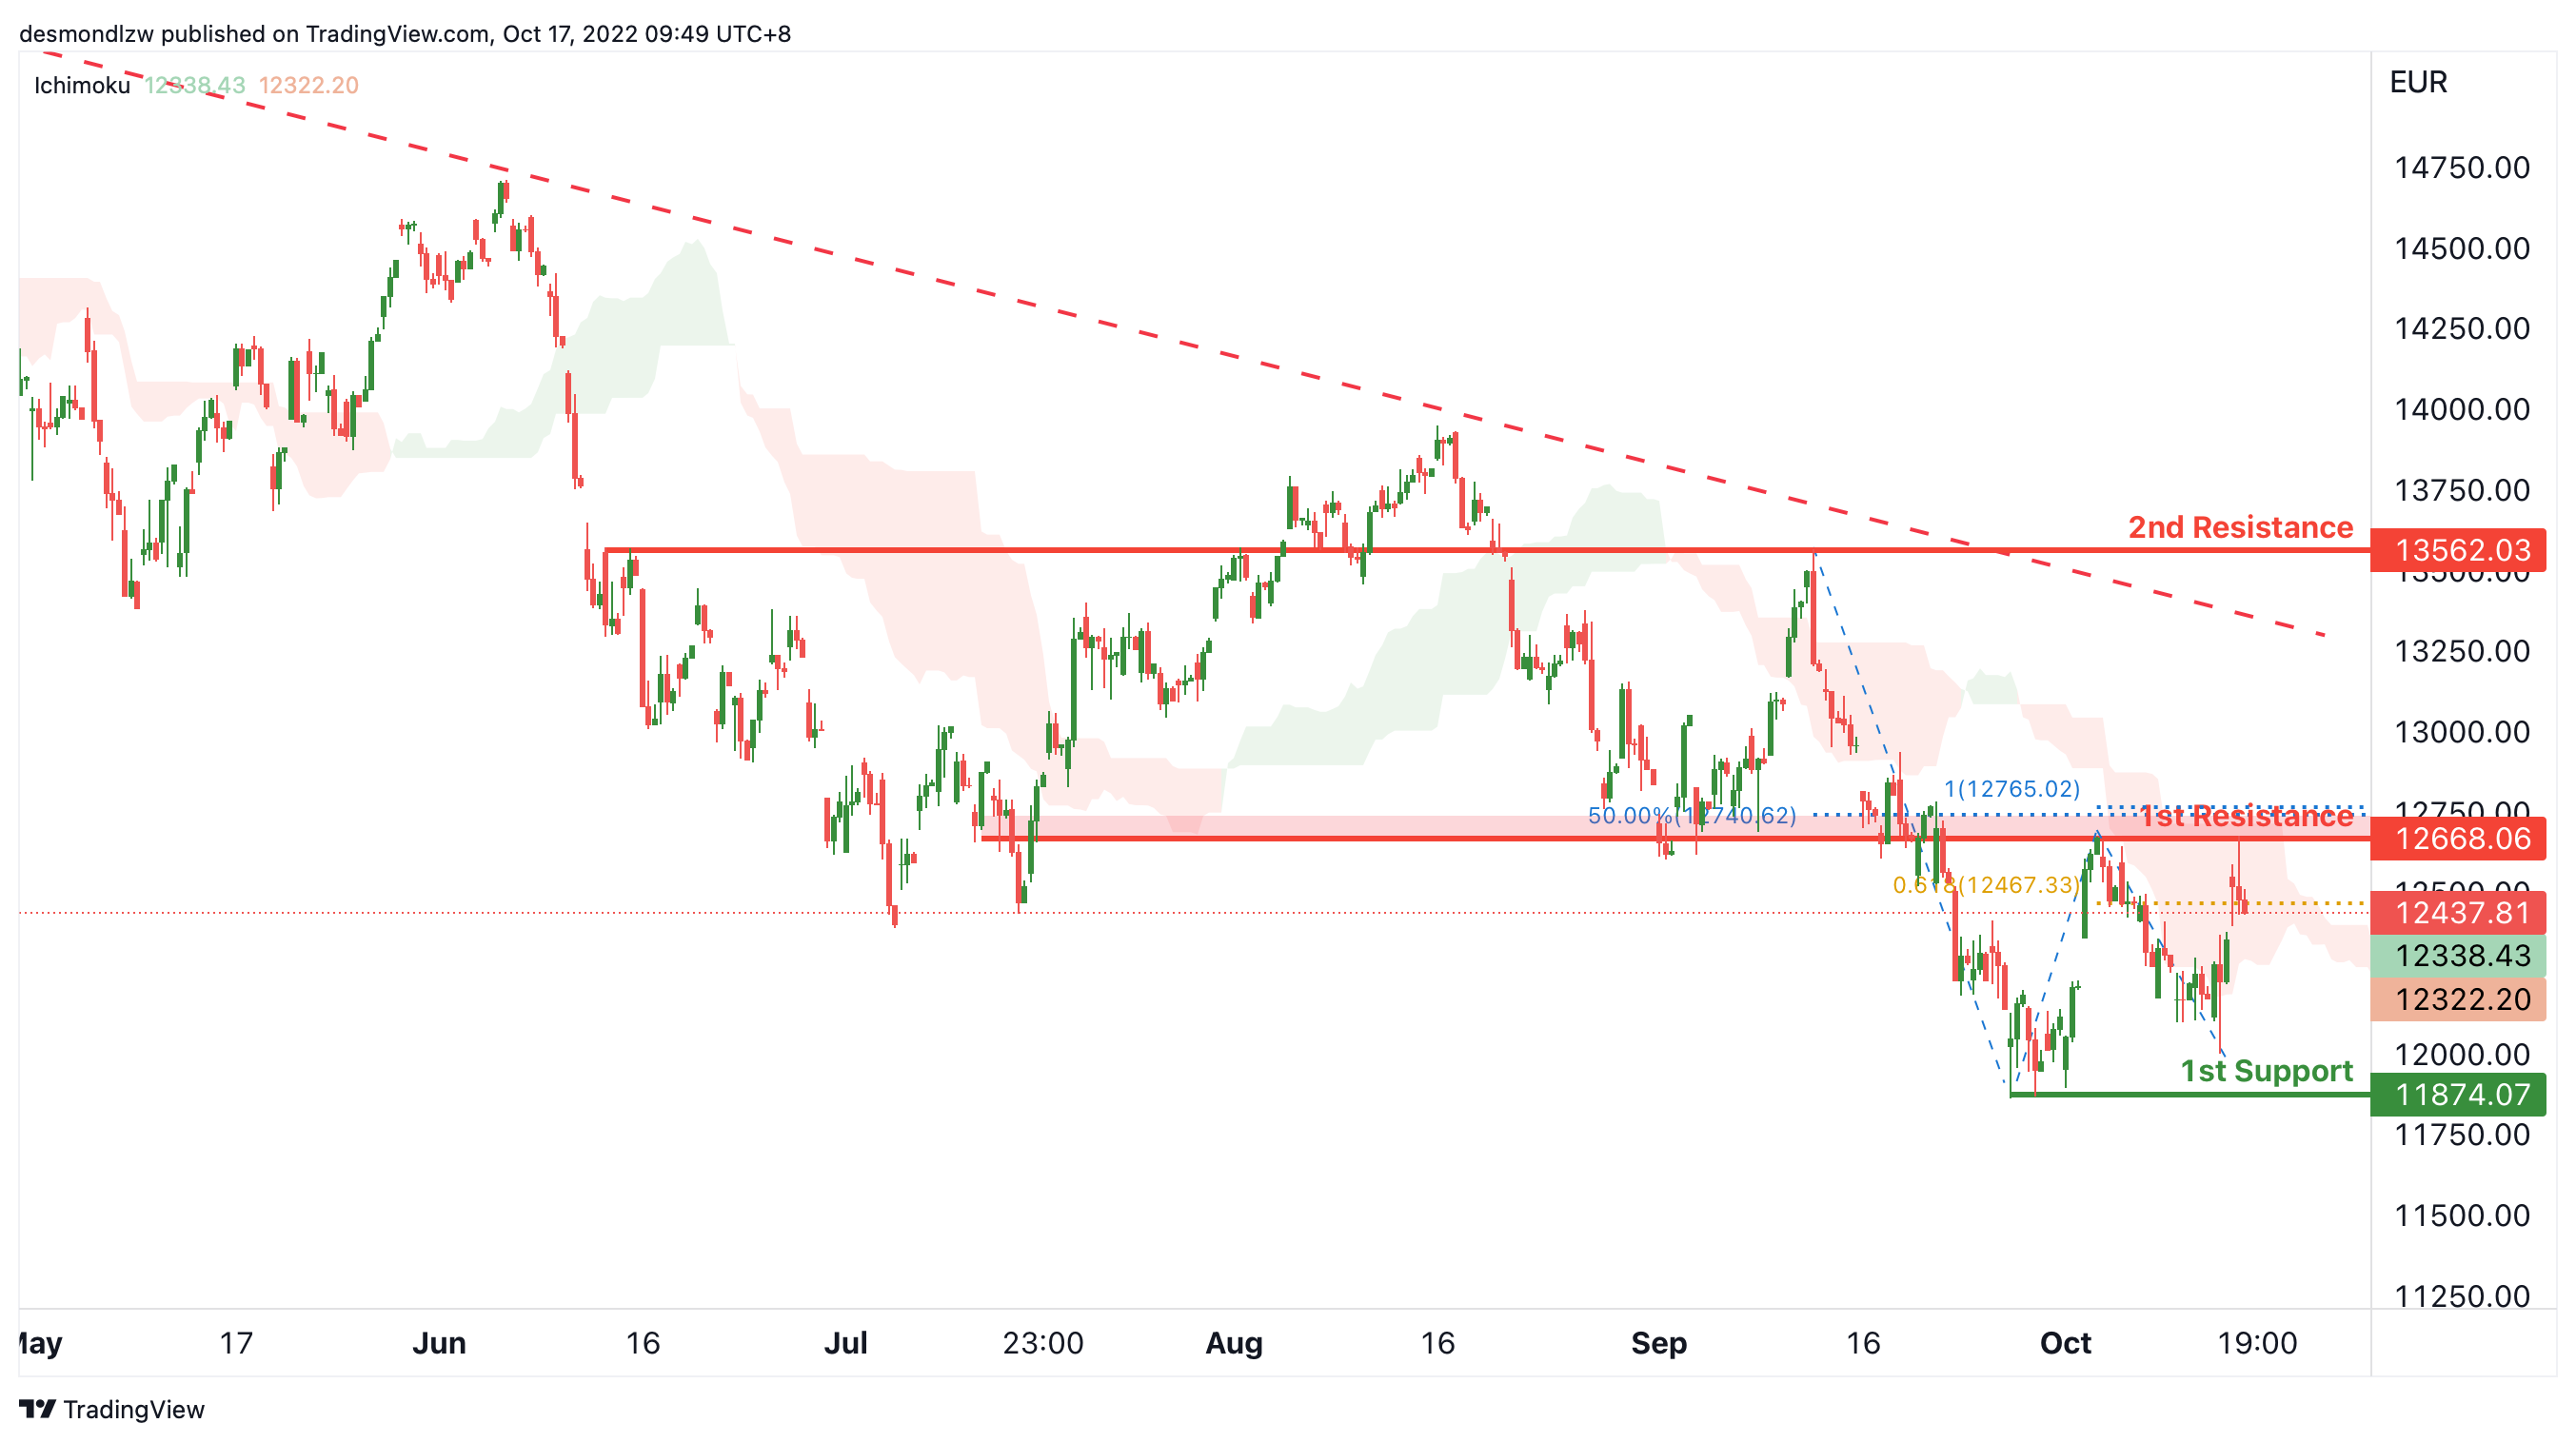
On the H4, as the price is crossing ichimoku cloud, we can expect the price to retest the 1st resistance at 12668.06, which is in line with the 50% fibonacci retracement, 100% fibonacci projection and overlap resistance. After testing the 1st resistance, as the price is below the descending trendline, the price may drop to the 1st support at 11874.07, which is in line with the swing low. Alternatively, if the price can break the 1st resistance, we can expect the price rise to the 2nd resistance at 13562.03, where the previous swing high is.
Areas of consideration:
- H4 time frame, 1st support at 11874.07
- H4 time frame, 1st resistance at 12668.06
ETHUSD:
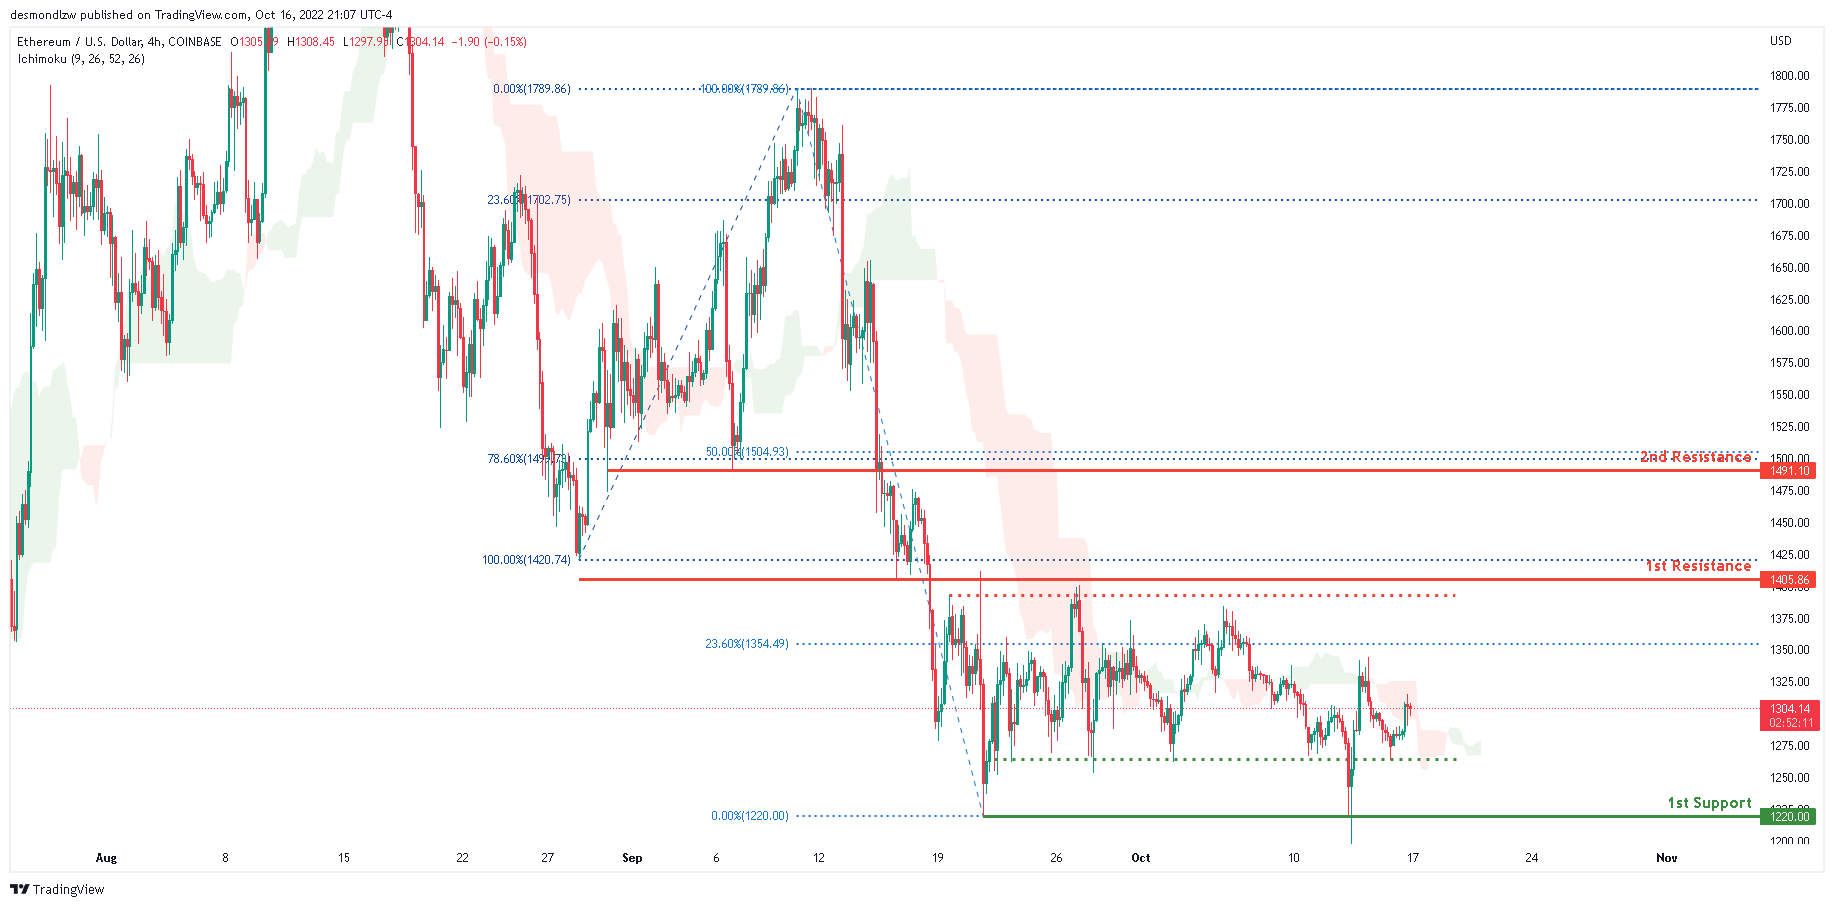
Looking at the H4 chart, the current overall bias for ETHUSD is bearish. To add confluence to this bias, the price is currently within the red Ichimoku cloud which indicates a bearish market. Price continued to consolidate between the 1st support and 2nd resistance throughout the last week. Expecting price to continue consolidating within this area unless bullish momentum kicks in where we can possibly see price tap on the 1st resistance at 1405.86 where the 100% Fibonacci line and previous swing low is.
Areas of consideration:
- H4 time frame, 1st resistance of 1405.86
- H4 time frame, 1st support at 1220.00
BTCUSD:
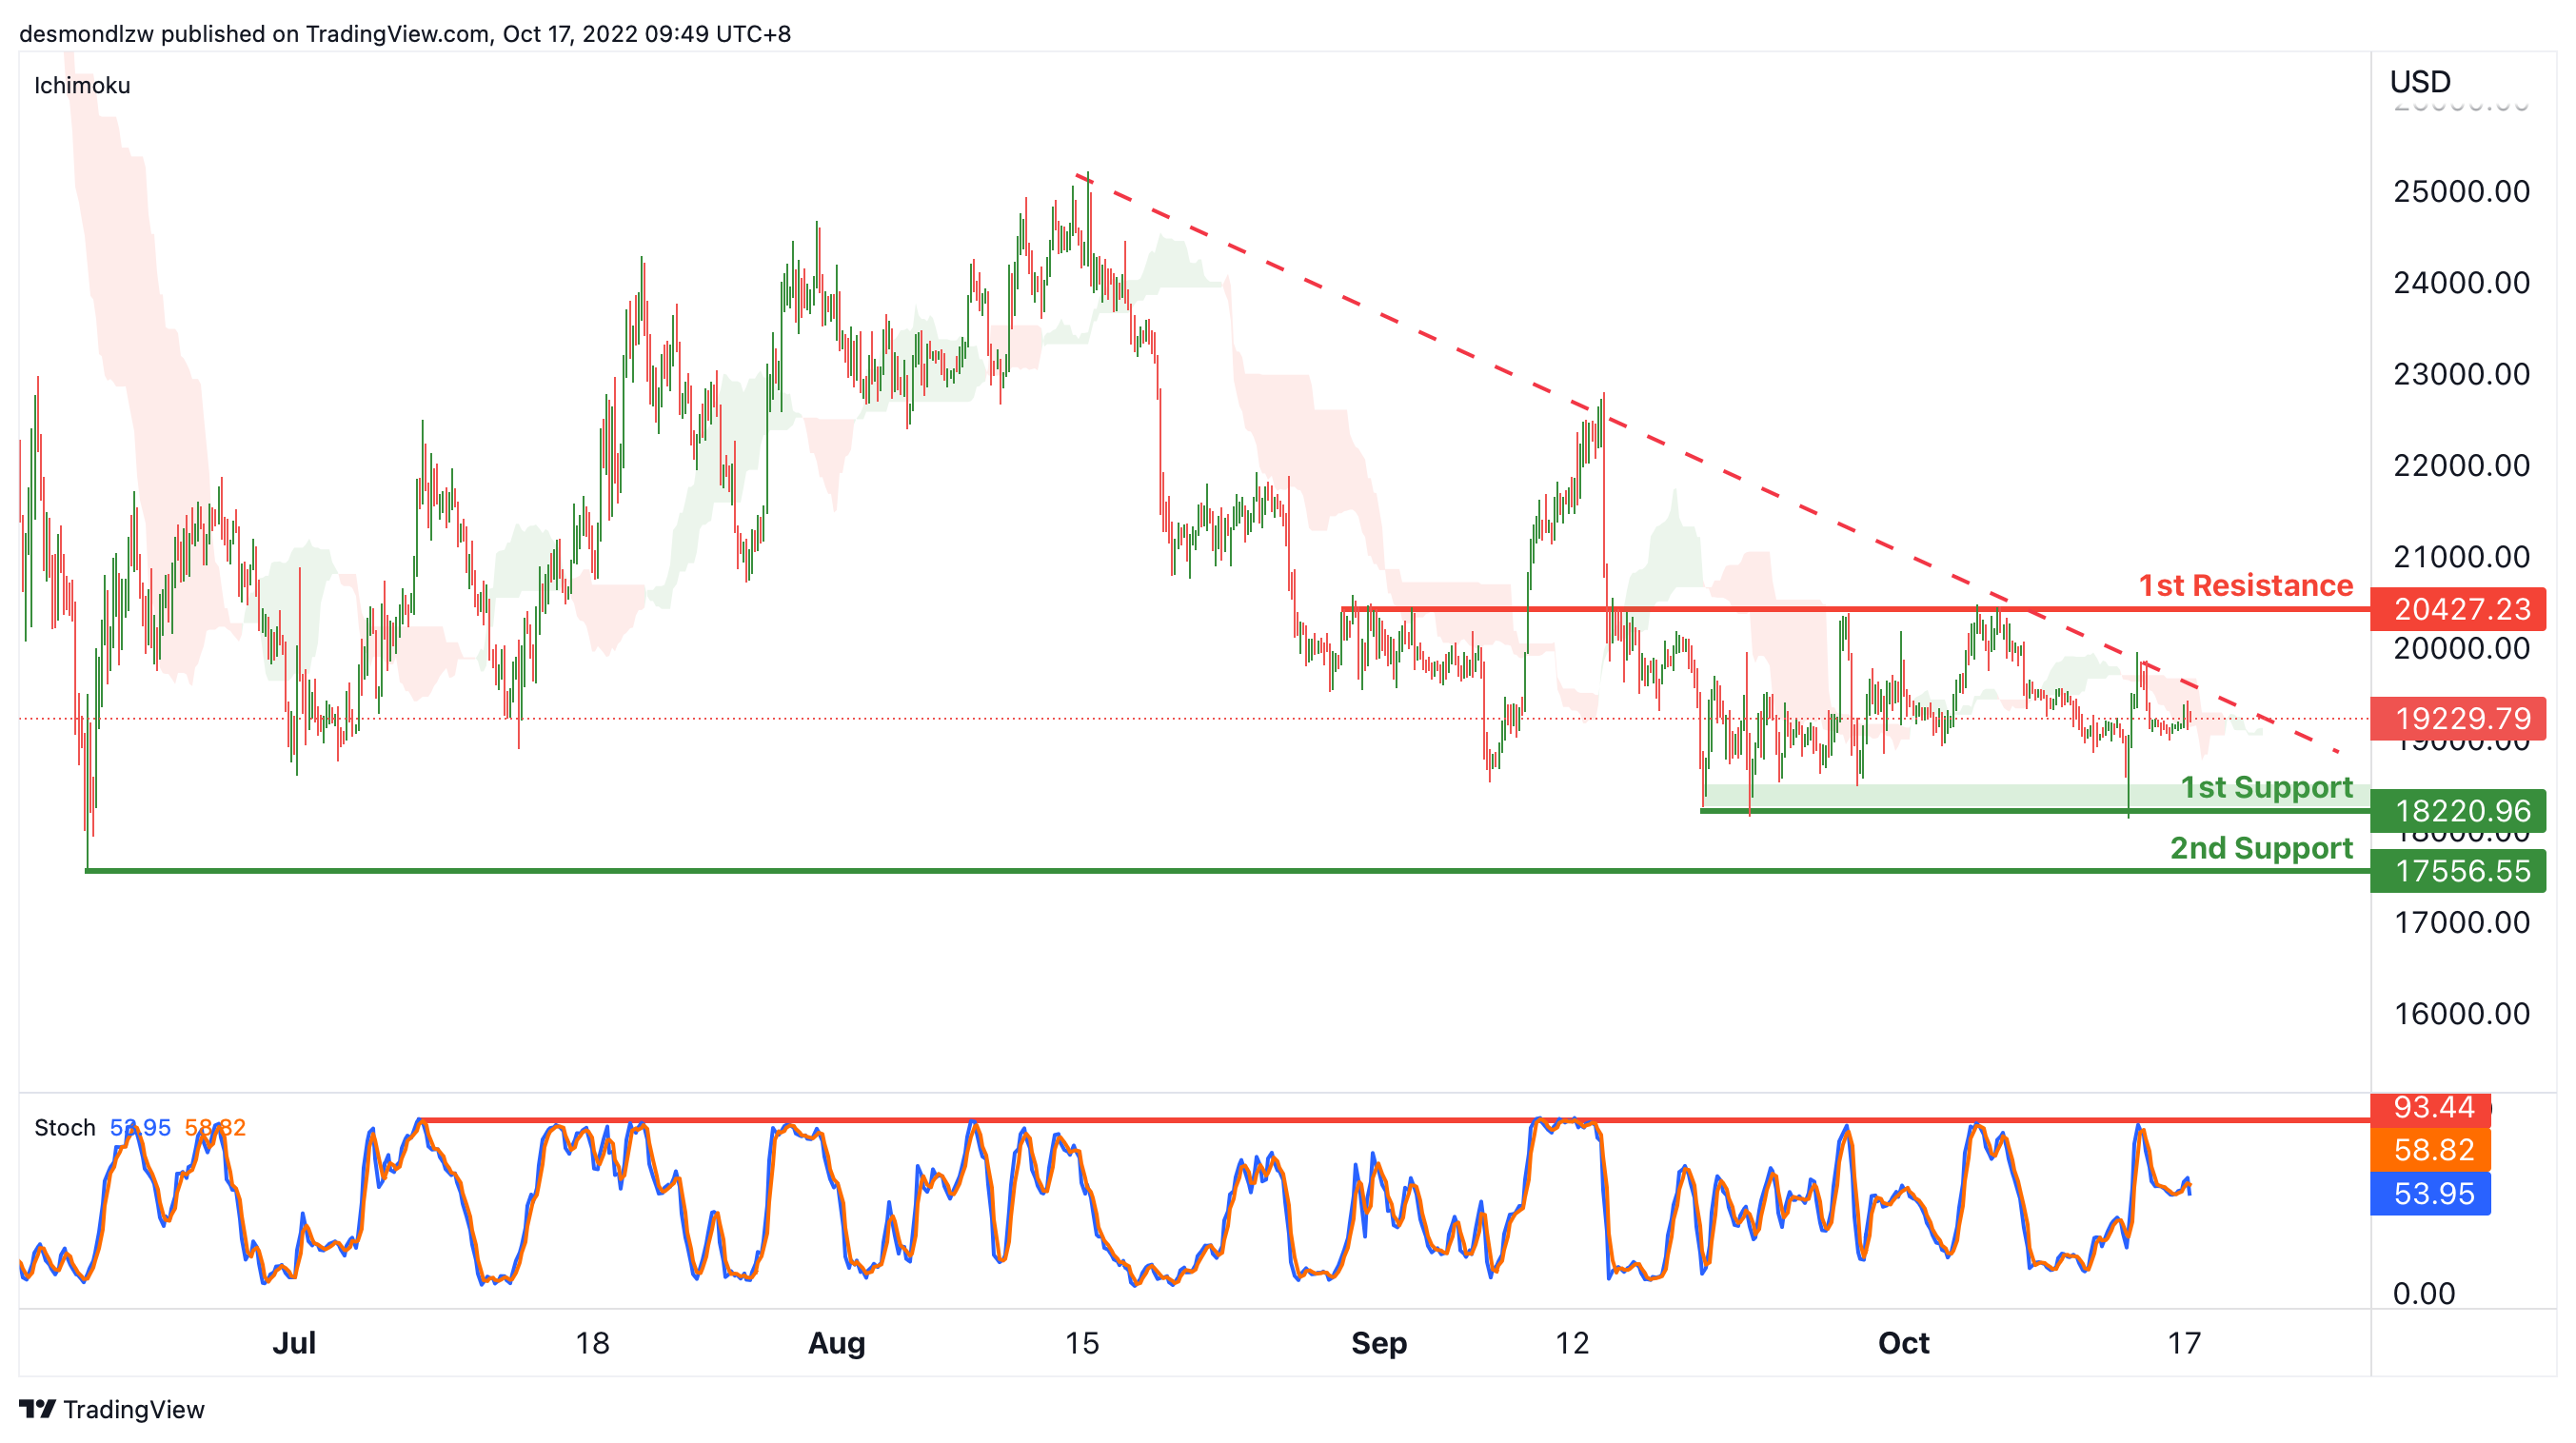
On the H4, price is crossing the ichimoku cloud, if the price can break the descending trendline, we can expect the price break the descending trendline and rise to the 1st resistance at 20427.23, where the overlap resistance and 50% fibonacci retracement are. Alternatively, as the price is still below descending trendline, we can expect the price drop to the 1st support at 18220.96, which is in line with the swing lows. If the 1st support is broken, we can expect the price to drop to the 2nd support at 17556.55, where the previous swing low is.
Areas of consideration:
- H4 time frame, current price
- H4 time frame, 1st resistance at 20427.23
S&P 500:
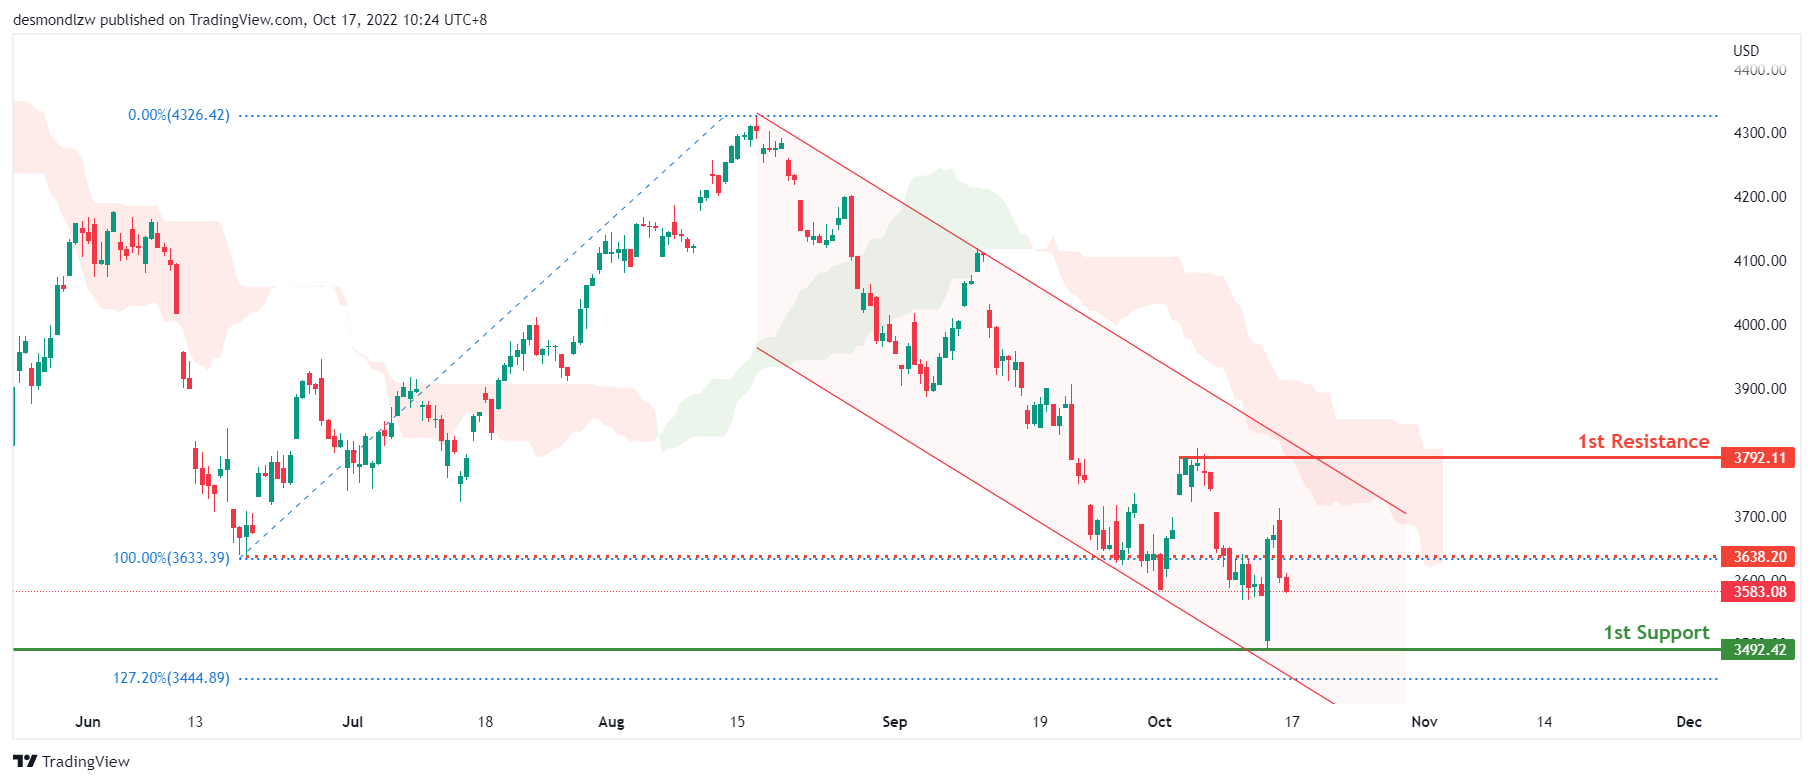
Based on the H4 chart, the current overall bias for the S&P500 is bearish as price continues in the bearish channel and stays below the ichimoku cloud. While price bounced from the 1st support of 3492.42, where the fibonacci extension and previous swing high from October 2020, the short term bullish momentum failed to break above the 3700 price level. Expect price to trade lower to test the 1st support level again.
Areas of consideration:
- H4 time frame, 1st support at 3492.42
- H4 time frame, 1st resistance at 3792.11
NZ BNZ services dropped to 55.8 in Sep
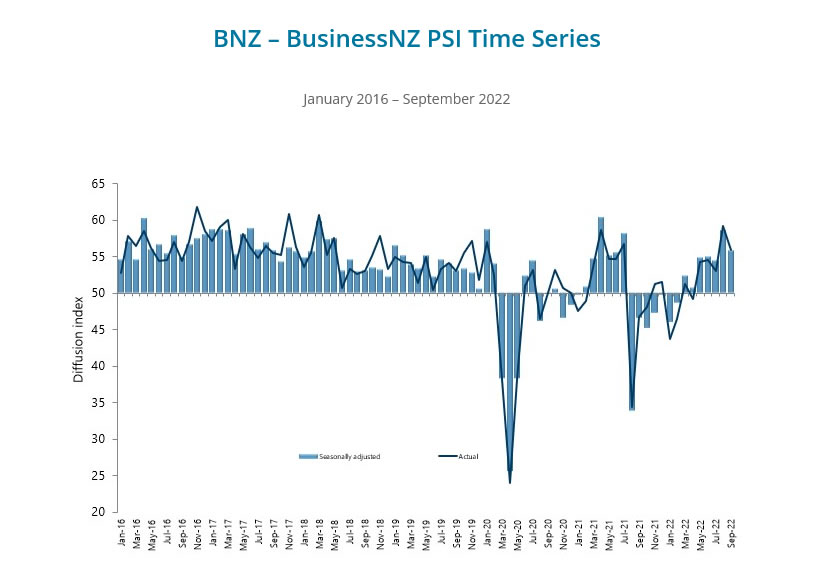
New Zealand BusinessNZ Performance of Services Index dropped from 58.6 to 55.8 in September. Looking at some details, activity/sales dropped from 67.5 to 59.2. Employment ticked down from 50.7 to 50.5. New orders/business dropped from 66.6 to 62.9. Stocks/inventories dropped from 59.6 to 54.9. Supplier deliveries was unchanged at 49.7.
BNZ Senior Economist Craig Ebert said that "the composite PCI held together at 54.4 in free-weighted terms, while the GDP weighted composite came in at 55.4, from 58.2 in August. These marry with our view that Q3 GDP increased about 1.0%".
Japan Suzuki: Will take decisive action on excessive volatility
There is no clear sign of intervention by Japan so far, as USD/JPY is trading in tight range close to 32-yr high. Finance Minister Shunichi Suzuki just said, "if we see excessive volatility caused by speculative moves, we will take decisive action. There is no change in this view at all."
Separately, BoJ Governor Haruhiko Kuroda said in a parliamentary session, Japan's economy is in the midst of recovery from COVID-19. Higher commodity prices, on the back of the situation in Ukraine, have been leading to an outflow of income from Japan to overseas, adding downward pressure on the economy."
"For now, we think it appropriate to continue with monetary easing because it's necessary to support the economy and achieve our inflation target in a sustainable and stable fashion accompanied by wage growth," he added.
BoE Bailey: Inflationary pressures will require a stronger response
BoE Governor Andrew Bailey indicated that a larger rate hike could be delivered at the upcoming meeting in November. He said, "we will not hesitate to raise interest rates to meet the inflation target... And, as things stand today, my best guess is that inflationary pressures will require a stronger response than we perhaps thought in August."
Regarding new Finance Minister Jeremy Hunt, he said, "I can tell you that there was a very clear and immediate meeting of minds between us about the importance of fiscal sustainability and the importance of taking measures to do that."
EUR/USD At Risk of Fresh Decline Below 0.9650
Key Highlights
- EUR/USD failed to recover above 1.0000 and started a fresh decline.
- A key bearish trend line is forming with resistance near 0.9850 on the 4-hours chart.
- Gold and oil are showing signs of a fresh decline.
- GBP/USD could continue higher if it clears the 1.1500 resistance.
EUR/USD Technical Analysis
The Euro attempted a steady recovery wave above the 0.9850 resistance against the US Dollar. EUR/USD even cleared the 0.9900 zone, but it failed near the parity level.
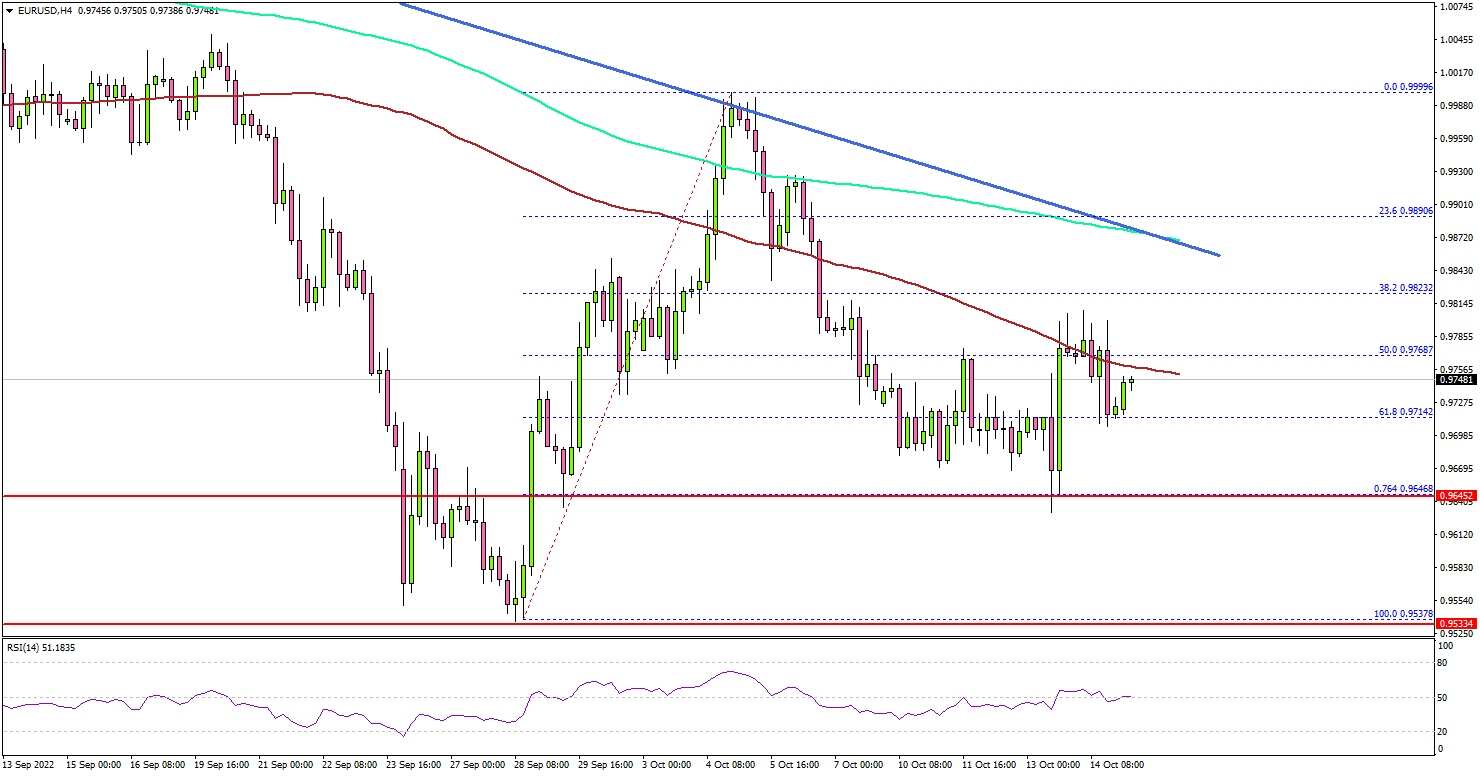
Looking at the 4-hours chart, the pair traded as high as 0.9999 before it started a fresh decline. There was a clear move below the 0.9850 support zone and the 200 simple moving average (green, 4-hours).
The pair declined below the 50% Fib retracement level of the upward move from the 0.9537 swing low to 0.9999 high. Finally, there was a spike below the 0.9700 level and the 100 simple moving average (red, 4-hours), and
On the downside, an initial support is near the 0.9650 level. It is near the 76.4% Fib retracement level of the upward move from the 0.9537 swing low to 0.9999 high.
A move below the 0.9650 level might send the pair further lower. The next main support sits at the 0.9500 level. A downside break below the 0.9500 zone might send the pair towards the 0.9250 level.
On the upside, the pair is facing resistance near the 0.9820 level. The next major resistance is near the 0.9850 level and a connecting trend line on the same chart. A clear move above the 0.9850 level might send the pair towards the 0.9920 level. The next major hurdle could be near the 1.0000 level.
Looking at gold price, there was a fresh decline below the $1,665 support zone and there is a risk of more losses in the near term.
Economic Releases
- NY Empire State Manufacturing Index for Oct 2022 – Forecast -5, versus -1.5 previous.
Forex and Cryptocurrency Forecast
EUR/USD: Market, Are You Crazy?
Throughout the first half of the week, EUR/USD moved sideways along the 0.9700 horizon as markets waited for the release of US inflation data. And it was on Thursday, October 14 that the Department of Labor Statistics of the country published fresh values of the Consumer Price Index (CPI), which exceeded the forecast values. In monthly terms, the September CPI reached 0.6% against the forecast of 0.5%, in annual terms - 6.6% against the forecast of 6.5% and the previous value of 6.3%.
The first reaction of the markets was quite expected. The DXY dollar index soared to 113.94 points (the highest value since September 28, when a 20-year high of 114.79 points was reached), the yield of 10-year treasuries updated a 14-year high, reaching 4.08%, and EUR/USD reached the level 0.9630. Risky asset quotes associated with the dollar by reverse correlation went down. The S&P500 index fell by 2.4% and updated its 2-year low. Dow Jones, Nasdaq and crypto assets behaved in a similar way.
But something extraordinary happened in less than one hour: all the markets, as if going crazy, turned 180 degrees all of a sudden. Moreover, for no apparent reason.
The dollar began to lose its positions rapidly: DXY fell to 112.46, and EUR/USD broke through 0.9800. On the contrary, the S&P500 was positive by the end of Thursday and grew by 2.6%. Analysts cite the strong oversold stock market as the main reason for this change in sentiment and the sharp increase in risk appetites. It is believed that stocks lose about 30% during recessions. At this stage, the S&P500 is down 27.5% during 2022. Therefore, some investors have decided that the bottom has already been reached or will be reached soon, and it is time to start buying. A large number of put options have recently been bought in the US market, on which profit-taking took place, and the freed fiat was used to purchase risky assets.
Despite the events of the past week, market opinion regarding the further increase in interest rates by the US Federal Reserve has not changed. Billionaire investor Ray Dalio has warned that the US will face a "perfect storm" of problems: a combination of debt, political infighting, and conflict abroad. But at the same time, despite the threat of a recession, the Fed will have no other choice to beat inflation.
The market has no doubts that the key rate will be increased by 75 basis points (bp) at the next meeting of the FOMC (Federal Open Market Committee) on November 2. The largest North American financial derivatives market, CME Group, estimates the probability of this at over 90%. Moreover, it is possible that the rate will also increase to 75 bp in December (or, alternatively, by 50 bp in December and another 50 bp in Q1 2023). The peak of the rise is predicted at the level of 4.93-5.00% per annum, and this rate may remain until 2024.
As for Europe, the ECB representative and head of the Slovak Central Bank, Peter Kazimir, recently said that "raising the rate by 75 bps in October is appropriate". However, this had almost no impression on the market. Economists at Commerzbank still expect the European regulator to raise the rate to only 3.0% by March next year. Thus, it will still be far behind the USD rate.
In addition, the energy crisis and the problems associated with sanctions against Russia due to its invasion of Ukraine will also continue to put pressure on the common European currency. According to analysts at Commerzbank, the euro will start to recover only when investors bet more and more on the end of the crisis next year. In the meantime, they write, "a decisive tightening of monetary policy and a remarkably strong US economy make the US dollar the favorite currency of international investors."
Thus, EUR/USD in the short term is still aimed south. And according to the forecasts of DBS Bank strategists, if it breaks through the important support level just below 0.9600, it may fall into the range of 0.8270-0.9500, which was observed in 2000-2002.
Following the release of September US Retail Sales and the University of Michigan Consumer Sentiment Index, the EUR/USD pair was trading in the 0.9750 zone at the time of writing the forecast on Friday evening, October 14. 55% of analysts support the fact that it will continue to move south in the near future, another 35% expect it to move north, and the remaining 10% vote for a sideways trend. Among the trend indicators on D1, 90% are red and 10% are green. The picture is quite different among the oscillators: only 40% of them advise selling the pair, 15% are in favor of buying, and 55% have taken a neutral position.
The immediate support for the EUR/USD is at 0.9700, followed by 0.9670, 0.9630, 0.9580 and finally the September 28 low at 0.9535. The next target of the bears is 0.9500. The resistance levels and targets of the bulls look like this: 0.9800-0.9825, 0.9900, the immediate task is to return to the range of 0.9950-1.0020, the next target area is 1.0130-1.0200.
The upcoming week's calendar highlights Tuesday October 18, when the German ZEW Economic Sentiment Index is released. The Consumer Price Index (CPI) of the Eurozone will be known. And there will be data on manufacturing activity and the housing market in the US on Thursday, October 20.
GBP/USD: UK Changes Course
In general, the GBP/USD chart was similar to the EUR/USD chart last week, except for the volatility. The local minimum was fixed at the level of 1.0922, the maximum - 1.1380, thus the range of fluctuations for the five-day period amounted to more than 450 points.
The statistics on the UK economy released this week looked mixed. Friday, October 14, was the key day, when Prime Minister Liz Truss fired Treasury Secretary Quasi Kwarteng. Now, after this event, the markets are awaiting details about the country's upcoming mini budget. Former British Foreign Secretary Jeremy Hunt has been appointed as the new Chancellor of the Exchequer, and Liz Truss has announced a dramatic change in fiscal policy. However, this has not helped the British currency much so far: it was in the 1.1200 area at the end of the working week.
As for the median forecast, here the majority of analysts (75%) side with the bears, 25% have taken a neutral position, while the number of supporters of the strengthening of the pound is 0. Among the oscillators on D1, the ratio is 60% to 40% in favor of the reds. Among the trend indicators, only 15% are colored red, 40% are green, and the remaining 45% are neutral gray.
The nearest levels and support zones are 1.1100, 1.1055, 1.0985-1.1000, 1.0925. This is followed by 1.0500-1.0740 and the September 26 low of 1.0350. When the pair moves north, the bulls will meet resistance at the levels of 1.1300, 1.1350, 1.1400, 1.1470, 1.1500, 1.1610, 1.1720, 1.1800 and 1.1960.
Regarding the release of UK macro statistics, the Consumer Price Index (CPI) will be released on Wednesday, October 19, as in the Eurozone, and UK retail sales for September will be announced on Friday, October 21.
CRYPTOCURRENCIES: How Much Will BTC Be Worth on October 9, 2024?
The crypto market was relatively quiet until Thursday October 13. The BTC/USD pair, despite the downward pressure, looked quite stable, holding positions around $19,000. However, it flew down after the values of the US Consumer Price Index (CPI) became known, following the stock indices S&P500, Dow Jones and Nasdaq. However, it never reached the June 19 low of $17,940, and having found a local bottom at $18,155, it then went up sharply, following the stock indices. At the time of writing this review, on the evening of Friday, October 14, the pair is trading in the $19.375 zone.
According to Amsterdam Stock Exchange trader Michael van de Poppe, bitcoin price volatility will increase in the second half of October. The US inflation data, along with the latest data on retail sales and labor market dynamics, will have a strong impact on both Wall Street and the cryptocurrency market. The next important point will be early November, when the Fed is likely to raise the benchmark interest rate by 0.75%. Based on this, JP Morgan strategists predict a new collapse of the S&P500 index, by about another 20%. Thus, the unrealized loss of those who invested in the shares of the 500 largest US companies at the beginning of 2022 could exceed 44%. However, many crypto investors hope that, as in the case of the recent crisis in the UK, bitcoin will play the role of digital gold this time and will not collapse after other assets. It will become clear in the foreseeable future whether these hopes will come true.
If we look at the latest analysts' forecasts by color, the palette is as follows: short-term forecasts are dark black, medium-term forecasts are gray, and long-term forecasts are sky blue.
Among the dark blacks, this time, let's highlight the scenario of Zack Voell, who is a mining analyst at Braiins. He has recently shared a model that reflects BTC's price performance in previous bearish cycles. Zach Voell studied the behavior of quotes in all past periods between highs and lows, on the basis of which he predicted a fall in the BTC rate to $13,800.
The analyst emphasized that he studied the behavior of the bitcoin price in 2011, then in 2013-2015 and 2017-2018, as well as during the current cycle, which began in November 2021. According to him, the value of the cryptocurrency lost more than 80% of its peak values the last two times. If history repeats, the rate will fall to at least this mark and may even go lower. He noted among other things that the bearish cycle of 2011 led to a drop in the value of BTC by as much as 95%. However, this happened when the cryptocurrency was practically unknown to anyone and was not on the way to mass adoption.
Voell also noted that despite the negative sentiment, bitcoin was the most profitable asset in Q3 2022. Digital gold has shown extreme stability in the past months. (Apart from BTC, according to statistics published by NYDIG, only precious metals and fiat USD turned out to be profitable in Q3).
Now let's talk about what may happen in the last, Q4 2022. Mike McGlone, senior strategist at Bloomberg Intelligence, predicted a rise in the bitcoin price by the end of 2022. Digital gold and ethereum tend to outperform most major assets during economic downturns. Therefore, McGlone called the increase in interest rates by Central banks "a strong tailwind." He noted that October has been the best month for bitcoin since 2014. At the same time, the analyst believes that ethereum's transition to the Proof-of-Stake consensus algorithm can help ETH and BTC gain a foothold above the $1,000 and $20,000 levels, respectively.
Such levels for ethereum and bitcoin will certainly not impress investors. Therefore, this forecast of the Bloomberg Intelligence strategist can be classified as neutral gray. Then move on to sky blue scenarios.
Paul Tudor Jones, a trader and founder of the Tudor Investment Hedge Fund, said in an interview with CNBC that he continues to hold a position in the first cryptocurrency. According to the influencer, the first and second most capitalized cryptocurrencies will be valuable "at some point" because of too much money.
That moment, according to Raoul Pal, could come when the Fed retreats from its plans to fight inflation by tightening monetary policy. This Real Vision founder and former Goldman Sachs chief executive said that the macroeconomic background is beginning to look attractive for investing in cryptocurrencies. Many investors are now in a state of extreme fear, fearing that the global financial system will soon collapse. And this could be a growth catalyst for risky assets like bitcoin and altcoins.
According to the businessman, investors are very negative and are playing it safe. Previously, the market had incredibly high amounts of investments, but the market does not work now, as sellers predominate over buyers. This situation may encourage the Fed to relax its monetary policy.
"There is currently no liquidity on the market, as only sellers are left there. I think this will cause huge problems in the future. Ultimately, businesses will demand more money to be issued and the situation on the market to be changed," said Raul Pal. So once Central banks start printing money again, assets like bitcoin and altcoins will rise. "This is a sad state of affairs, but this is the real situation," says the financier. "You will be able to see when the shift comes and use it to your advantage by investing in cryptocurrencies."
A popular crypto analyst known as Dave the Wave accurately predicted the bitcoin crash in May 2021. He believes now that if bitcoin equals gold in the long term in market capitalization, this will be equal to an increase in its price by about 40 times. According to the expert, this global goal can be achieved within two decades.
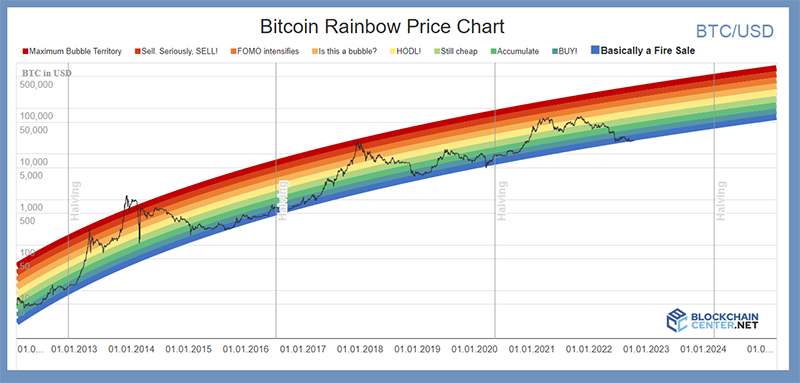
The rainbow price chart of the Blockchain Center looks no less optimistic. (It differs somewhat from our forecast). It shows how past price statistics can help predict the future behavior of an asset. In the long term, the graph indicates that bitcoin could reach a six-figure value of $626,383 by October 9, 2024. The flagship cryptocurrency will reach the "maximum bubble territory" then, marked in dark red.
Additionally, the chart indicates that the current crypto winter may have bottomed out. It is noteworthy that bitcoin's current price is estimated to be in the "Main Sale" zone (marked in blue). Ahead of another bull run, the rainbow chart also shows that bitcoin's "HODL" status will take effect at the end of the year when the asset trades at $86,151.
The color bars follow a purely logarithmic regression, which has no scientific basis. In addition, the bands have been adjusted to match past periods in the better way. However, the chart creators note that this is at least an interesting way to look at the potential future profitability of the main cryptocurrency.
At the time of writing, the total crypto market capitalization is $0.927 trillion ($0.946 trillion a week ago). The Crypto Fear & Greed Index has climbed 1 point in seven days from 23 to 24 and is still in the Extreme Fear zone.
EUR/USD Weekly Outlook
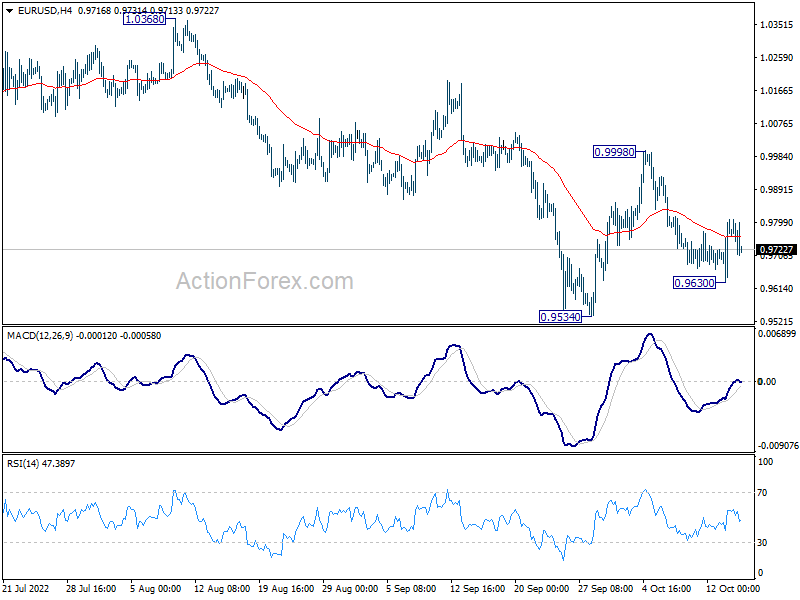
EUR/USD stayed in sideway pattern from 0.9534 last week and outlook is unchanged. Initial bias stays neutral this week and deeper decline is expected with 0.9998 resistance intact. Below 0.9630 will bring retest of 0.9534 low first. Firm break there will resume larger down trend.
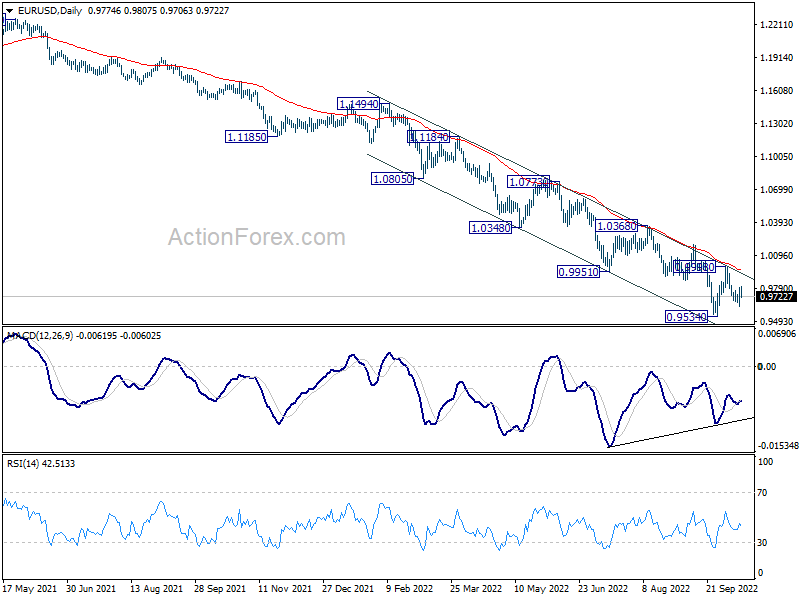
In the bigger picture, down trend from 1.6039 (2008 high) is still in progress. Next target is 100% projection of 1.3993 to 1.0339 from 1.2348 at 0.8694. In any case, break of 0.9998 resistance is needed to be the first sign of medium term bottoming. Otherwise, outlook will stay bearish even with strong rebound.
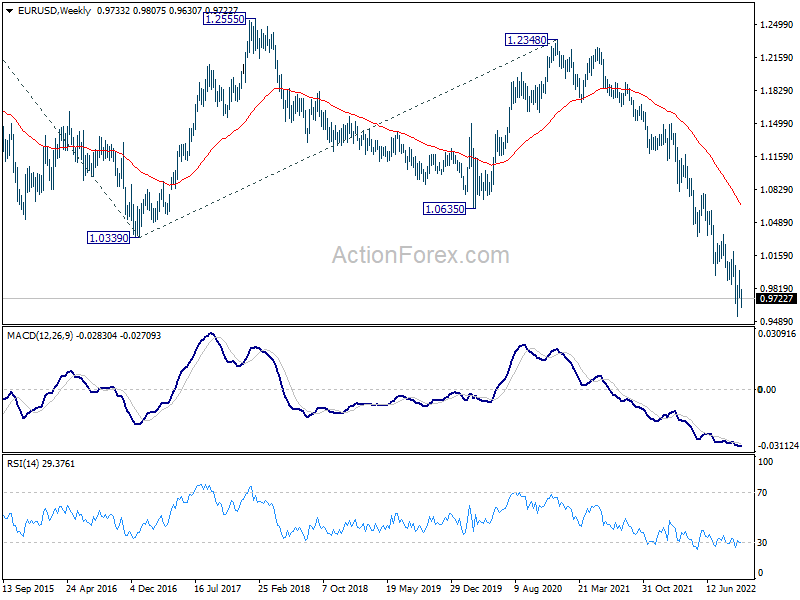
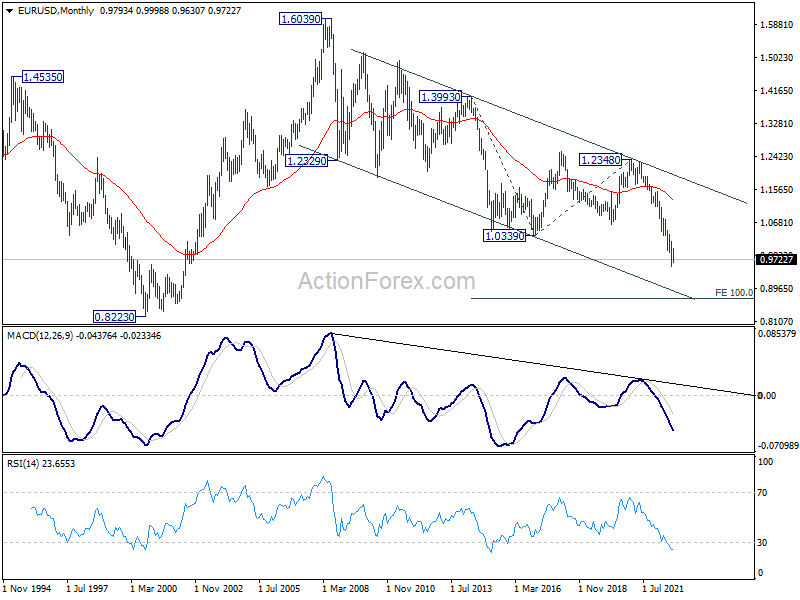
In the long term picture, long term down trend from 1.6039 (2008 high) is extending. Next target is 100% projection of 1.3993 to 1.0339 from 1.2348 at 0.8694. This will now remain the favored case as long as 1.0635 support turned resistance holds.
USD/JPY Weekly Outlook
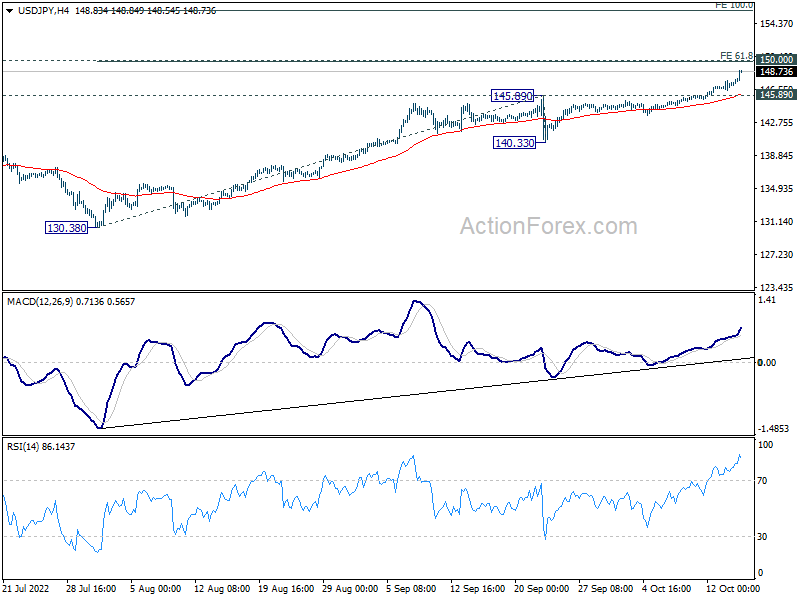
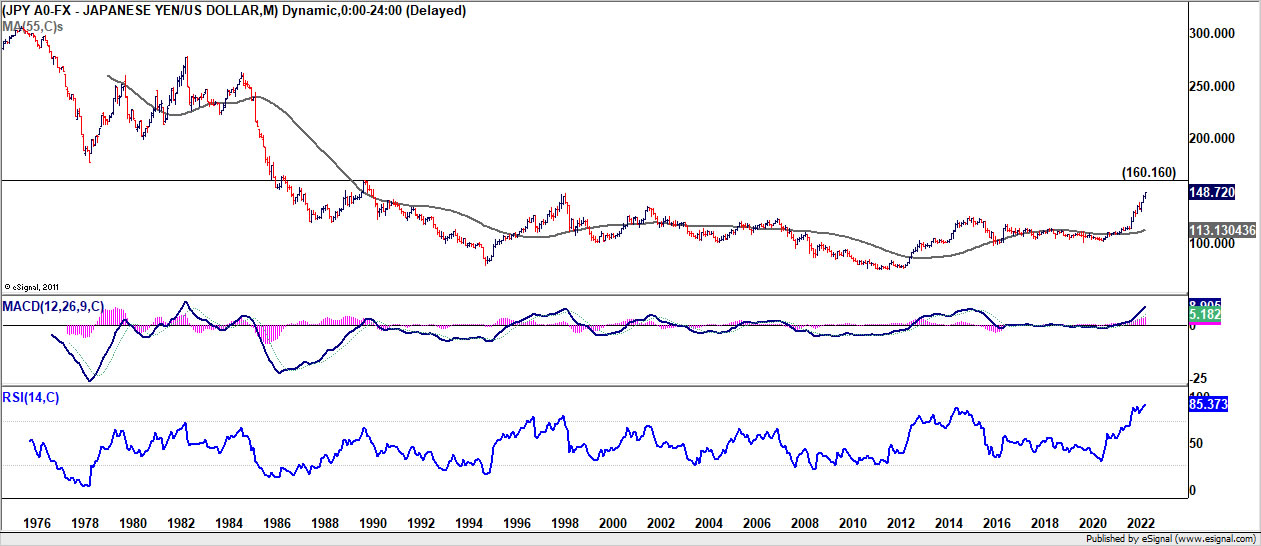
USD/JPY's up trend resumed last week and reached high as high 148.85, breaking 147.68 long term resistance. There is no clear sign of topping yet. Initial bias stays on the upside this week for 61.8% projection of 130.38 to 140.33 from 145.89 at 149.91. Beware that Japan might intervene again there close to 150 psychological level. Nevertheless, break of 145.89 resistance turned support is needed to confirm short term topping. Otherwise, outlook will remain bullish in case of retreat.
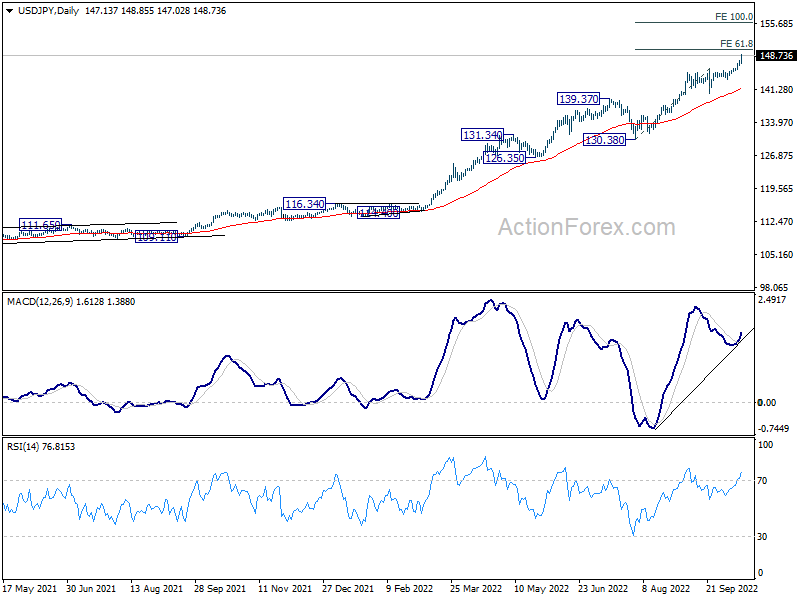
In the bigger picture, up trend from 101.18 is still in progress, as part of the whole up trend from 75.56 (2011 low). 147.68 (1998 high) was already met and there is not clearly sign of topping yet. In any case, break of 139.37 resistance turned support is needed to be the first sign of medium term topping. Otherwise, further rise is in favor to next target at 160.16 (1990 high).
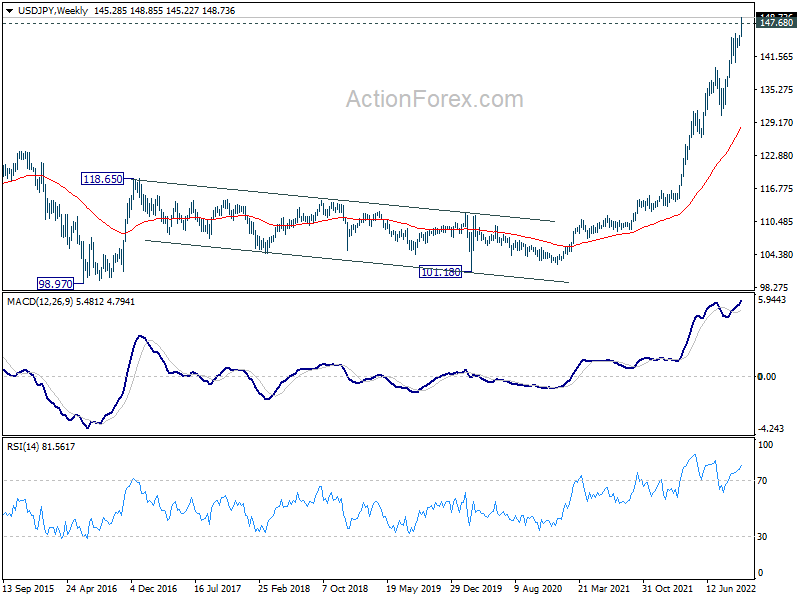
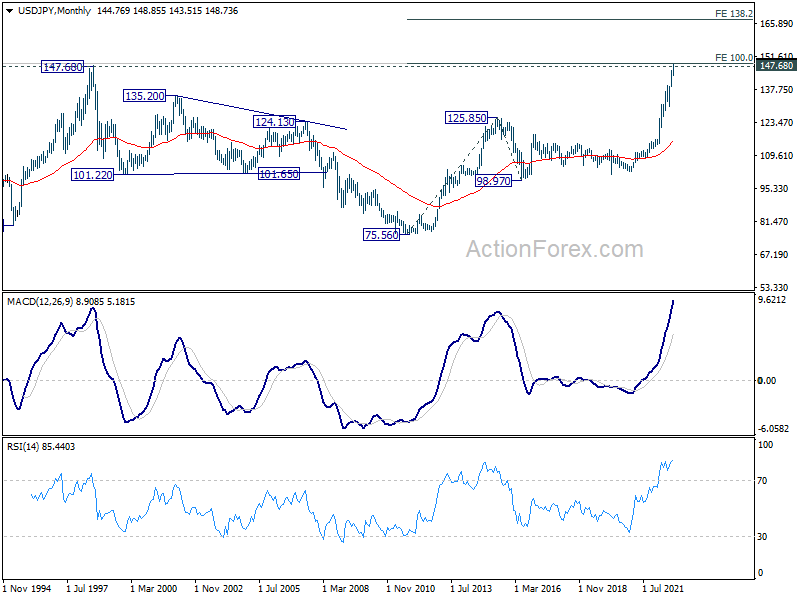
In the long term picture, rise from 101.18 is seen as part of the up trend from 75.56 (2011 low). Sustained break of 100% projection of 75.56 (2011 low) to 125.85 (2015 high) from 98.97 at 149.26, will pave the way to 138.2% projection at 168.47. This will remain the favored case as long as 130.38 support holds.
GBP/USD Weekly Outlook
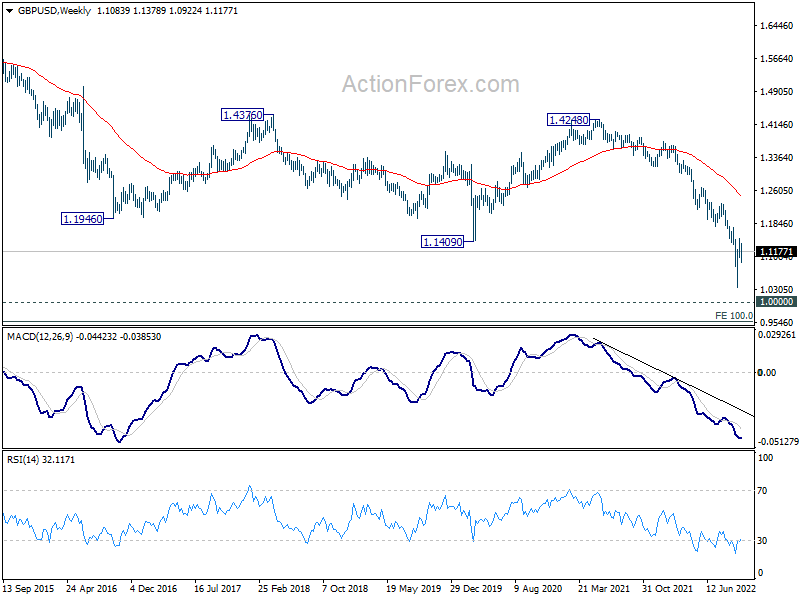
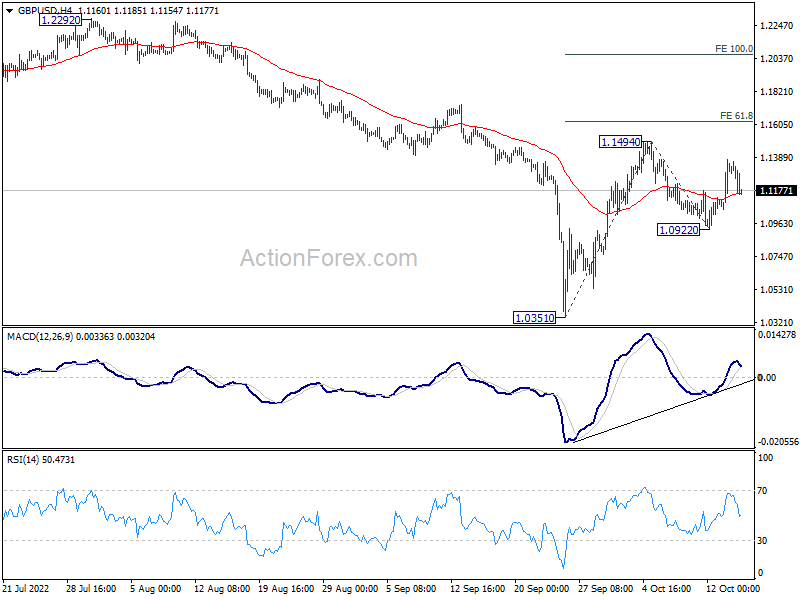
GBP/USD rebounded after dipping to 1.0922 but failed to break through 1.1494 resistance. Initial bias is neutral this week first. On the upside, break of 1.1494 will resume the rise from 1.0351 to 61.8% projection of 1.0351 to 1.1494 from 1.0922 at 1.1628. On the downside, below 1.0922 will turn bias back to the downside for 1.0351 low instead.
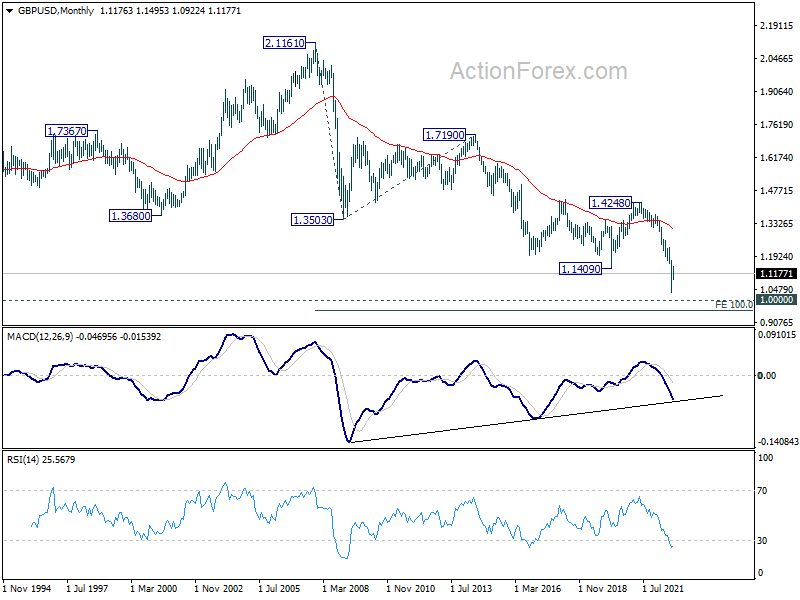
In the bigger picture, fall from 1.4248 (2018 high) is resuming long term down trend from 2.1161 (2007 high). Next target is 100% projection of 2.1161 to 1.3503 from 1.7190 at 0.9532. There is no scope of a medium term rebound as long as 1.1759 support turned resistance holds.
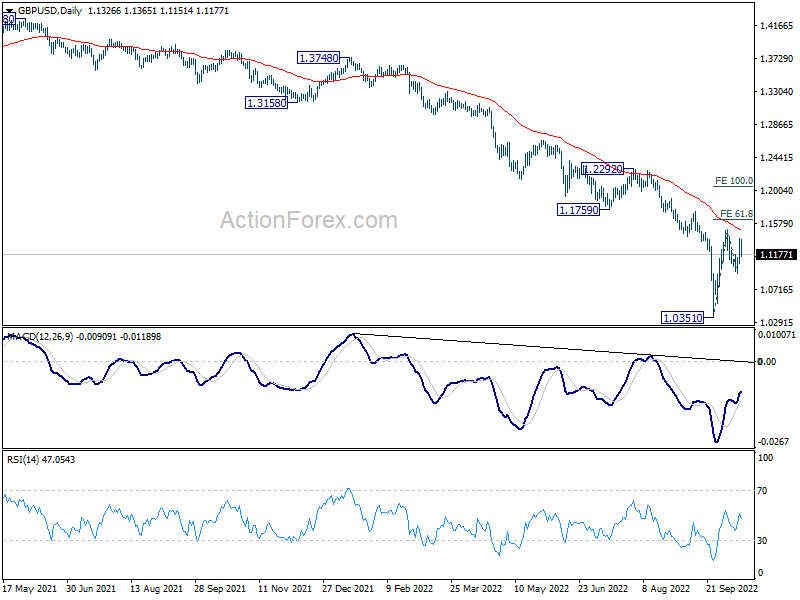
In the longer term picture, long term down trend from 2.1161 (2007) high is still in progress. Next target is 100% projection of 2.1161 to 1.3503 from 1.7190 at 0.9532.