Sample Category Title
EUR/JPY Mid-Day Outlook
Daily Pivots: (S1) 143.80; (P) 144.33; (R1) 145.17; More....
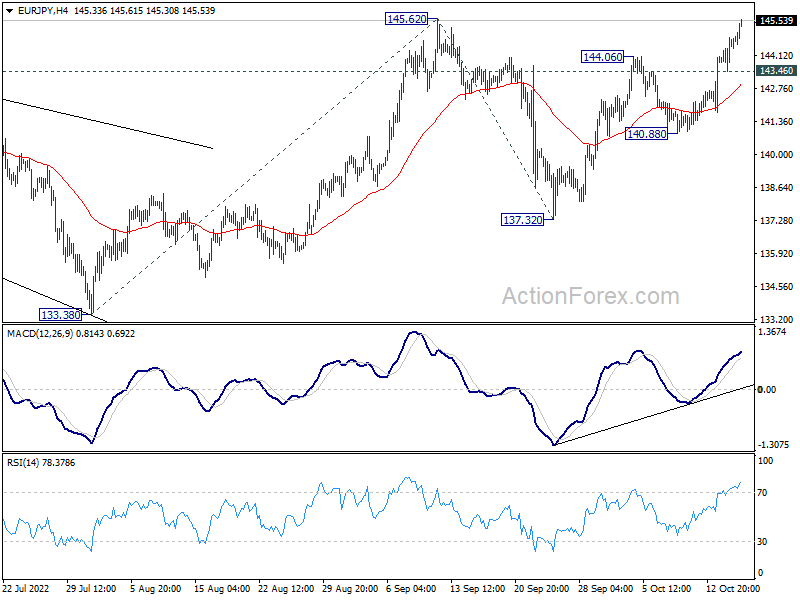
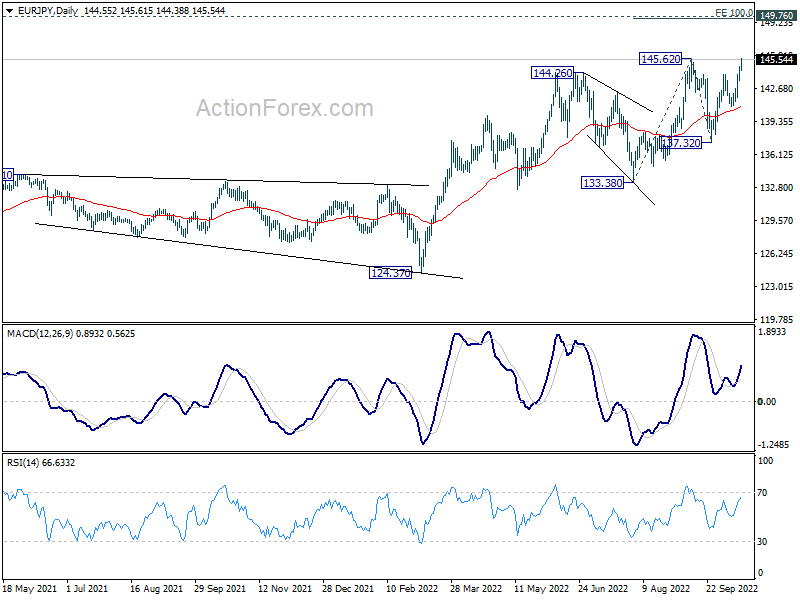
Intraday bias in EUR/JPY remains on the upside at this point. Decisive break of 145.62 resistance will will confirm up trend resumption. Next target is 100% projection of 133.38 to 145.62 from 137.32 at 149.56, which is close to 149.76 long term resistance. On the downside, below 143.46 minor support will turn intraday bias neutral first.
EUR/JPY Mid-Day Outlook
In the bigger picture, as long as 133.38 support holds, the up trend from 114.42 (2020 low) could still extend through 145.62 high. In that case, next target is 149.76 (2015 high). However, sustained break of 133.38 will be a sign of medium term bearish reversal and bring deeper fall to 124.37 support first.
GBP/JPY Mid-Day Outlook
Daily Pivots: (S1) 165.15; (P) 166.18; (R1) 167.34; More...
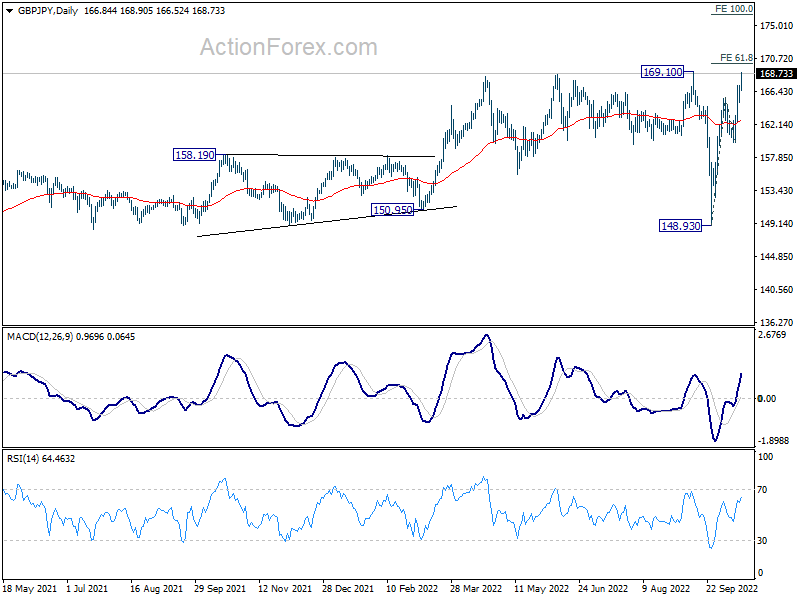
GBP?JPY's rally continues today and intraday bias stays on the upside for 169.10. Firm break there will target 61.8% projection of 148.93 to 165.69 from 159.71 at 170.06, and then 100% projection at 176.47. On the downside, below 165.00 minor support will turn Intraday bias neutral first.
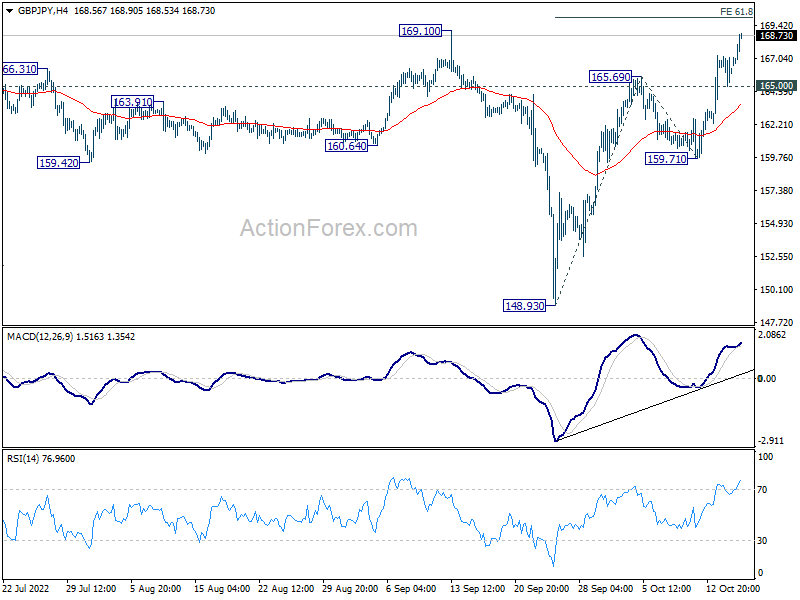
In the bigger picture, current development suggests that up trend from 123.94 (2020 low) is still in progress. Sustained break of 61.8% retracement of 195.86 (2015 high) to 122.75 (2016 low) at 167.93 will pave the way to retest 195.86 high. This will now remain the favored case as long as 148.93 support holds.
Sterling Supported by UK Tax Measures Reversal, Yen Weakness Continues
Sterling is trading as the strongest one for today so far, even though there is not clear follow through buying except versus Yen. The Pound is supported by UK Finance Minister Jeremy Hunt's decision that the government will reverse "almost all" the tax measures in the Growth Plan announced just three weeks ago. Yen's decline continues but selloff is mainly seen against European majors. Dollar is trading on the soft side, and would remain so if US stocks could extend the pre-session rebound.
Technically, both EUR/JPY and GBP/JPY are edging closer to near term resistance at 145.62 and 169.10 respectively. Decisive break of these levels will confirm larger up trend resumption. Given that USD/JPY bulls are on the guard of Japan's intervention at around 150 handle, rally in EUR/JPY and GBP/JPY could help push EUR/USD and GBP/USD higher. But, the prerequisite is there is no clear deterioration in sentiment in stock and bond markets.
In Europe, at the time of writing, FTSE is up 0.83%. DAX is up 1.42%. CAC is u 1.21%. Germany 10-year yield is down -0.123 at 2.230. Earlier in Asia, Nikkei dropped -1.16%. Hong Kong HSI rose 0.15%. China Shanghai SSE rose 0.42%. Singapore Strait Times dropped -0.78%. Japan 10-year JGB yield dropped -0.0012 to 0.253.
US Empire State manufacturing dropped to -9.1 in Oct
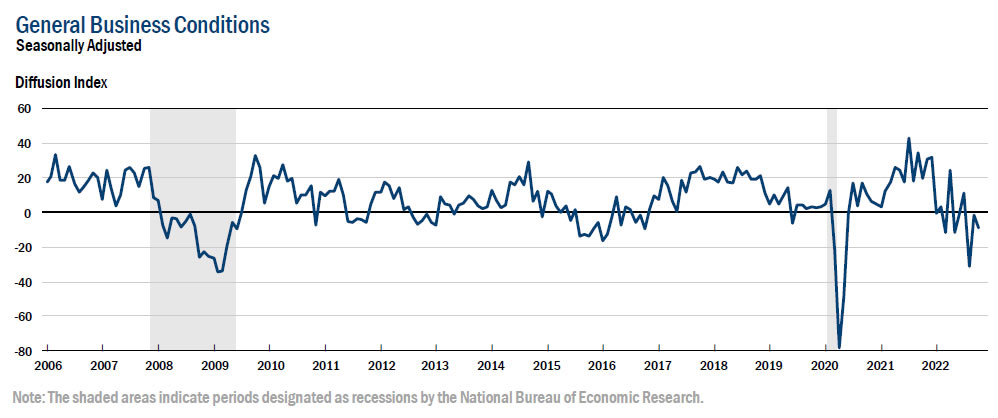
US Empire State Manufacturing index dropped sharply from 1.5 to -9.1 in October. 23% of respondents reported that conditions had improved while 32% said worsened. After falling significantly over the prior three months, the prices paid index rose nine points to 48.6. The prices received index held steady at 22.9.
Index for future conditions dropped from 8.2 to -1.8. indicating that firms do not expect conditions to improve over the next six months.
Japan Suzuki: Will take decisive action on excessive volatility
There is no clear sign of intervention by Japan so far, as USD/JPY is trading in tight range close to 32-yr high. Finance Minister Shunichi Suzuki just said, "if we see excessive volatility caused by speculative moves, we will take decisive action. There is no change in this view at all."
Separately, BoJ Governor Haruhiko Kuroda said in a parliamentary session, Japan's economy is in the midst of recovery from COVID-19. Higher commodity prices, on the back of the situation in Ukraine, have been leading to an outflow of income from Japan to overseas, adding downward pressure on the economy."
"For now, we think it appropriate to continue with monetary easing because it's necessary to support the economy and achieve our inflation target in a sustainable and stable fashion accompanied by wage growth," he added.
NZ BNZ services dropped to 55.8 in Sep
New Zealand BusinessNZ Performance of Services Index dropped from 58.6 to 55.8 in September. Looking at some details, activity/sales dropped from 67.5 to 59.2. Employment ticked down from 50.7 to 50.5. New orders/business dropped from 66.6 to 62.9. Stocks/inventories dropped from 59.6 to 54.9. Supplier deliveries was unchanged at 49.7.
BNZ Senior Economist Craig Ebert said that "the composite PCI held together at 54.4 in free-weighted terms, while the GDP weighted composite came in at 55.4, from 58.2 in August. These marry with our view that Q3 GDP increased about 1.0%".
GBP/JPY Mid-Day Outlook
Daily Pivots: (S1) 165.15; (P) 166.18; (R1) 167.34; More...
GBP?JPY's rally continues today and intraday bias stays on the upside for 169.10. Firm break there will target 61.8% projection of 148.93 to 165.69 from 159.71 at 170.06, and then 100% projection at 176.47. On the downside, below 165.00 minor support will turn Intraday bias neutral first.
In the bigger picture, current development suggests that up trend from 123.94 (2020 low) is still in progress. Sustained break of 61.8% retracement of 195.86 (2015 high) to 122.75 (2016 low) at 167.93 will pave the way to retest 195.86 high. This will now remain the favored case as long as 148.93 support holds.
Economic Indicators Update
| GMT | Ccy | Events | Actual | Forecast | Previous | Revised |
|---|---|---|---|---|---|---|
| 21:30 | NZD | Business NZ PSI Sep | 55.8 | 58.6 | ||
| 23:01 | GBP | Rightmove House Price Index M/M Oct | 9 | 0.70% | ||
| 04:30 | JPY | Tertiary Industry Index M/M Aug | 0.70% | 0.40% | -0.60% | |
| 04:30 | JPY | Industrial Production M/M Aug F | 3.40% | 2.70% | 2.70% | |
| 12:30 | USD | Empire State Manufacturing Index Oct | -9.1 | -1 | -1.5 | |
| 14:30 | CAD | BoC Business Outlook Survey |
US Empire State manufacturing dropped to -9.1 in Oct
US Empire State Manufacturing index dropped sharply from 1.5 to -9.1 in October. 23% of respondents reported that conditions had improved while 32% said worsened. After falling significantly over the prior three months, the prices paid index rose nine points to 48.6. The prices received index held steady at 22.9.
Index for future conditions dropped from 8.2 to -1.8. indicating that firms do not expect conditions to improve over the next six months.
Gold to Rally in 2023? Watch the Elliott Wave Pattern, COT Data and US Yields
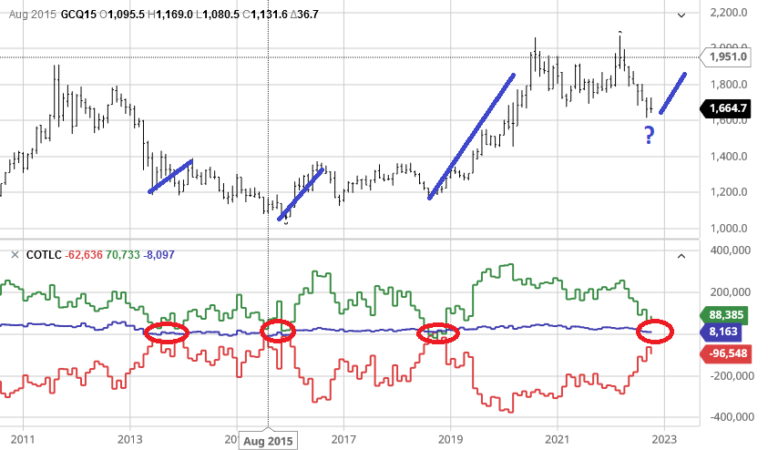
COT data is very important for gold as it’s tracked closely by a lot investors and speculators, especially for a longer-term approach. Looking at the Non-Commercials or Large Speculators, we can see that those are still heavily short, but they are approaching similar readings compared to 2013, 2015 and 2018. Notice that all of those extreme levels lead to a reversal, a rise in price, which can be very interesting now as well, especially when adding an Elliott wave count that shows a five wave drop from the high, now in late stages. In fact, there can be an ending diagonal with nice support at 1600/1610.
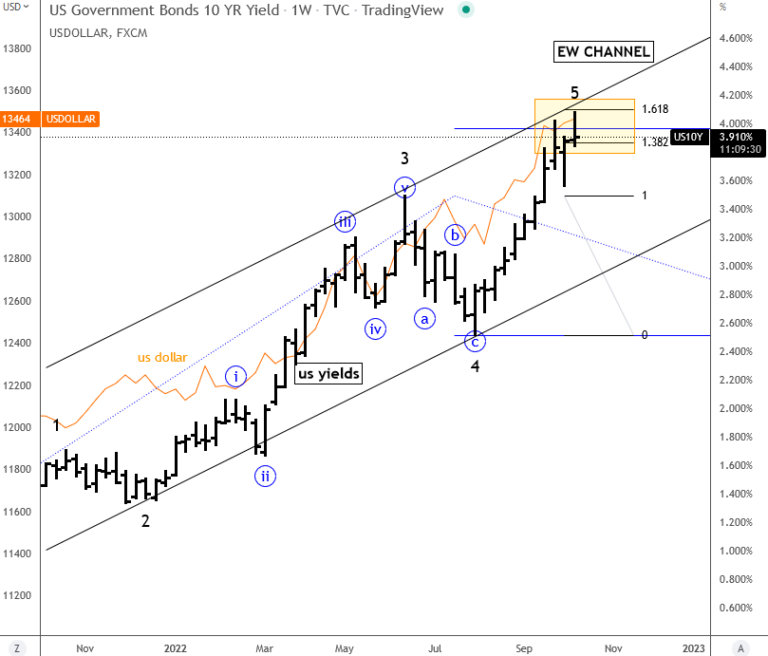
At the same time, we have to respect the US yields of course, which are still on the rise and that’s why we see gold coming down as USD trades higher in risk-off environment. So for gold to recover we also have to ask ourselves, what can trigger a turning point? Well, it can be the FED, if they will be forced to slow down the hawkish approach next year, possibly if jobs data gets worse, or if they will be successful fighting the inflation. From an Elliott wave perspective, we see 10 year US yields in late stages of an impulse, so a slow down of a bull run would not be a surprise, since we know that after every five waves market makes a minimum three wave retracement.
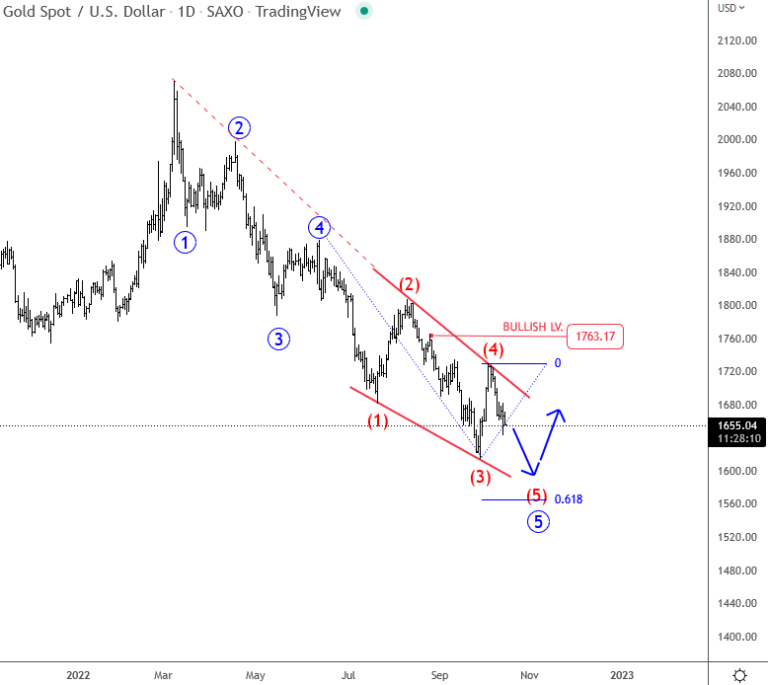
So, will gold really slow down and turn higher next year? It’s too soon to tell, but so far we have some nice development here, which will be interesting to track from an intraday perspective as well. So if you like gold, silver or dollar, make sure to check our services where we offer Elliott wave updates on a daily basis.
WTI Oil: Friday’s Bearish Engulfing Weighs on Near-Term Action
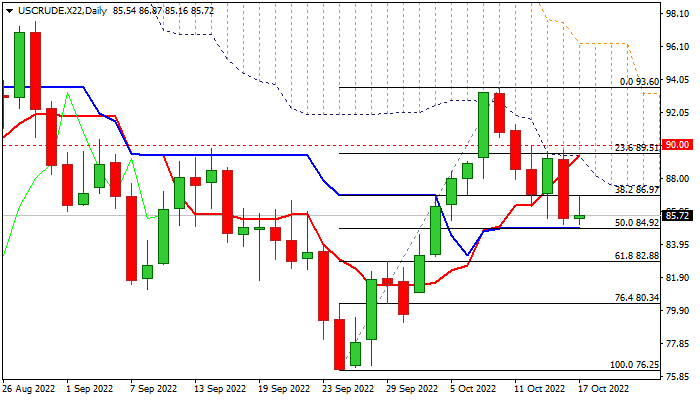
WTI oil remains under pressure at the beginning of the week, following Friday’s 4% drop (the biggest one-day loss since Sep 23) and continuing to pressure pivotal support at $84.92 (daily Kijun-sen/50% retracement of $76.25/$93.60 rally).
The optimism on expectations for a stronger fuel demand from China, after the government announced a liquidity measures to boost the economy, had so far limited positive impact, though OPEC+ decision to cut production by 2 million bpd as from Nov1, would keep the price afloat.
Technical studies show fading bullish momentum on daily chart, mixed MA’s and oversold stochastic, lacking clear direction signal, though near-term action is weighed by Friday’s large bearish candle which also created a bearish engulfing pattern, as well as thick falling daily Ichimoku cloud, which capped the recent recovery and continues to track the downleg from $93.60 top.
Firm break of $84.92 pivot to signal bearish continuation and expose next pivot at $82.88 (Fibo 61.8%), loss of which would risk deeper fall.
Only bounce into daily cloud (base lays at $88.17) and regain of broken psychological $90 level would improve the structure and shift near-term focus to the upside.
Res: 86.97; 87.55; 88.17; 89.51.
Sup: 84.92; 83.21; 82.88; 81.00.
UK Inflation Set to Hit Double Digits Again Amid Political Uncertainty
The UK has been in political disarray recently, with the UK government announcing more reversals to its fiscal plans, the chancellor of the exchequer being replaced, and Conservative lawmakers preparing to submit letters of no confidence in the new prime minister. In the midst of this political drama, on Wednesday at 06:00 GMT, data is expected to reveal that UK inflation rebounded to double digits again. What does this mean for the BoE’s future course of action and how may the pound respond?
UK political scene into chaos
As if the UK economy has not been through enough storms during the last years, with the Brexit saga, the COVID pandemic, the supply shortages thereafter and the adverse effects of the war in Ukraine, the recent uncertainty surrounding politics is yet another storm hitting a ship already in trouble.
The announcement of the new government’s fiscal plans last month sent UK markets into tailspin, with UK bonds and the pound tumbling as investors got nervous that the measures will only serve to fuel further sky-high inflation and the already ballooned budget deficit. The rescue response came from the BoE, which enacted an emergency bond-buying scheme, raising speculation of bigger hikes in order to put out the stronger inflation flames and offset any potential loosening in financial conditions.
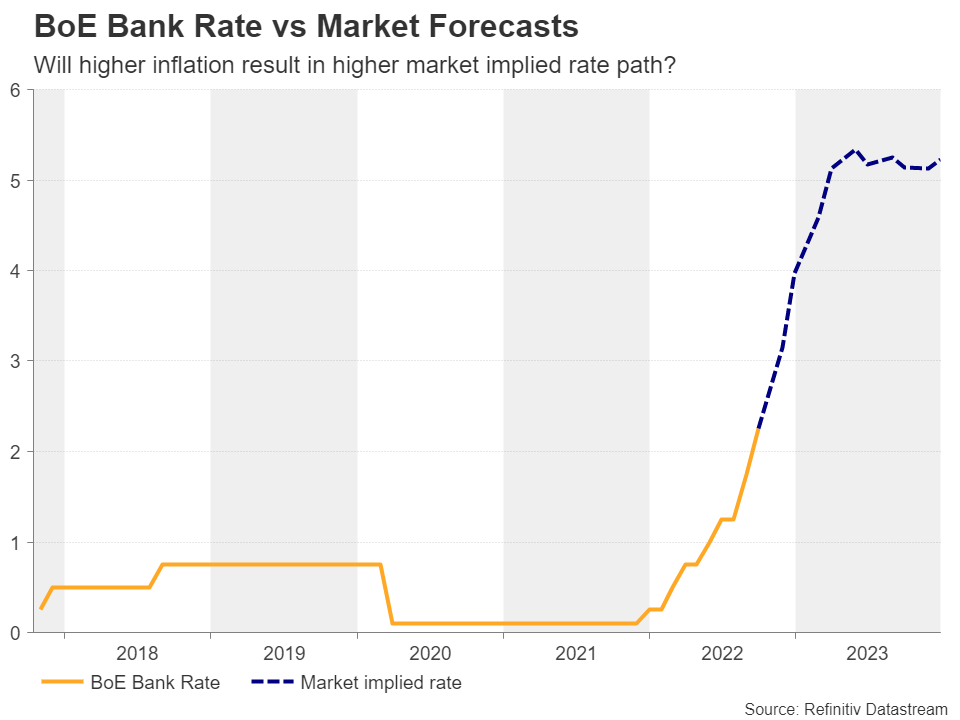
Up until Thursday, market participants were almost certain that the Bank would raise interest rates by a full percentage point at its November gathering. However, following reports that the government will likely proceed with more reversals to its announced policies, the probability for a 100-bps hike has slid to around 50% on Friday, before rebounding back to 85% on Monday.
Inflation to hit double digits again
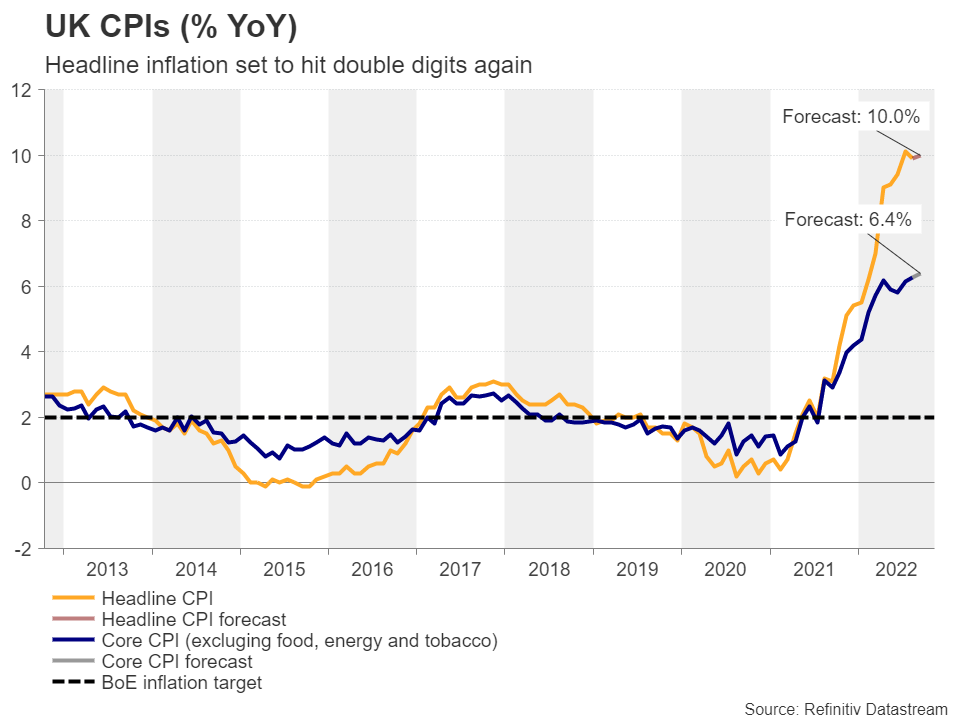
With investors shifting their BoE hike bets on a daily basis, Wednesday’s inflation data may attract special attention, although due to the likelihood of a leadership contest, politics will possibly stay on the top of investors’ agendas this week as well. The headline rate is forecast to have hit double digits again, rebounding to 10.0 % y/y from 9.9%, while the core is expected to have ticked up to 6.4% from 6.3%. This implies that the rise in headline inflation may not be only due to volatile and temporary items and may prompt market participants to increase bets of a full percentage point hike.
This could initially support the pound, but the advance may be limited and short-lived. Recent history has shown that pound traders are more concerned that bigger hikes by the BoE will only assist in dragging the UK economy into recession, rather than relieving their pockets from the pain of high consumer prices; and with the UK economy probably already shrinking during Q3, those fears are more than rational.
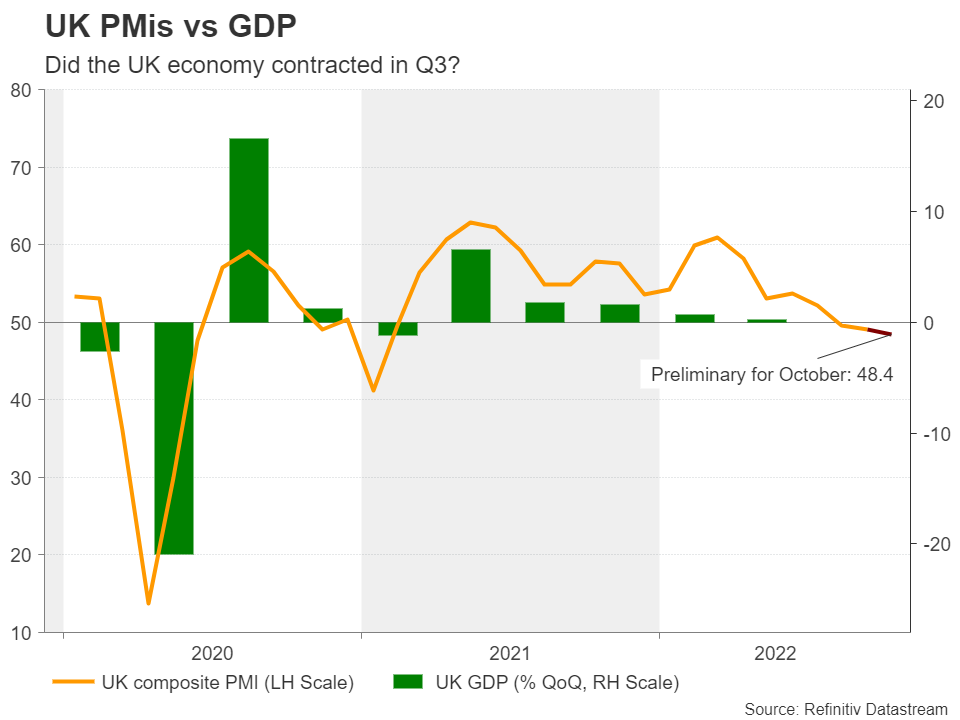
Despite the GDP estimate for Q2 being revised up to +0.2% q/q from -0.1%, the likelihood of a contraction during the third quarter is high. Data has shown that the economy contracted by 0.3% m/m in August, with the September number likely to be even lower due to the nation coming to a standstill for the Queen’s funeral. The slide in the composite PMI for September deeper into contractionary territory, and expectations of another slip in retail sales for the month, due to be released on Friday, add extra credence to that view.
Pound to struggle on
Pound/dollar continues to trade below the downtrend line drawn from the high of February 23, which still points to a negative outlook, despite the latest strong recovery and the higher low formed last week.
Even if the pair extends its recovery due to accelerating inflation, it could meet strong resistance near the 1.1500 zone or near the downtrend line, where another round of selling may result in the breach of the 1.0930 barrier, and perhaps set the stage for declines towards the record low of 1.0380, hit on September 26.
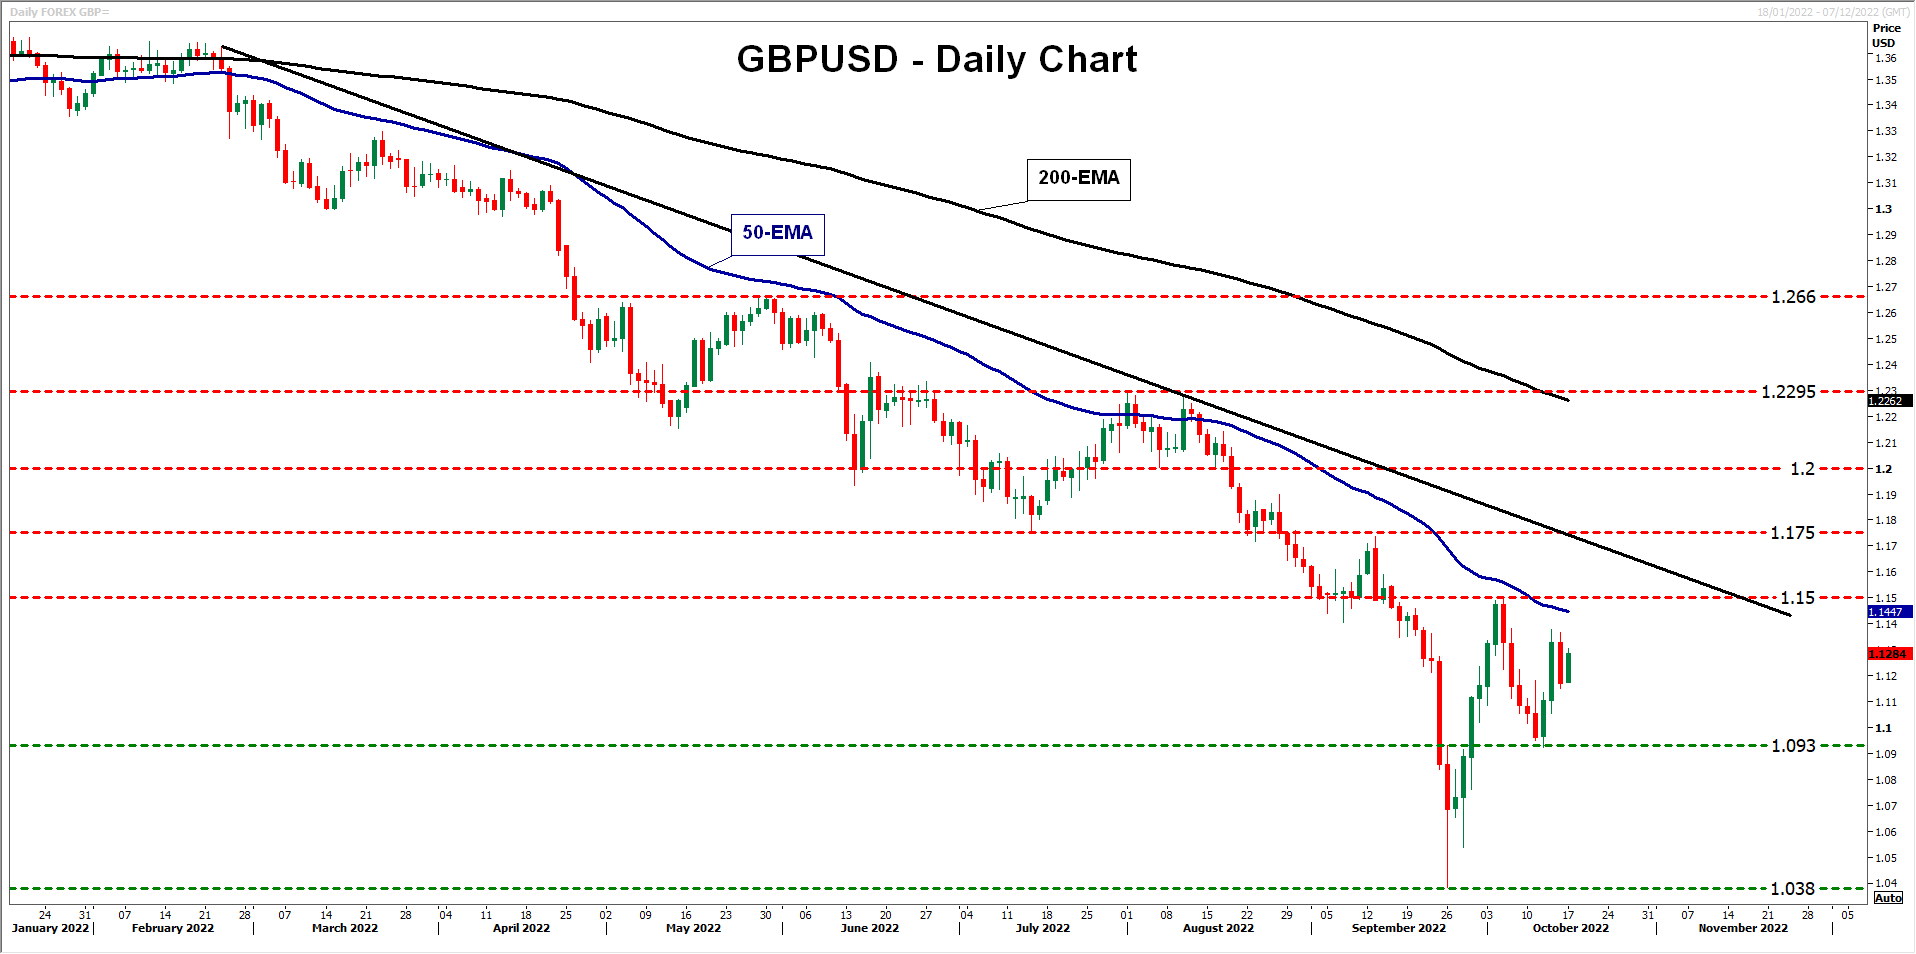
On the upside, the move signaling that the bulls have stolen all the bears’ weapons may be a break above the high of September 13 at 1.1750. But for any gains to be meaningful and lasting, UK data need to start suggesting that the economic wounds are healing, headlines may need to start pointing towards restoration of political stability, and the Fed may have to start considering a slower rate path moving forwards. The bulls could then get confident to climb to the 1.2000 territory, where another break may extend the advance towards the 1.2295 barrier.
EUR/USD: Near-Term Action Looks for Clearer Direction Signals
The Euro is standing at the front foot in early European trading on Monday, following a large swings on Thu/Fri.
The action was repeatedly capped by falling 10DMA which reinforces a Fibo barrier at 0.9772 (38.2% of 0.9999/0.9631 bear-leg), with near-term bias expected to remain in neutral mode, while the latter caps.
Mixed daily studies (strong bullish momentum vs MA’s in bearish setup) contribute to directionless near-term mode.
Expect initial bullish signal on break and close above 0.9772 and Thu/Fri tops at 0.9808 that would open way for further recovery and expose pivotal barriers at 0.9859 (Fibo 61.8) and 0.9866 (daily Kijun-sen).
Conversely, dip and close below 0.9718/12 (broken Fibo 23.6% of 0.9999/0.9631 / Fibo 61.8% of 0.9535/0.9999)) would weaken near-term structure and make the downside more vulnerable.
Res: 0.9822; 0.9866; 0.9890; 0.9926.
Sup: 0.9712; 0.9667; 0.9631; 0.9569.
Gold Extends Decline after Rebound Falters
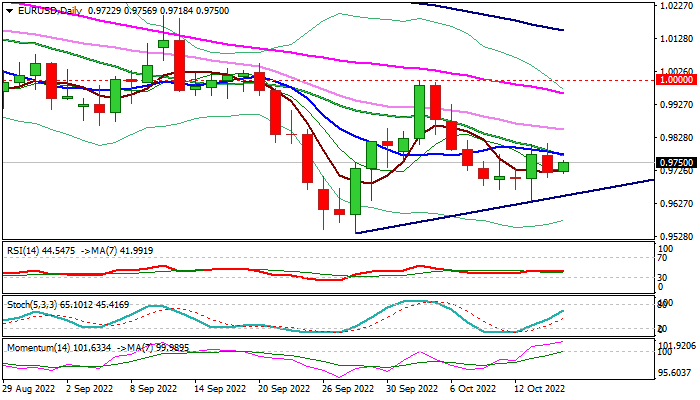
Gold has been losing ground since early March, generating a profound structure of lower highs and lower lows. Even though the precious metal rebounded strongly from the 29-month low of 1,614 and jumped above its restrictive trend line, it quickly retreated again within its long-term descending channel.
The short-term oscillators currently suggest that bearish forces remain in control. Specifically, the RSI is flatlining beneath its 50-neutral mark, while the MACD histogram has dropped below its red signal line in the negative territory.
Should selling pressures persist, the recent support zone of 1,640 could act as the first line of defence. Sliding beneath that floor, any further declines may then cease at the 29-month low of 1,614. Failing to halt there, the price could descend to form fresh multi-month lows, where the April 2020 support of 1,566 might curb any further downside moves.
On the flipside, bullish actions could propel bullion towards 1,688, which has acted as both support and resistance in the past two months. Conquering this barricade, the bulls could aim for the recent rejection region of 1,730. Jumping above that zone, the price may ascend towards 1,765 or higher to test the August high of 1,807.
Overall, despite the recent attempts of a trend reversal, gold retreated back to its long-term descending pattern. Therefore, the downtrend is likely to resume, unless the price advances decisively above the upper boundary of its declining channel.
EURUSD Stays Within a Range; Support at 0.9700
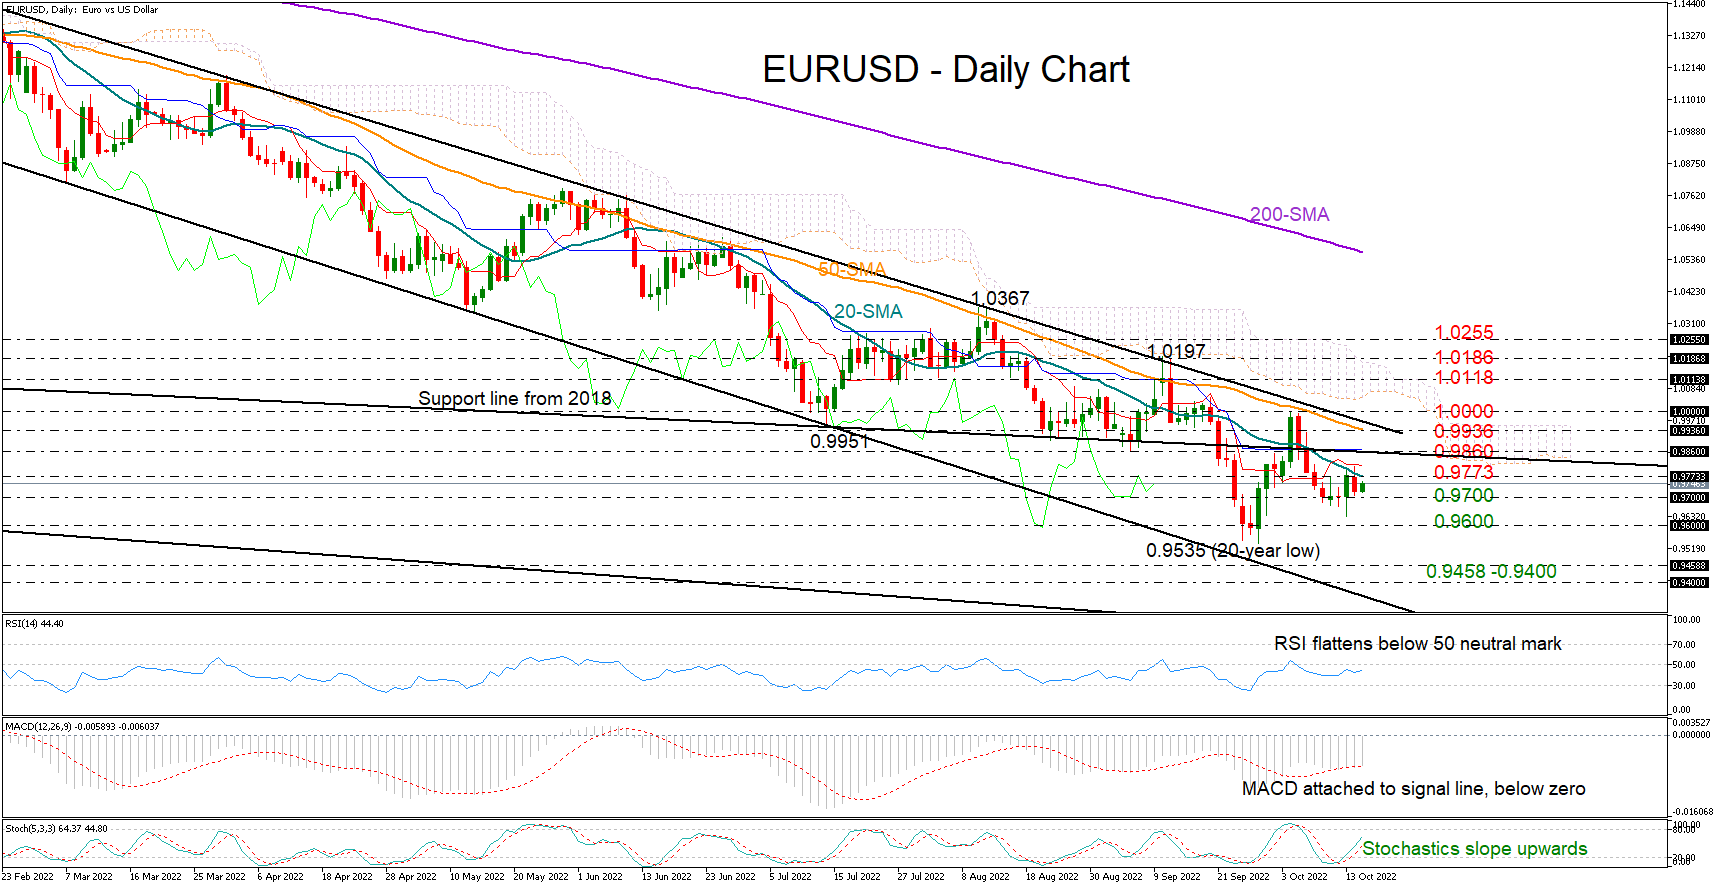
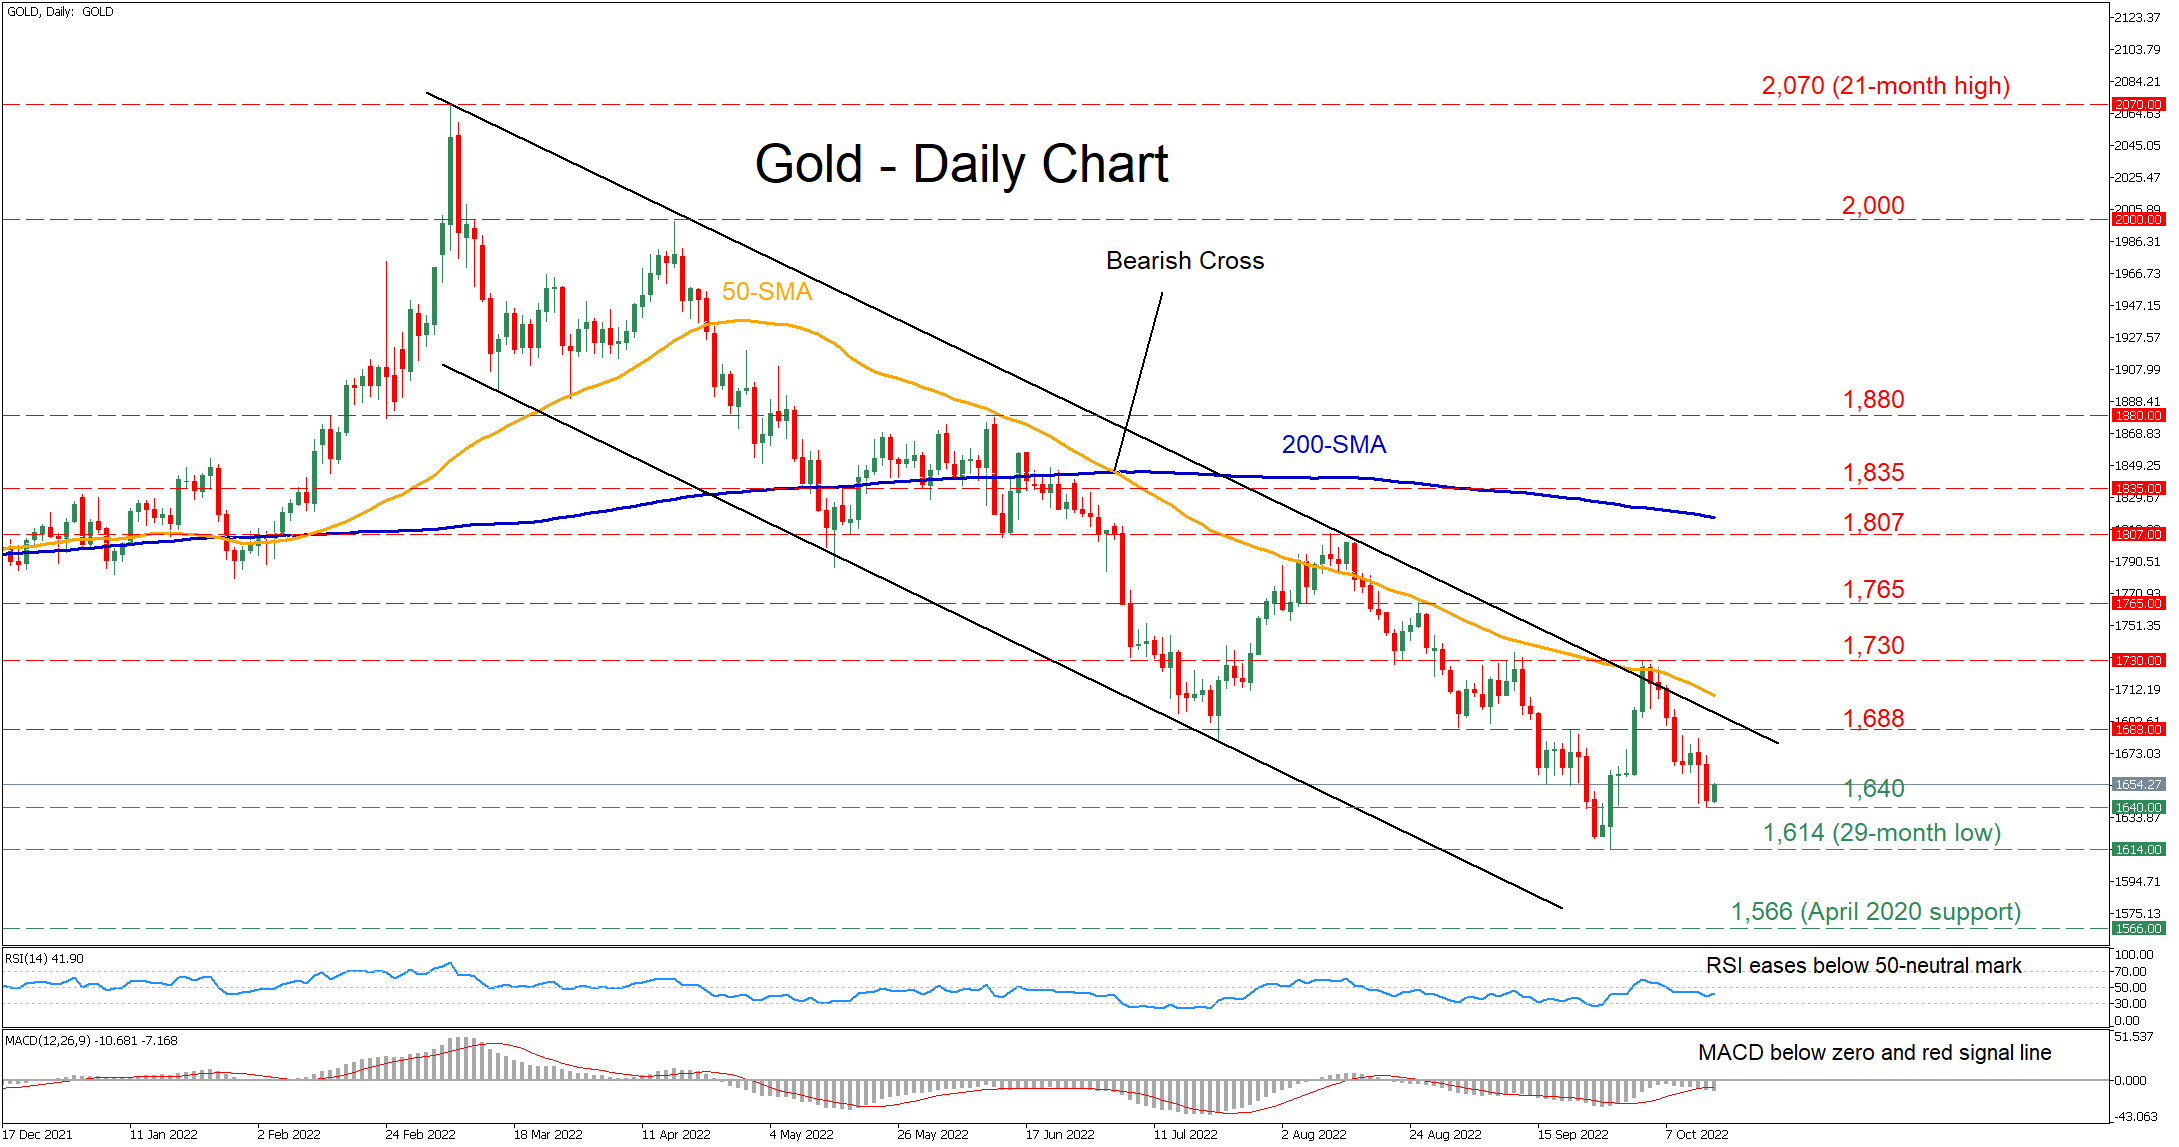
EURUSD retained a strong footing around the 0.9700 level despite the flash drop to 0.9631 last week and the downside pressures near the 20-day simple moving average (SMA).
The pair continued to trade with weak momentum early on Monday as technical signals provided no clear direction. Although above their recent lows, the RSI is moving sideways below its 50 neutral mark and the MACD is still attached to its red signal line in the negative area. On the other hand, the stochastics have resumed their positive trajectory, reducing the odds for a downturn.
The 0.9773 – 0.9860 resistance zone, which encapsulates the 20-day SMA, will be closely watched in the short term. Any failure to pierce through that bar could squeeze the price back to September’s lows registered within the 0.9600-0.9535 area. A more aggressive decline could initially pause somewhere between 0.9458 and 0.9400 before testing the lower boundary of the bearish channel.
Otherwise, a break above 0.9860 could face fresh limitations near the 50-day SMA and the channel’s upper boundary around 0.9936. If the bulls manage to reclaim parity above the previous high, the recovery could speed up to 1.0118. Traders may consider the scenario of a bullish trend reversal more seriously if the rally extends beyond the 1.0186-1.0255 region.
Summarizing, EURUSD is currently lacking impetus in the short-term picture. A step below 0.9700 could trigger the next bearish round, whilst a decisive close above 0.9773-0.9860 is probably required to boost buying sentiment.