

Sample Category Title
USD/CAD Daily Outlook
Daily Pivots: (S1) 1.3650; (P) 1.3765; (R1) 1.3832; More...
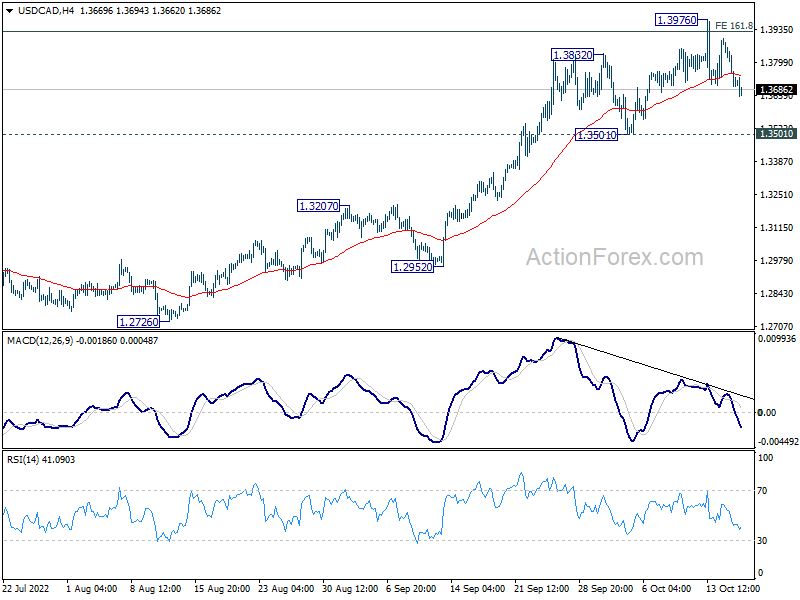
USD/CAD is staying in consolidation from 1.3976 and intraday bias remains neutral. Outlook will stay bullish as long as 1.3501 support holds. Firm break of 1.3976 will resume larger up trend, and target 200% projection of 1.2005 to 1.2947 from 1.2401 at 1.4285.
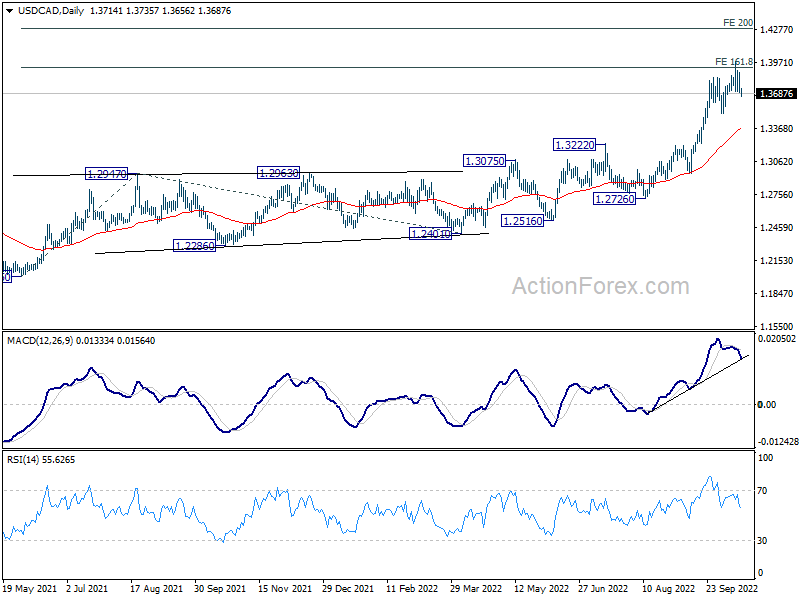
In the bigger picture, up trend from 1.2005 (2021 low) is still in progress. Based on current impulsive momentum, it could be resuming long term up trend from 0.9056 (2007 low). Whether it is or it isn't, retest of 1.4689 (2016 high) should be seen next. This will now remain the favored case as long as 1.3222 resistance turned support holds.
EUR/GBP Daily Outlook
Daily Pivots: (S1) 0.8600; (P) 0.8643; (R1) 0.8707; More...
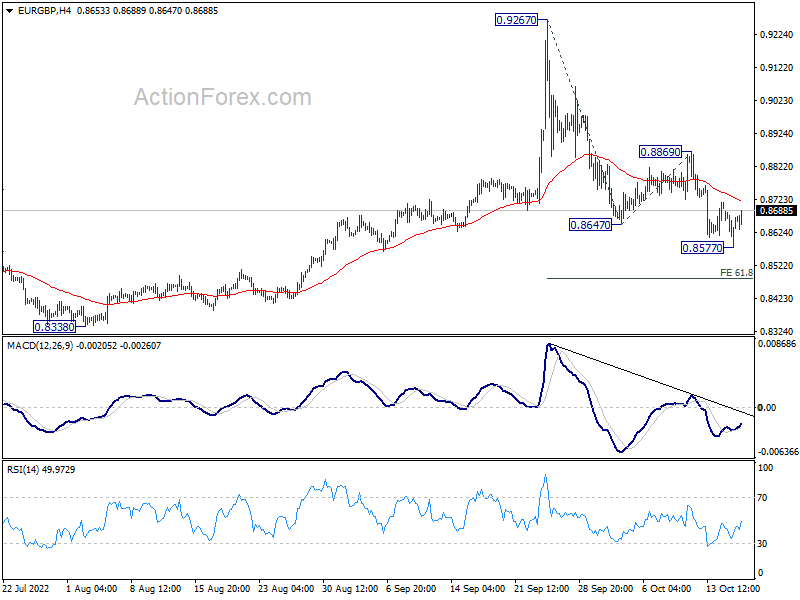
EUR/GBP dipped to 0.8577 but quickly recovered. Intraday bias stays neutral at this point. Further decline is expected with 0.8869 resistance intact. On the downside, break of 0.8577 will resume the fall from 0.9267, and target 61.8% projection of 0.9267 to 0.8647 from 0.8869 at 0.8486.
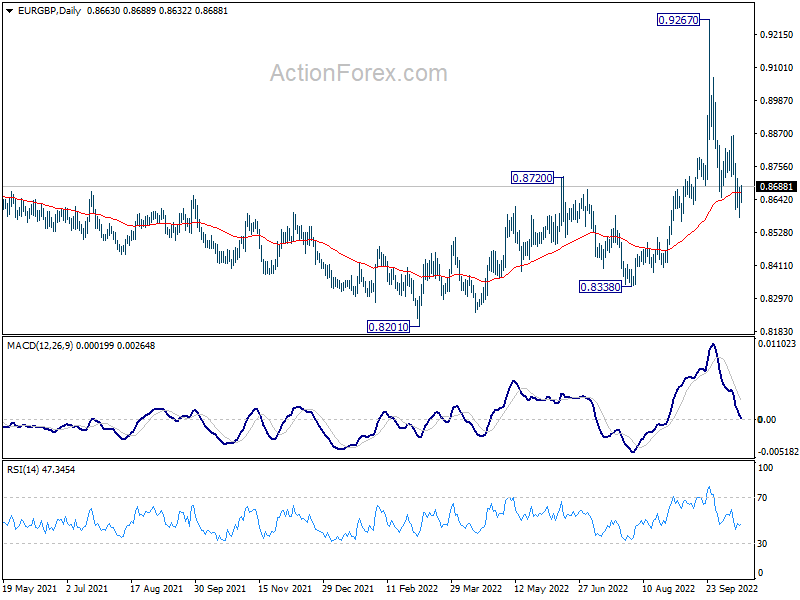
In the bigger picture, current development suggests that fall from 0.9267 is a down leg inside long term range pattern. Deeper fall could be seen towards 0.8201/8338 support zone. But strong support should be seen there to bring reversal.
EUR/AUD Daily Outlook
Daily Pivots: (S1) 1.5573; (P) 1.5631; (R1) 1.5700; More...
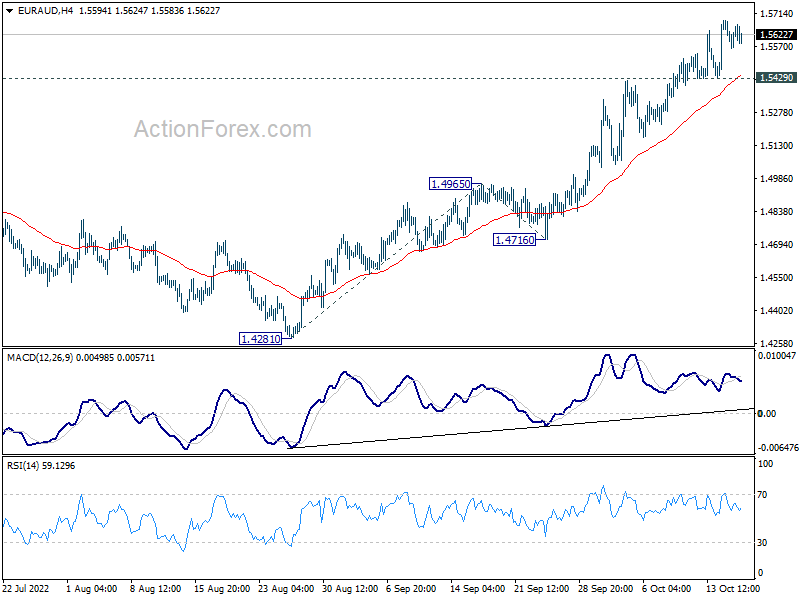
Intraday bias in EUR/AUD stays on the upside with 1.5429 minor support intact. Current rise should target 161.8% projection of 1.4281 to 1.4965 from 1.4716 at 1.5823. On the downside, break of 1.5429 minor support will turn intraday bias neutral and bring consolidation first, before staging another rally.
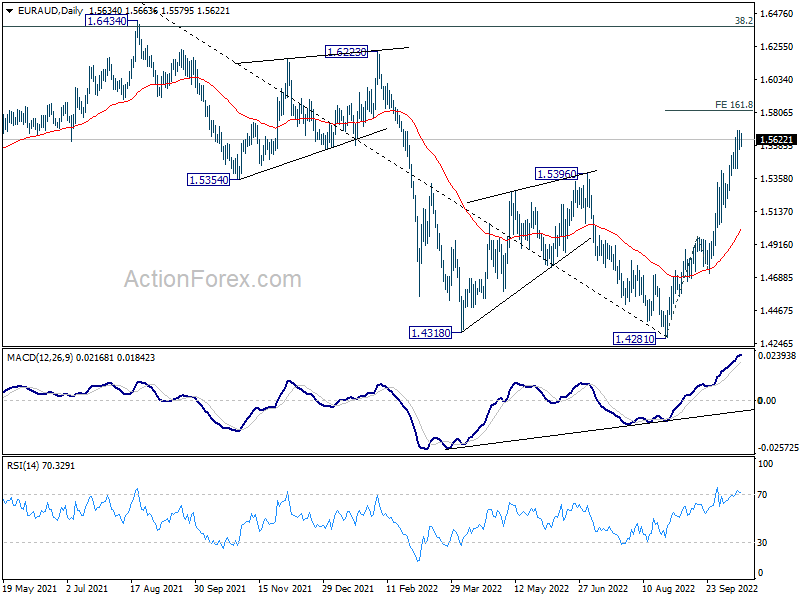
In the bigger picture, a medium term bottom should be in place at 1.4281, on bullish convergence condition in daily MACD. Further rise would be seen back to 1.6434 key resistance next. Break of 1.4965 resistance turned support is needed to indicate reversal. Otherwise, further rally will remain in favor.
EUR/CHF Daily Outlook
Daily Pivots: (S1) 0.9762; (P) 0.9785; (R1) 0.9828; More....
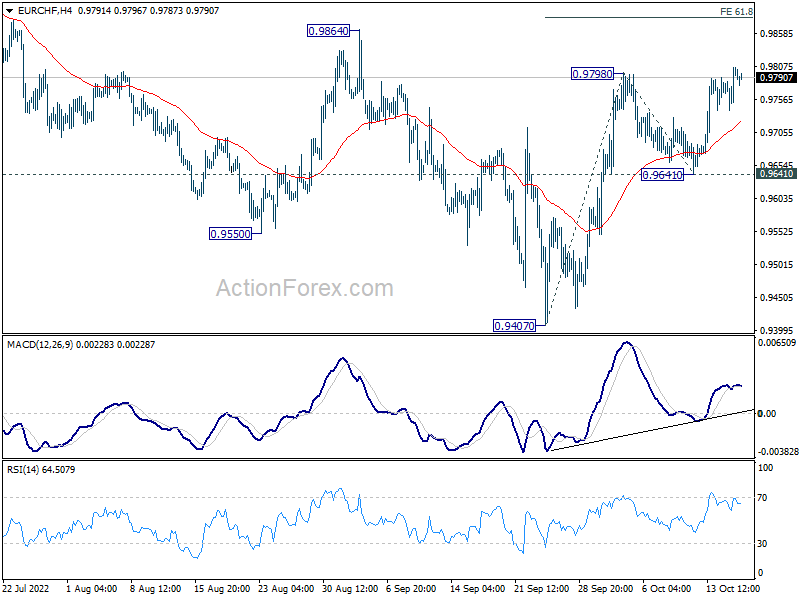
Intraday bias in EUR/CHF is back on the upside as rise from 0.9407 is resuming. Further rise should be seen to 61.8% projection of 0.9407 to 0.9798 from 0.9641 at 0.9883. Decisive break there will solidify the case of medium term bottoming and target 100% projection at 1.0032. For now, this will remain the favored case as long as 0.9641 support holds.
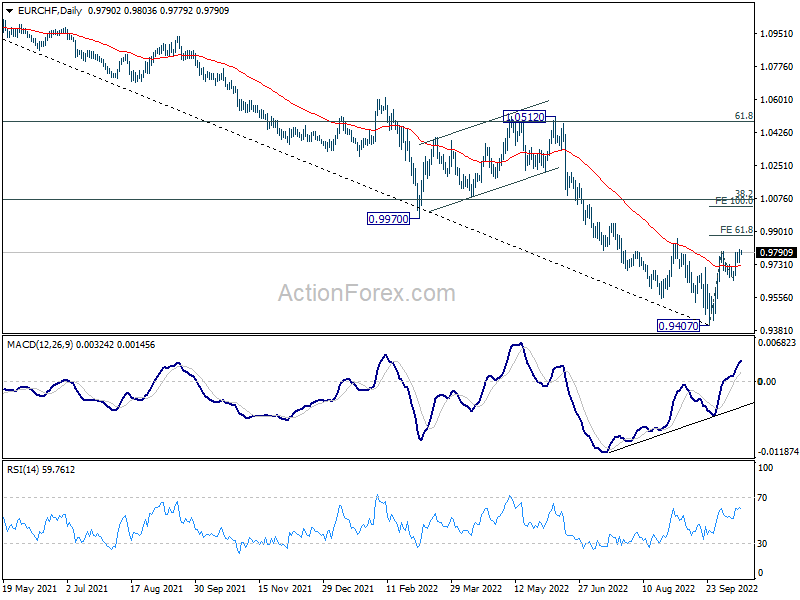
In the bigger picture, considering bullish condition in daily MACD, firm break of 0.9864 resistance will confirm medium term bottoming at 0.9407. Stronger rally should then be seen to 55 week EMA (now at 1.0138), even as a corrective rebound. Nevertheless, rejection by 0.9864 will bring down trend resumption through 0.9407 next.
GBP/JPY Daily Outlook
Daily Pivots: (S1) 167.24; (P) 168.67; (R1) 170.76; More...
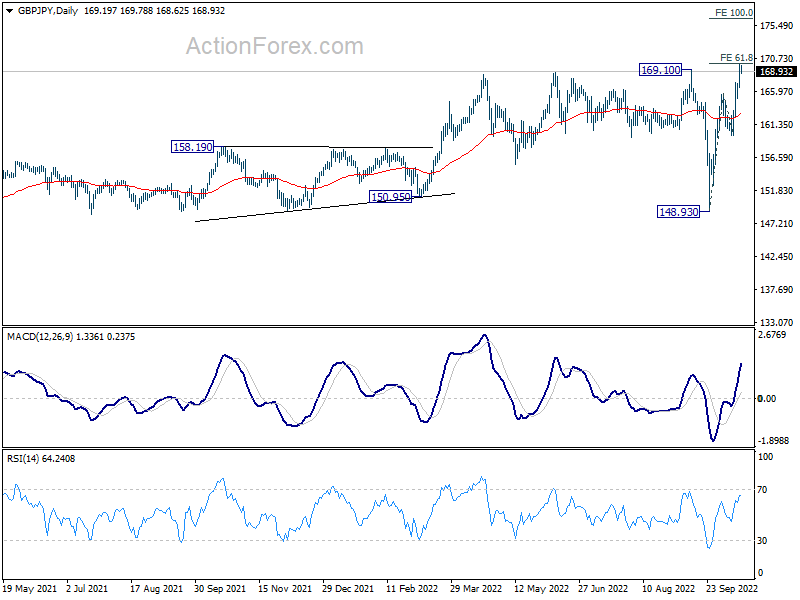
Intraday bias in GBP/JPY stays on the upside as up trend is resuming. Firm break of 61.8% projection of 148.93 to 165.69 from 159.71 at 170.06 will target 100% projection at 176.47. On the downside, below 165.00 minor support will turn Intraday bias neutral and bring consolidations first, before staging another rally.
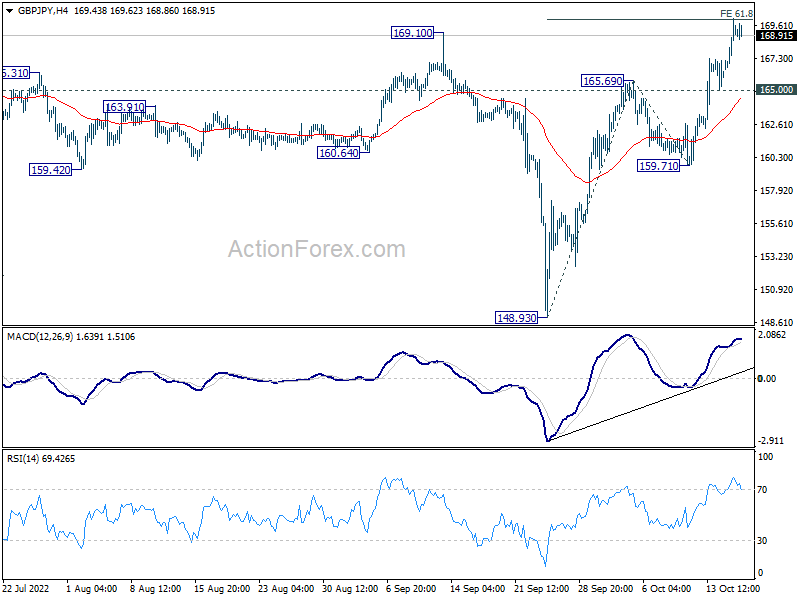
In the bigger picture, current development suggests that up trend from 123.94 (2020 low) is still in progress. Sustained break of 61.8% retracement of 195.86 (2015 high) to 122.75 (2016 low) at 167.93 will pave the way to retest 195.86 high. This will now remain the favored case as long as 148.93 support holds.
Elliott Wave Forecast: EURJPY Has Resumed Higher
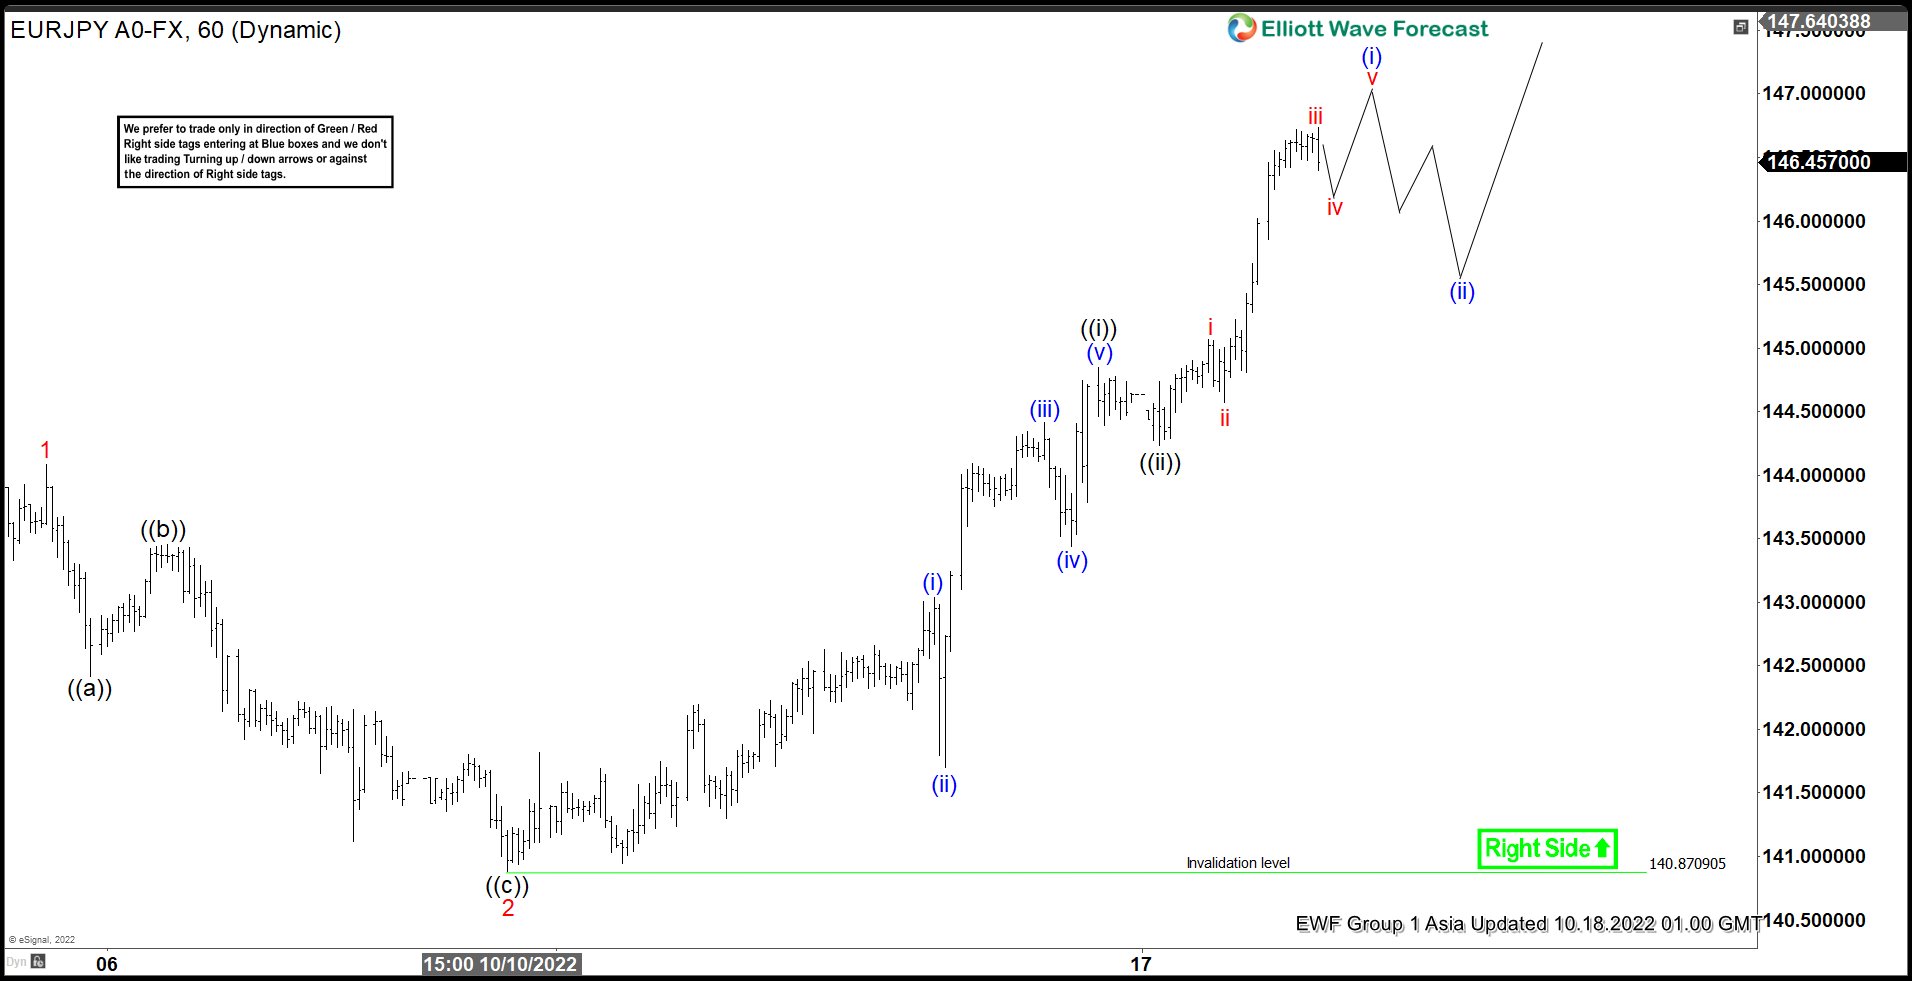
EURJPY broke above the previous high on 9.12.2022 and shows bullish sequence favoring further upside against 140.87 in the first degree. Up from 9.26.2022 low, wave 1 ended at 144.08 and dips in wave 2 ended at 140.87. The pair has resumed higher in wave 3 with internal subdivision as another 5 waves in lesser degree. Up from wave 2, wave ((i)) ended at 144.84 and dips in wave ((ii)) ended at 144.23. EURJPY then resumed higher again in wave ((iii)) as an impulse Elliott Wave structure.
Up from wave ((ii)), wave i of (i) ended at 145.08, and pullback in wave ii of (i) ended at 144.56. Pair resumes higher in wave iii of (i) towards 146.73, and pullback in wave iv of (i) ended at 146.19. Near term, we are calling one more high above wave iii to complete wave v of (i) before see a pullback in wave (ii). This wave (ii) should correct in 3, 7 or 11 swings and resumes higher again to continue with the rally in wave ((iii)). If it breaks below of wave ((ii)), then the whole rally from 140.87 low would be just wave ((i)) and the pullback is in wave ((ii)). The view for further upside is valid as we stay above 140.87.
EURJPY 60 Minutes Elliott Wave Chart
U-turn from Hunt Restores Investors’ Confidence in UK
Market movers today
Today, we get German ZEW expectations, which will probably indicate a continued downturn in the macro momentum.
In the US, we get industrial production figures for September.
Markets will listen in on hints on the Fed's take on last week's high inflation figures, when FOMC members Bostic and Kashkari speak.
The 60 second overview
UK politics: Britain's new chancellor Jeremy Hunt made a historic U-turn yesterday, when he scrapped Prime Minister Liz Truss's economic plan. The Gilt market rallied on the news with the 30Y Gilt yield down 40bp, although still higher than before the tax cuts were presented. According to FT, the Bank of England is likely to delay QT, scheduled for 31 October, until they see greater stability in gilt markets. GBP traded significantly stronger against both USD and EUR on the news.
Energy: Energy markets have provided some comfort recently with European natural gas prices trading at EUR59 per MwH, as many European gas inventories are nearly full, including Germany's. Historically this is still a high price, but it is a very big drop compared to the EUR200-300 price level we saw in August and September.
JPY: In Japan, we have seen further verbal intervention this morning from the FM and chief cabinet secretary following the JPY slide to 32-year lows against USD. As Bank of Japan's governor Kuroda indicates, FX moves are more in line with fundamentals, which explains why we have not seen JPY buying yet.
Equities: Markets rallied yesterday, without obvious triggers but a cocktail of solid earnings reports, lower yields, easing risks in the UK and easing gas prices. S&P 500 gained 2.7%, Dow 1.9%, Nasdaq 3.4% and Russell 2000 1.2%. Yesterday it was time for growth to shine, with all FANMAGs up 6-7%. Yield sensitive sectors in the lead, like real estate, consumer discretionary and tech while defensives underperformed. US futures are 2% so the rally could continue over the day.
FI: European rates declined driven by the anticipation of (yet another) a political U-turn in the UK. Bunds declined 7bp from the start and range traded through the rest of the day.
FX: In FX markets, the beginning to the week has been characterised by broad based USD weakness and a UK politics relief rally in GBP. HUF has continued its strong performance following last week's surprise hike by MNB. Overnight NZD jumped on kiwi-inflation figures while USD/JPY continues to hover just below the 149 level. Both SEK and NOK have also been off to a solid start to the week with EUR/NOK trading just above 10.30 while EUR/SEK has settled in the mid-10.90s.
Nordic macro
The parliamentary hearing of the Riksbank, planned for today, has been cancelled. It is the Riksdag, not the Riksbank that has decided this. The reason is that it would collide with the new PM presenting his government. A new date for the hearing has not yet been decided. Instead, we have to settle with a speech by Per Jansson 15:40 CET on how make sure inflation returns to target.
Technical Outlook and Review
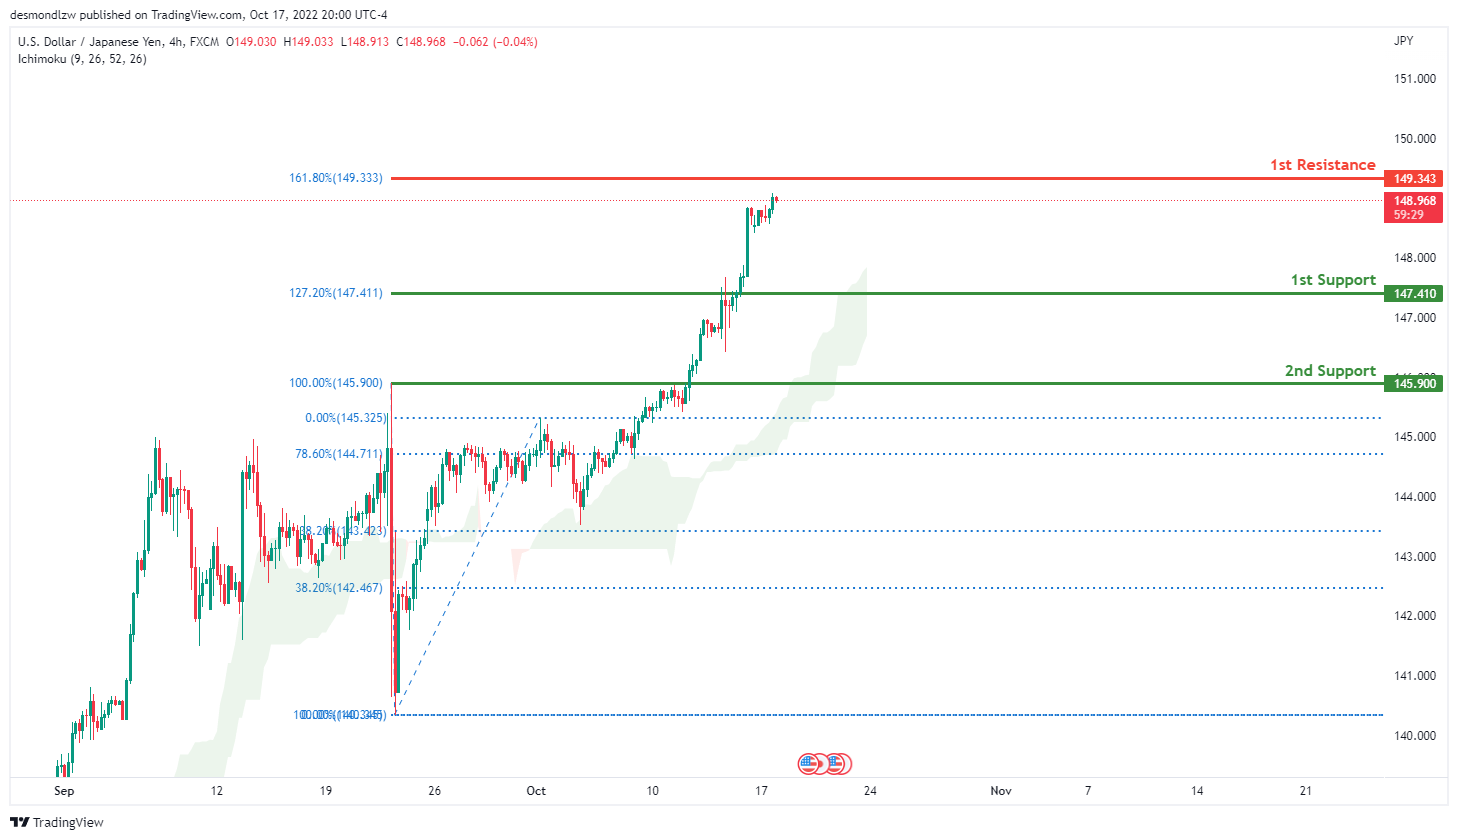
USD/JPY:
The current general bias for USDJPY on the H4 chart is bullish. To add to this bias, the price is currently trading above the Ichimoku cloud, indicating a bullish market. Price has maintained its strong bullish momentum and crossed the key level at 148.00. If this strong bullish momentum continues, expect price to continue towards the 1st resistance at 149.313 where the 161.8% Fibonacci extension is located.
Areas of consideration:
- H4 time frame, 1st resistance at 147.410
- H4 time frame, 1st support at 145.900
DXY:
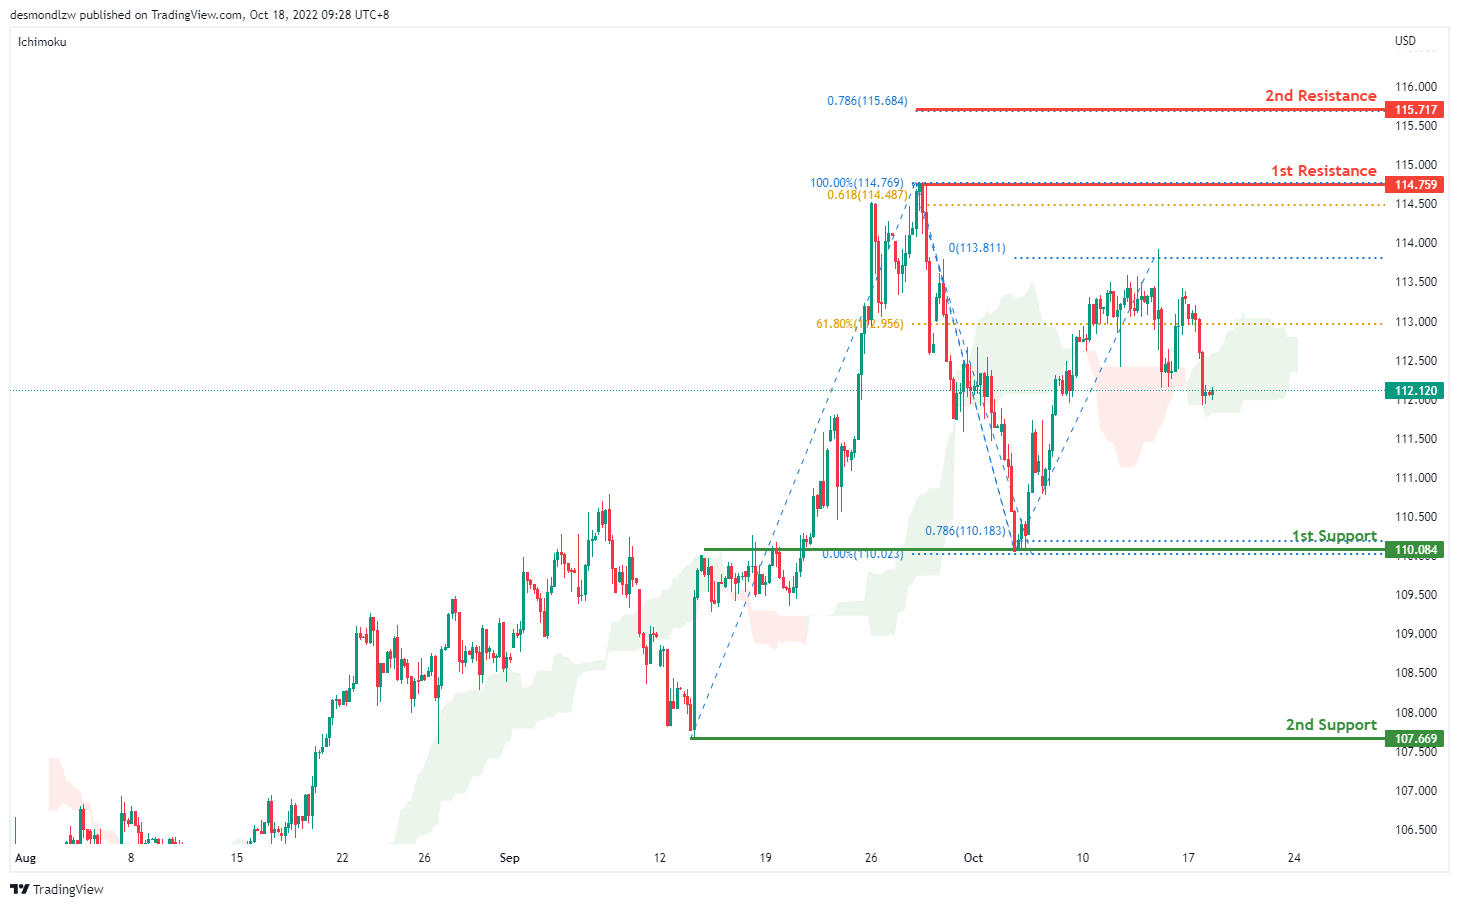
On the H4 chart, prices are moving in a descending trend signalling a bearish momentum. Prices are moving towards the first support at 110.084 where the swing low sits. if it breaks this level, bearish momentum will bring price to second support at 107.669. Alternatively if bullish momentum continues it will bring price to 114.759 and if it breaks this level, bullish momentum will carry price to 115.717 where the 78.6% projection.
Areas of consideration:
- H4 time frame, 1st resistance at 114.759
- H4 time frame, 1st support at 110.084
EUR/USD:
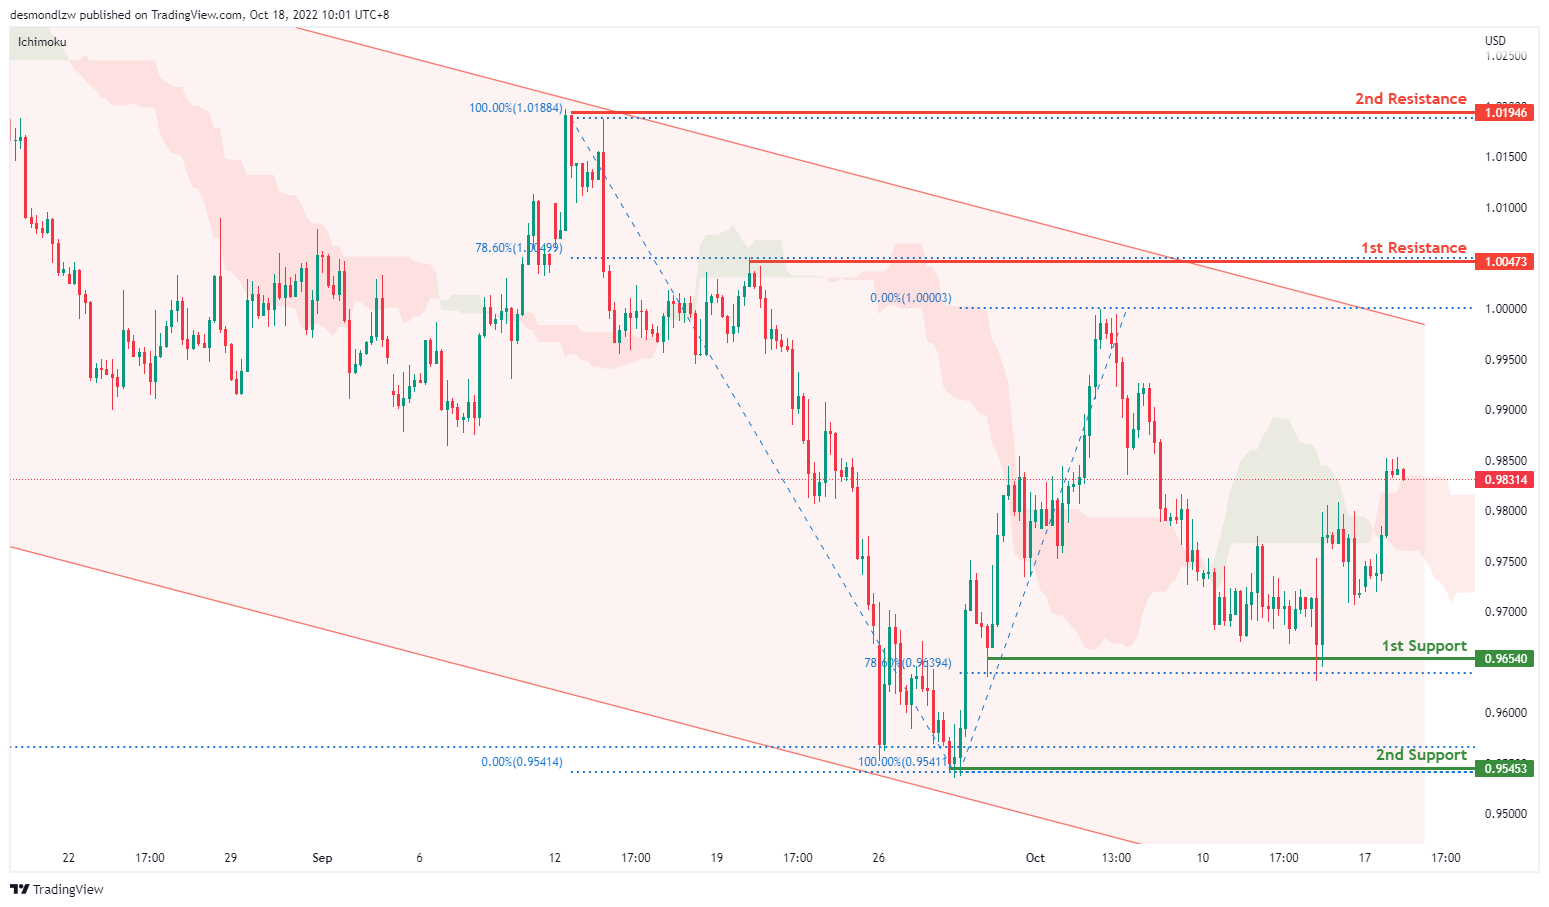
On the H4, price is moving within the descending trendline in a descending manner, with the price moving below ichimoku cloud- we are still overall bearish biased. Price has bounced off the first support hence it might test the first resistance at 1.0047 where the 78.6% retracement sits. If price breaks this level, it may test the second resistance at 1.0194, where the previous swing high sits. Alternatively, bearish momentum might bring price to 0.9695 where the 78.6% retracement sits. if it breaks this level, price would test the second support at 0.9545 where the swing low and 161.8% extension sit.
Areas of consideration :
- H4 1st resistance at 1.0047
- H4 2nd resistance at 1.0194
GBP/USD:
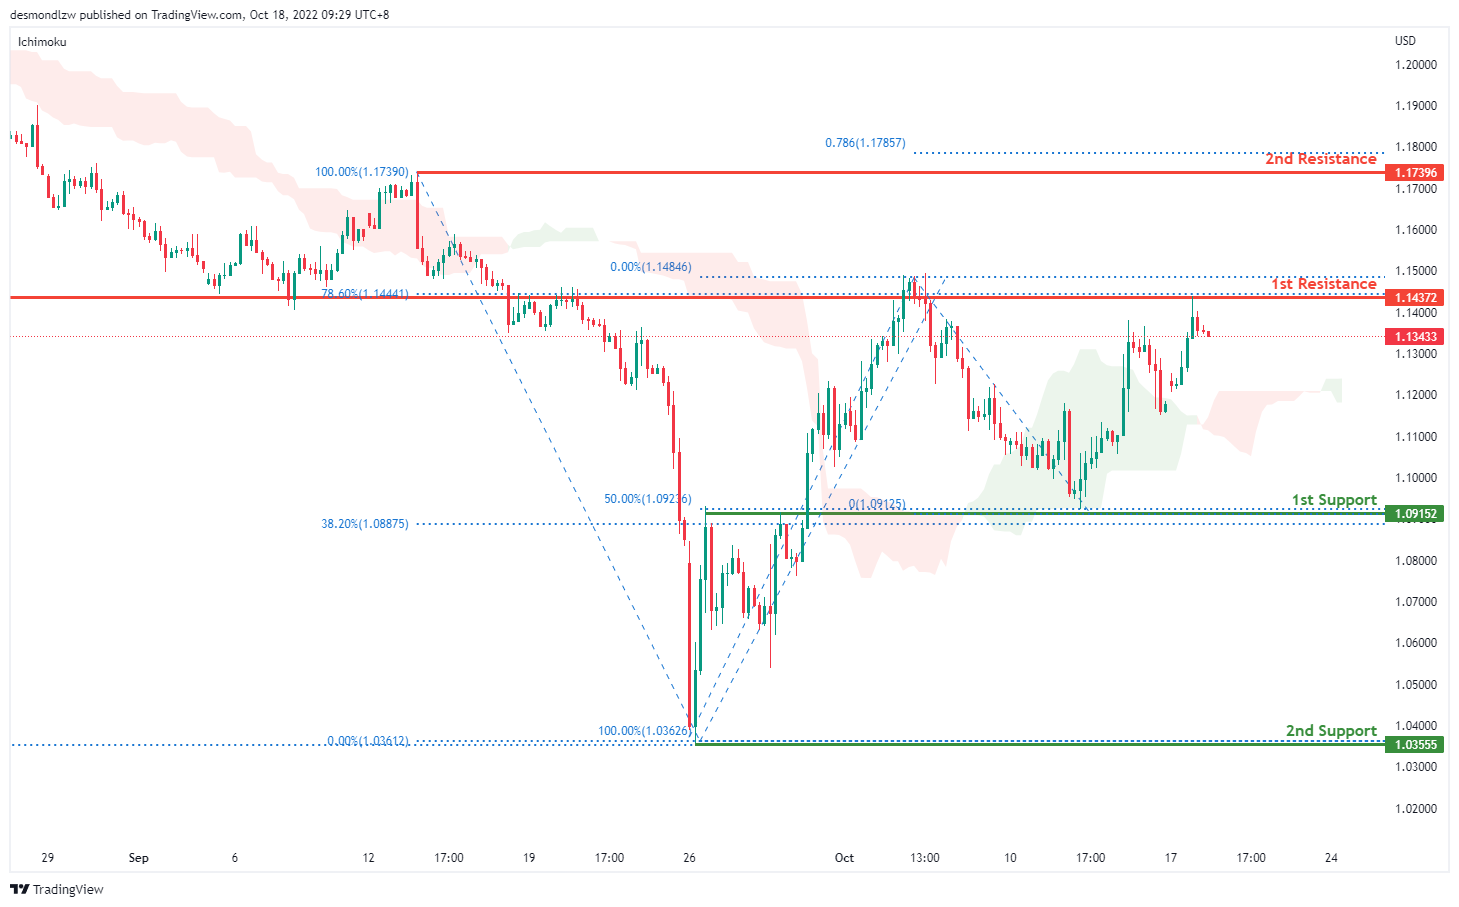
On the H4, price has rejected the resistance and is moving in a descending trend hence we are slightly bearish bias- price looks like its moving toward the first support at 1.0915 where the 50% retracement sits, bearish momentum will bring price to the second support at 1.0355 where the previous swing low sits. Alternatively, price could test the first resistance at 1.1437 where the 78.6% retracement and overlap resistance sit. If it breaks this level, it should test the second resistance at 1.1739.
Areas of consideration:
- H4 1st support at 1.0915
- H4 1st resistance at 1.1437
USD/CHF:
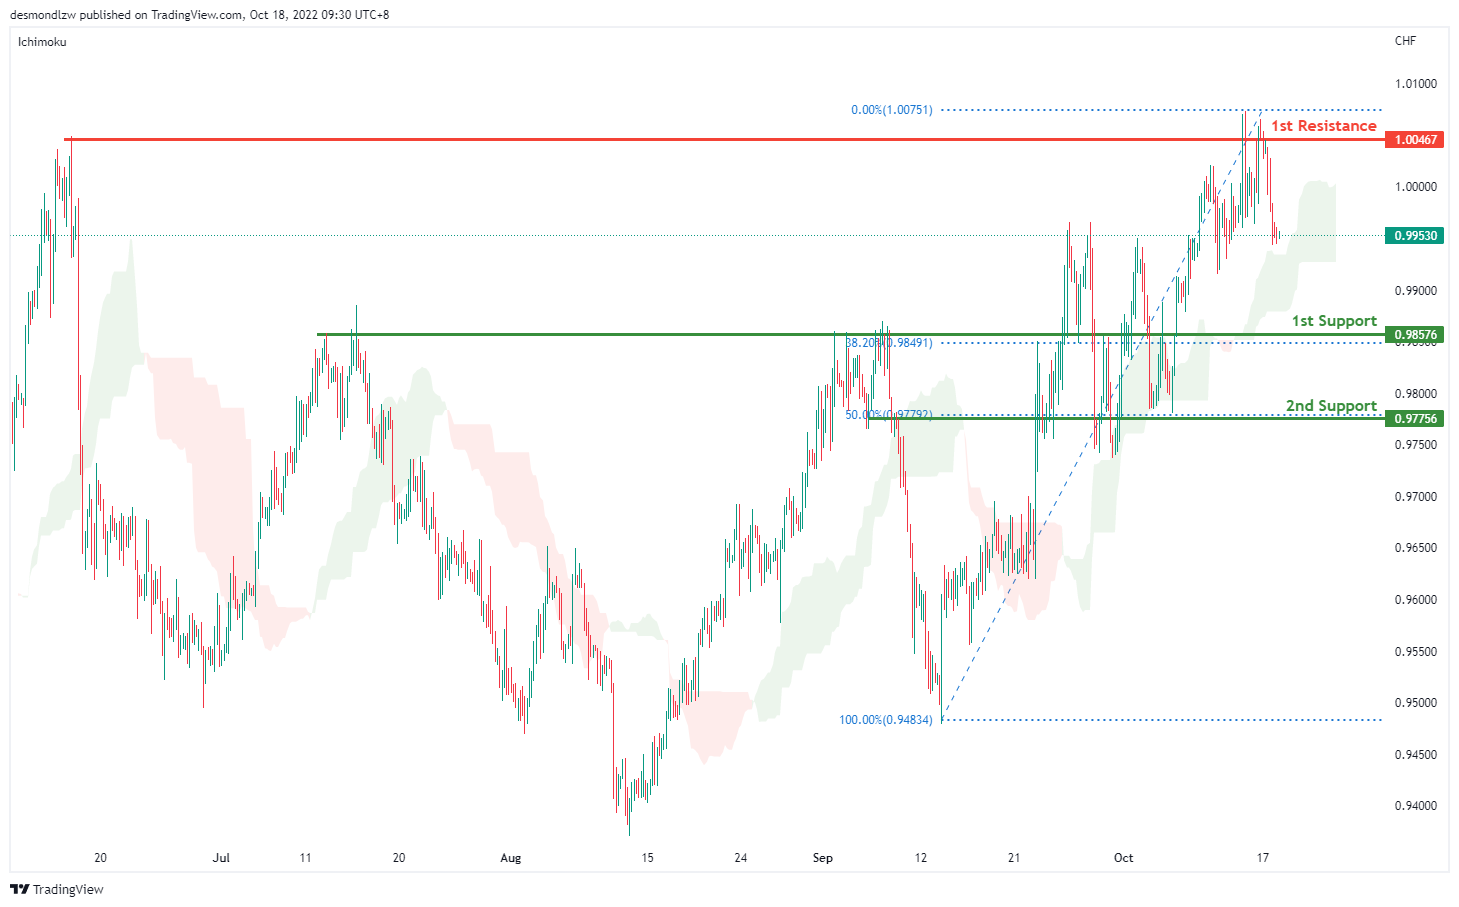
USDCHF is in a strong bullish trend on the H4 chart. Price is trading above the Ichimoku cloud signalling a bullish trend. Price has tested the first resistance at 1.0046 where the previous swing high sits and it’s pulling back slightly. If bearish momentum continues, price can test the first support at 0.9868 where the overlap support and 23.6% retracement sits then the second support at 0.9757 where the 50% retracement sits
Areas of consideration
- H4 1st support at 0.9868
- H4 1st resistance at 1.0046
XAU/USD (GOLD):
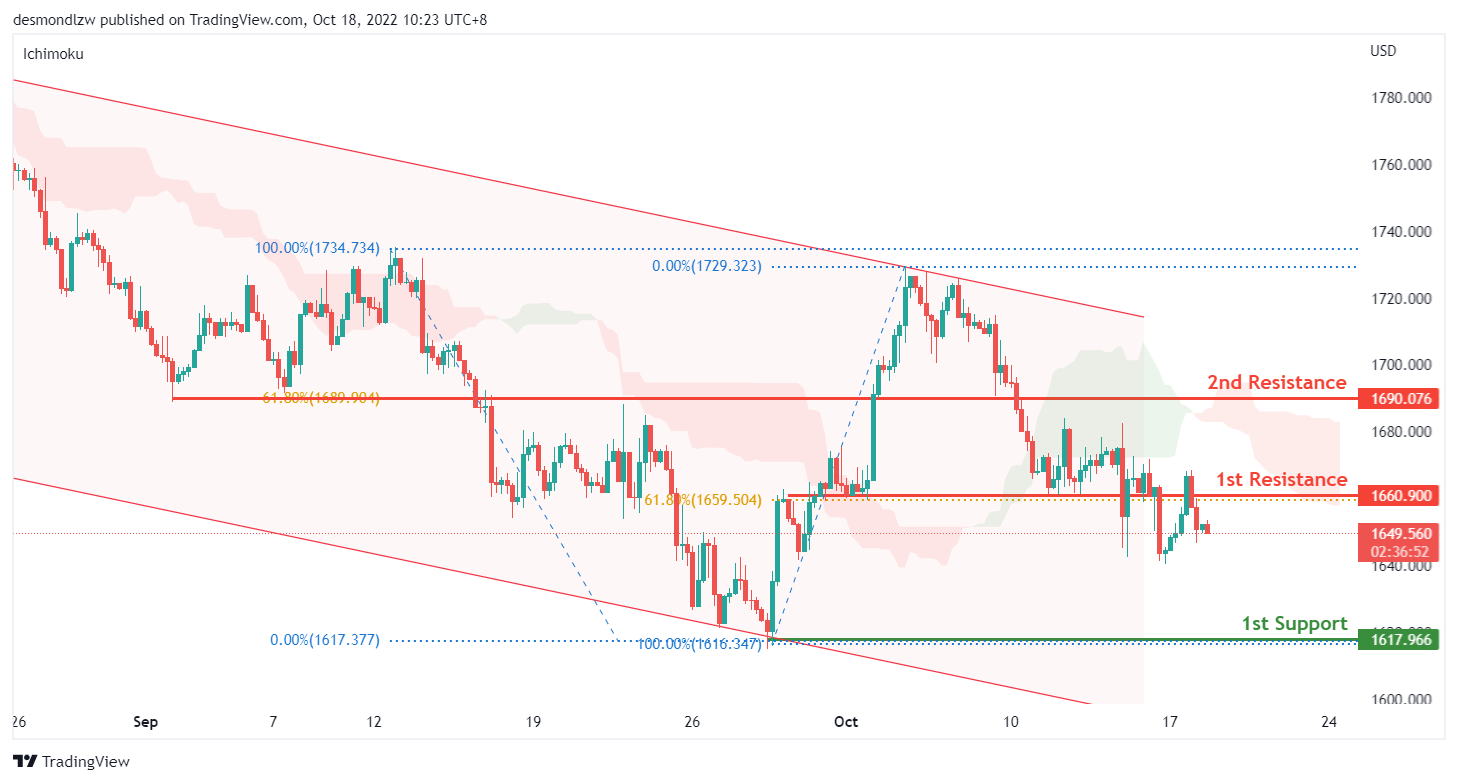
On the H4, price failed to break above the 1st resistance at 1660.90 which is in line with the 61.8% fibonacci retracement and overlap support. As the price is within the descending channel, we could expect the price to reverse from the 1st resistance to drop to the 1st support 1617.96, where the previous swing low is. Alternatively, the price may break through the 1st resistance and rise to test the 2nd resistance at 1690, where the 61.8% fibonacci retracement and overlap support is.
Areas of consideration:
- H4 time frame, 1st support at 1617.96
- H4 time frame, 1st resistance at 1660.90
- H4 time frame, 2nd resistance at 1690
AUD/USD:
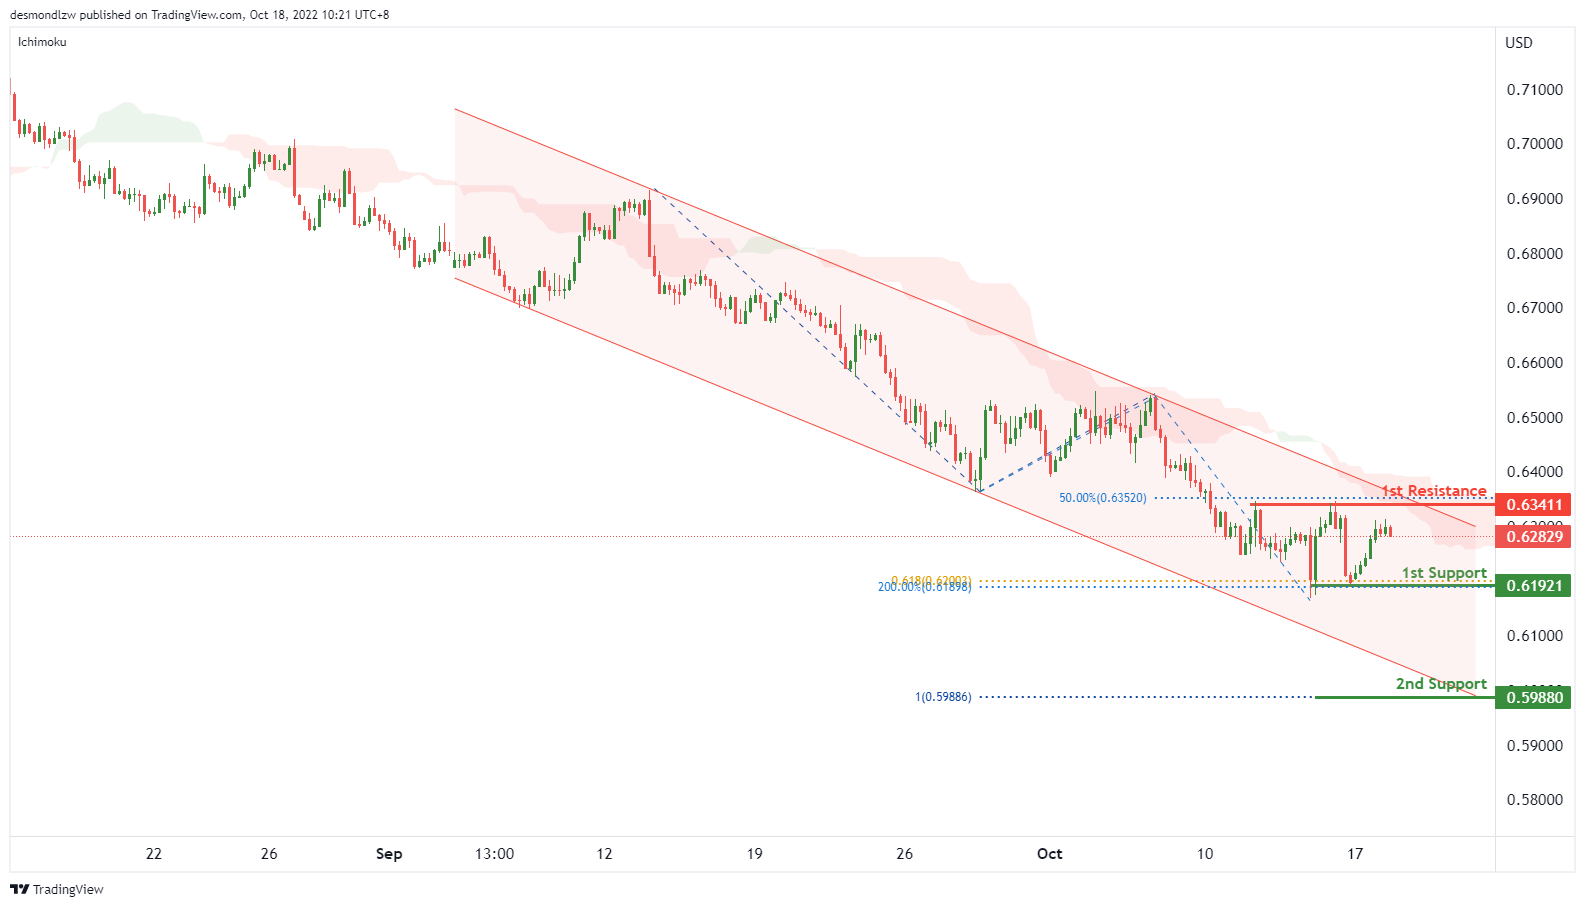
On the H4, the price is reversing from 1st support, with the price is below the descending channel and ichimoku cloud, we can expect the price test the 1st resistance at 0.63411, which is in line with the 23.6% fibonacci retracement and 50% fibonacci retracement and then drop to the 1st support at 0.61921, which is in line with the 61.8% fibonacci projection and swing low support. If the 1st support is broken, the 2nd support could be at 0.59800, where the 100% fibonacci projection is.
Areas of consideration
- H4, 1st support at 0.62085
- H4,1st resistance at 0.6341
NZD/USD:
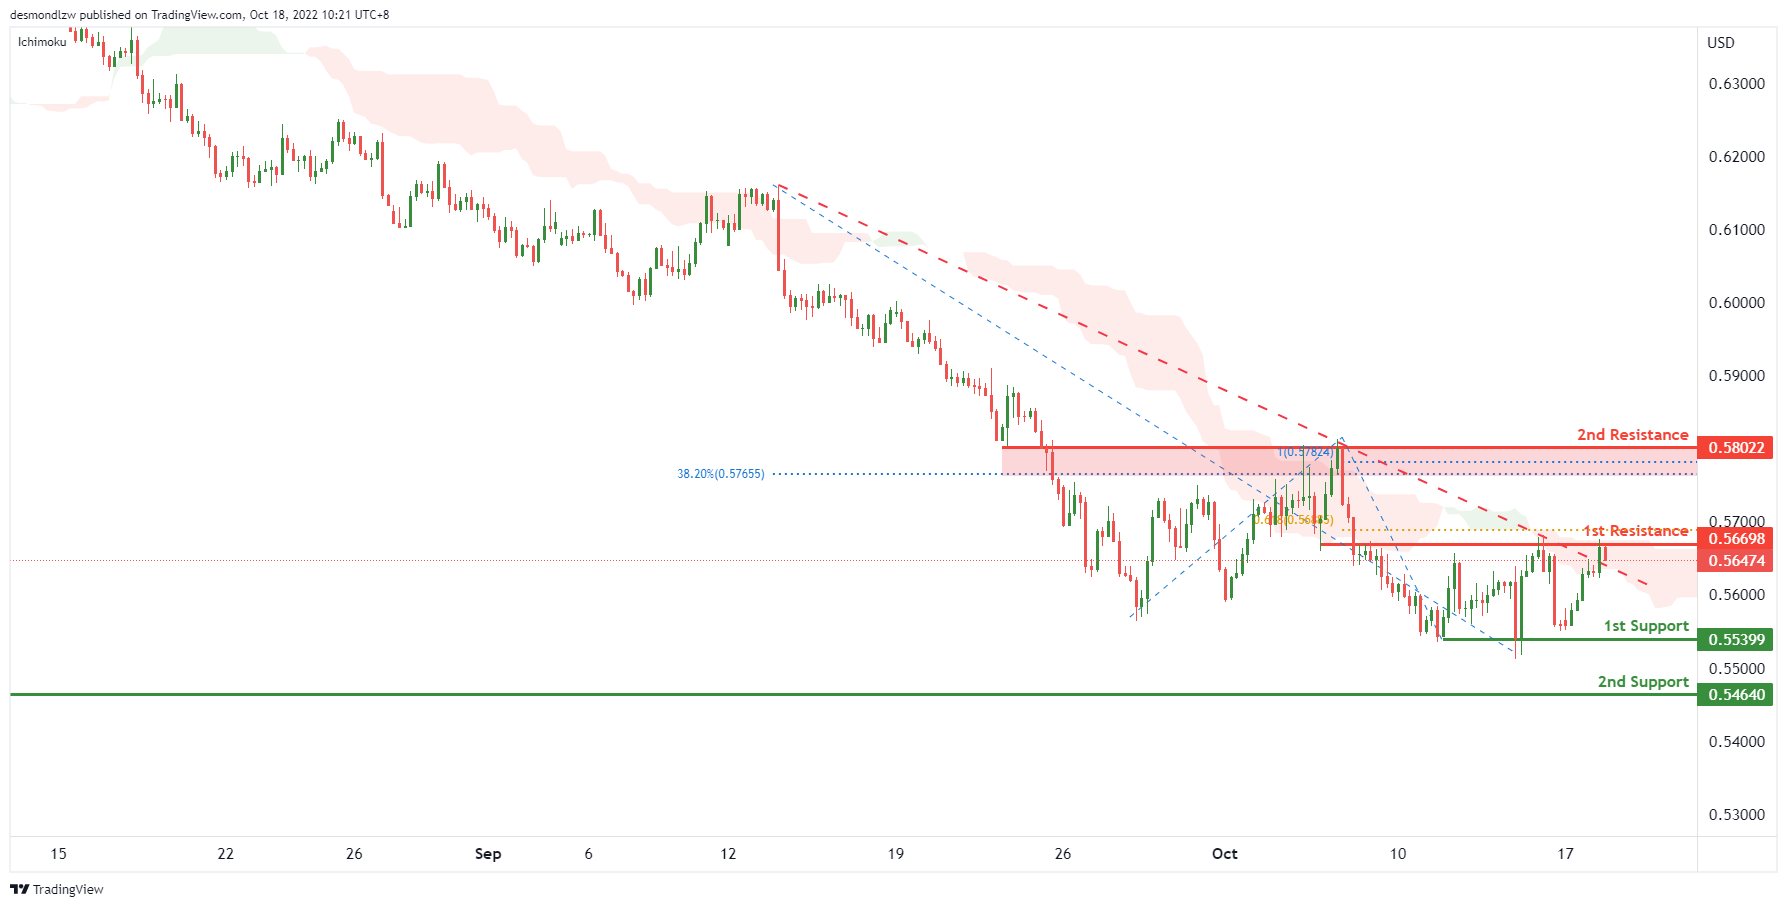
On the H4, the price is breaking the ichimoku cloud and descending trendline, if the price can break the 1st resistance, we can expect the price rise to the 2nd resistance at 0.58022, where the previous swing high, 100% fibonacci projection and 38.2% fibonacci retracement are. Alternatively, the price may drop to the 1st support at 0.55399, where the swing low support is. If the 1st support is broken, the 2nd support could be at 0.54640, where the previous swing low is.
Areas of consideration:
- H4 time frame, 1st resistance at 0.56698
- H4 time frame, 2nd resistance at 0.58022
USD/CAD:
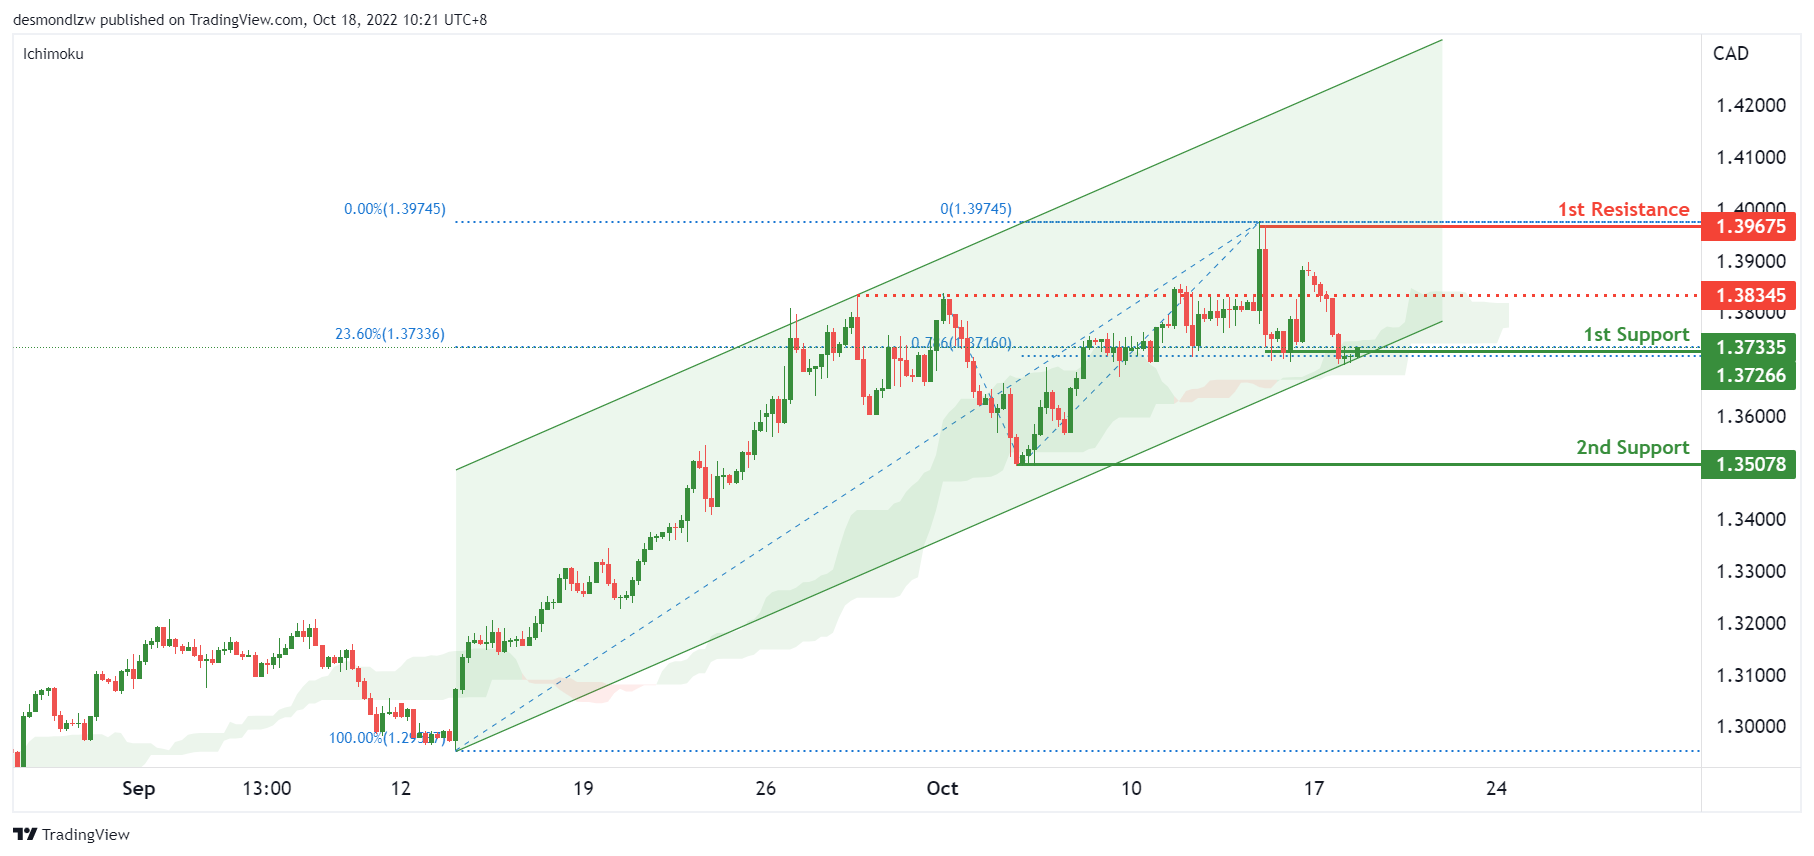
On the H4, the price trades at the 1st support of 1.3726 which is in line with the 23.6% fibonacci retracement and 78.6% fibonacci extension level. As price continues within the ichimoku cloud and the bullish channel, we continue to have a short term bullish bias. The price could bounce from the 1st support to reach the 1st resistance of 1.3967, which is the previous swing.
Areas of consideration:
- H4 time frame, 1st resistance at 1.3967
- H4 time frame, 1st support at 1.3726
OIL:
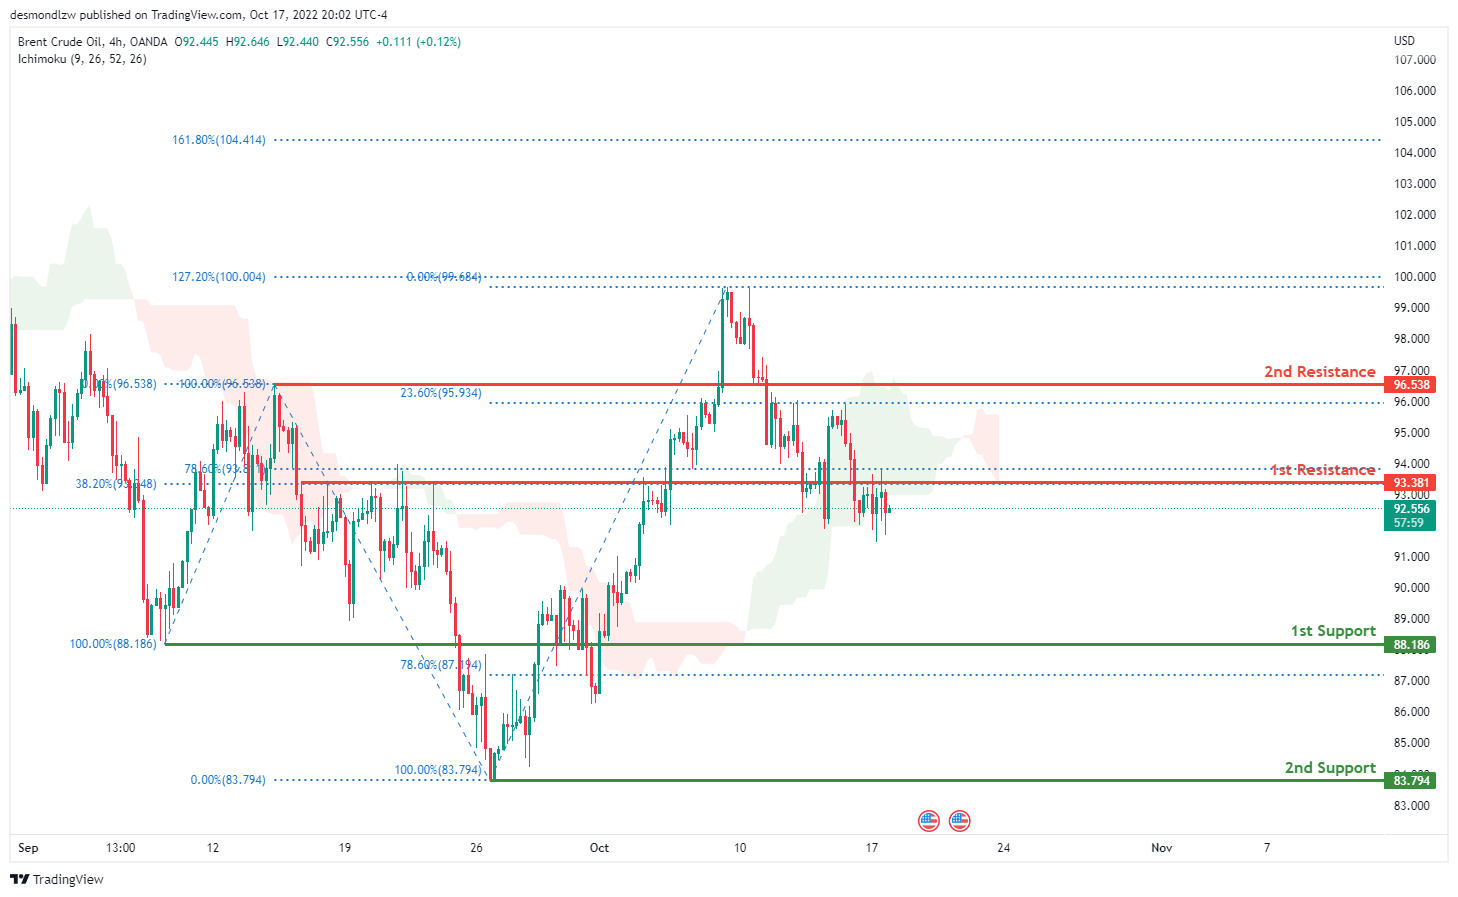
Looking at the H4 chart, the current overall bias for Oil is bearish. To add confluence to this bias, the price is currently below the Ichimoku cloud which indicates a bearish market. Overnight, price continued to consolidate under the 1st resistance at 93.381 where the 78.6% and 38.2% Fibonacci lines are. If this bearish momentum continues, expect the price to head towards the 1st support at 88.186 where the 100% Fibonacci line and 78.6% Fibonacci line are located.
Areas of consideration:
- H4 time frame, 1st resistance at 93.381
- H4 time frame, 1st support at 88.186
Dow Jones Industrial Average:
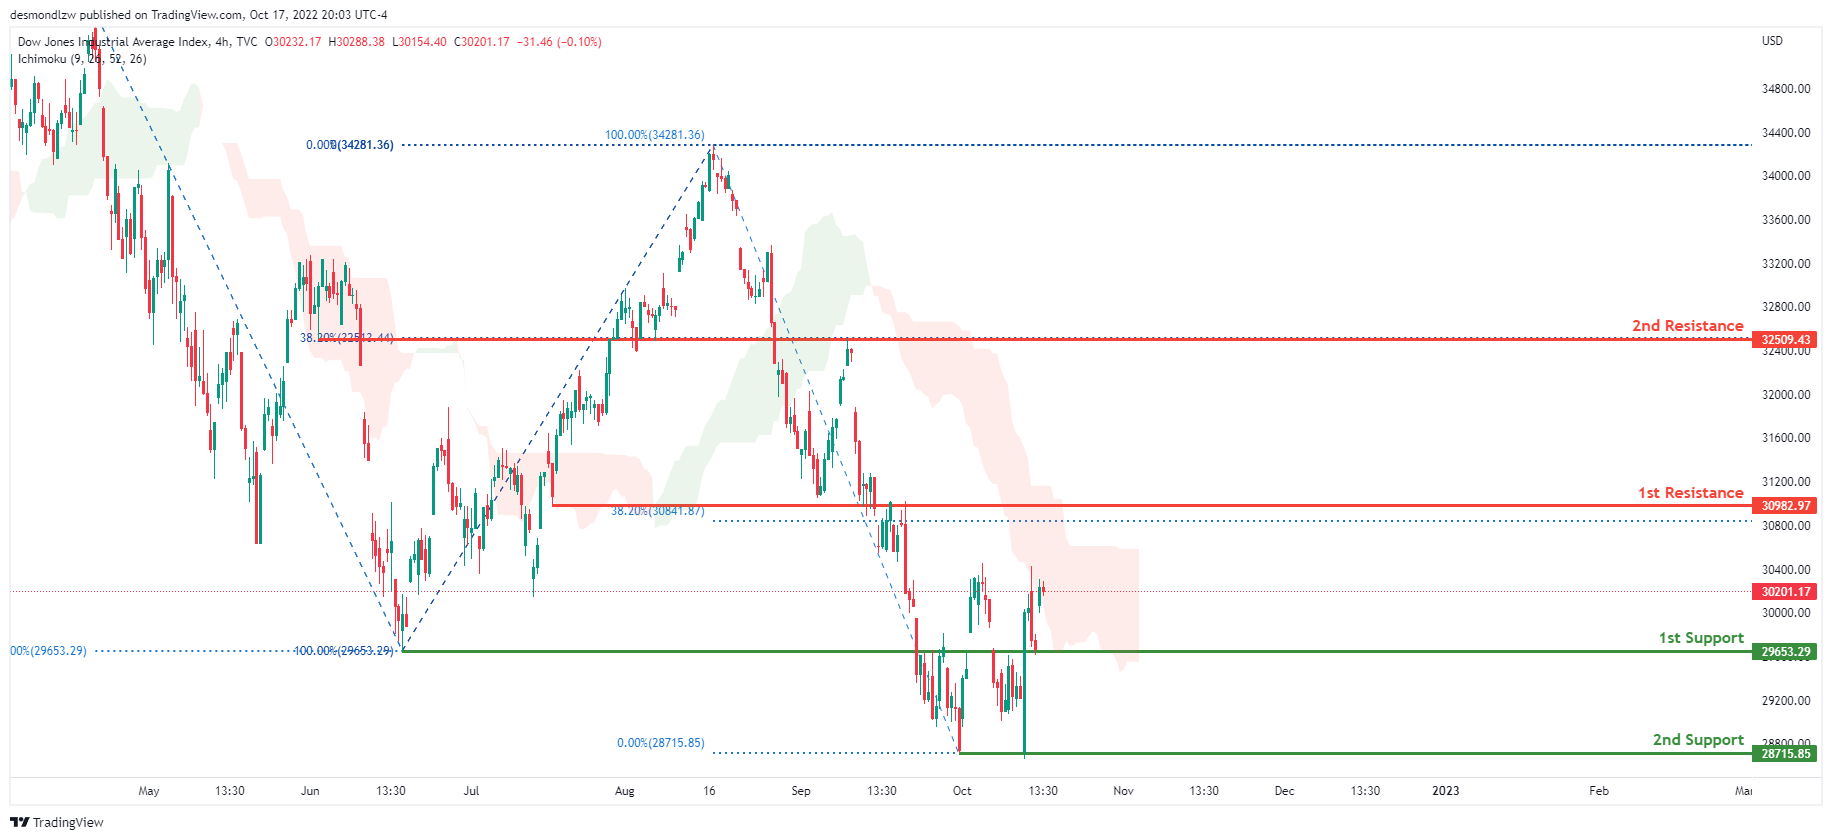
The current overall bias for DJI is bearish, according to the H4 chart. Overnight, price reflected off the 1st support at 29653.29 where the previous low and 100% Fibonacci line is located. If this short term bullish momentum continues, expect the price to possibly head towards the 1st resistance at 30982.97 where the 38.2% Fibonacci line is located.
Areas of consideration:
- H4 time frame, 1st support at 29653.29
- H4 time frame, 2nd support at 28715.85
- H4 time frame, 1st Resistance at 30982.97
DAX:
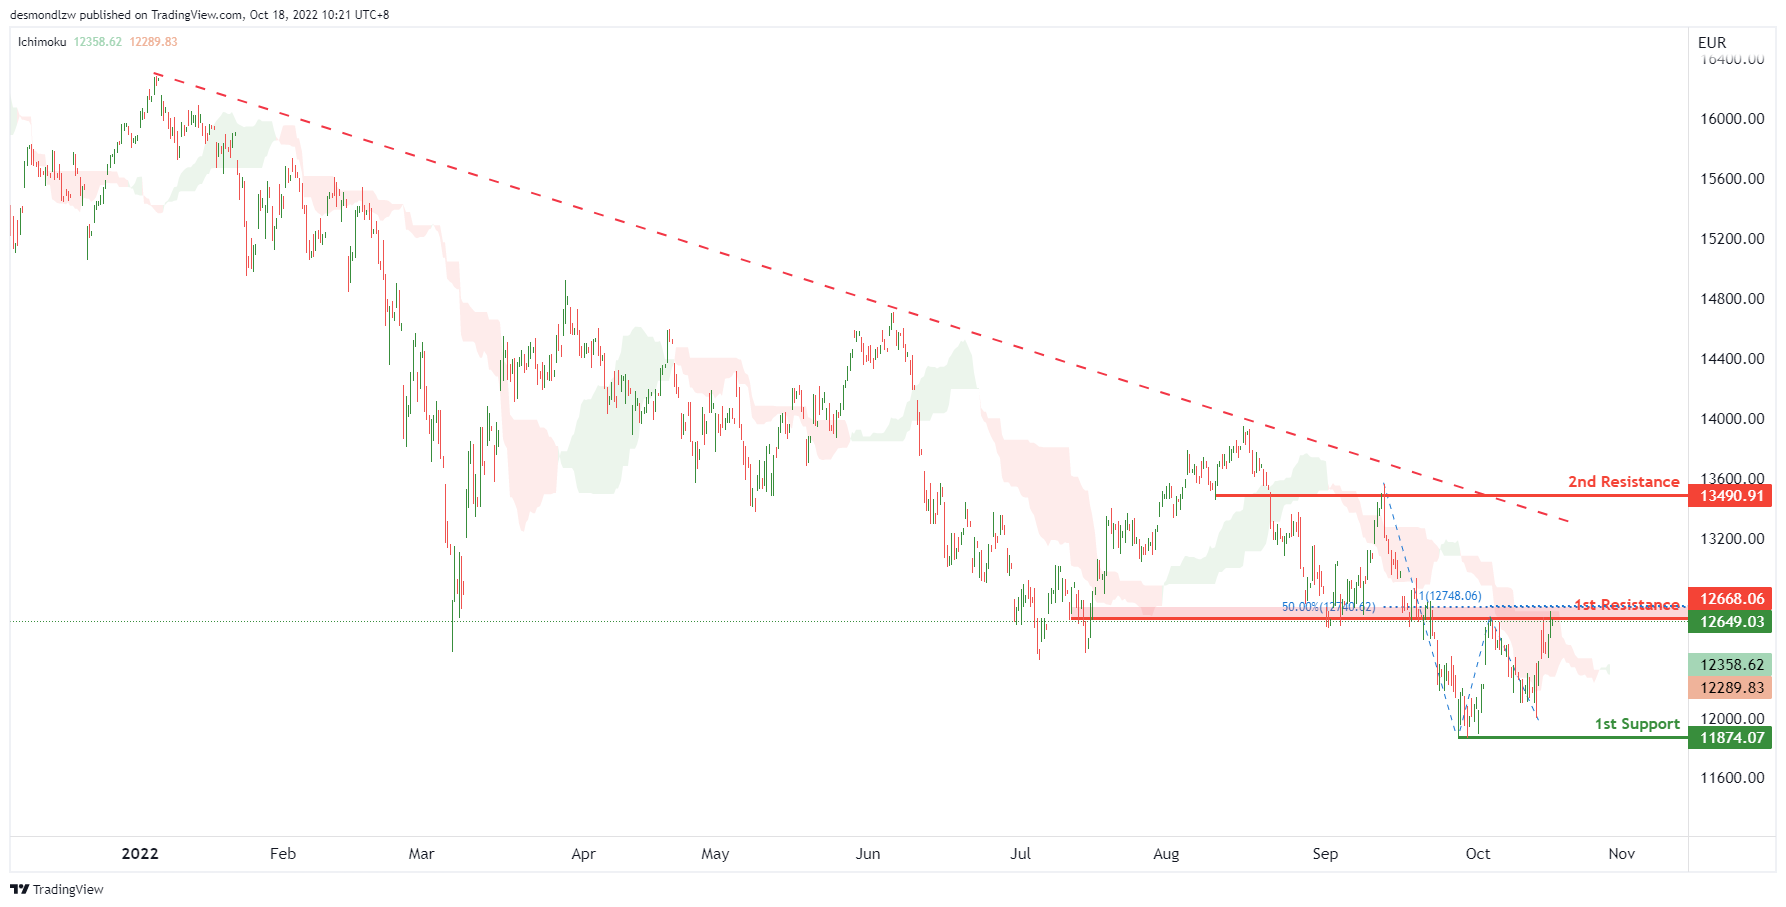
On the H4, as the price is crossing ichimoku cloud, we can expect the price to break the 1st resistance at 12668.06, which is in line with the 50% fibonacci retracement, 100% fibonacci projection and overlap resistance. After breaking the 1st resistance, the price may rise to test the 2nd resistance at 13490.91, where the overlap resistance is. Alternatively, as the price is below the descending trendline, the price may drop to the 1st support at 11874.07, which is in line with the swing low.
Areas of consideration:
- H4 time frame, 1st resistance at 12668.06
- H4 time frame, 2nd resistance at 13490.91
ETHUSD:
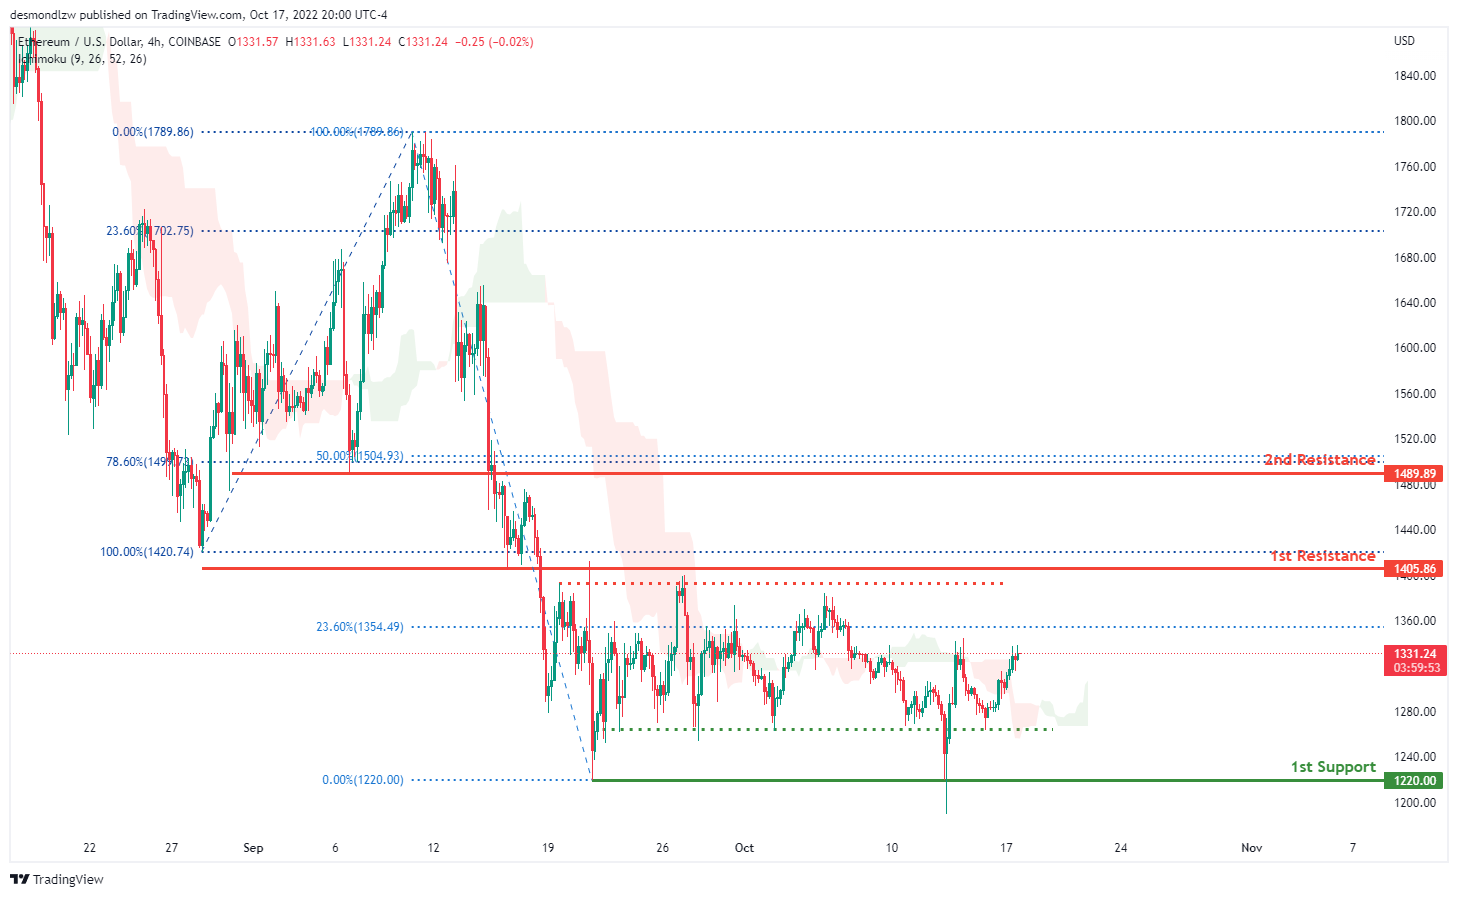
Looking at the H4 chart, the current overall bias for ETHUSD is bearish. However overnight, price has closed above the Ichimoku cloud which might indicate a short term bullish momentum. Expecting price to head towards 1st resistance at 1405.86 where the 100% Fibonacci line and previous swing low is.
Areas of consideration:
- H4 time frame, 1st resistance of 1405.86
- H4 time frame, 1st support at 1220.00
BTCUSD:
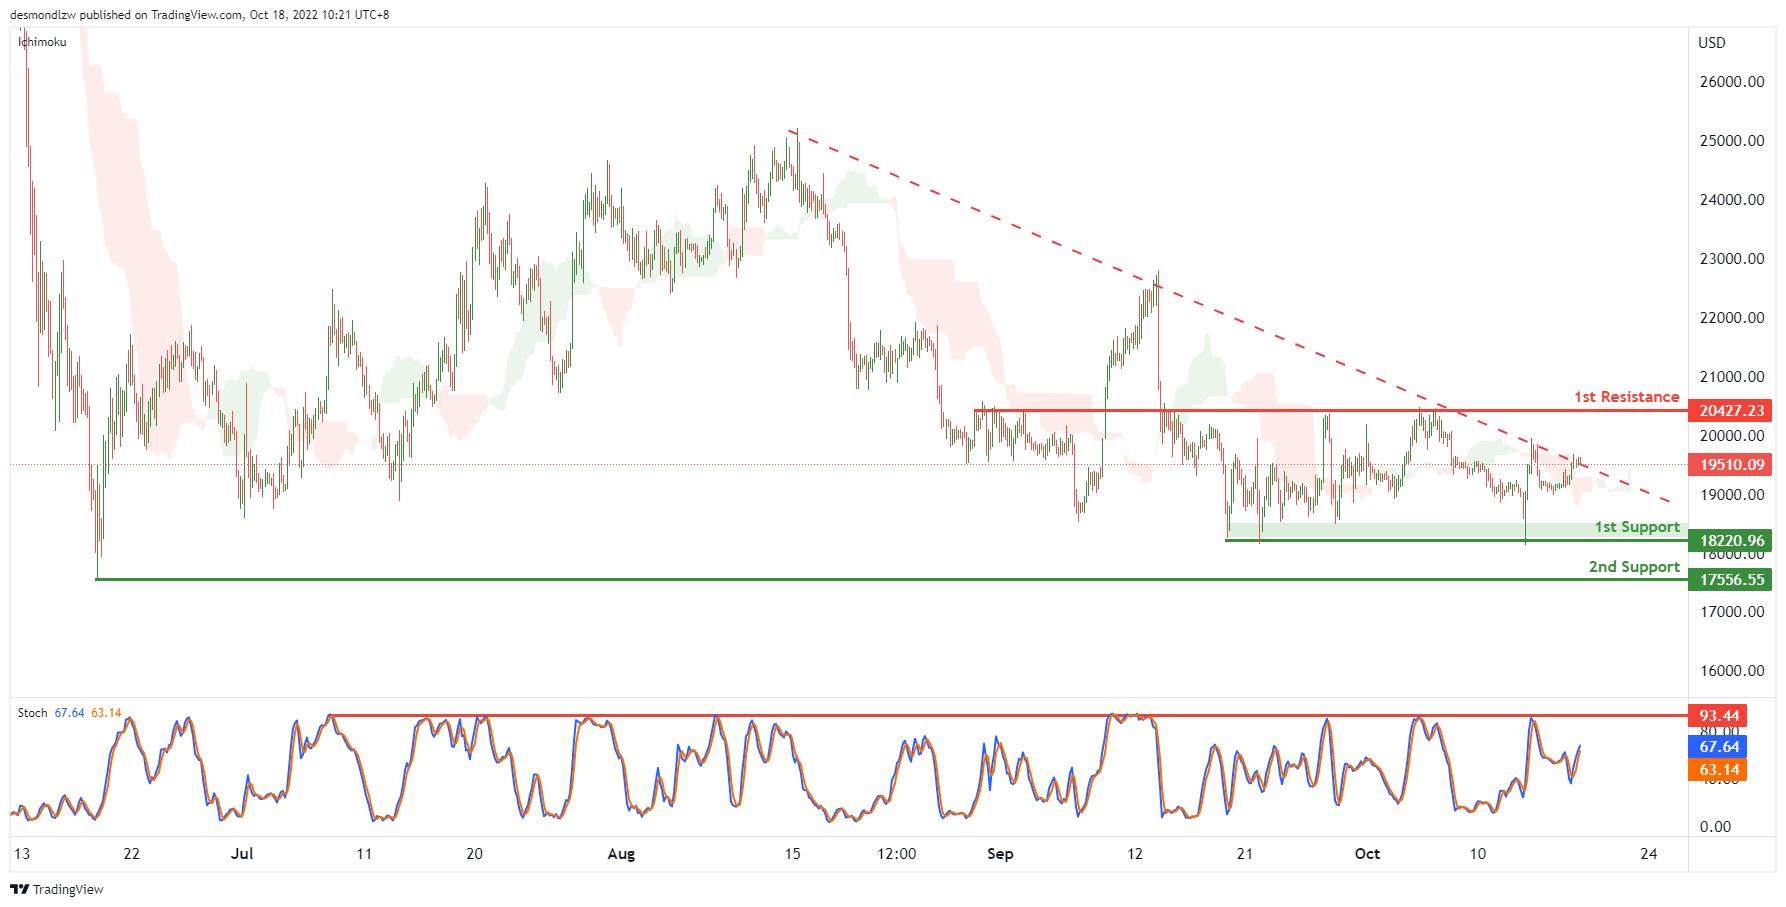
On the H4, price is crossing the ichimoku cloud and descending trendline, and Stoch is rising to test the resistance, we can expect the price to rise to the 1st resistance at 20427.23, where the overlap resistance and 50% fibonacci retracement are. Alternatively, the price may drop to the 1st support at 18220.96, which is in line with the swing lows. If the 1st support is broken, we can expect the price to drop to the 2nd support at 17556.55, where the previous swing low is.
Areas of consideration:
- H4 time frame, current price
- H4 time frame, 1st resistance at 20427.23
S&P 500:
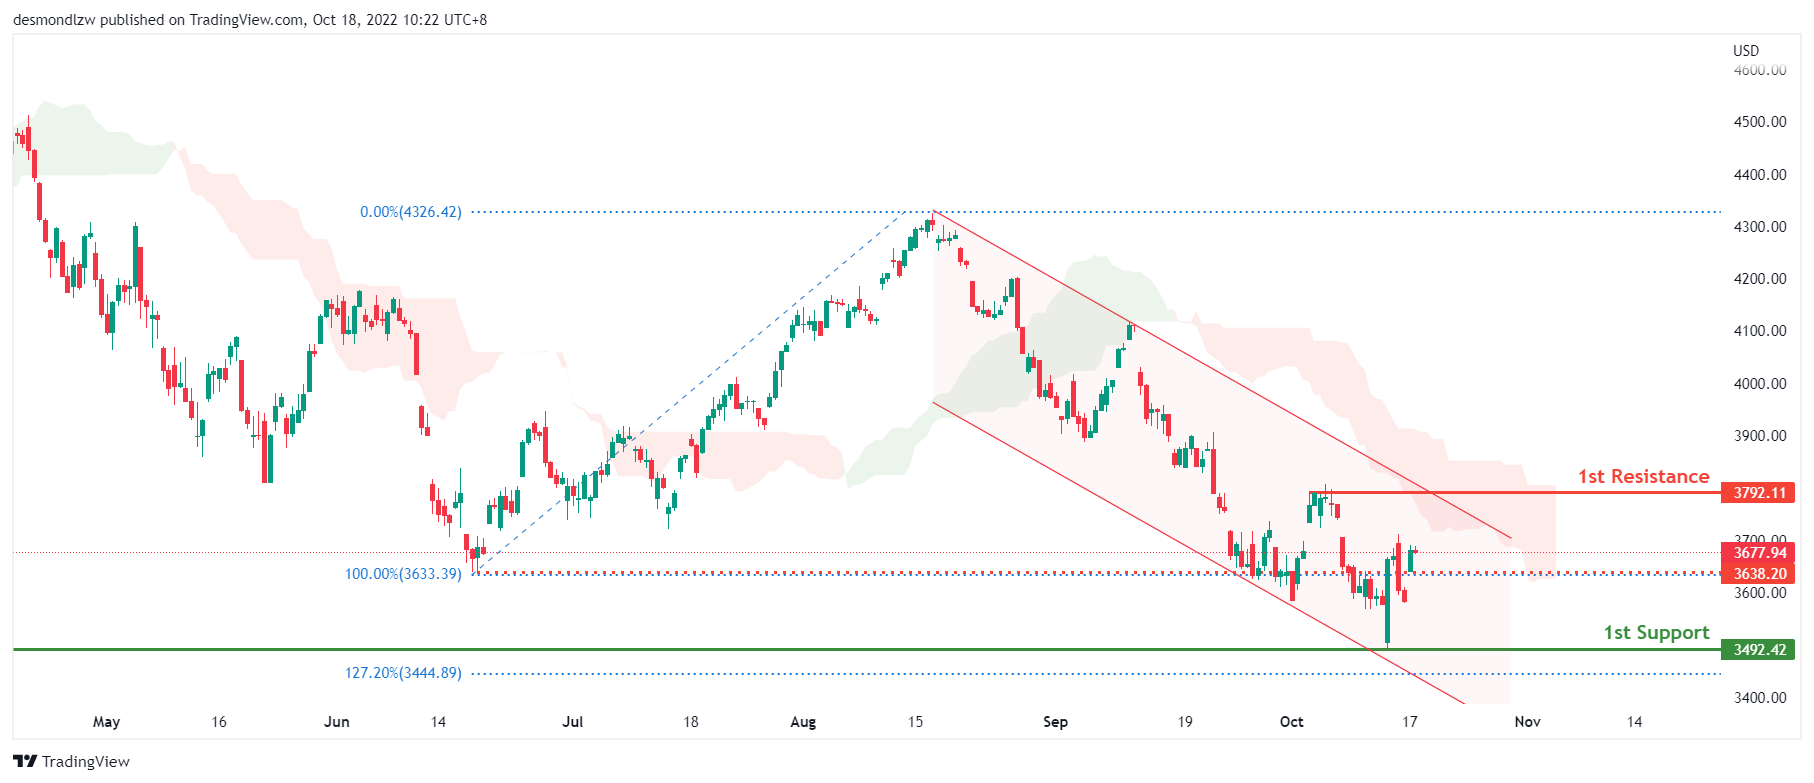
Based on the H4 chart, the current overall bias for the S&P500 is bearish as price continues in the bearish channel and stays below the ichimoku cloud. While price continues to trade along the risk area of 3638.20, price could fall to the 1st support of 3492.42, in line with the fibonacci extension and previous swing high from October 2020. Alternatively, price could climb higher towards the 1st resistance of 3792 which is the previous swing high and top of the bearish channel.
Areas of consideration:
- H4 time frame, 1st support at 3492.42
- H4 time frame, 1st resistance at 3792.11
EUR/JPY Daily Outlook
Daily Pivots: (S1) 145.14; (P) 145.93; (R1) 147.49; More....
EUR/JPY's break of 145.62 resistance confirms up trend resumption. Intraday bias stays on the upside for 100% projection of 133.38 to 145.62 from 137.32 at 149.56, which is close to 149.76 long term resistance. On the downside, below 144.58 minor support will turn intraday bias neutral and bring consolidations first, before staging another rally.
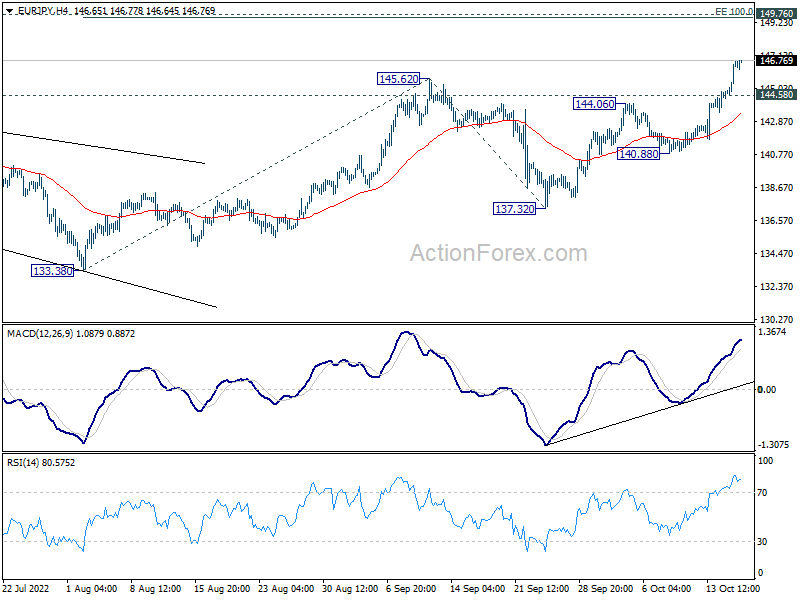
In the bigger picture, the up trend from 114.42 (2020 low) is still in progress for 149.75 (2014 high). Decisive break there will pave the way to 161.8% projection of 114.42 to 134.11 from 124.37 at 156.22. This will now remain the favored case as long as 137.32 support holds.
Kiwi Rebounds On CPI, Dollar and Yen Weak on Risk Sentiment
Commodity currencies are generally stronger today following the rebound in risk markets. New Zealand Dollar is leading the way as additionally supported by stronger than expected consumer inflation reading. There are some talks that RBNZ would opt for a larger than before hike at the upcoming meeting. Dollar, Euro, and Yen are currently the worst performers, as followed by Swiss Franc, while Sterling is mixed.
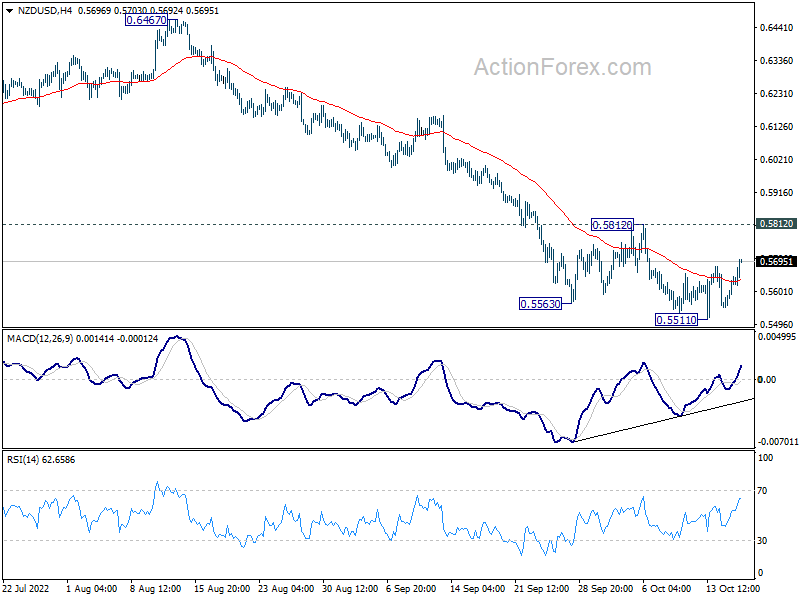
Technically, while NZD/USD recovers notably, it's held well below 0.5812 resistance. Thus, near term outlook stays bearish for another fall through 0.5511 at a later stage. AUD/USD is also kept well below corresponding resistance at 0.6539 while USD/CAD is holding well above 1.3501 support. It's too soon to declare a turn around in these three.
In Asia, at the time of writing, Nikkei is up 1.47%. Hong Kong HSI is up 1.33%. China Shanghai SSE is up 0.34%. Singapore Strait Times is up 0.07%. Japan 10-year JGB yield is down -0.0015 at 0.251. Overnight, DOW rose 1.86%. S&P 500 rose 2.65%. NASDAQ rose 3.43%. 10-year yield rose 0.005 to 4.015.
RBA minutes: Case for a smaller 25bps hike stronger
Minutes of RBA October 4 meeting revealed that members "carefully considered two options" of 50bps and 25bps rate hike. The arguments for a 25bps hike "rested on the risks to global and domestic growth, and the potential for inflation to subside quickly".
Wages growth had "not reached levels that would be inconsistent with the inflation target". External inflation pressures "might ease quickly given that the global outlook had deteriorated". There was also an argument to slow for a time to "assess the effects of the significant increases in interest rates to date".
RBA said the arguments for both options were "finely balanced", with the case of 25bps hike stronger. "A smaller increase than that agreed at preceding meetings was warranted given that the cash rate had been increased substantially in a short period of time and the full effect of that increase lay ahead."
At the meeting, RBA raised the cash rate target by 25bps to 2.60%.
RBA Bullock: We meet more frequently than most of our peers
RBA Deputy Governor Michele Bullock acknowledged in a speech that some commentators contracted the 24bps hike in October with those of other central banks that have been hiking by larger increments.
"In part, this reflects our particular economic circumstances," she said. "But it is also relevant that the Board meets more frequently than most of our peer central banks."
RBA is "making monetary policy decisions 11 times a year so it is discussing regularly the evidence on the economy and has more flexibility on the size and timing of rate increases... The incremental change in the policy rate at recent meetings has been smaller than some other major central banks. However, our policy rate trajectory has been as steep, or steeper, than other central banks".
Both Fed and ECB hold monetary policy meetings 8 times a year.
New Zealand CPI up 2.2% qoq in Q3, annual rate at 7.7% yoy
New Zealand CPI rose 2.2% qoq in Q3, well above expectation of 1.6% qoq. Annual inflation slowed from 7.3% yoy to 7.2% yoy, but beat expectation of 6.6% yoy.
The quarterly rise in prices was mainly influenced by the food group and the housing and household utilities group. Vegetable prices rose 24% during the quarter, largest since the the series began in 1999.
The main driver for annual inflation was housing and household utilities due to rising prices for construction, rentals for housing, and local authority rates.
Japan Suzuki: We cannot tolerate excessive currency moves driven by speculators
Japanese Finance Minister Shunichi Suzuki told reporters today, "We cannot tolerate excessive currency moves driven by speculators. We are closely watching currency moves with a sense of urgency."
Suzuki later told the parliament that the government is ready to take actions "decisively" and "we have intervened in the currency markets (last month)".
"Generally speaking, there are times when we intervene by making announcements and some other times when we do without it," Suzuki said.
BoJ Governor Haruhiko Kuroda told the parliament, "Recent sharp yen fall, coupled with raw material price rise, driving up Japan's prices". ''Consumer inflation likely to accelerate toward year-end before sliding below 2% next fiscal year,'' he added.
Looking ahead
Germany ZEW economic sentiment is the main feature in European session. Later in the day, Canada will release housing starts. US will release industrial production and NAHB housing index.
EUR/JPY Daily Outlook
Daily Pivots: (S1) 145.14; (P) 145.93; (R1) 147.49; More....
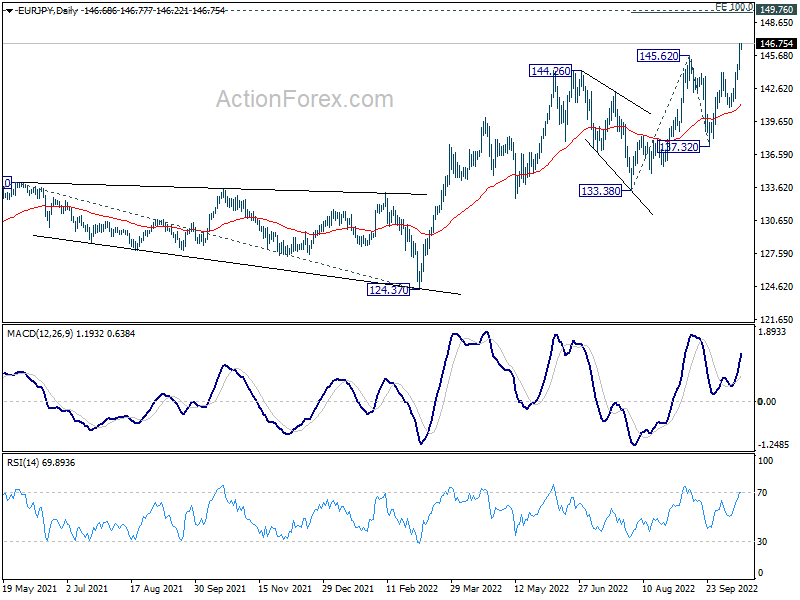
EUR/JPY's break of 145.62 resistance confirms up trend resumption. Intraday bias stays on the upside for 100% projection of 133.38 to 145.62 from 137.32 at 149.56, which is close to 149.76 long term resistance. On the downside, below 144.58 minor support will turn intraday bias neutral and bring consolidations first, before staging another rally.
In the bigger picture, the up trend from 114.42 (2020 low) is still in progress for 149.75 (2014 high). Decisive break there will pave the way to 161.8% projection of 114.42 to 134.11 from 124.37 at 156.22. This will now remain the favored case as long as 137.32 support holds.
Economic Indicators Update
| GMT | Ccy | Events | Actual | Forecast | Previous | Revised |
|---|---|---|---|---|---|---|
| 21:45 | NZD | CPI Q/Q Q3 | 2.20% | 1.60% | 1.70% | |
| 21:45 | NZD | CPI Y/Y Q3 | 7.20% | 6.60% | 7.30% | |
| 00:30 | AUD | RBA Meeting Minutes | ||||
| 09:00 | EUR | Germany ZEW Economic Sentiment Oct | -66 | -61.9 | ||
| 09:00 | EUR | Germany ZEW Current Situation Oct | -69 | -60.5 | ||
| 09:00 | EUR | Eurozone ZEW Economic Sentiment Oct | -60.6 | -60.7 | ||
| 12:15 | CAD | Housing Starts Y/Y Sep | 262K | 267K | ||
| 13:15 | USD | Industrial Production M/M Sep | -0.10% | -0.20% | ||
| 13:15 | USD | Capacity Utilization Sep | 80.00% | 80.00% | ||
| 14:00 | USD | NAHB Housing Market Index Oct | 43 | 46 |