

Sample Category Title
GBP/USD Daily Outlook
Daily Pivots: (S1) 1.0971; (P) 1.1052; (R1) 1.1181; More...
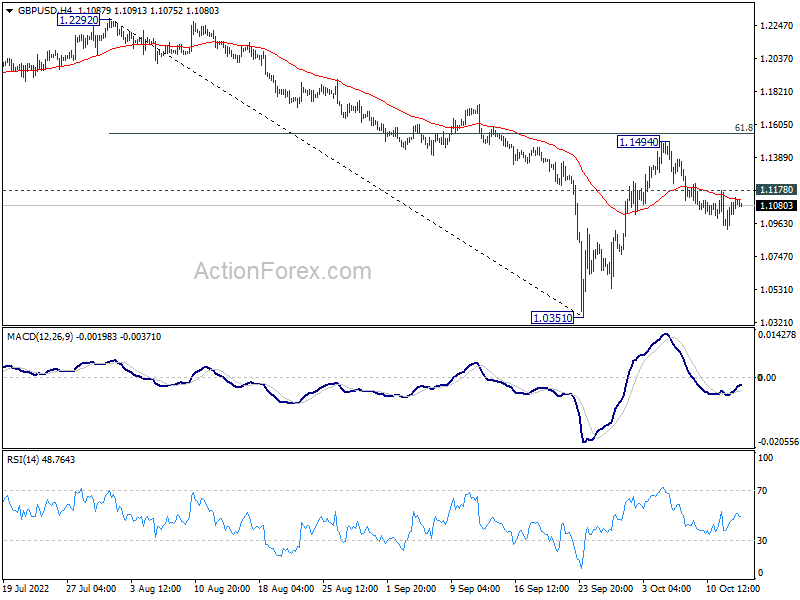
GBP/USD continues to lose downside momentum but further fall is still in favor with 1.1178 minor resistance intact. Fall from 1.1494 would target 1.0351 low. However, break of 1.1178 will turn bias back to the upside for 1.1494 resistance instead.
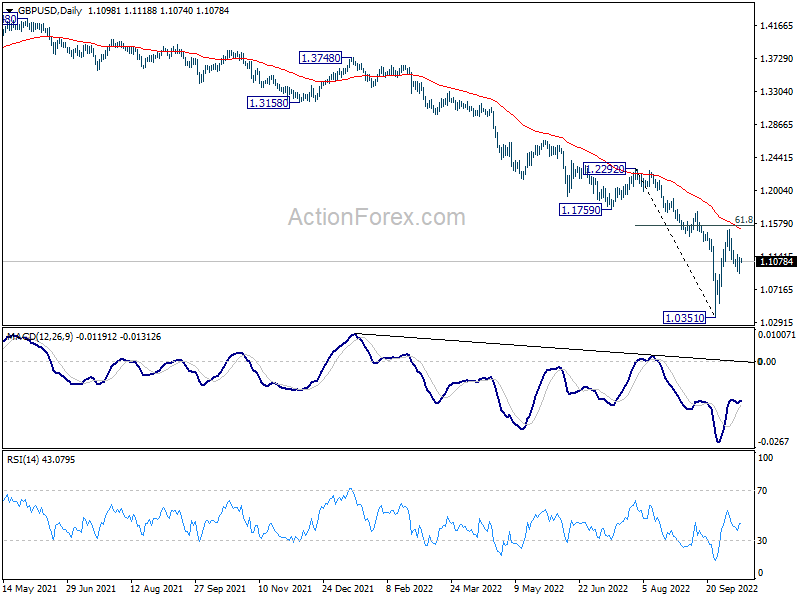
In the bigger picture, fall from 1.4248 (2018 high) is resuming long term down trend from 2.1161 (2007 high). Next target is 100% projection of 2.1161 to 1.3503 from 1.7190 at 0.9532. There is no scope of a medium term rebound as long as 1.1759 support turned resistance holds.
USD/CHF Daily Outlook
Daily Pivots: (S1) 0.9938; (P) 0.9971; (R1) 1.0011; More...
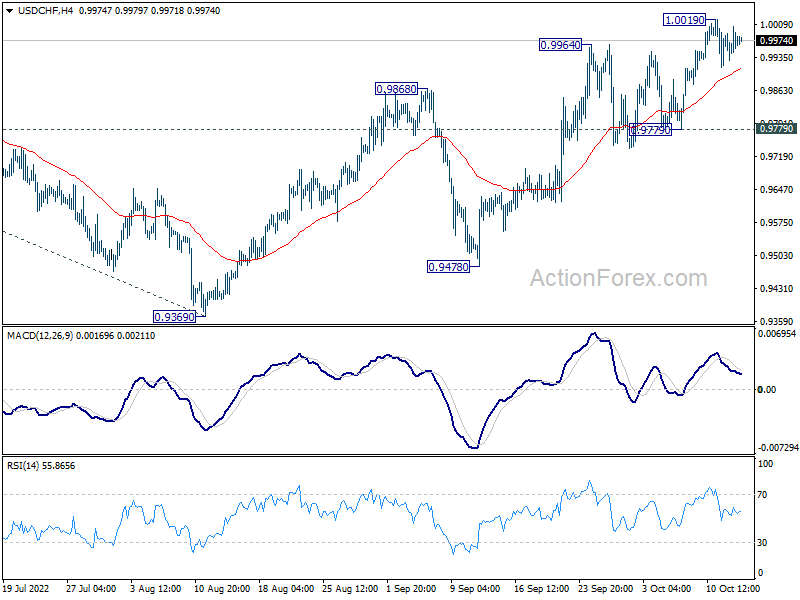
Intraday bias in USD/CHF remains neutral and outlook is unchanged. While deeper retreat cannot be ruled out, break of 0.9779 support is needed to indicate short term topping. Otherwise, outlook will stay cautiously bullish in case of retreat. On the upside, above 1.0019 will target 1.0063 high first. Decisive break there will resume larger up trend.
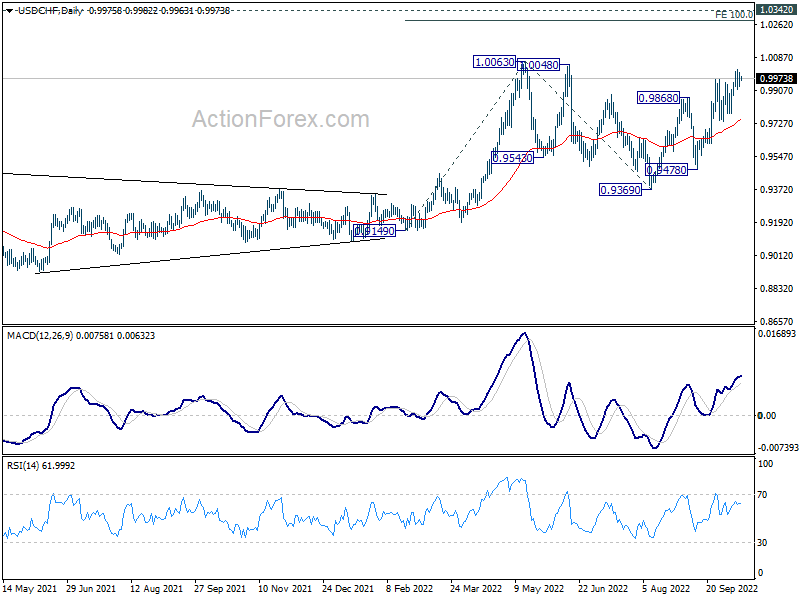
In the bigger picture, current development suggests that up trend from 0.8756 (2021 low) is still in progress. Sustained break of 1.0063 will target 100% projection of 0.9149 to 1.0063 from 0.9369 at 1.0283, and then 1.0342 (2016 high). For now, this will remain the favored case as long as 0.9369 support holds, even in case of deep pull back.
USD/JPY Daily Outlook
Daily Pivots: (S1) 146.09; (P) 146.53; (R1) 147.33; More...
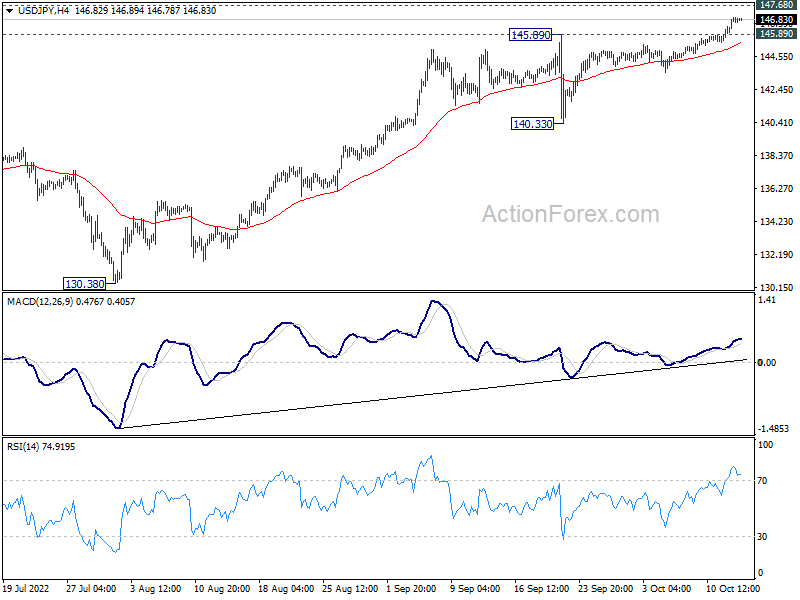
Intraday bias in USD/JPY stays on the upside for 147.68 long term resistance. On the downside, break of 145.789 resistance turned support will turn intraday bias neutral and bring consolidations again. But overall, outlook will remain bullish as long as 140.33 support holds, even in case of deep pullback.
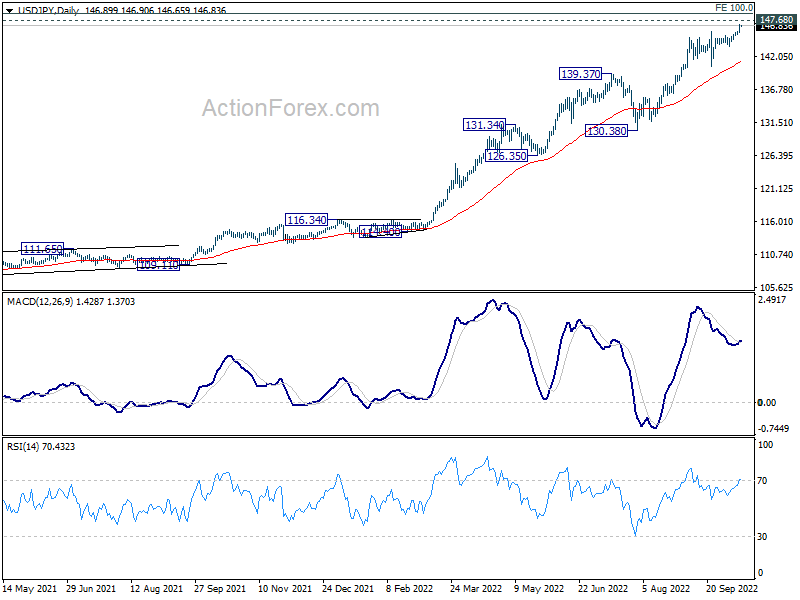
In the bigger picture, up trend from 101.18 is still in progress, as part of the whole up trend from 75.56 (2011 low). Further rise should be seen to 147.68 (1998 high), and possibly to 100% projection of 75.56 (2011 low) to 125.85 (2015 high) from 98.97 at 149.26, For now, break of 130.38 support is needed to be the first indication of medium term topping. Otherwise, outlook will stay bullish even in case of deep pull back.
AUD/USD Daily Report
Daily Pivots: (S1) 0.6242; (P) 0.6271; (R1) 0.6305; More...
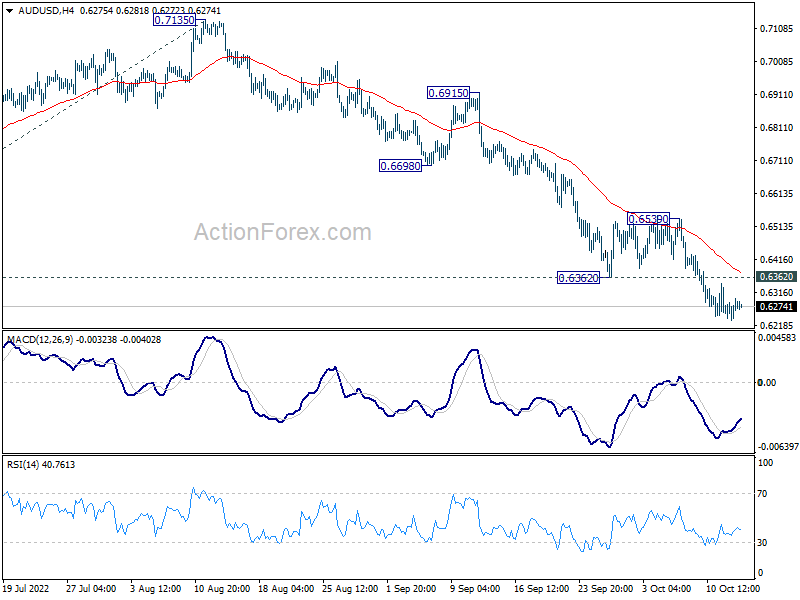
AUD/USD is losing some downside momentum as seen in 4 hour MACD. But further decline is expected with 0.6362 resistance holds. Current decline should target 100% projection of 0.7660 to 0.6680 from 0.7135 at 0.6155. On the upside, above 0.6362 minor resistance will turn intraday bias to the upside, for rebound to 0.6539 resistance.
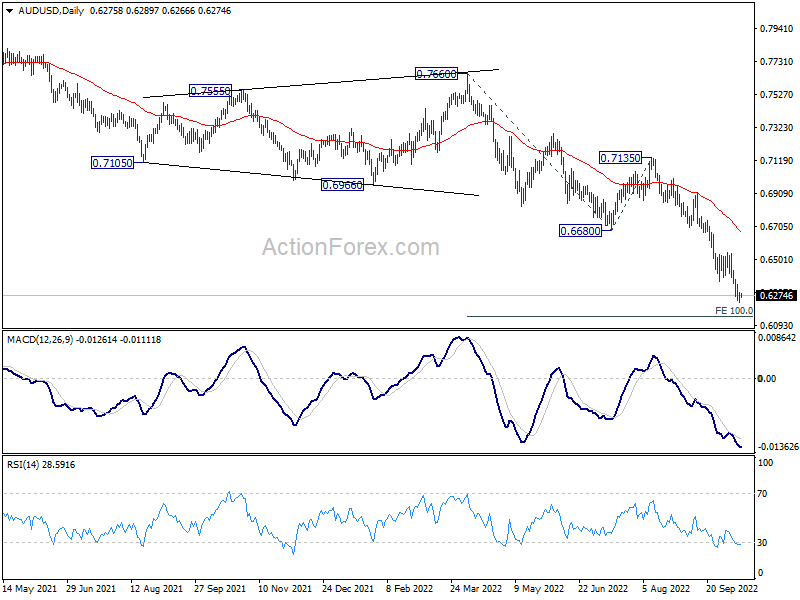
In the bigger picture, down trend form 0.8006 (2021 high) is expected to continue as long as 0.6680 support turned resistance holds. Next target is 0.5506 low. Medium term momentum will now be closely monitored to gauge the chance of break of 0.5506.
All Eyes on US CPI
Market movers today
It's finally time for US CPI for September - the main data release of the week. We expect the headline to print relatively low at 0.2% m/m in line with consensus, as gasoline prices continued to decline during September. For core, we continue to see modest upside risks to the consensus expectation, and forecast a rise of 0.5% m/m (consensus 0.4% m/m).
China releases CPI and PPI early tomorrow morning. CPI inflation is expected to rise to 2.8% from 2.5% still staying below the 3% target. PPI inflation is set to decline further to around 1.0% y/y from 2.3% y/y. It has come a long way down from the peak in October 2021 at 13.5% y/y.
The 60 second overview
FOMC minutes: The minutes from the FOMC's September meeting provided markets with little new information on Fed's policy path, as the focus clearly remains on maintaining financial conditions restrictive for now. Some participants highlighted the rising recession risks abroad and the possible negative spill-over effects for the US, which have been noted in several Fed speeches lately as well. That said, as long as market functioning is not at risk, we doubt Fed will change course if underlying inflation pressures persist near current levels. The minutes underlined that the cost of overdoing the tightening is lower than the cost of allowing high inflation pressures to get entrenched. We agree, and continue to emphasize that any kind of a pivot at this point could lead to premature easing in financial conditions, and consequently risk prolonging the inflation. See also our US Labour Market Monitor - Early signs of easing wage inflation are not enough to spark a Fed 'pivot', 12 October.
Spill-over from UK: Euro area bond markets continue to remain sensitive to spill-over from the UK, where the BoE signalled only 2 days of additional bond buying. Gilts sold off through the day peaking 20bp higher at one point - only to reverse the entire move once BoE announced that they accepted 'all' offers.
Equities: Equities lower yesterday (again), MSCI world down 5% the last five trading days. S&P 500 and Nasdaq both down for a sixth session, with S&P500 posting lowest close since Nov-20 and Nasdaq since Jul-20. Bond markets easy to blame but despite still high intraday volatility in yields it was not the area of concern yesterday as US yields were lower while UK yields ended flat in the long end of the curve and lower at the short end. It was more of a waiting game ahead of the US CPI today, big start to earnings season Friday and the question of whether BoE can end emergency QE also due to be seen tomorrow/Monday. Behind the relatively small drop in equities, a very mixed story within sector as utilities sold off defensives underperformed cyclicals slightly. In US Dow -0.1%, S&P 500 -0.3%, Nasdaq -0.1% and Russell 2000 -0.3%. Not much of a positive story from Asia this morning with most indices lower and continued pressure on tech stocks and South Korea. US futures marginally higher while European futures are lower.
FI: Yet another eventful day in rates markets, with significant curve steepening across the board. Uncertainty about BoE's intention to end its bond buying already on Friday caused volatility from the morning and a weak German supply amid Knot saying at least two significant rate hikes before neutral rate reached all contributed to the higher rate with core some 10-12bp higher in the 10y point. However, Bunds ended broadly unchanged on the day due to BoE spill-over.
FX: The Fed minutes supports our case for further USD over the coming 12 months, as a 'pivot' would be premature at this point. GBP continues to trade under high volatility, likely to rise slightly towards year-end. Impending European recession will weigh on Scandies over the coming quarter, but we see a chance for a NOK comeback in 2023. Watch out for Swedish inflation and the SEK today.
Credit: Yesterday credit markets staged yet another late recovery, reversing a day of widening at the last hours of trading. This left iTraxx main some 1.5bp tighter and Xover some 8.4bp tighter. Both indices closed in 133bp and 634bp respectively. Both the primary and secondary cash markets remain very inactive and illiquid.
Nordic macro
Swedish inflation (CET 8:00) is expected to have taken another jump higher during September with CPIexE at 7.5% y/y (in line with Riksbank and market) and CPIF at 9.1% according to our own forecast (Market: 9.4% and Riksbank: 9.7%).
Technical Outlook and Review
USD/JPY:
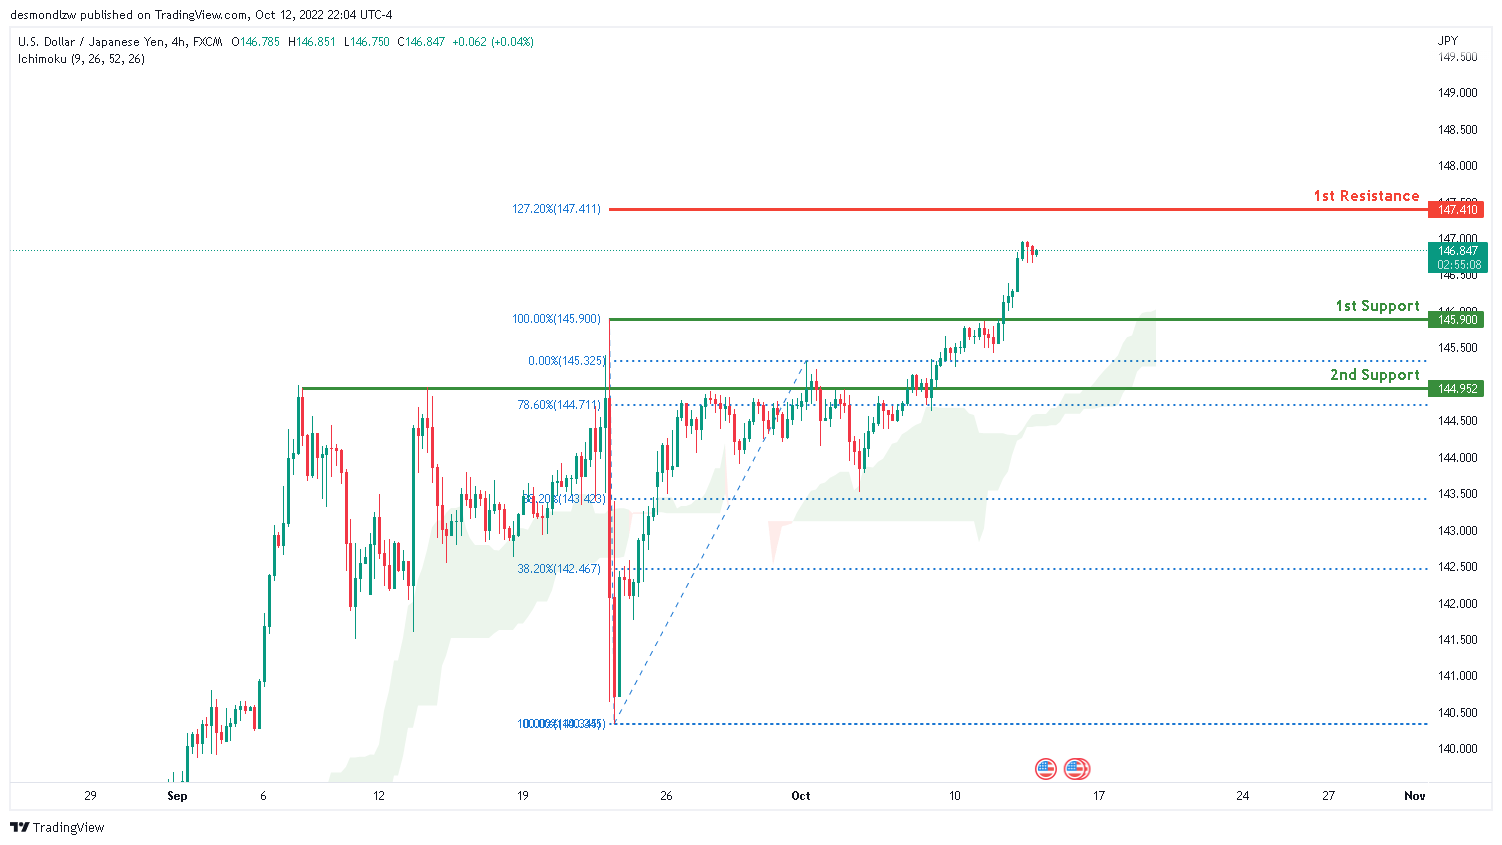
The current general bias for USDJPY on the H4 chart is bullish. To add to this bias, the price is currently trading above the Ichimoku cloud, indicating a bullish market. Overnight, the price has maintained its strong bullish momentum above the first support line at 145.900, which also happens to be the 100% Fibonacci line. If the bullish trend continues, price may move towards the first resistance line at 147.410, which contains the 127.2% Fibonacci extension line.
Areas of consideration:
- H4 time frame, 1st resistance at 147.410
- H4 time frame, 1st support at 145.900
DXY:
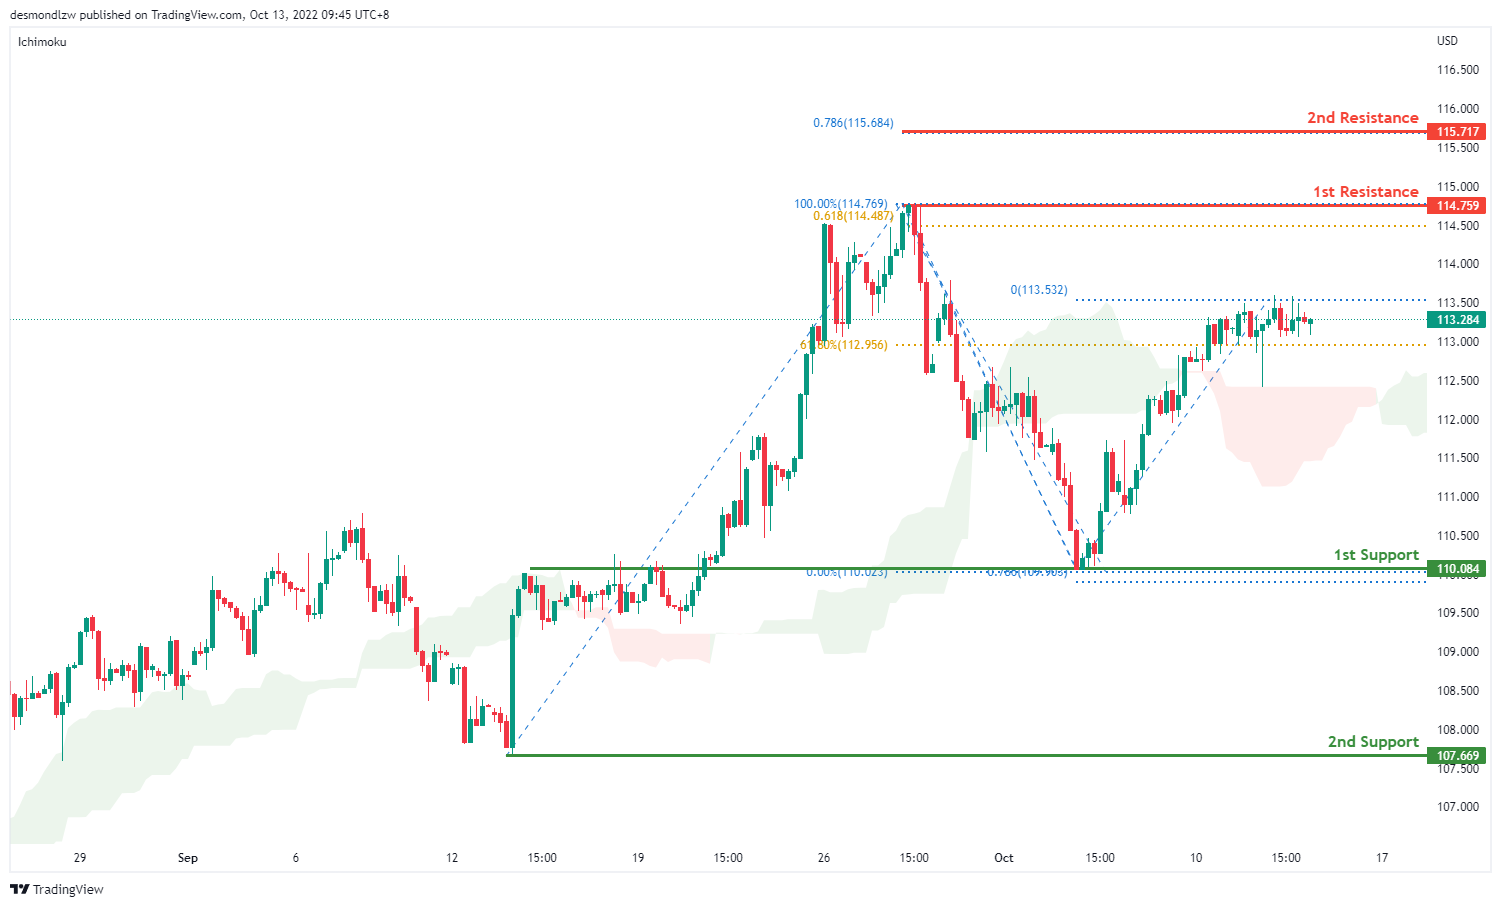
On the H4 chart, prices are moving in an ascending trend signalling slight bullish momentum. It is currently moving towards the first resistance at 114.759 where the previous swing high sits. If bullish momentum continues it will bring price to 115.717 where the 78.6% projection. Alternatively, prices could test the first support at 110.084 where the swing low sits. if it breaks this level, bearish momentum will bring price to second support at 107.669
Areas of consideration:
- H4 time frame, 1st resistance at 114.759
- H4 time frame, 1st support at 110.084
EUR/USD:
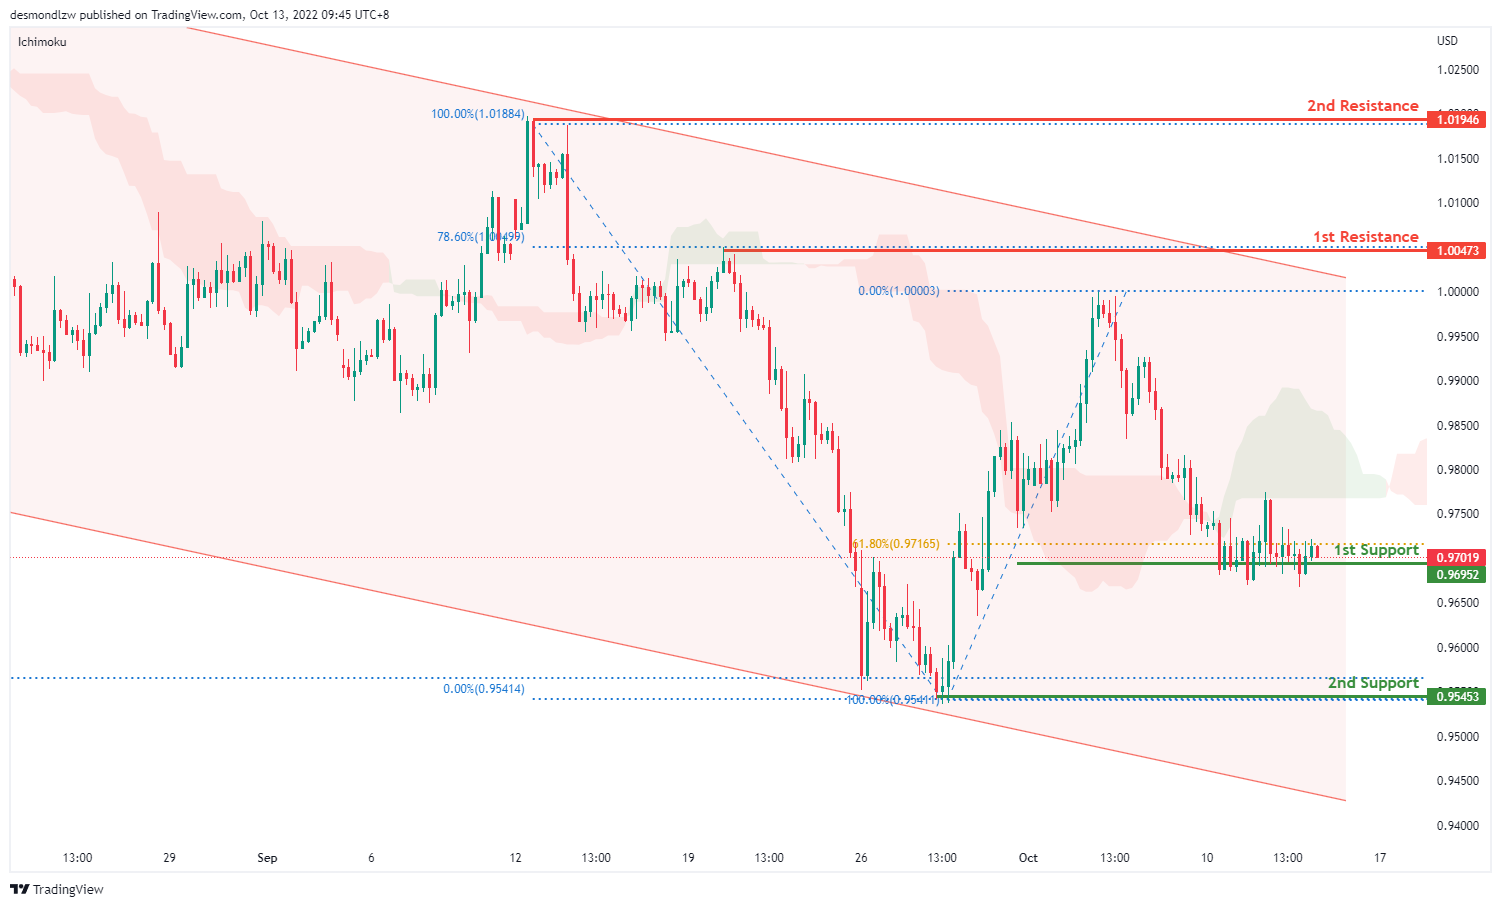
On the H4, price is moving within the descending trendline in a descending manner, with the price moving below ichimoku cloud- we are bearish biassed. Price is testing the first support at 0.9695 where the 61.8% retracement sits. If it breaks this level, bearish momentum will bring price to the second support at 0.9545 where the swing low and 161.8% extension sit. Alternatively, price may test the first resistance at 1.0047 where the 78.6% retracement sits. If price breaks this level, it may test the second resistance at 1.0194, where the previous swing high sits
Areas of consideration :
- H4 1st resistance at 1.0047
- H4 2nd resistance at 1.0194
GBP/USD:
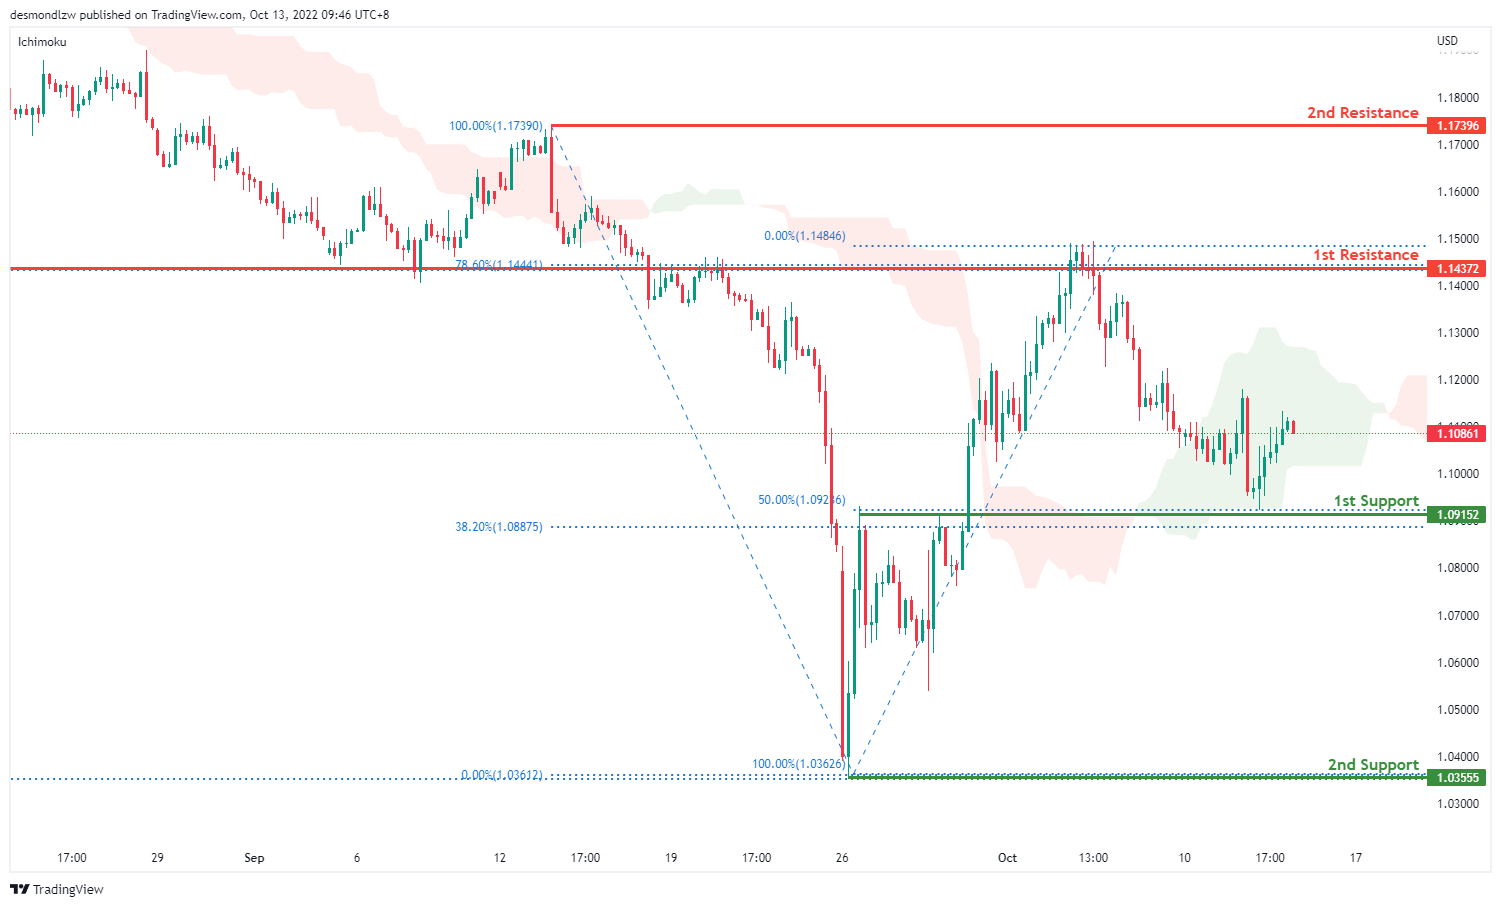
On the H4, price has rejected the first support and is moving in an ascending trend hence we are slightly bullish bias- if price breaks the first support at 1.0915 where the 50% retracement sits, bearish momentum will bring price to the second support at 1.0355 where the previous swing low sits. Alternatively price can test the first resistance at 1.1437 where the 78.6% retracement and overlap resistance sit. Subsequently the second resistance at 1.1739
Areas of consideration:
- H4 1st support at 1.0915
- H4 1st resistance at 1.1437
USD/CHF:
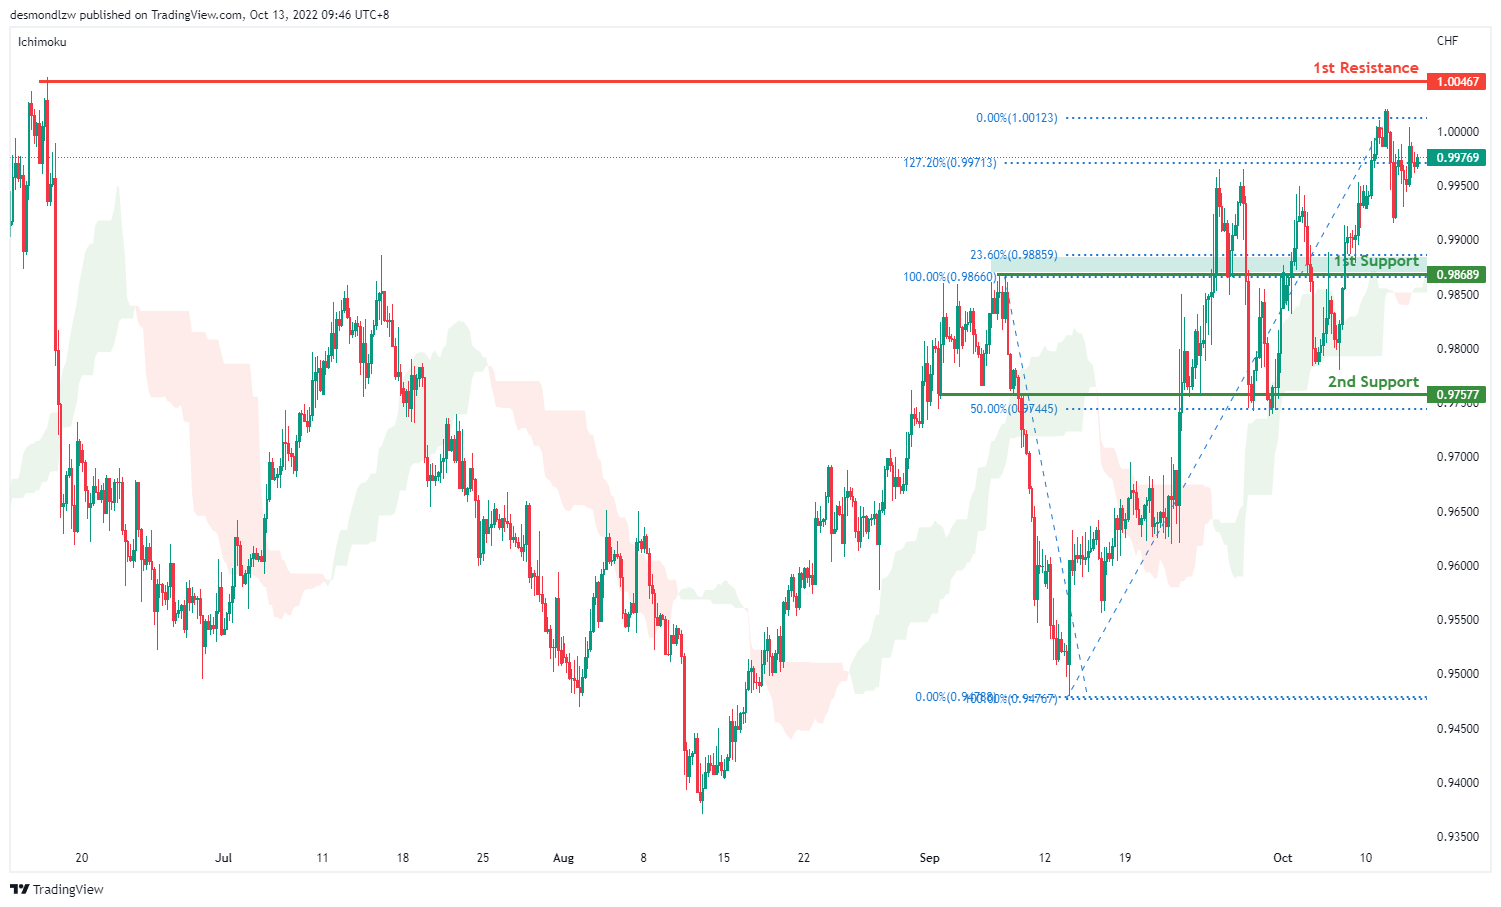
USDCHF is in a strong bullish trend on the H4 chart. Price is trading above the Ichimoku cloud signalling a bullish trend. Price looks like it’s moving toward the first resistance 1.0046 where the previous swing high sits. Alternatively price can test the first support at 0.9868 where the overlap support and 23.6% retracement sits then the second support at 0.9757 where the 50% retracement sits
Areas of consideration
- H4 1st support at 0.9868
- H4 1st resistance at 1.0046
XAU/USD (GOLD):
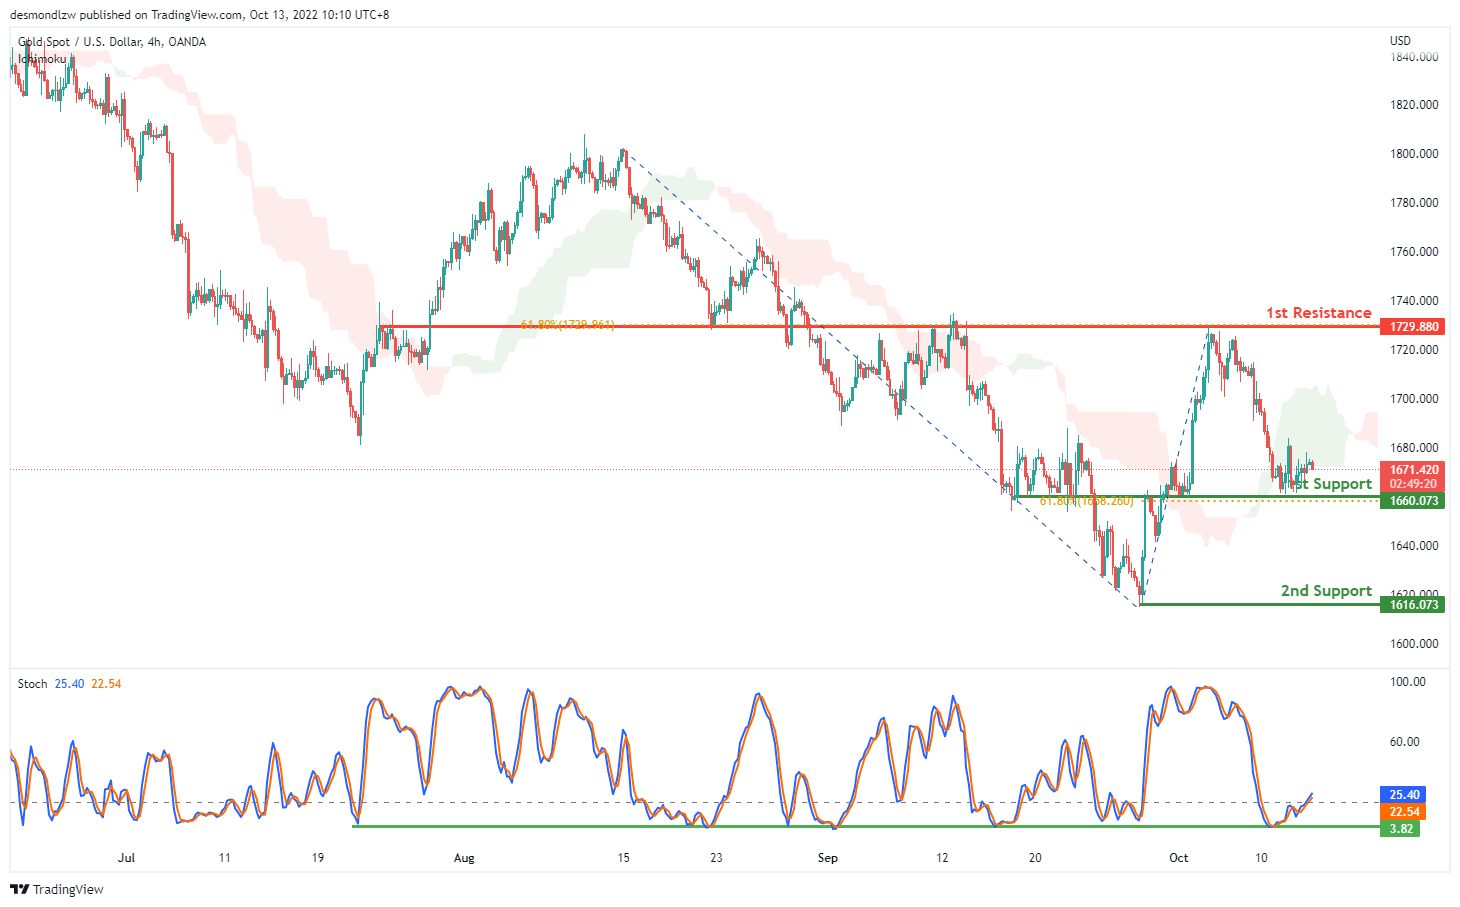
On the H4, price is rising from the 1st support at 1660.073, which is in line with the 61.8% fibonacci retracement and overlap support, as the price is above ichimoku cloud and stoch is rising from support level , we can expect the price bounce off from 1st support and test the 1st resistance at 1729.880, where the 61.8% fibonacci retracement and previous swing highs are. Alternatively, the price may break the 1st support and drop to the 2nd support at 1616.073, where the swing low is.
Areas of consideration:
- H4 time frame, 1st support at 1660.073
- H4 time frame,1st resistance at 1729.880
AUD/USD:
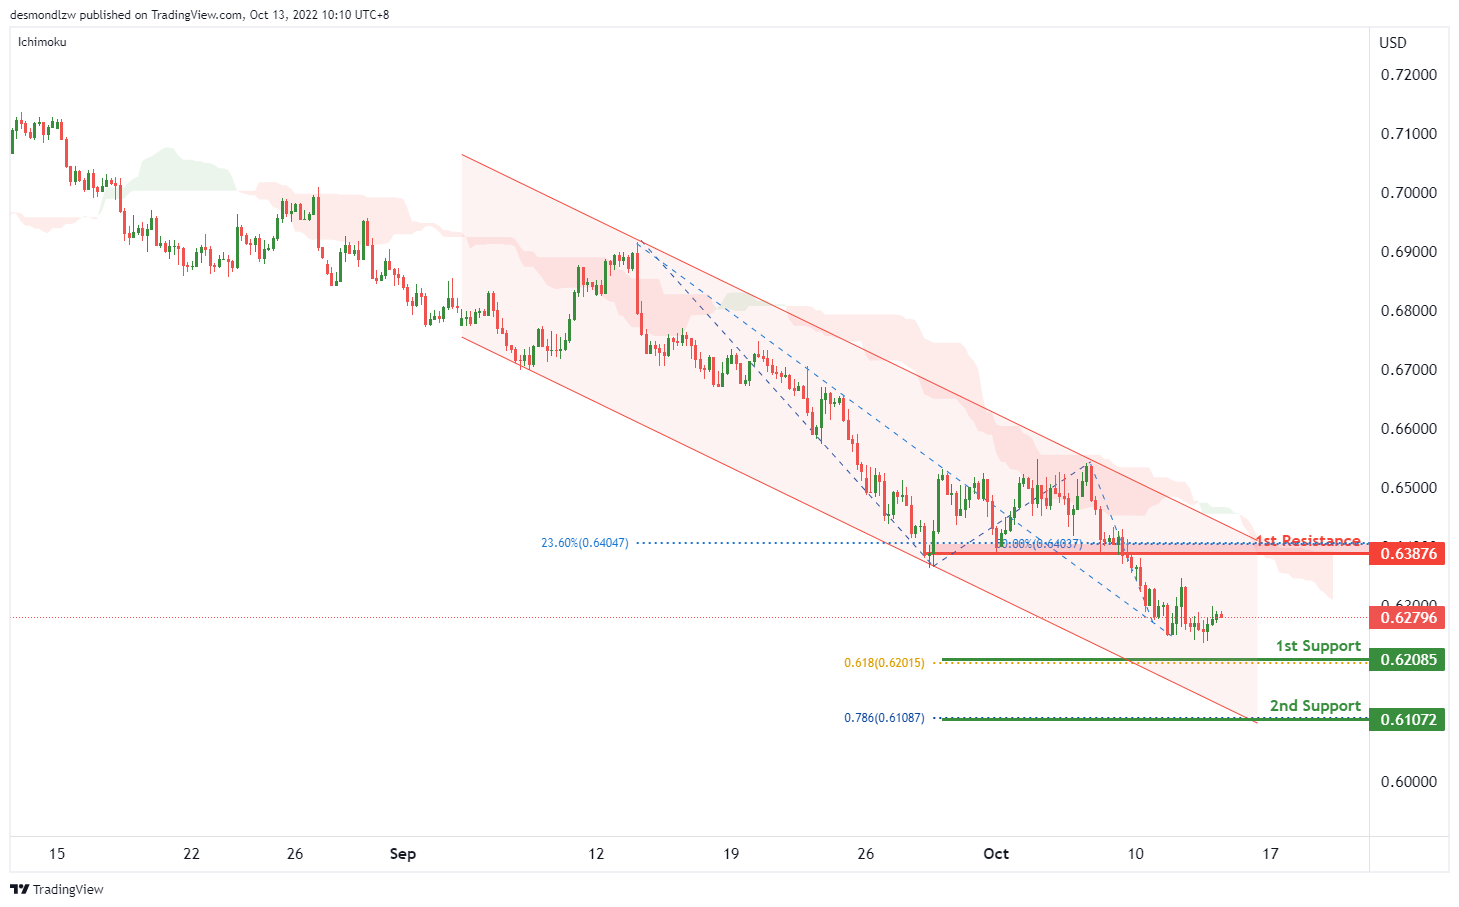
On the H4, the price is moving within the descending channel and below ichimoku cloud, we have a bearish bias that the price may drop to the 1st support at 0.62085, which is in line with the 61.8% fibonacci projection. If the 1st support is broken, the 2nd support could be at 0.61072, where the 78.6% fibonacci projection is. Alternatively, the price may rise to the 1st resistance at 0.63876, which is in line with the 23.6% fibonacci retracement and 50% fibonacci retracement.
Areas of consideration
- H4, 1st support at 0.62085
- H4, 2nd support at 0.61072
NZD/USD:
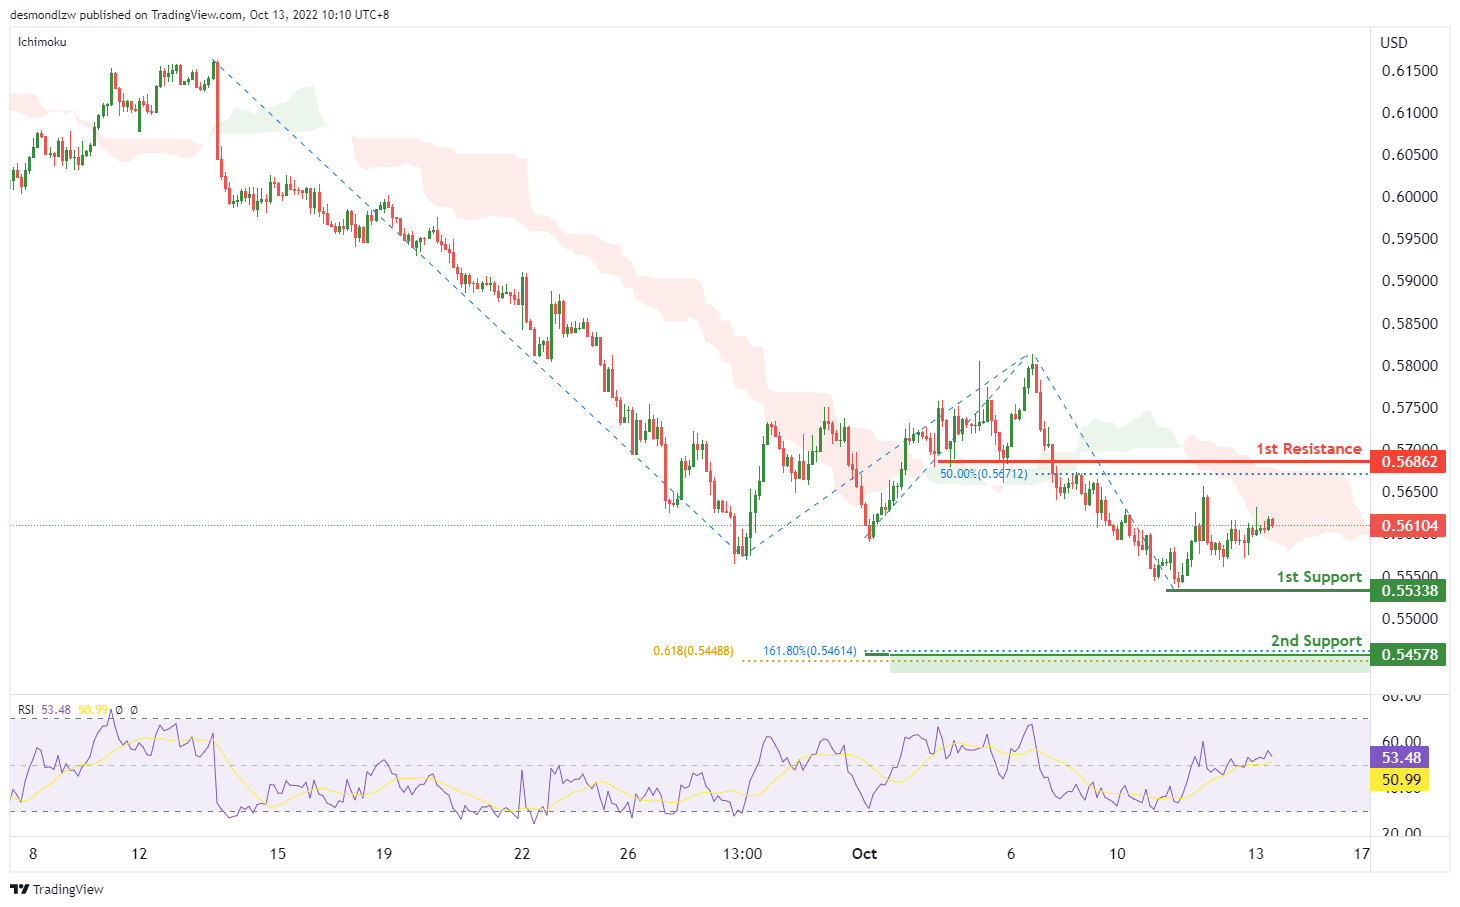
On the H4, the price is crossing the ichimoku cloud and RSI is rising over 50, we have a bullish bias that the price may rise to test the 1st resistance at 0.56862, where the 50% fibonacci retracement is. Alternatively, the price may drop to test the 1st support at 0.55338, which is in line with the swing low, if the 1st support is broken, the price may drop to the 2nd support at 0.54578, which is in line with the 161.8% fibonacci extension and 61.8% fibonacci projection.
Areas of consideration:
- H4 time frame, current price
- H4 time frame, 1st resistance at 0.56862
USD/CAD:
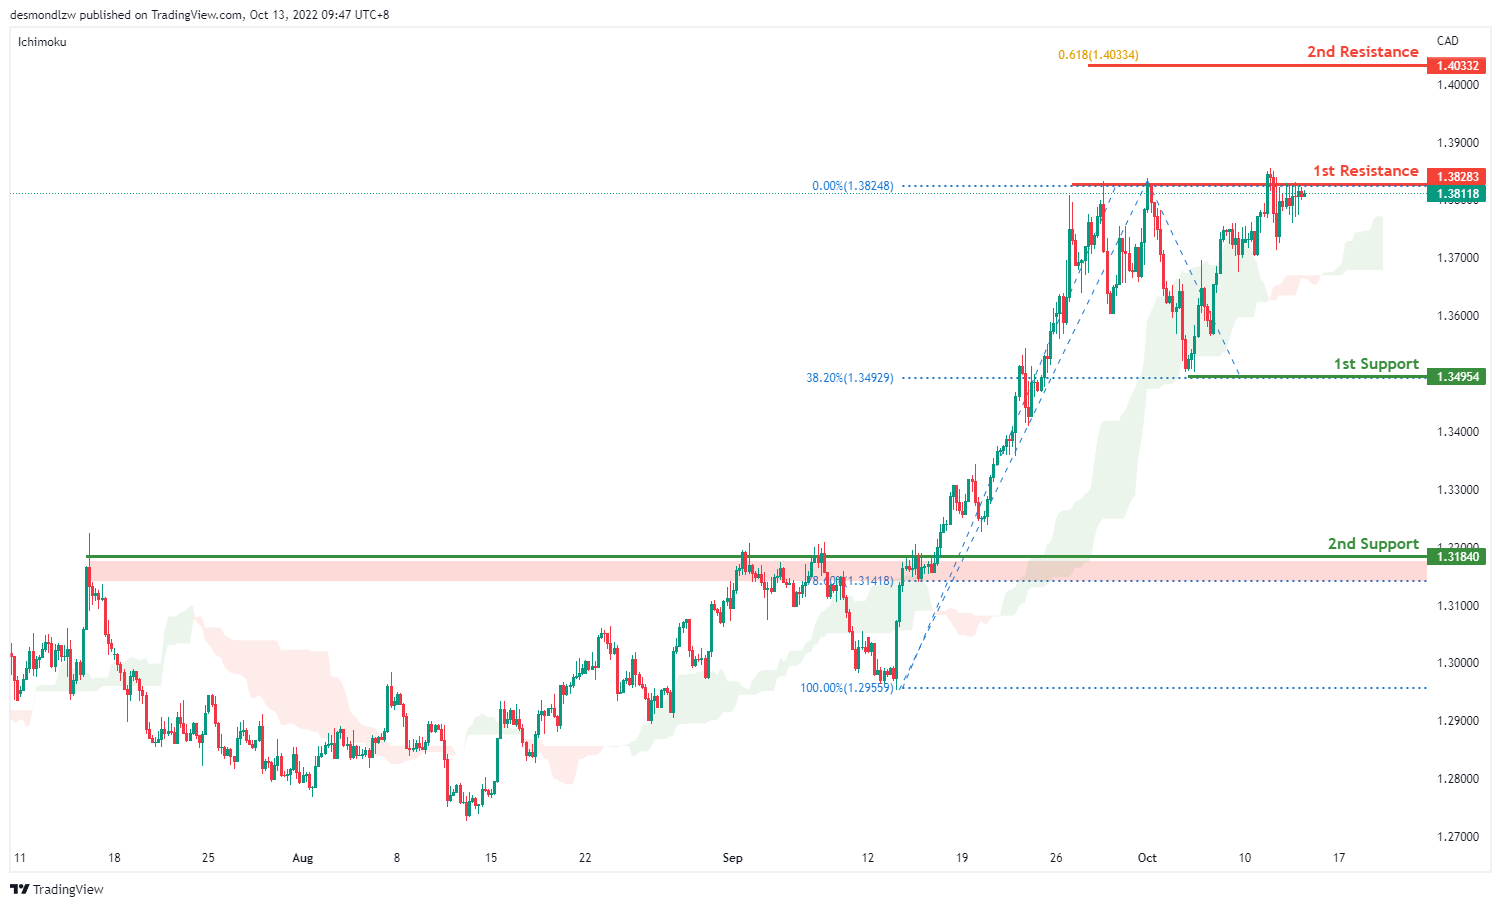
On the H4, the price trades higher near the 1st resistance of 1.3832 which is the previous swing high level. With the price trading above the ichimoku cloud, we have a short term bullish bias. The price could break the first resistance to test the second resistance at 1.4033 where the 61.8% projection sits. Alternatively it could fall to the 1st support at 1.3495 which is in line with the 38.2% retracement level and the previous swing low subsequently the second support at 1.3184 where the overlap support sits
Areas of consideration:
- H4 time frame, 1st resistance at 1.3828
- H4 time frame, 1st support at 1.3495
OIL:
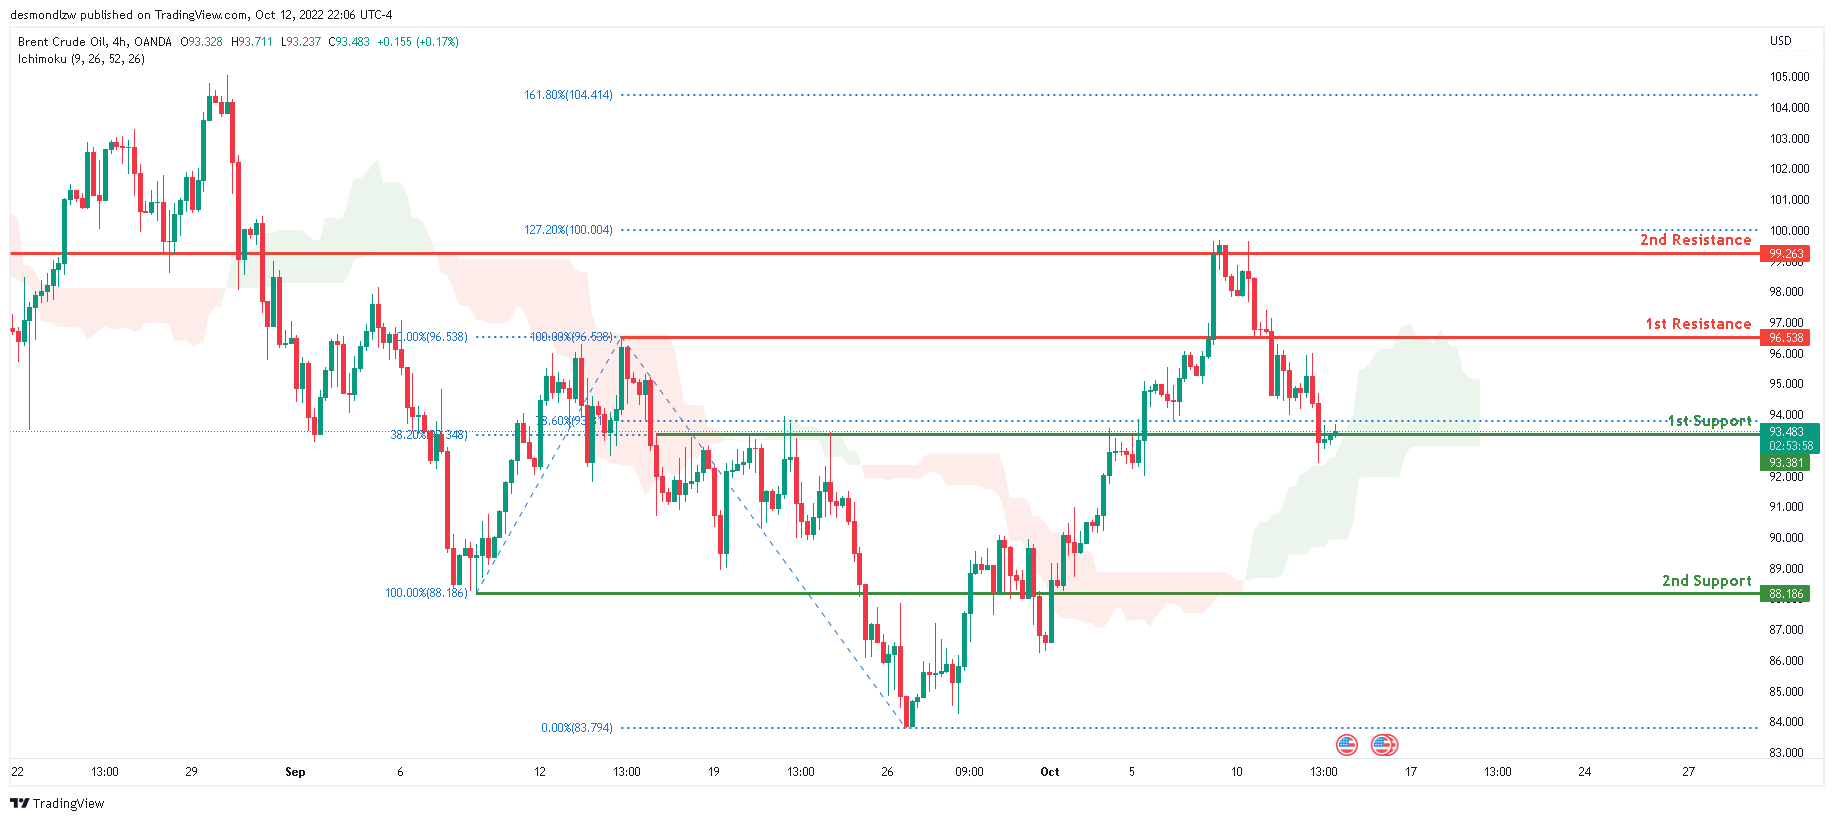
Looking at the H4 chart, the current overall bias for Oil is bullish . To add confluence to this bias, the price is currently above the Ichimoku cloud which indicates a bullish market. Overnight, price has tapped onto the 1st support line at 93.381 where the 78.6% Fibonaaci line and 38.2% Fibonaaci line is located. Price is currently resting on that 1st support line. Expect price to possibly reflect off this 1st support line and back upwards towards the 1st resistance at 96.538 where the 100% Fibonacci line and 0% Fibonacci line are located.
Areas of consideration:
- H4 time frame, 1st resistance at 96.538
- H4 time frame, 1st support at 93.381
Dow Jones Industrial Average:
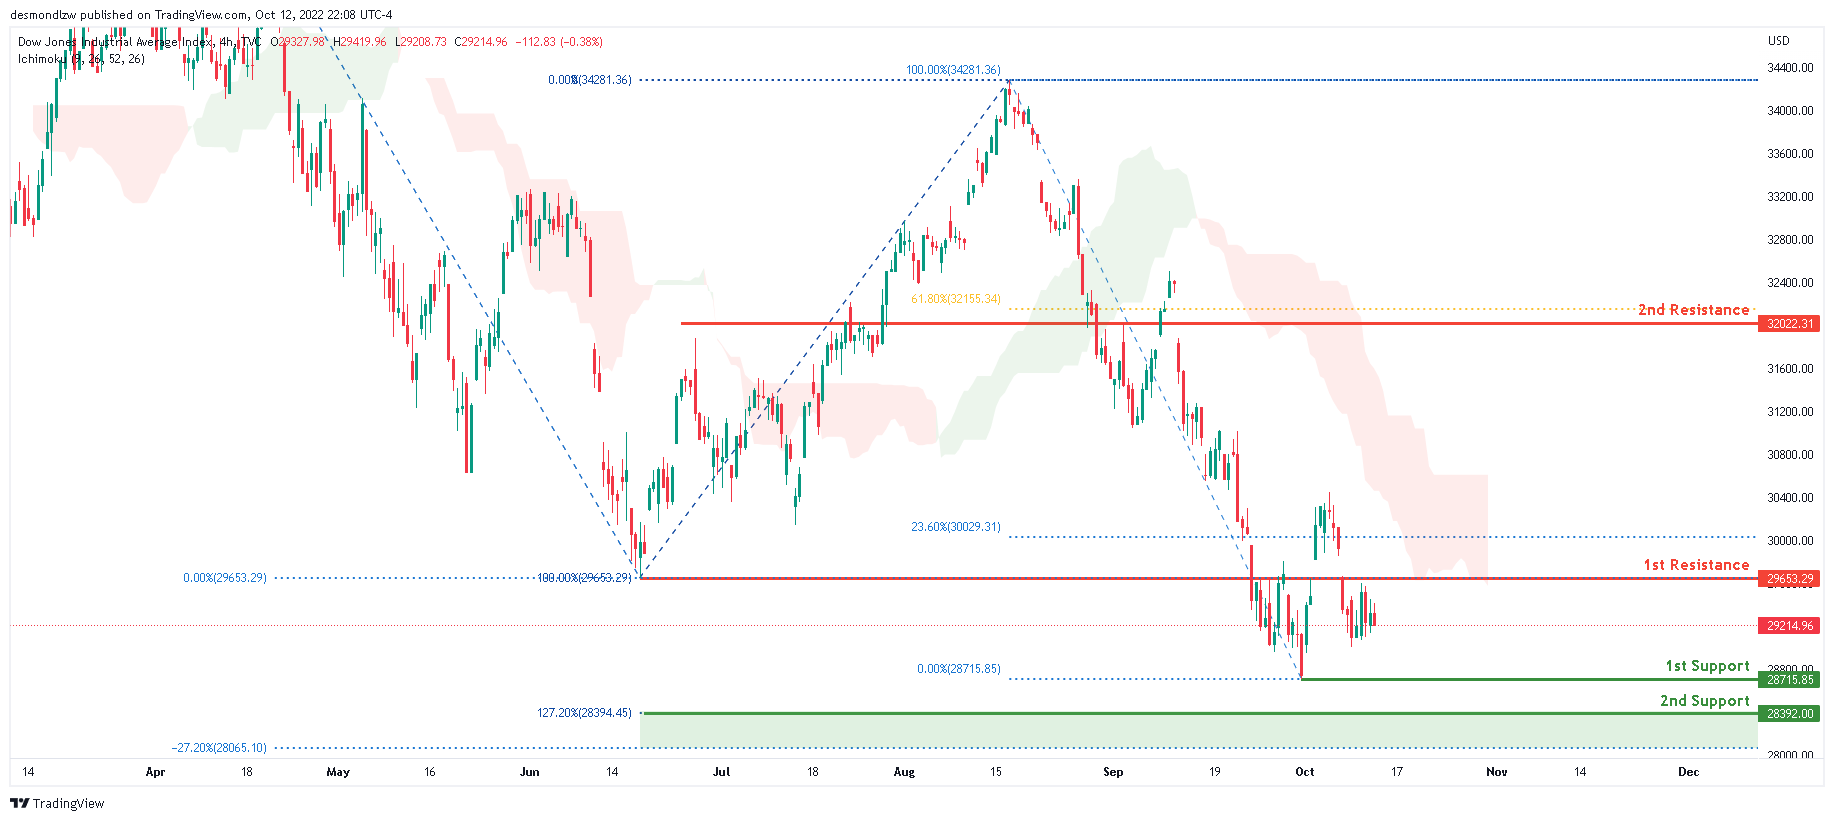
The current overall bias for DJI is bearish, according to the H4 chart. To add to this bias, the price is currently trading below the Ichimoku cloud, indicating a bearish market. Price has continued to consolidate below the first resistance line overnight. If the bearish momentum continues, price may move towards the first support line at 28715.85, which contains the 0% Fibonacci line and the 127.2% Fibonacci extension line.
Areas of consideration:
- H4 time frame, 1st support at 28715.85
- H4 time frame, 1st resistance at 29653.29
DAX:
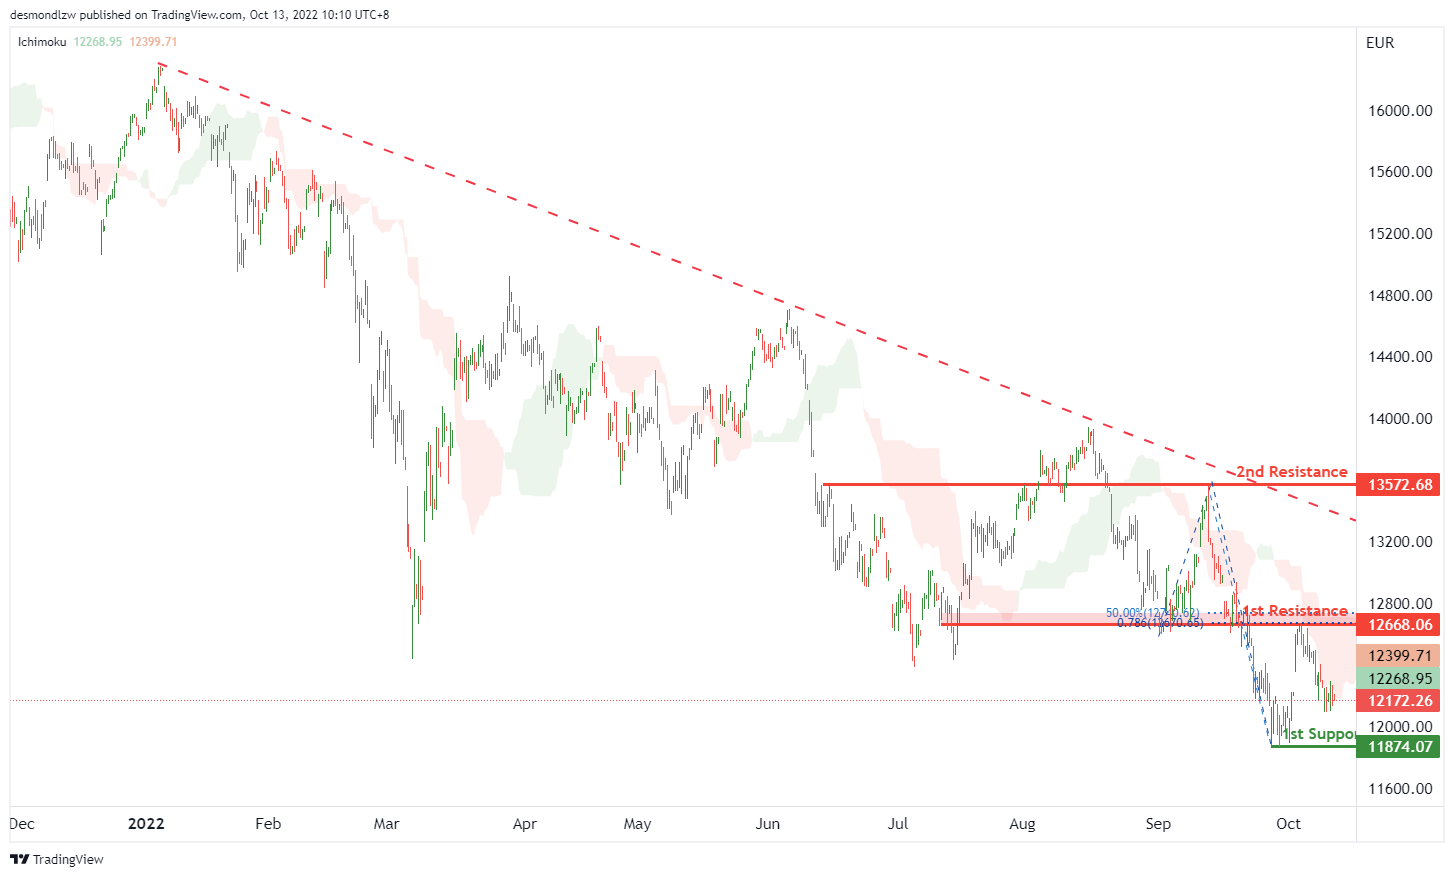
On the H4, with the price moving below ichimoku cloud and long term descending trendline, we have a bearish bias that the price may drop to the 1st support at 11874.07, which is in line with the swing low. Alternatively, the price may rise to the 1st resistance at 12668.06, which is in line with the 50% fibonacci retracement, 78.6% fibonacci projection and overlap resistance, if the 1st resistance is broken, the 2nd resistance could be at 13572.68, where the previous swing high is.
Areas of consideration:
- H4 time frame, current price
- H4 time frame, 1st support at 11874.07
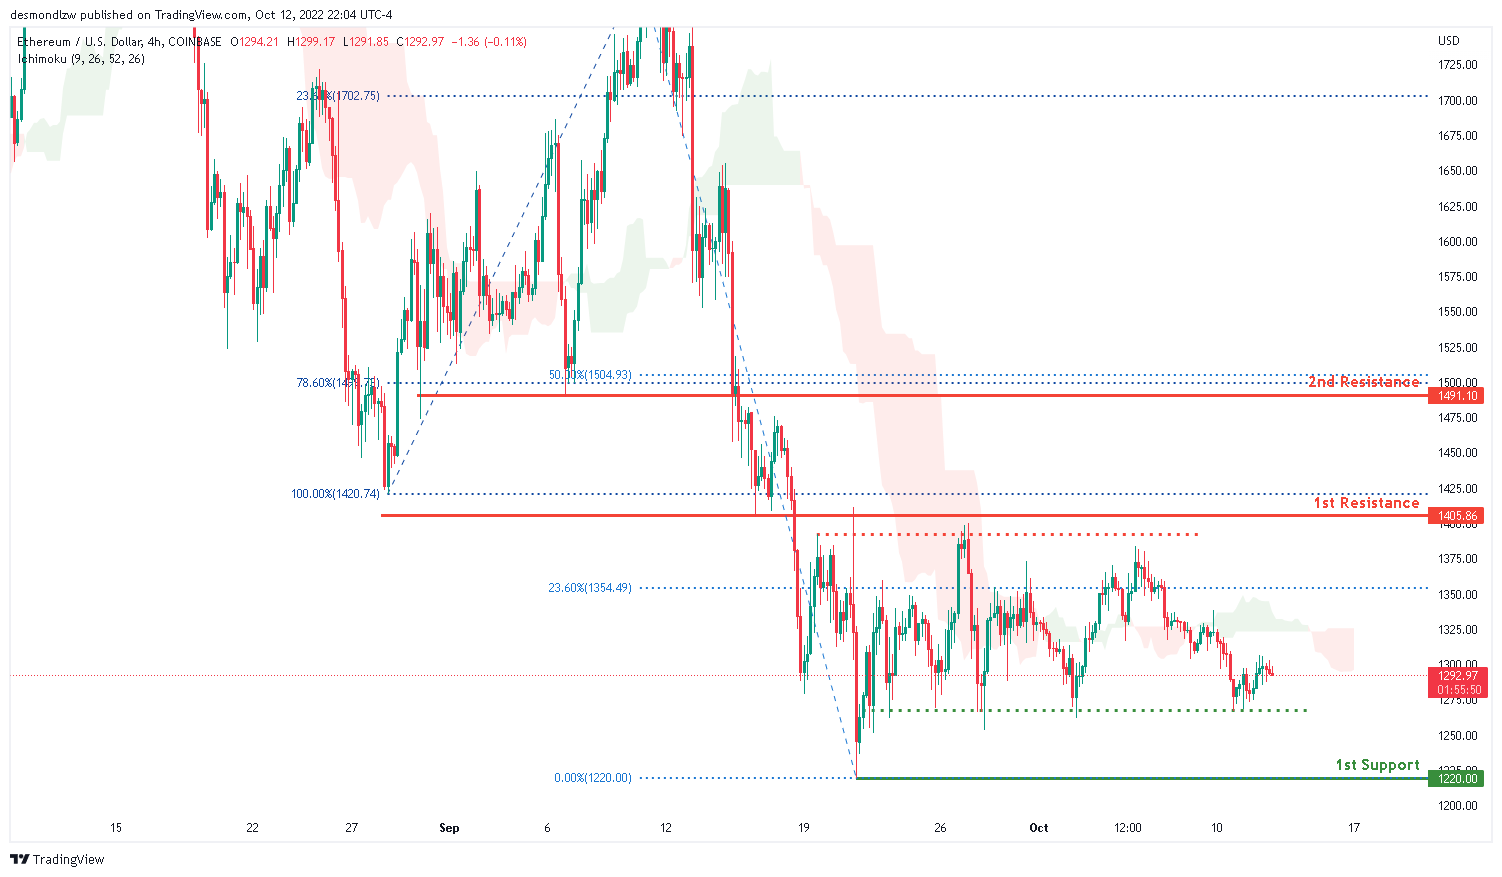
ETHUSD:
Looking at the H4 chart, the current overall bias for ETHUSD is bearish. To add confluence to this bias, the price is currently under the Ichimoku cloud which indicates a bearish market. Overnight, the price has continued it’s bearish momentum downwards. Price has been consolidating between the 1403 and 1220 area for the past 3 weeks. If the bearish momentum continues, expect price to possibly head towards the 1st support line at 1220.00, where the 0% Fibonaaci line is located.
Areas of consideration:
- H4 time frame, 1st resistance of 1405.86
- H4 time frame, 1st support at 1220.00
BTCUSD:
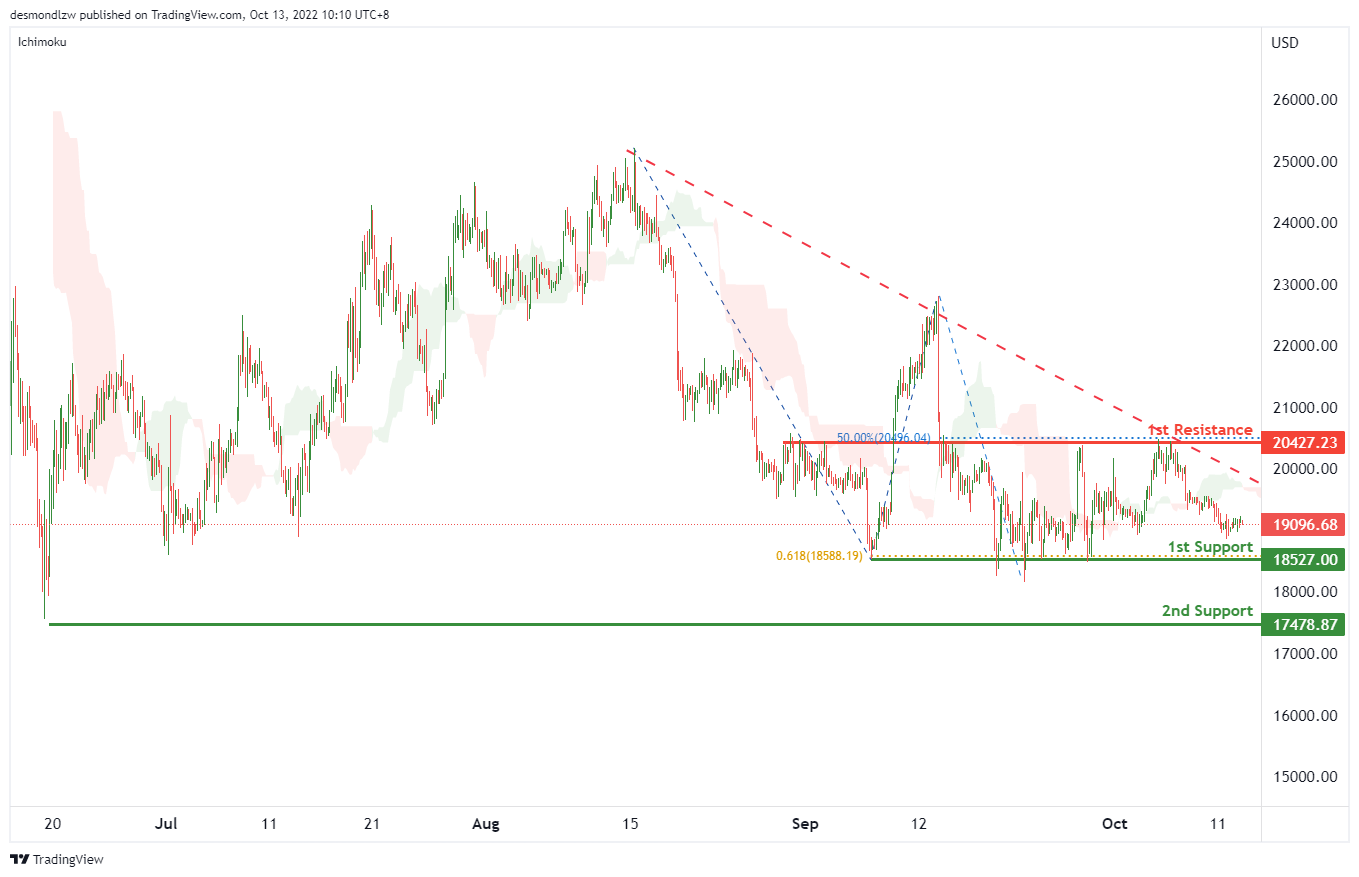
On the H4, price is showing a descending trendline and below the ichimoku cloud, we can expect the price drop to test the 1st support at 18527.00, which is in line with the swing lows and 61.8% fibonacci projection. If the 1st support is broken, we can expect the price to drop to the 2nd support at 17478.87, where the previous swing low is. Alternatively, the price may rise to the 1st resistance at 20427.23, where the overlap resistance and 50% fibonacci retracement are.
Areas of consideration:
- H4 time frame, 1st support at 18527.00
- H4 time frame, 2nd support at 17478.87
S&P 500:
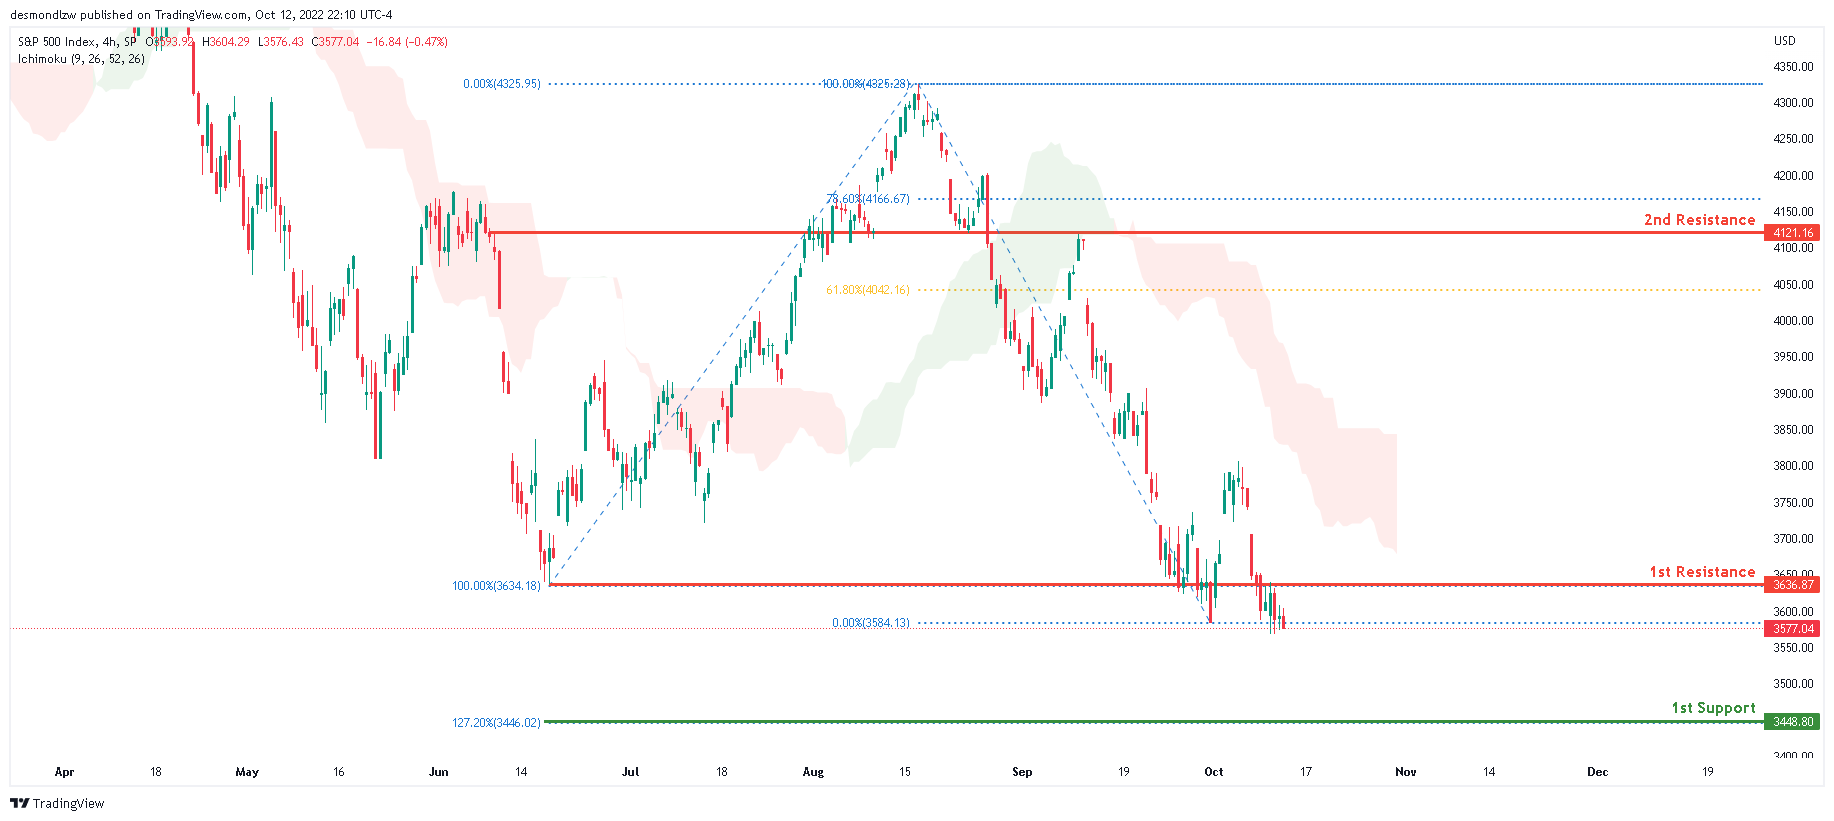
Based on the H4 chart, the current overall bias for the S&P500 is bearish. To add to this bias, the price is currently below the Ichimoku cloud, indicating a bearish market. Overnight, the price has consolidated under the first resistance line at 3636.87, which is also the 100% Fibonacci line and prior swing bottom. If the negative trend continues, price may move towards the first support line at 3448.80, where the 127.2% Fibonacci line is placed.
Areas of consideration:
- H4 time frame, 1st support at 3448.80
- H4 time frame, 1st resistance at 3636.87
USD/CAD Daily Outlook
Daily Pivots: (S1) 1.3775; (P) 1.3803; (R1) 1.3845; More...
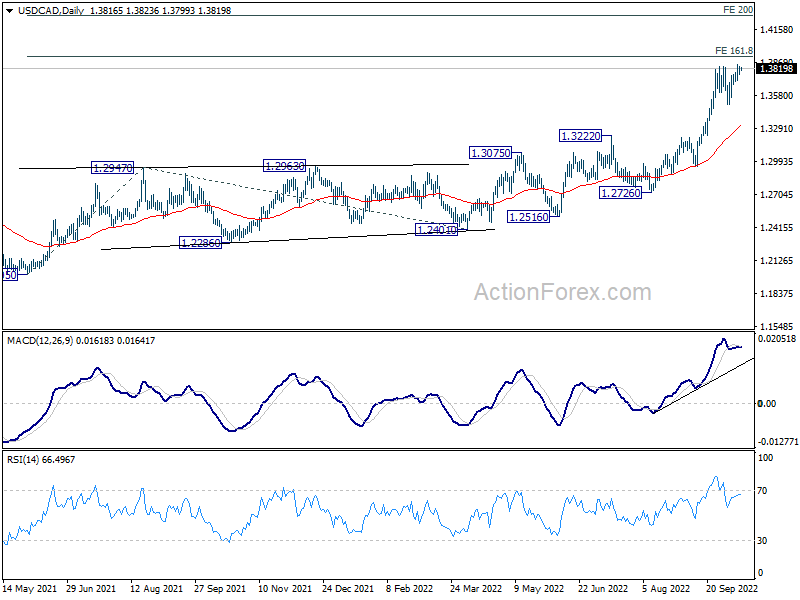
USD/CAD is losing some upside momentum as seen in 4 hour MACD. But further rise is still expected with 1.3701 minor support intact. Current up trend should target 161.8% projection of 1.2005 to 1.2947 from 1.2401 at 1.3925. Decisive break there will target 200% projection at 1.4285. On the downside, below 1.3701 will turn bias to the downside for 1.3501 support instead.
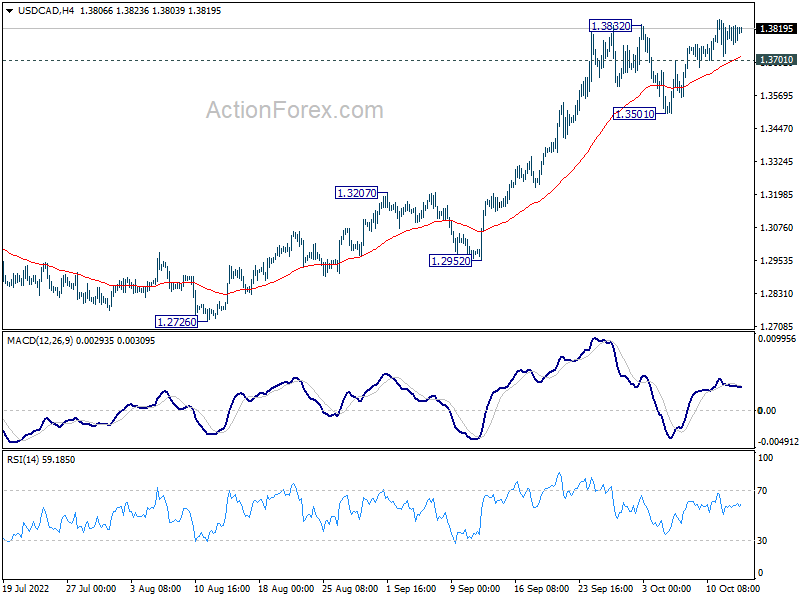
In the bigger picture, up trend from 1.2005 (2021 low) is still in progress. Based on current impulsive momentum, it could be resuming long term up trend from 0.9056 (2007 low). Whether it is or it isn't, retest of 1.4689 (2016 high) should be seen next. This will now remain the favored case as long as 1.3222 resistance turned support holds.
Dollar Struggling for Momentum, Await CPI for Guidance
The markets are generally steady in Asian session today, as traders await US consumer inflation data. FOMC minutes released overnight basically provided nothing to counter the expectation of a 75bps hike by Fed in November. Today's data might further affirm such expectations. While Dollar is firm, it's struggling to build up momentum except versus Yen. There's good chance for Dollar bulls jump in if the CPI data surprise on the upside.
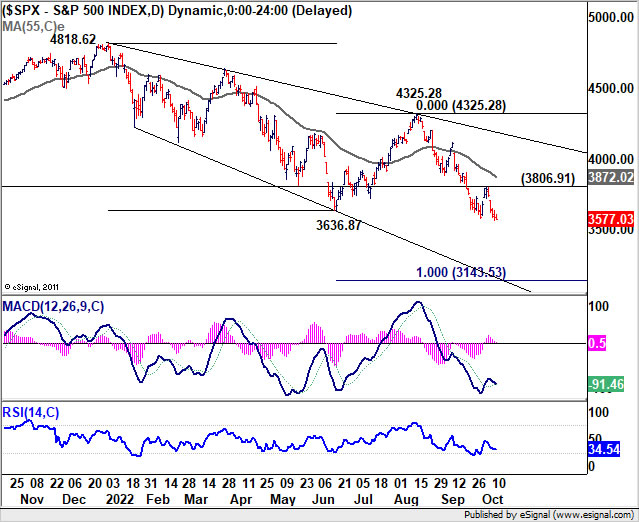
Technically, S&P 500 stabilized a little bit after dipping to 2-year low earlier, but stays vulnerable. As long as 3806.91 resistance holds, further decline is expected. Current down trend is still in progress for 100% projection of 4818.62 to 3636.87 from 4325.28 at 3143.53 later in the year. The speed of the decline would very much depend on the Fed's tightening pace and terminal rate, which ties to inflation outlook.
In Asia, at the time of writing, Nikkei is down -0.51%. Hong Kong HSI is down -1.00%. China Shanghai SSE is up 0.16%. Singapore Strait Times is down -1.16%. Japan 10-year JGB yield is down -0.0010 at 0.253. Overnight, DOW dropped -0.10%. S&P 500 dropped -0.33%. NASDAQ dropped -0.09%. 10-year yield dropped -0.037 to 3.902.
FOMC minutes: Many emphasized cost of doing too little
In the minutes of September 20-21 FOMC meeting, it's noted that with "broad-based and unacceptably high level of inflation" and the "upside risks", participants remarked that "purposefully moving to a restrictive policy stance in the near term was consistent with risk-management considerations".
Further than that, "many participants emphasized that the cost of taking too little action to bring down inflation likely outweighed the cost of taking too much action."
Also, "several participants underlined the need to maintain a restrictive stance for as long as necessary".
Fed Bowman: Sizable hike on the table if inflation not moving down
Fed Governor Michelle Bowman said a speech, "if we do not see signs that inflation is moving down, my view continues to be that sizable increases in the target range for the federal funds rate should remain on the table."
Nevertheless, "if inflation starts to decline, I believe a slower pace of rate increases would be appropriate." Even so, "to bring inflation down in a consistent and lasting way, the federal funds rate will need to move up to a restrictive level and remain there for some time."
"However, it is not yet clear how high we will need to raise the federal funds rate and how much time will pass before we begin to see inflation moving back down in a consistent and lasting way," she added.
On the data front
UK RICS house price balance dropped to 32% in September, below expectation of 48%. Japan banking lending rose 2.3% yoy in September, versus expectation of 2.2% yoy. Japan PPI accelerated from 9.4% yoy to 9.7% yoy in September, well above expectation of 8.8% yoy. Australia consumer inflation expectation was unchanged at 5.4% in October.
Looking ahead, Germany will release CPI final. But focus will be on US CPI later in the day, while jobless claims will also be published.
USD/CAD Daily Outlook
Daily Pivots: (S1) 1.3775; (P) 1.3803; (R1) 1.3845; More...
USD/CAD is losing some upside momentum as seen in 4 hour MACD. But further rise is still expected with 1.3701 minor support intact. Current up trend should target 161.8% projection of 1.2005 to 1.2947 from 1.2401 at 1.3925. Decisive break there will target 200% projection at 1.4285. On the downside, below 1.3701 will turn bias to the downside for 1.3501 support instead.
In the bigger picture, up trend from 1.2005 (2021 low) is still in progress. Based on current impulsive momentum, it could be resuming long term up trend from 0.9056 (2007 low). Whether it is or it isn't, retest of 1.4689 (2016 high) should be seen next. This will now remain the favored case as long as 1.3222 resistance turned support holds.
Economic Indicators Update
| GMT | Ccy | Events | Actual | Forecast | Previous | Revised |
|---|---|---|---|---|---|---|
| 23:01 | GBP | RICS Housing Price Balance Sep | 32% | 48% | 53% | 51% |
| 23:50 | JPY | Bank Lending Y/Y Sep | 2.30% | 2.20% | 1.90% | |
| 23:50 | JPY | PPI Y/Y Sep | 9.70% | 8.80% | 9.00% | 9.40% |
| 00:00 | AUD | Consumer Inflation Expectations Oct | 5.40% | 5.40% | ||
| 06:00 | EUR | Germany CPI M/M Sep F | 1.90% | 1.90% | ||
| 06:00 | EUR | Germany CPI Y/Y Sep F | 10.00% | 10.00% | ||
| 12:30 | USD | Initial Jobless Claims (Oct 7) | 225K | 219K | ||
| 12:30 | USD | CPI M/M Sep | 0.20% | 0.10% | ||
| 12:30 | USD | CPI Y/Y Sep | 8.10% | 8.30% | ||
| 12:30 | USD | CPI Core M/M Sep | 0.50% | 0.60% | ||
| 12:30 | USD | CPI Core Y/Y Sep | 6.50% | 6.30% | ||
| 14:30 | USD | Natural Gas Storage | 126B | 129B | ||
| 15:00 | USD | Crude Oil Inventories | 0.9M | -1.4M |
Fed Bowman: Sizable hike on the table if inflation not moving down
Fed Governor Michelle Bowman said a speech, "if we do not see signs that inflation is moving down, my view continues to be that sizable increases in the target range for the federal funds rate should remain on the table."
Nevertheless, "if inflation starts to decline, I believe a slower pace of rate increases would be appropriate." Even so, "to bring inflation down in a consistent and lasting way, the federal funds rate will need to move up to a restrictive level and remain there for some time."
"However, it is not yet clear how high we will need to raise the federal funds rate and how much time will pass before we begin to see inflation moving back down in a consistent and lasting way," she added.
FOMC minutes: Many emphasized cost of doing too little
In the minutes of September 20-21 FOMC meeting, it's noted that with "broad-based and unacceptably high level of inflation" and the "upside risks", participants remarked that "purposefully moving to a restrictive policy stance in the near term was consistent with risk-management considerations".
Further than that, "many participants emphasized that the cost of taking too little action to bring down inflation likely outweighed the cost of taking too much action."
Also, "several participants underlined the need to maintain a restrictive stance for as long as necessary".