Sample Category Title
AUDUSD Wave Analysis
- AUDUSD broke key support level 0.6700
- Likely to fall to support level 0.6600
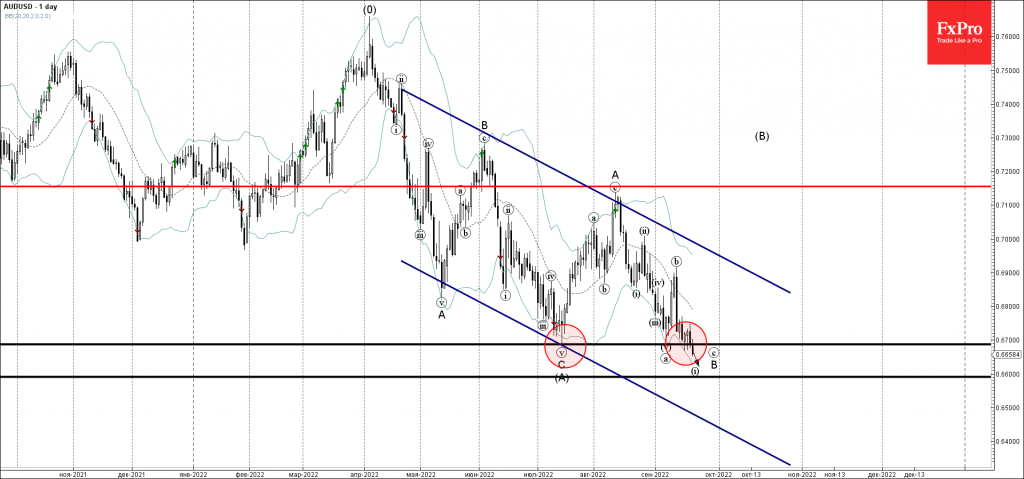
AUDUSD currency pair recently broke the key support level 0.6700 (previous monthly low from July, which also reversed the pair earlier this month).
The breakout of the support level 0.6700 continues the (c)-wave of the intermediate B-wave from the start of last month.
Given the clear daily downtrend, AUDUSD can be expected to fall further toward the next support level 0.6600 (target for the completion of the active sub-impulse wave (i)).
NZDUSD Slides Below 0.5920 as Bears Stay in Charge
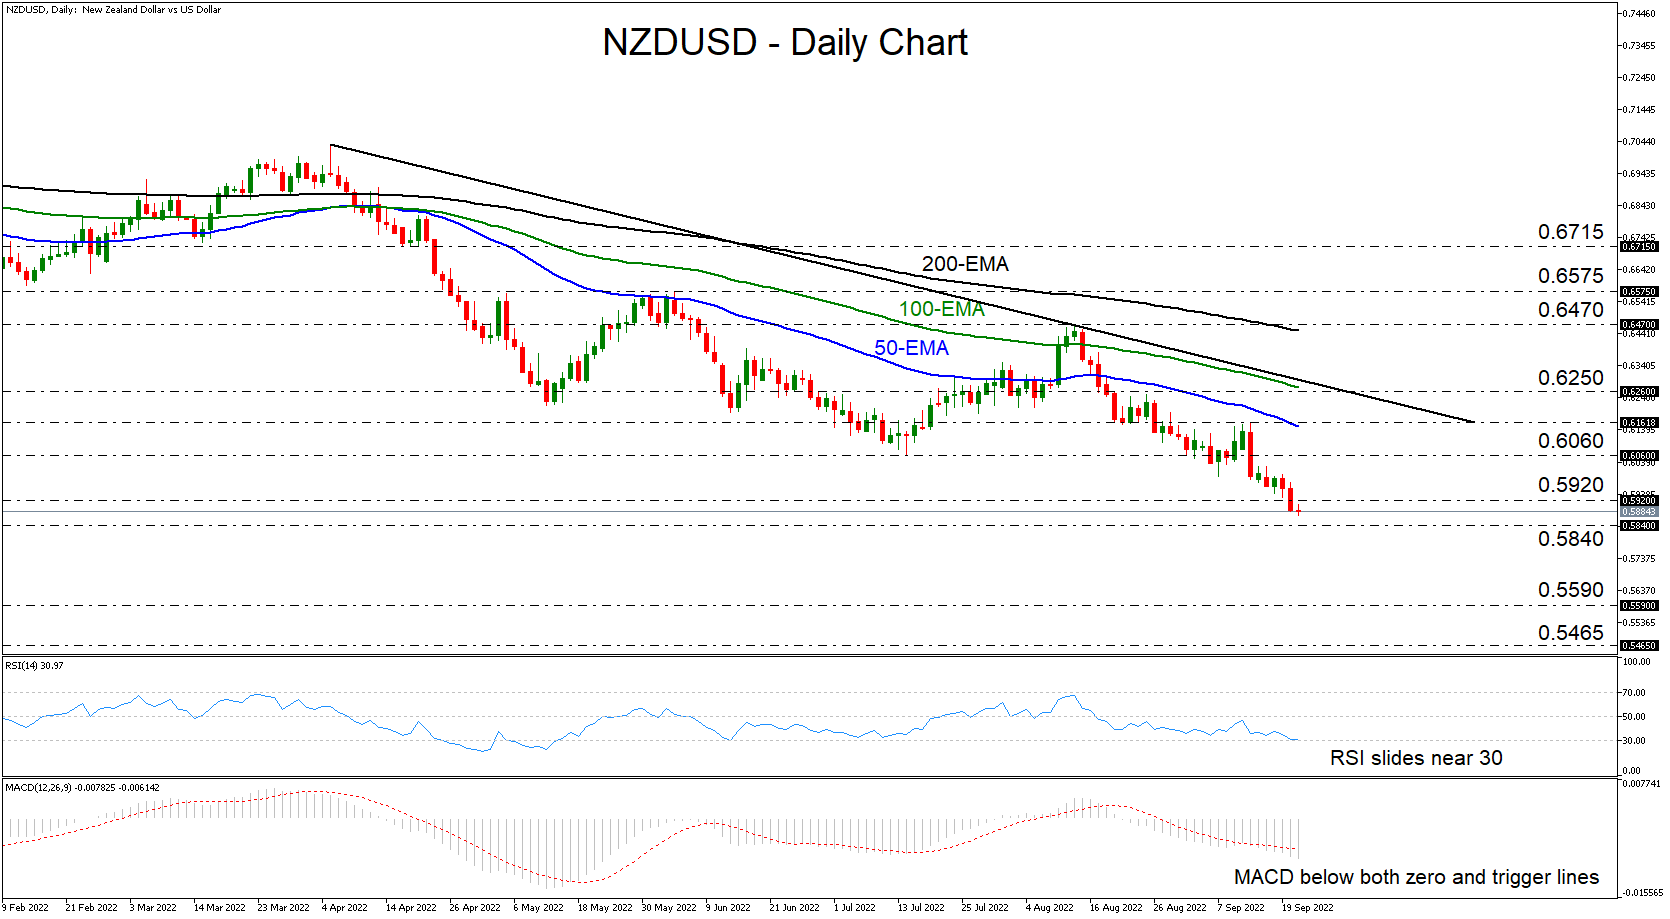
NZDUSD slipped below 0.5920 yesterday, a level marked as a support by the low of May 15, 2020. Overall, the pair continues to trade below a tentative downside resistance line drawn from the high of April 5, as well as below all the plotted moving averages. Therefore, the support breach in the direction of the prevailing trend implies that more declines may be in the works for the foreseeable future.
The RSI and the MACD add credence to the narrative, with the former sliding and touching its 30 line, and the latter running below both its zero and trigger lines. Both are detecting strong downside speed.
With the bears in the driver’s seat, the next level to be challenged may be at 0.5840, marked by the low of April 3, 2020. A break lower could darken the picture even more and perhaps pave the way towards the low of March 23, 2020. If the bears are not willing to surrender there either, then they could dive towards the low of March 19 of that year, at around 0.5465.
The bulls could start feeling confident upon a break above 0.6250 as such a move may verify the break above the aforementioned downside line. If indeed this happens, they may climb towards the 200-exponential moving average or the 0.6470 obstacle, marked by the high of August 12. Slightly higher lies another resistance at 0.6575, the break of which may extend the advance towards the 0.6715 area, defined by the inside swing lows of April 18, 19, and 20.
Recapitulating, NZDUSD extended its bearish trend yesterday, by breaking below the support of 0.5920. With all the technical signs and indicators pointing to a downtrend, it seems that lower levels could be met very soon.
ETHUSD Plummets Despite Successful Merge
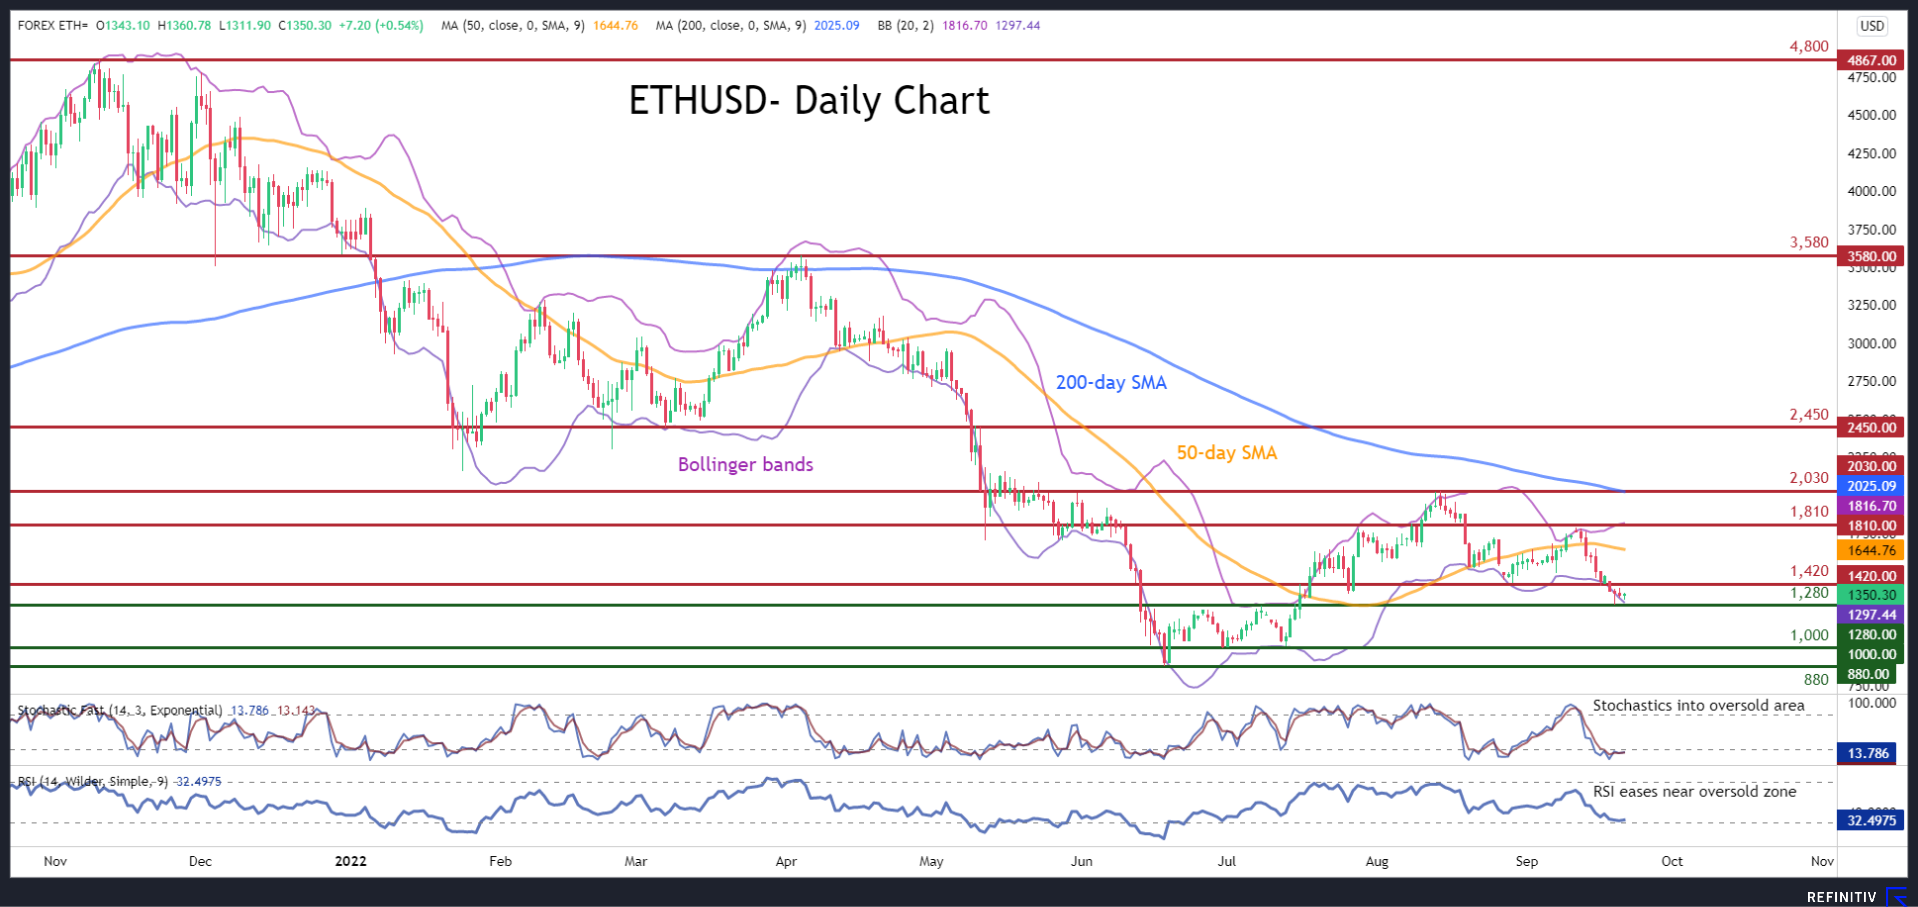
ETHUSD (Ethereum) has been trending upwards since mid-June when its long-term decline ceased at the 2022 low of 880. Nevertheless, the cryptocurrency is experiencing a pullback in the last few daily sessions, even if its latest upgrade called ‘Merge’ was completed without any software downtime or complications last Wednesday.
The momentum indicators have reached their oversold levels, endorsing the likelihood of a rebound. Specifically, the stochastic oscillator is flatlining within the 20- oversold area, while the RSI has hugged the 30-oversold mark.
Should selling pressures persist, the price could decline towards its recent low of 1,280, which overlaps with the lower Bollinger band. If that floor collapses, the spotlight may turn to the crucial 1,000 psychological mark. Even lower, any further retreats could come to a halt at the 2022 low of 880.
On the flipside, if negative momentum fades and the price drifts higher, the recent support zone of 1,420 could act as the first line of defence. Conquering this barricade, the bulls might aim for the recent peak of 1,810 before the trend reversal point of 2,030 comes under examination. A break above the latter may open the door for the 2,450 resistance region.
In brief, despite its latest positive developments Ethereum is exhibiting signs of broader weakness in the near-term. For that bearish sentiment to change, the price needs to initially jump above the 1,810 ceiling.
Pound Falls to New 37-year Low, Fed Looms
The British pound continues to lose ground. GBP/USD is trading at 1.3436. down 0.33%. Earlier in the day, the pound fell to 1.1304, its lowest level since 1985.
Fed expected to hike by 0.75%
The Federal Reserve holds its policy meeting later today, and is expected to deliver a third straight rate hike of 0.75%, which would bring the benchmark rate to 3.25%. Such a move would have added significance as it would raise the benchmark rate into restrictive territory, above the neutral rate level of 2.5%. This means that the Fed would have to be especially careful with future rate hikes. The markets have priced in a 0.75% increase, but there is a 15% chance of a massive full-point hike, which underscores that the markets have internalized that the Fed remains very hawkish.
Today’s FOMC meeting is about more than the size of the next rate hike. Investors will be keenly monitoring the Fed’s most recent forecasts for inflation, unemployment and interest rate levels. The Fed has designated inflation as public enemy number one, and views increases in unemployment and interest rates as painful but necessary in order to curb inflation.
The BoE will meet on Thursday, after its meeting was delayed to the mourning period for Queen Elizabeth. The markets have priced in a 50bp increase, although a 75bp hike, which last occurred in 1989, is also a possibility. Inflation remains red-hot at 9.9%, and a 75bp move would not only help in the battle against inflation, but will restore the BoE’s credibility, as the Bank has been widely criticised for its handling of inflation.
GBP/USD Technical
- GBP/USD faces resistance at 1.1384 and 1.1504
- There is support at 1.1269 and 1.144
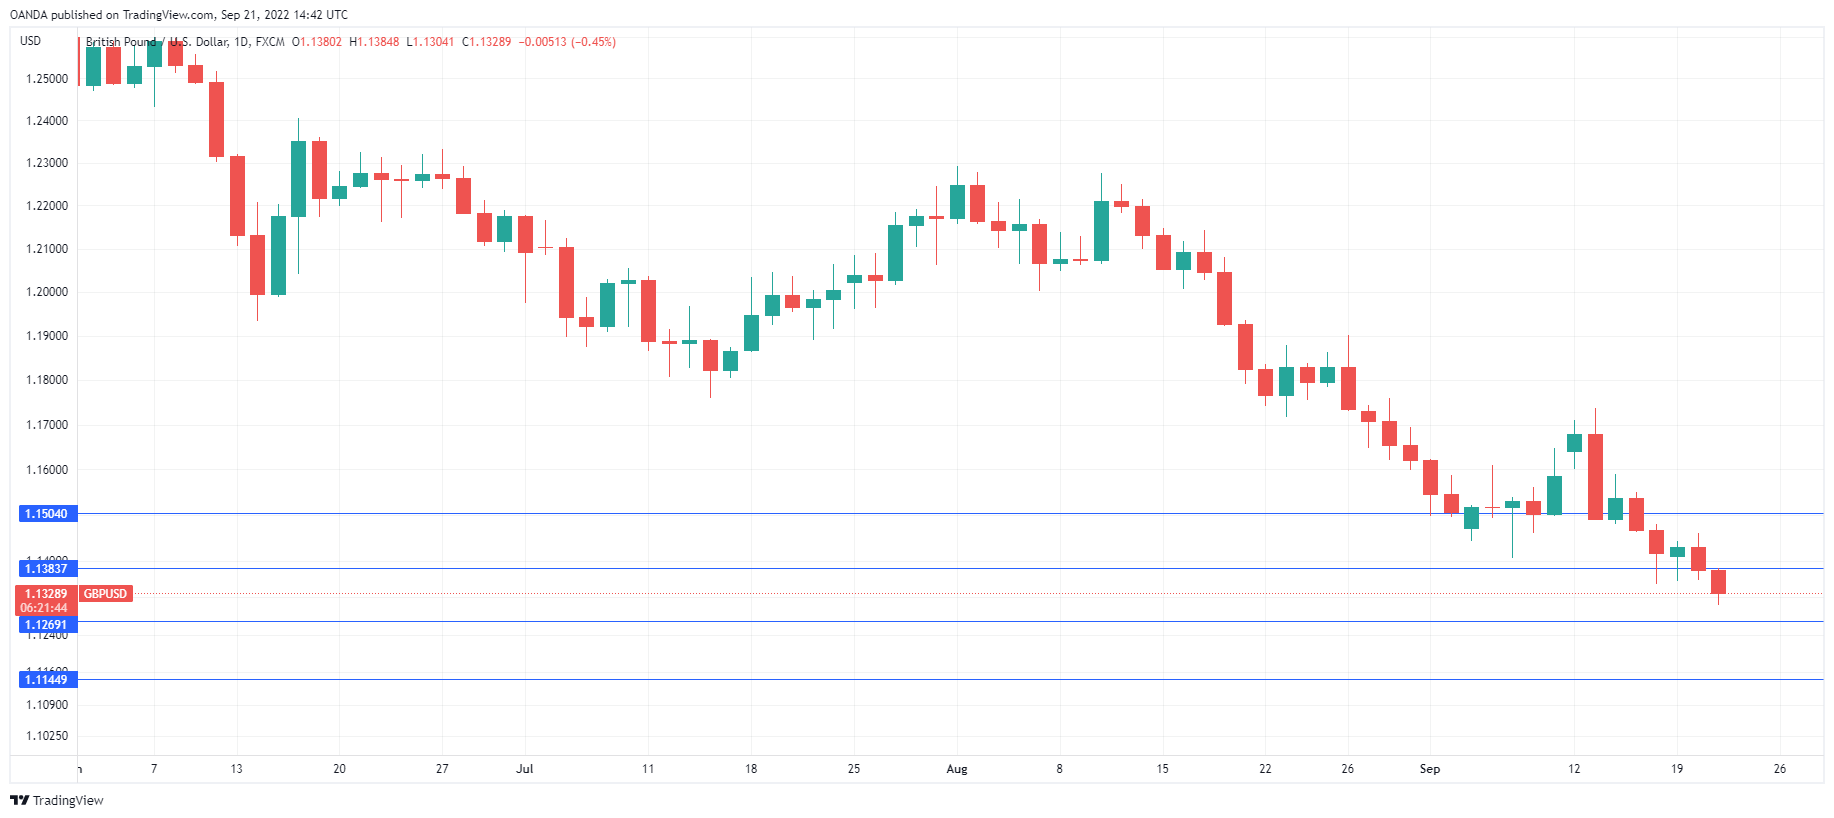
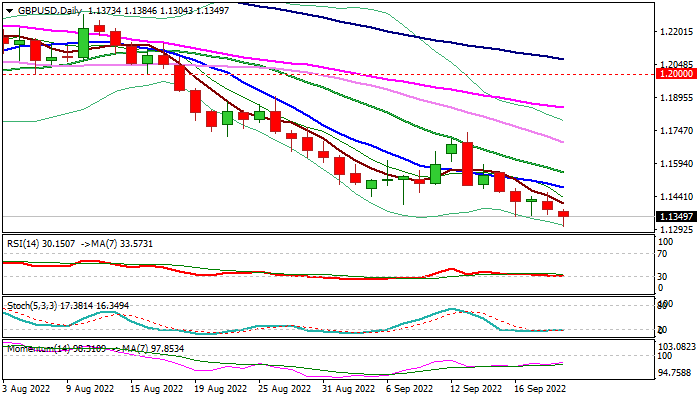
GBP/USD: Cable Hits New 37-year Low, as Russia Rattles the Markets, Focus Turns to Fed
Cable hit new 37-year low on Wednesday after an announcement from Russia and tough rhetoric threatened of further escalation and send a shockwaves through the markets.
Fresh exodus into safety lifted dollar and added to pound’s existing bearish stance, with strong bearish signal generating on break through pandemic low (1.1410), though confirmation still needs weekly close below this level, while monthly close below will reinforce the signal.
Technical studies are bearish on daily and weekly chart but oversold on both timeframes, suggesting that bears may face headwinds.
Wide expectations for Fed’s 0.75% hike would add pressure to pound, while markets look for more details about the central bank’s next steps, regarding the size and pace of further rate hikes that would strongly influence the sentiment.
Fibonacci projections at 1.1278 and 1.1200 mark next targets which guard psychological 1.1000 level.
Former lows at 1.1405 (Sep 7 and 1.1410 (Mar 2020) reverted to immediate resistance, with falling 10DMA (1.1483) expected to cap and keep bears intact.
Res: 1.1410; 1.1460; 1.1483; 1.1532.
Sup: 1.1304; 1.1278; 1.1200; 1.1150.
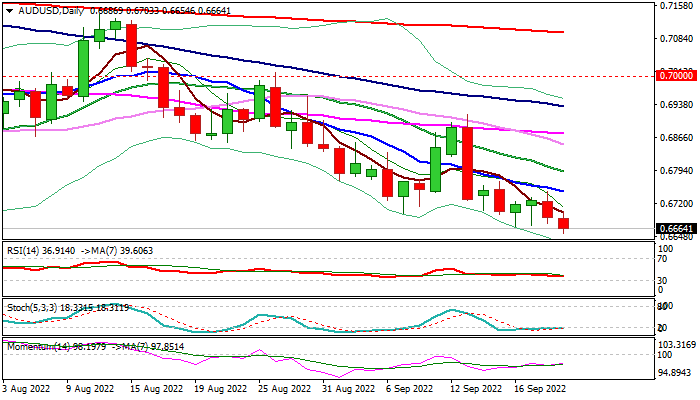
AUD/USD: Aussie Stands at the Back Foot on Risk Aversion and Expectations for Aggressive Fed
Aussie stands at the back foot on risk aversion and expectations for aggressive Fed Aussies falls to the lowest since June 2020 on Wednesday, under fresh pressure from stronger dollar as geopolitical situation is worsening and traders migrate into safety and lower prices of commodities.
Daily techs maintain negative momentum and moving averages are if full bearish setup, underpinning negative stance.
All eyes are on Fed, with widely expected 75 basis points hike to maintain dollar’s strength, but more hawkish than expected central bank’s stance would accelerate larger bears through June 2020 low at 0.6647 and risk extension towards 0.6463 (Fibo 61.8% of 0.5509/0.8007 rally).
Res: 0.6700; 0.6746; 0.6770; 0.6790.
Sup: 0.6654; 0.6616; 0.6465; 0.6463.
Sunset Market Commentary
Markets:
The presumed calm of the countdown to this evening’s Fed decision was abruptly unsettled by a speech of Russian president Vladimir Putin around the start of European dealings. Putin announced a ‘partial mobilization’ of reservists. He also said that ‘If the territorial integrity of our country is threatened, we will use all available means to protect our people’ which only can be seen as an escalation of the military rhetoric. The headlines (temporary) caused a different risk-off compared to what happened of late. The Dutch reference gas contract returned north of € 200 Mwh. Brent oil also jumped from the $90/b area to $93/b. German Bunds temporary enjoyed a safe haven bid with yields easing up to 10 bps. However, yield declines in the swap market were much more limited and both German and European yields gradually reversed a big part of the initial losses. Currently, the German 2-y yield even trades higher again (+3.5 bps). Bonds at longer maturities still preserve some safe haven gains (30-y -6 bps). With the 2-y swap setting a new cycle top at 2.75% (+7 bps), markets concluded that this escalation doesn’t ease the inflationary risks the ECB has to cope with. The dollar again was the main beneficiary from growing geopolitical and economic uncertainty in Europe. EUR/USD (currently 0.991) slipped (temporary?) below 0.99, but the 0.9864 correction low for now survived. DXY set a minor correction top (110.86). USD/JPY (144.05) nears the key 145 reference. For US investors/markets, the focus remains on this evening’s Fed meeting. Contrary to the previous days, US bond markets shifted into wait-and-see modus. Yields are easing marginally (2-y -1bp, 30-y -3 bps). US equities gain marginal ground after the open (S&P +0.50%), but this for sure isn’t a short-covering move of a market that feels pressured to reduce established bearish bets. Sterling is in slightly better shape. The UK government announcing a new fiscal package to cap energy costs for businesses (cf infra), apparently makes markets tilt to a growing chance of the BoE joining the club of 75 bps hikes tomorrow. Sterling slightly outperforms the euro (EUR/GBP 0.8735). Still, the UK currency touched a new 37-year low against the dollar (currently 1.134). Rising tensions on Ukraine understandably also weighed in CE currencies with the Czech krona (EUR/CZK 24.64), the forint (EUR/HUF 404.5) and the zloty (EUR/PLN 4.75) all fighting an uphill battle. • At 20:00 CET the Fed will announce its policy decision with Powell’s press address at 20:30 CET. A 75 basis points rate hike is fully discounted with markets seeing about a 1 in 4 chance for a 1.0% step. The new dot plot summarizing expectations from the individual governors probably is at least as important as the size rate move. Quid on the governors’ expected inflation path? Quid on the new anticipated rate path? Quid on the long term neutral policy rate? At the June dots, Fed governors on average saw the Fed fund rate at 3.4% end this year and peaking near 3.8% next year. Markets currently already discount a rate peak near 4.5% in Q1 next year. Will Fed governors even exceed market pricing? A reassessment of the neutral rate ( 2.5% in June), also could change the reference on how tight policy is. Markets expect a hawkish Fed. Powell and Co probably will bring a hawkish message. Even so, for now we don’t expect a sustained buy-on the rumour, sell-the-fact profit taking move on the recent yield rally.
News Headlines:
The UK government unveiled its Energy Bill Relief Scheme, aimed to help businesses and other non-domestic customers. The government will cap electricity prices at 21.1 pence/Kwh and at 7.5 pence for gas. That’s around 50% discount for the coming six months. Afterwards, a review will decide whether additional support is needed and for which sectors. The package is estimated to cost £40bn. Businesses that have signed fixed energy contracts since April 1 will have their rates retroactively discounted. The EBRS is different from the government’s Energy Price Guarantee for households which could costs as much as £130bn.
EUR/USD Mid-Day Outlook
Daily Pivots: (S1) 0.9933; (P) 0.9992; (R1) 1.0029; More...
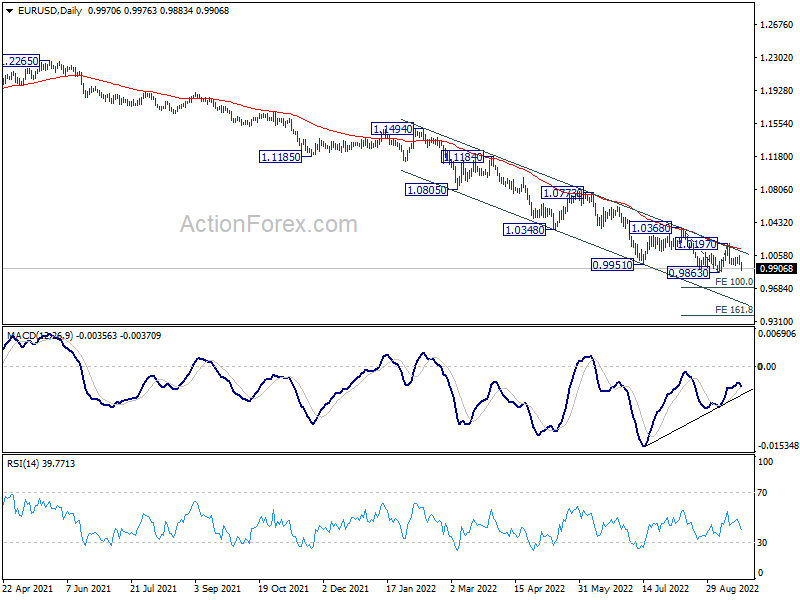
Intraday bias in EUR/USD remains neutral first and outlook stays bearish. On the downside, firm break of 0.9863 support will resume larger down trend. Next target is 100% projection of 1.0368 to 0.9863 from 1.0197 at 0.9296. On the upside, break of 1.0197 resistance will now raise the chance of larger trend reversal, and target 1.0368 resistance.
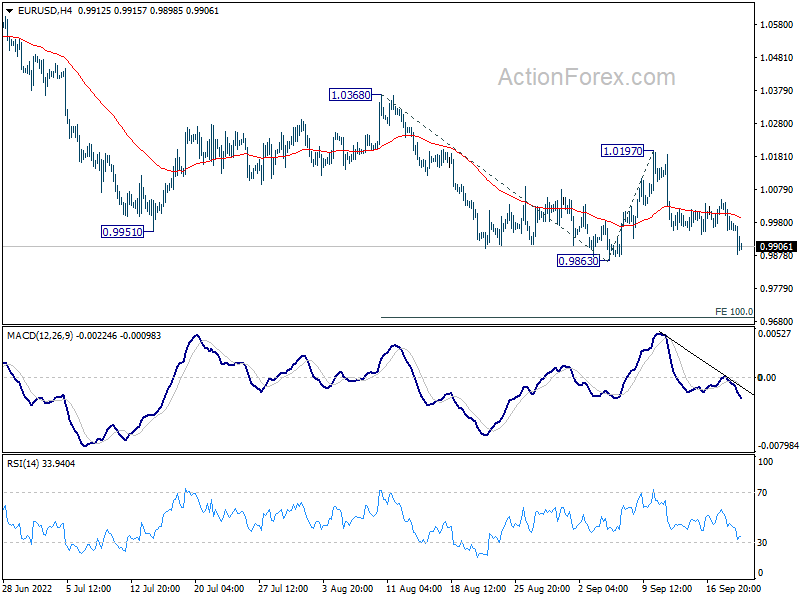
In the bigger picture, down trend from 1.6039 (2008 high) is still in progress. Next target is 100% projection of 1.3993 to 1.0339 from 1.2348 at 0.8694. In any case, outlook will stay bearish as long as 1.0368 resistance holds, in case of strong rebound.
GBP/USD Mid-Day Outlook
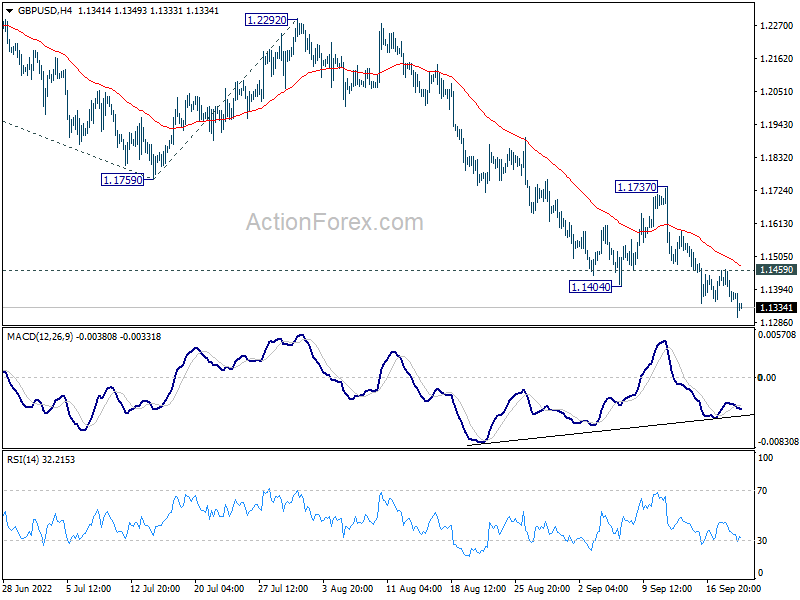
Daily Pivots: (S1) 1.1338; (P) 1.1400; (R1) 1.1442; More...
Intraday bias in GBP/USD remains on the downside for the moment. Current fall should now target 61.8% projection of 1.3748 to 1.1759 from 1.2292 at 1.1063 next. On the upside, above 1.1459 minor resistance will turn intraday bias neutral first. But outlook will stay bearish as long as 1.1737 resistance holds, in case of recovery.
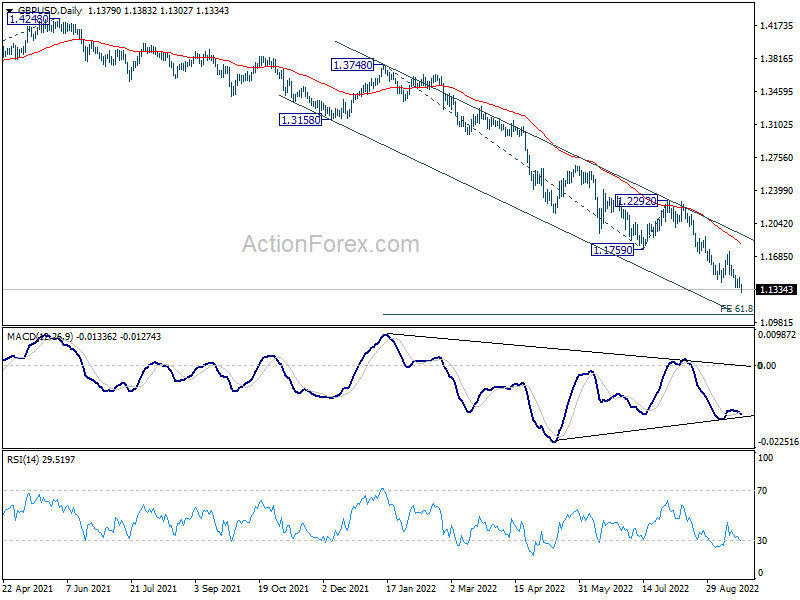
In the bigger picture, based on current momentum, fall from 1.4248 (2018 high) is probably resuming long term down trend from 2.1161 (2007 high). Sustained break of 1.1409 will target 61.8% projection of 1.7190 (2014 high) to 1.1409 (2020 low) from 1.4248 (2021 high) at 1.0675. This will remain the favored case for now as long as 1.2292 resistance holds.
USD/CHF Mid-Day Outlook
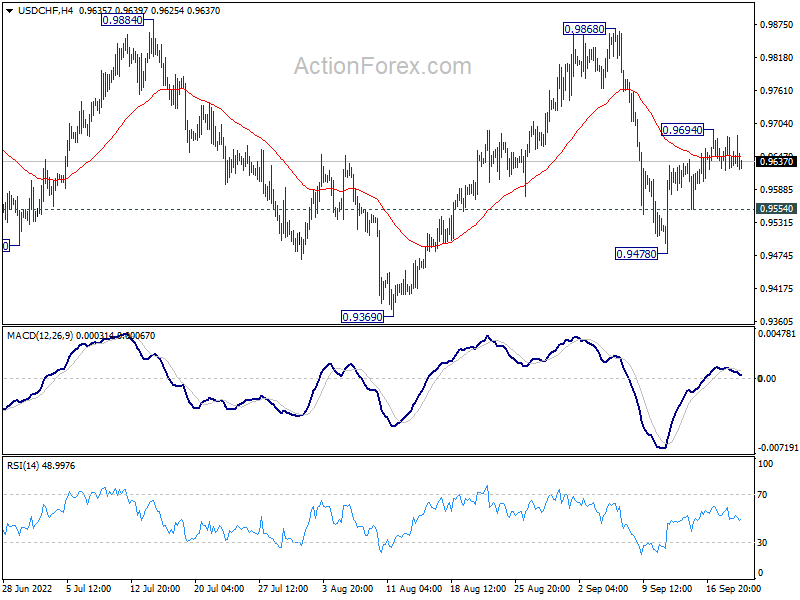
Daily Pivots: (S1) 0.9616; (P) 0.9649; (R1) 0.9675; More
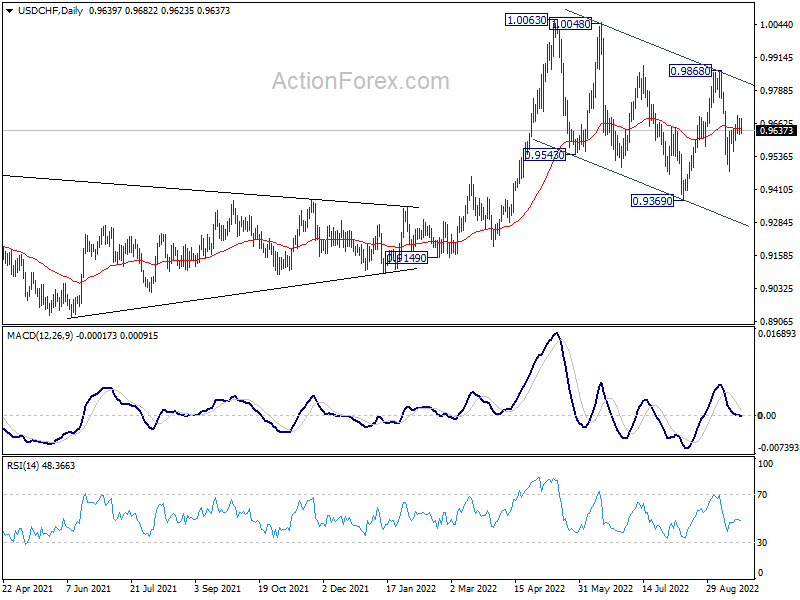
Intraday bias in USD/CHF is turned neutral first. But rebound from 0.9478 is in favor to continue with 0.9554 minor support intact. Above 0.9694 will target 0.9868 resistance. Break there will argue that larger up trend is ready to resume through 1.0063. Overall, the corrective pattern from 1.0063 high could still extend. Below 0.9554 minor support will turn bias back to the downside for 0.9478 and below.
In the bigger picture, current development suggests that up trend from 0.8756 (2021 low) is still in progress. Sustained break of 1.0063 will target 100% projection of 0.9149 to 1.0063 from 0.9369 at 1.0283, and then 1.0342 (2016 high). For now, this will remain the favored case as long as 0.9369 support holds, even in case of deep pull back.